Human MutationRESEARCH ARTICLE
Lipoprotein Lipase Variants Associated With anEndophenotype of Hypertension: Hypertension CombinedWith Elevated Triglycerides
Pei Chen,1 Yuh-Shan Jou,1 Cathy SJ Fann,1 Jaw-Wen Chen,2 Chia-Min Chung,1 Chin-Yu Lin,1 Sheng-Yeu Wu,1
Mei-Jyh Kang,1 Ying-Chuang Chen,1 Yuh-Shiun Jong,3 Huey-Ming Lo,3 Chih-Sen Kang,4 Chien-Chung Chen,5
Huan-Cheng Chang,5 Nai-Kuei Huang,6 Yi-Lin Wu,1 and Wen-Harn Pan1�
1Institute of Biomedical Sciences, Academia Sinica, Taipei, Taiwan2Department of Cardiology, Taipei Veterans General Hospital, and Cardiovascular Research Center, National Yang-Ming University, Taipei,
Taiwan3Department of Cardiology, Tao-Yuan General Hospital Department of Health, Taiwan4Department of Cardiology, Min-Sheng Hospital, Taoyuan, Taiwan5Department of Cardiology, Li Shin Hospital, Taoyuan, Taiwan6National Research Institute of Chinese Medicine, Taipei, Taiwan
Communicated by Stephen ChanockReceived 16 October 2007; accepted revised manuscript 3 April 2008.
Published online 22 July 2008 in Wiley InterScience (www.interscience.wiley.com). DOI 10.1002/humu.20812
ABSTRACT: Previously, we observed that young-onsethypertension was independently associated with elevatedplasma triglyceride(s) (TG) levels to a greater extent thanother metabolic risk factors. Thus, focusing on theendophenotype—hypertension combined with elevatedTG—we designed a family-based haplotype associationstudy to explore its genetic connection with novel geneticvariants of lipoprotein lipase gene (LPL), which encodesa major lipid metabolizing enzyme. Young-onset hyper-tension probands and their families were recruited,numbering 1,002 individuals from 345 families. Single-nucleotide polymorphism discovery for LPL, linkagedisequilibrium (LD) analysis, transmission disequili-brium tests (TDT), bin construction, haplotype TDTassociation and logistic regression analysis were per-formed. We found that the CC- haplotype (i) spanningfrom intron 2 to intron 4 and the ACATT haplotype (ii)spanning from intron 5 to intron 6 were significantlyassociated with hypertension-related phenotypes: hyper-tension (ii, P 5 0.05), elevated TG (i, P 5 0.01), andhypertension combined with elevated TG (i, P 5 0.001;ii, Po0.0001), according to TDT. The risk of thishypertension subtype increased with the number of riskhaplotypes in the two loci, using logistic regression modelafter adjusting within-family correlation. The relation-ships between LPL variants and hypertension-relateddisorders were also confirmed by an independentassociation study. Finally, we showed a trend thatindividuals with homozygous risk haplotypes had de-creased LPL expression after a fatty meal, as opposed to
those with protective haplotypes. In conclusion, thisstudy strongly suggests that two LPL intronic variantsmay be associated with development of the hypertensionendophenotype with elevated TG.Hum Mutat 30, 49–55, 2009.& 2008 Wiley-Liss, Inc.
KEY WORDS: young-onset hypertension; endopheno-type; LPL; linkage disequilibrium; haplotype
Introduction
Hypertension is a multifactorial and polygenic trait with complexdisease etiology arising from a combination of genetic andenvironmental factors [Lee et al., 2000; Lalouel, 2003] Genemapping for such complex traits has elucidated several loci andsusceptibility genes. However, the contribution of each susceptibilitygene to the overall risk is small to moderate and most findings havenot been replicated [Sillanpaa and Auranen, 2004]. One of thereasons for this lack of reproducibility is the heterogeneous nature ofthese multifactorial diseases. It is likely that different subsets of genesinfluence phenotypic variation in different subgroups of the samepopulation [Pan et al., 2006b]. It may be possible to detect suchgenes if they have major effects on homogeneous internal features ofthe disease phenotype, called endophenotypes. Therefore, well-chosen endophenotypes may help to reveal the genes that impartsusceptibility to disease development.
In studies of patients with familial combined hyperlipidemiaand familial hypertriglyceridemia, hypertension was more fre-quently observed than in the general population [Hopkins et al.,2003]. In addition, plasma triglyceride(s) (TG) levels correlatewith blood pressure (BP) values, whereas hypertriglyceridemiaoccurs more often than expected in patients with hypertension[Shieh et al., 1987; Williams et al., 1988; Pan et al., 1994; Chenet al., 2004]. Lipoprotein lipase (LPL; MIM] 609708) is a keyenzyme involved in the metabolism of TG-rich particles that leads
OFFICIAL JOURNAL
www.hgvs.org
& 2008 WILEY-LISS, INC.
The Supplementary Material referred to in this article can be accessed at http://
www.interscience.wiley.com/jpages/1059-7794/suppmat.�Correspondence to: Wen-Harn Pan, PhD, Research Fellow, Institute of
Biomedical Sciences, Academia Sinica, 128 Academia Rd. Sec.2, Nankang, Taipei,
11529, Taiwan, R.O.C. E-mail: [email protected]
to the release of free fatty acid into the circulation. Our previousreport [Pan et al., 2000], using the affected sibling-pair method,demonstrated a positive signal linking an LPL marker (D8S1145,P 5 0.028) with young-onset hypertension, which was laterconfirmed by further fine mapping linkage study and associationstudy [Chen et al., 2005]. Linkage between a quantitative traitlocus of systolic BP and short tandem repeat polymorphism(STRP) markers near the LPL gene was also reported in diabeticfamilies in Taiwan [Wu et al., 1996]. Another series of report[Yang et al., 2003, 2004, 2005] in China confirmed these linkageand association findings between LPL and hypertension in 148Han Chinese hypertensive families. The connection between LPLgenetic variants and hypertension may underscore the importanceof TG metabolism in the development of hypertension.
Our previous association study [Chen et al., 2005] found that ahaplotype constructed from two known coding single-nucleotidepolymorphisms (cSNPs) of LPL in exons 8 and 9 was onlymoderately associated with elevated TG and with hypertensionand elevated TG combined. It is possible that there are other LPLvariants that influence TG metabolism and contribute to thedevelopment of hypertension. In order to tackle this question, weidentified single-nucleotide polymorphisms (SNPs) in the LPLgene, and performed high-resolution mapping for an endophe-notype of hypertension—hypertension combined with elevatedTG—in a young-onset hypertension genetic study.
Materials and Methods
Subjects and Phenotype Definitions
Family-based association study
Young hypertension probands were identified from fourcommunity hospitals located in northwest Taiwan. For eachidentified proband, family members were invited for a BPscreening and a health checkup. A total of 1,002 family membersof 345 pedigrees were recruited. Among these, 384 trios (a singleproband and two parents) of young-onset hypertension were usedfor the family-based association test. The Human InvestigationCommittee of the Institute of Biomedical Sciences, AcademiaSinica approved the protocol.
Hypertension was diagnosed if any of the following criteria wasmet: 1) resting systolic BP (SBP)Z140 mmHg; 2) diastolic BP(DBP)Z90 mmHg; or 3) on antihypertensive medication [Pan et al.,2000]. Those hypertensive patients firstly diagnosed under 40 yearswere defined as ‘‘young-onset’’ cases. Two more subphenotypes wereused in this study: elevated TG defined by fasting plasma TGlevelZ150 mg/dl, and hypertension combined with elevated TG.
Replication study with case-control design
A population-based replication study was conducted. A total of421 essential hypertension subjects less than 45 years old wereselected from a six-center collaborative study of young-onsethypertension. Age- and sex-matched 421 controls were selectedfrom The Han Chinese Cell and Genome Bank in Taiwan [Panet al., 2006a]. All subjects were genotyped with respect to tworepresentative SNPs of the LPL gene (described below).
Results from the family-based study indicated that LPLhaplotypes are associated with hypertension combined withelevated TG. Thus, we were interested in the traits related tohypertriglyceridemia, such as waist circumference and metabolicsyndrome. The definition from the Third Report of the National
Cholesterol Education Program on Adult Treatment Panel III(NCEP-ATP III) [NCEP Expert, 2002] was used. A person wasconsidered to have metabolic syndrome if at least three of thefollowing criteria were met: TGZ150 mg/dl, high-density lipo-protein cholesterol (HDL-C) o40 mg/dl for men and o50 mg/dlfor women, higher waist circumference (Z90 cm for men andZ80 cm for women), hypertension, and fasting glucose Z100 mg/dl (or if the individual was on antidiabetic treatment).
Discovery and Validation of SNPs in the LPL Gene
The LPL gene contains 10 exons and spans about 30 kb on theshort arm of chromosome 8. Exon 10 codes for the entire 30
untranslated region. In our previous work [Chen et al., 2005],571 bp of the LPL promoter region and exons 1–9 of the LPLcoding region was sequenced for 41 subjects who were amongyoung-onset hypertension families contributing most to thepositive nonparametric lod (NPL) score. Only two known cSNPs,a synonymous mutation (g.7663364C4A; rs316) in exon 8 and astop codon mutation S447X (g.7664652C4G; rs328) in exon 9(see Supplementary Table S1; available online at www.interscien-ce.wiley.com/jpages/1059-7794/suppmat), were revealed. The de-scription of sequence variants is based on gDNA. GenBankNT_030737.9 was used as reference sequence for numbering thenucleotide position from the beginning of the sequence. In orderto validate the identified intron SNPs (iSNPs) in a public database(www.ncbi.nlm.nih.gov/snp) and to discover new SNPs of LPL inthe Taiwanese, we sequenced introns 1–3 and the selected regionscontaining abundant SNPs in introns 4–8 [Nickerson et al., 1998],using DNA from 12 subjects (six young-onset hypertensionpatients and six age- and sex-matched normotensive subjects).
SNP Genotyping, Transmission Disequilibrium Tests, andBin Construction
A total of 72 newly-identified or validated SNPs (Supplemen-tary Table S1) were typed for 267 subjects from 66 families (57families from our previous linkage study [Pan et al., 2000] andnine families from this association study) using the MassARRAYSNP genotyping system (Sequenom, San Diego, CA). PCR wasperformed on a thermocycler (GeneAmp 9700; Perkin Elmer,Foster City, CA.) using 10 ng genomic DNA in a 20-ml reactionvolume. Extension of PCR products was performed with primersdesigned using the Spectro-Designer software (Sequenom).
To examine the association between hypertension-related traitsand LPL SNPs, transmission disequilibrium tests (TDT) usingsliding windows of four-SNP haplotypes were performed on 97trios from the 66 young-onset hypertension families mentionedabove. According to the results of the TDT, the regions with highassociation between LPL SNPs and hypertension-related traits weredefined as bins of LPL (see Results). Consequently, eight SNPs andone insertion/deletion marker in bins 1, 2, and 3 (as shown inFig. 1), were genotyped for all 1,002 subjects from 345 families ofyoung-onset hypertension for haplotype association tests.
High Fat Loading Trial for LPL Expression Measurement
To determine the functional effect of the LPL haplotypes, weperformed a trial on 20 homozygote subjects that either carriedrisk haplotypes or protective haplotypes of LPL. Thesesubjects consumed a meal with high fat (66% of calories fromlipids) [Hwu et al., 2002]. The postheparin serum from thesesubjects was then used to detect LPL expression by western blotanalysis. The blood samples were first prepared using an albumin/
50 HUMAN MUTATION, Vol. 30, No. 1, 49–55, 2009
IgG depletion kit (Qiagen, Valencia, CA) and followed by westernblot analysis. Equal volumes of samples were separated by 10% SDS-PAGE. The resolved proteins were then electroblotted ontoImmobilon PVDF membranes (Millipore, Bedford, MA). Mem-branes were blocked with 5% skim milk and then incubated withanti-LPL antibody (1:1,000; Progen, Heidelberg, Germany) over-night at 41C followed by incubation with anti-rabbit secondaryantibody conjugated with horseradish peroxidase (1:5,000) for 1 hrat room temperature. After washing, blots were processed forvisualization using an enhanced chemiluminescence system (Pierce,Rockford, IL). Blots were then exposed to Kodak XAR-5 film(Eastman Kodak Co., Rochester, NY) to obtain the fluorographicimages. The images were scanned and quantified by an imageanalyzer (GeneTools; Synoptics, Ltd., Cambridge, United Kingdom).
Statistical Analysis
A mixed model controlling for intrafamily correlation [Zegerand Liang, 1986] was used on clinical chemistry data, includingfasting plasma TG levels, to compare the phenotypic differencebetween individuals with young-onset hypertension and unaf-fected siblings.
To construct a linkage disequilibrium (LD) map for the LPLgene, the 44 identified SNPs with MAF Z0.05 were tested for LDusing the Haploview software [Barrett et al., 2005] according D0
statistics (definition of the statistics is provided in www.broad.mit.edu/mpg/haploview). The TRANSMIT program (version2.5.2, April 2000) was used to test for transmission disequilibriumof specific haplotypes to the affected offspring [Clayton and Jones,1999]. To address the issue of multiple affected trios from certainfamilies, 10,000 bootstraps were carried out in this analysis.Bonferroni adjustment was made for multiple comparisons.
To estimate the odds ratio for SNP haplotypes, and to predict therisk of hypertension and related phenotypes, the SIMWALKprogram (version 2.86, July 2003) was used to identify the SNPhaplotypes for each individual [Sobel and Lange, 1996]. The oddsratios of various SNP haplotypes were then estimated by thegeneralized estimating equation (GEE) method, allowing forintrafamily correlation [Zeger and Liang, 1986] using the GENMODprocedure in SAS (SAS 8.0, SAS Institute Inc., Cary, NC).
Results
Clinical Characteristics of Hypertension PatientsCompared to Control Subjects
A significant difference was found in fasting plasma TG levelsbetween siblings with and without young-onset hypertension(Supplementary Table S2). Similar findings were observed forother biochemical variables, including body mass index (BMI),fasting insulin, glucose, HDL-C, low-density lipoprotein choles-terol (LDL-C), and total cholesterol. Since some of the affectedsubjects were already on medications upon enrollment, meanvalues of SBP and DBP in affected siblings were under or on thecutoff points of hypertension. But they were still significantlyhigher than those of the siblings without hypertension.
SNPs Discovery and Bin Construction
We did not reveal cSNPs other than those previously identifiedin exon 8 and exon 9, 42 iSNPs with MAF larger than 0.05 werevalidated in our samples (Supplementary Table S1).
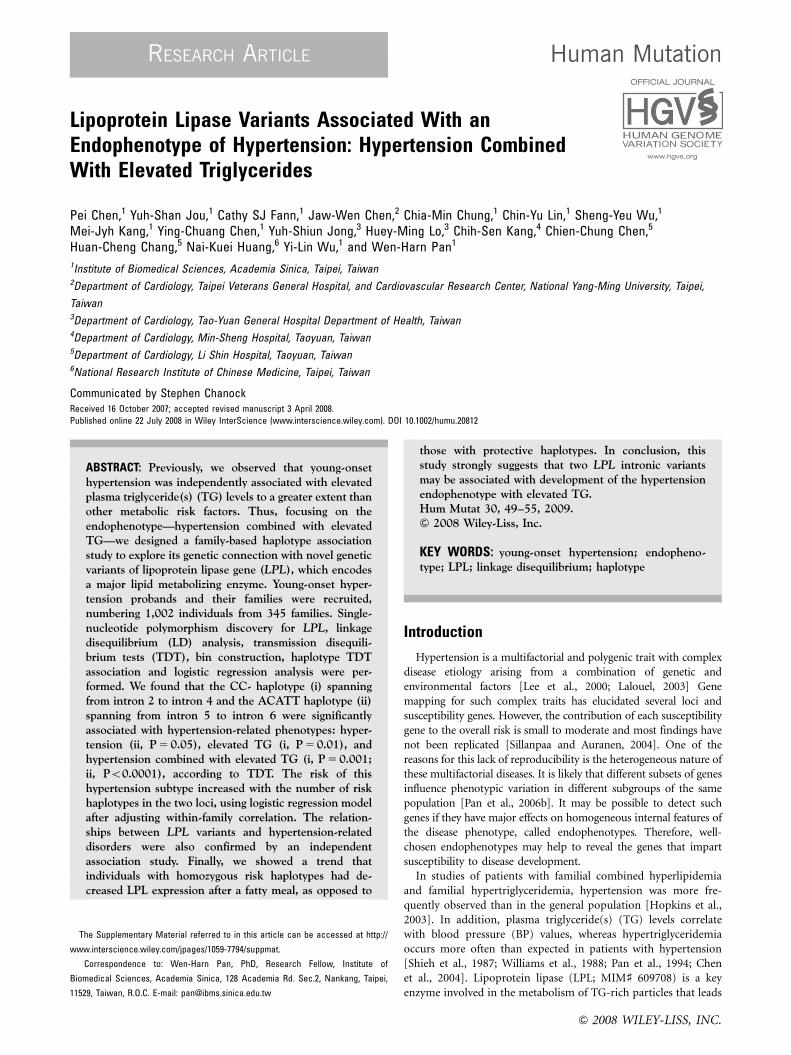
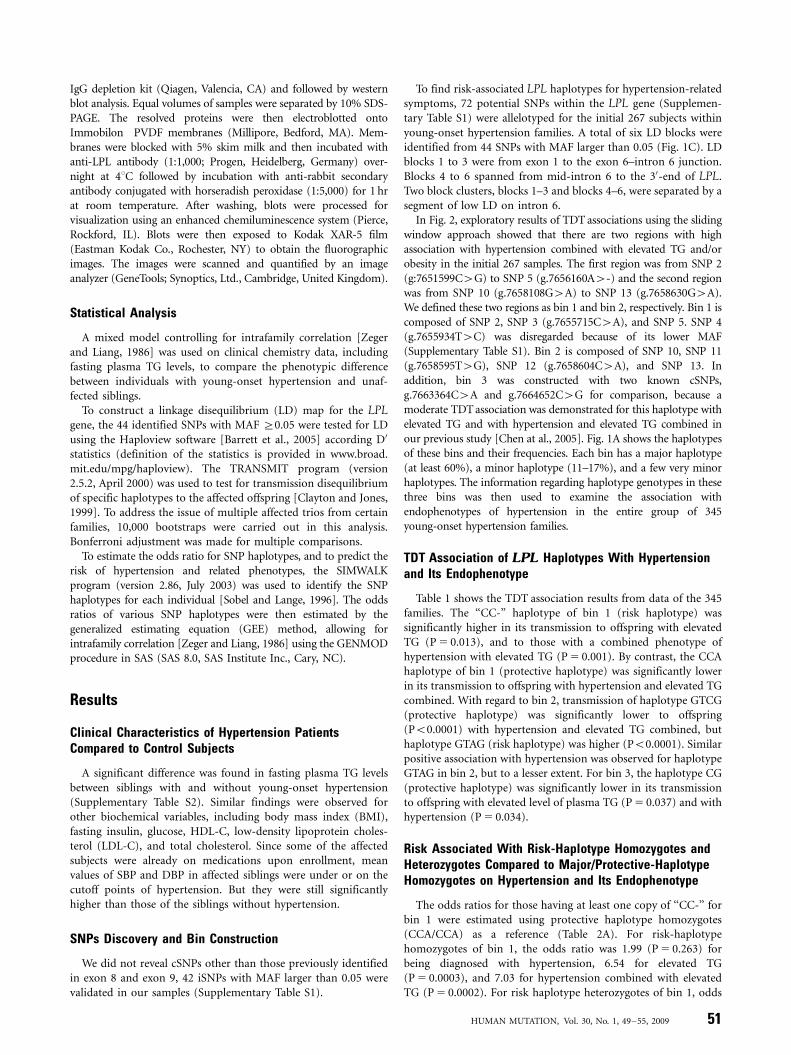
To find risk-associated LPL haplotypes for hypertension-relatedsymptoms, 72 potential SNPs within the LPL gene (Supplemen-tary Table S1) were allelotyped for the initial 267 subjects withinyoung-onset hypertension families. A total of six LD blocks wereidentified from 44 SNPs with MAF larger than 0.05 (Fig. 1C). LDblocks 1 to 3 were from exon 1 to the exon 6–intron 6 junction.Blocks 4 to 6 spanned from mid-intron 6 to the 30-end of LPL.Two block clusters, blocks 1–3 and blocks 4–6, were separated by asegment of low LD on intron 6.
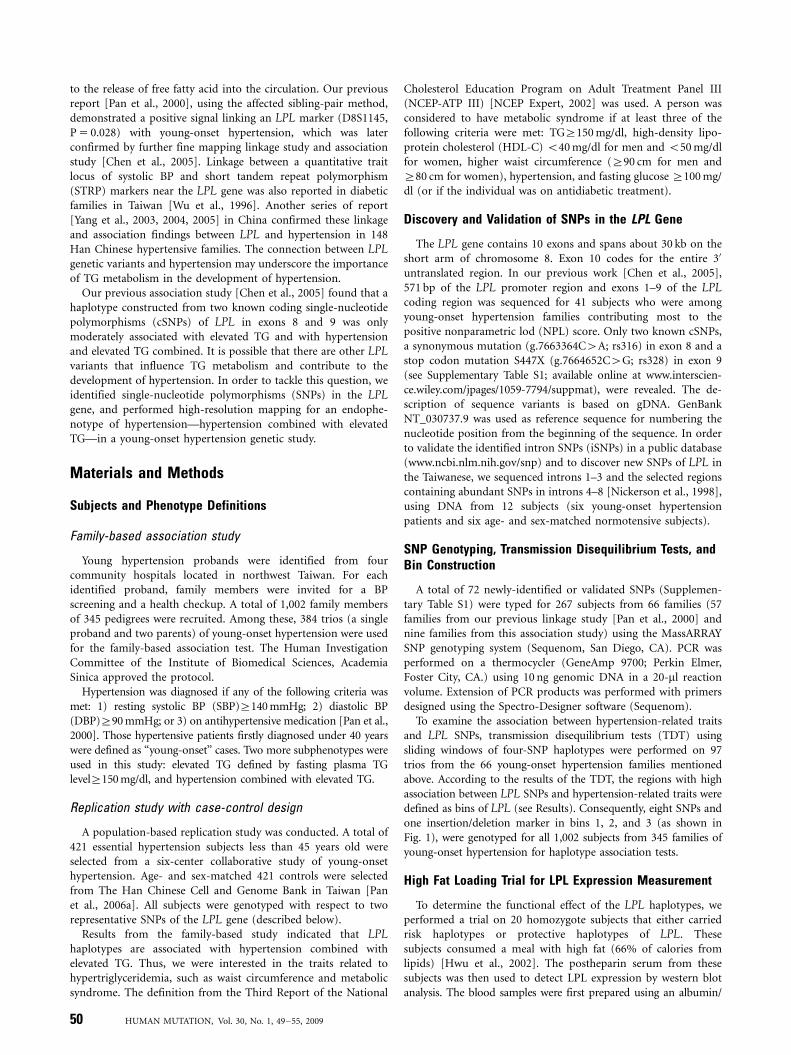
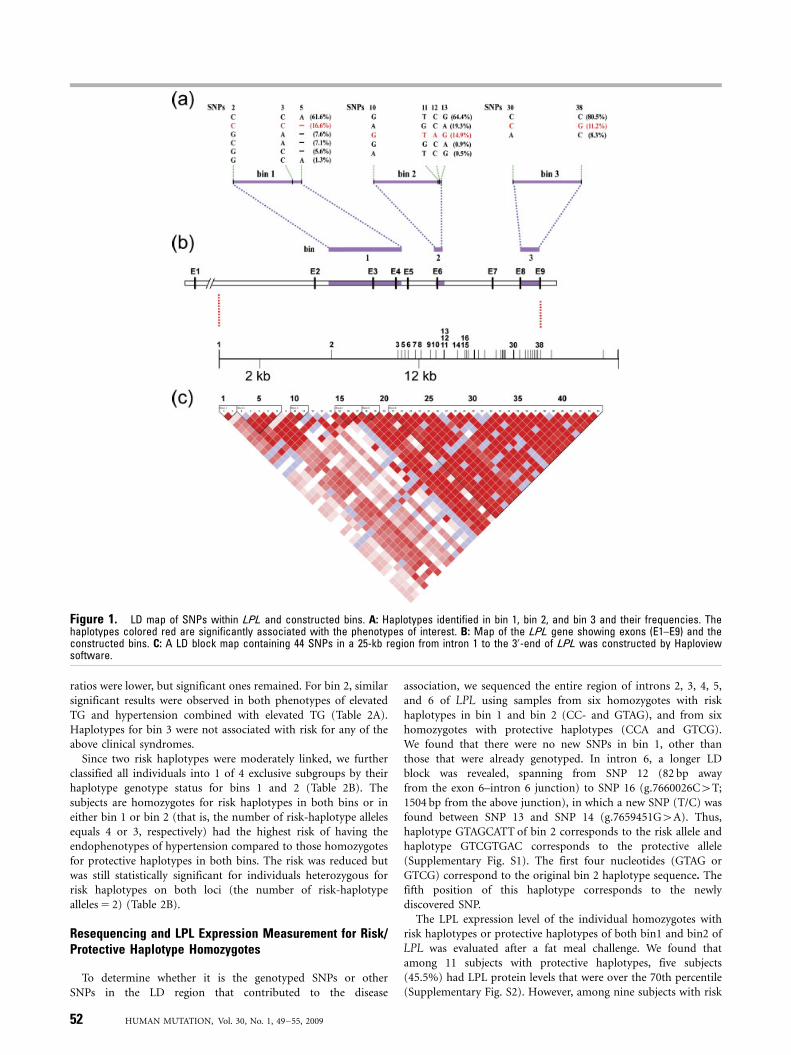
In Fig. 2, exploratory results of TDT associations using the slidingwindow approach showed that there are two regions with highassociation with hypertension combined with elevated TG and/orobesity in the initial 267 samples. The first region was from SNP 2(g:7651599C4G) to SNP 5 (g.7656160A4-) and the second regionwas from SNP 10 (g.7658108G4A) to SNP 13 (g.7658630G4A).We defined these two regions as bin 1 and bin 2, respectively. Bin 1 iscomposed of SNP 2, SNP 3 (g.7655715C4A), and SNP 5. SNP 4(g.7655934T4C) was disregarded because of its lower MAF(Supplementary Table S1). Bin 2 is composed of SNP 10, SNP 11(g.7658595T4G), SNP 12 (g.7658604C4A), and SNP 13. Inaddition, bin 3 was constructed with two known cSNPs,g.7663364C4A and g.7664652C4G for comparison, because amoderate TDT association was demonstrated for this haplotype withelevated TG and with hypertension and elevated TG combined inour previous study [Chen at al., 2005]. Fig. 1A shows the haplotypesof these bins and their frequencies. Each bin has a major haplotype(at least 60%), a minor haplotype (11–17%), and a few very minorhaplotypes. The information regarding haplotype genotypes in thesethree bins was then used to examine the association withendophenotypes of hypertension in the entire group of 345young-onset hypertension families.
TDT Association of LPL Haplotypes With Hypertensionand Its Endophenotype
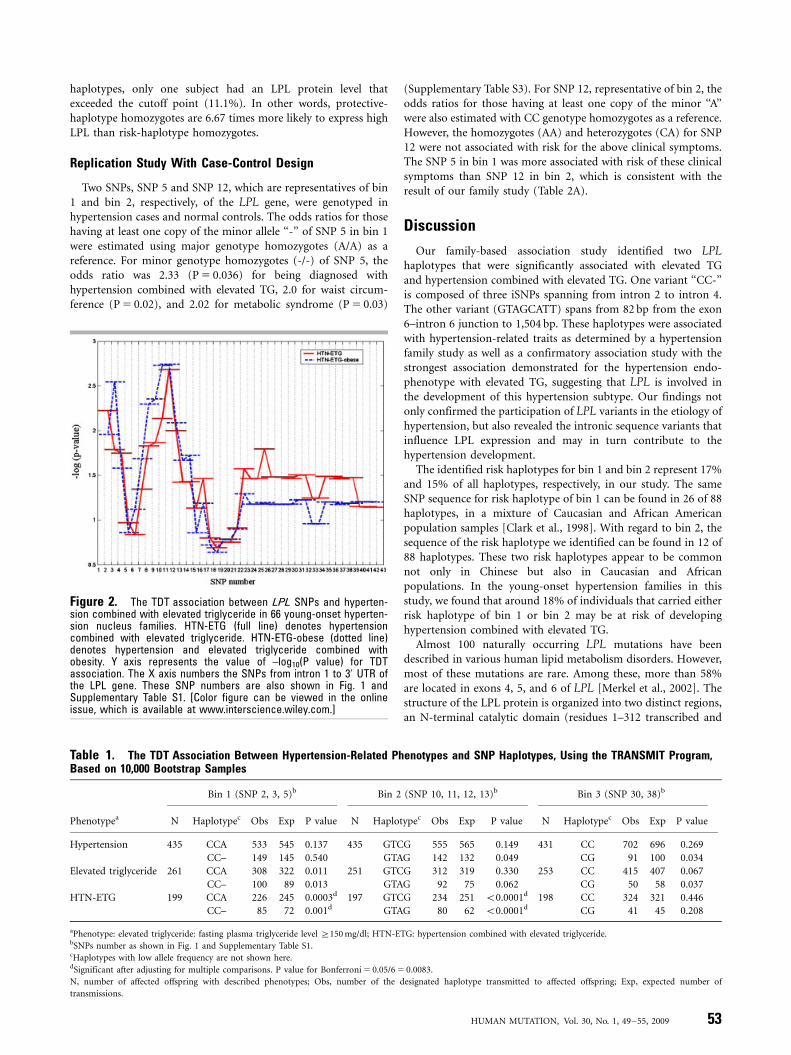
Table 1 shows the TDT association results from data of the 345families. The ‘‘CC-’’ haplotype of bin 1 (risk haplotype) wassignificantly higher in its transmission to offspring with elevatedTG (P 5 0.013), and to those with a combined phenotype ofhypertension with elevated TG (P 5 0.001). By contrast, the CCAhaplotype of bin 1 (protective haplotype) was significantly lowerin its transmission to offspring with hypertension and elevated TGcombined. With regard to bin 2, transmission of haplotype GTCG(protective haplotype) was significantly lower to offspring(Po0.0001) with hypertension and elevated TG combined, buthaplotype GTAG (risk haplotype) was higher (Po0.0001). Similarpositive association with hypertension was observed for haplotypeGTAG in bin 2, but to a lesser extent. For bin 3, the haplotype CG(protective haplotype) was significantly lower in its transmissionto offspring with elevated level of plasma TG (P 5 0.037) and withhypertension (P 5 0.034).
Risk Associated With Risk-Haplotype Homozygotes andHeterozygotes Compared to Major/Protective-HaplotypeHomozygotes on Hypertension and Its Endophenotype
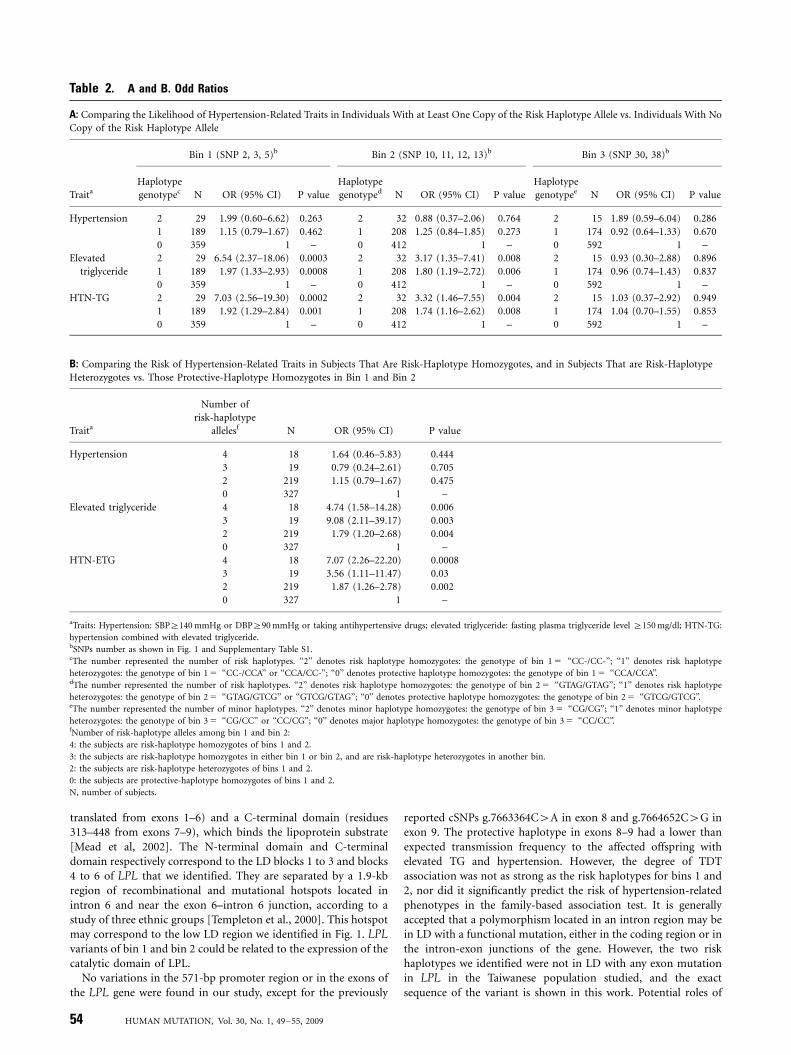
The odds ratios for those having at least one copy of ‘‘CC-’’ forbin 1 were estimated using protective haplotype homozygotes(CCA/CCA) as a reference (Table 2A). For risk-haplotypehomozygotes of bin 1, the odds ratio was 1.99 (P 5 0.263) forbeing diagnosed with hypertension, 6.54 for elevated TG(P 5 0.0003), and 7.03 for hypertension combined with elevatedTG (P 5 0.0002). For risk haplotype heterozygotes of bin 1, odds
HUMAN MUTATION, Vol. 30, No. 1, 49–55, 2009 51
ratios were lower, but significant ones remained. For bin 2, similarsignificant results were observed in both phenotypes of elevatedTG and hypertension combined with elevated TG (Table 2A).Haplotypes for bin 3 were not associated with risk for any of theabove clinical syndromes.
Since two risk haplotypes were moderately linked, we furtherclassified all individuals into 1 of 4 exclusive subgroups by theirhaplotype genotype status for bins 1 and 2 (Table 2B). Thesubjects are homozygotes for risk haplotypes in both bins or ineither bin 1 or bin 2 (that is, the number of risk-haplotype allelesequals 4 or 3, respectively) had the highest risk of having theendophenotypes of hypertension compared to those homozygotesfor protective haplotypes in both bins. The risk was reduced butwas still statistically significant for individuals heterozygous forrisk haplotypes on both loci (the number of risk-haplotypealleles 5 2) (Table 2B).
Resequencing and LPL Expression Measurement for Risk/Protective Haplotype Homozygotes
To determine whether it is the genotyped SNPs or otherSNPs in the LD region that contributed to the disease
association, we sequenced the entire region of introns 2, 3, 4, 5,and 6 of LPL using samples from six homozygotes with riskhaplotypes in bin 1 and bin 2 (CC- and GTAG), and from sixhomozygotes with protective haplotypes (CCA and GTCG).We found that there were no new SNPs in bin 1, other thanthose that were already genotyped. In intron 6, a longer LDblock was revealed, spanning from SNP 12 (82 bp awayfrom the exon 6–intron 6 junction) to SNP 16 (g.7660026C4T;1504 bp from the above junction), in which a new SNP (T/C) wasfound between SNP 13 and SNP 14 (g.7659451G4A). Thus,haplotype GTAGCATT of bin 2 corresponds to the risk allele andhaplotype GTCGTGAC corresponds to the protective allele(Supplementary Fig. S1). The first four nucleotides (GTAG orGTCG) correspond to the original bin 2 haplotype sequence. Thefifth position of this haplotype corresponds to the newlydiscovered SNP.
The LPL expression level of the individual homozygotes withrisk haplotypes or protective haplotypes of both bin1 and bin2 ofLPL was evaluated after a fat meal challenge. We found thatamong 11 subjects with protective haplotypes, five subjects(45.5%) had LPL protein levels that were over the 70th percentile(Supplementary Fig. S2). However, among nine subjects with risk
Figure 1. LD map of SNPs within LPL and constructed bins. A: Haplotypes identified in bin 1, bin 2, and bin 3 and their frequencies. Thehaplotypes colored red are significantly associated with the phenotypes of interest. B: Map of the LPL gene showing exons (E1–E9) and theconstructed bins. C: A LD block map containing 44 SNPs in a 25-kb region from intron 1 to the 30-end of LPL was constructed by Haploviewsoftware.
52 HUMAN MUTATION, Vol. 30, No. 1, 49–55, 2009
haplotypes, only one subject had an LPL protein level thatexceeded the cutoff point (11.1%). In other words, protective-haplotype homozygotes are 6.67 times more likely to express highLPL than risk-haplotype homozygotes.
Replication Study With Case-Control Design
Two SNPs, SNP 5 and SNP 12, which are representatives of bin1 and bin 2, respectively, of the LPL gene, were genotyped inhypertension cases and normal controls. The odds ratios for thosehaving at least one copy of the minor allele ‘‘-’’ of SNP 5 in bin 1were estimated using major genotype homozygotes (A/A) as areference. For minor genotype homozygotes (-/-) of SNP 5, theodds ratio was 2.33 (P 5 0.036) for being diagnosed withhypertension combined with elevated TG, 2.0 for waist circum-ference (P 5 0.02), and 2.02 for metabolic syndrome (P 5 0.03)
(Supplementary Table S3). For SNP 12, representative of bin 2, theodds ratios for those having at least one copy of the minor ‘‘A’’were also estimated with CC genotype homozygotes as a reference.However, the homozygotes (AA) and heterozygotes (CA) for SNP12 were not associated with risk for the above clinical symptoms.The SNP 5 in bin 1 was more associated with risk of these clinicalsymptoms than SNP 12 in bin 2, which is consistent with theresult of our family study (Table 2A).
Discussion
Our family-based association study identified two LPLhaplotypes that were significantly associated with elevated TGand hypertension combined with elevated TG. One variant ‘‘CC-’’is composed of three iSNPs spanning from intron 2 to intron 4.The other variant (GTAGCATT) spans from 82 bp from the exon6–intron 6 junction to 1,504 bp. These haplotypes were associatedwith hypertension-related traits as determined by a hypertensionfamily study as well as a confirmatory association study with thestrongest association demonstrated for the hypertension endo-phenotype with elevated TG, suggesting that LPL is involved inthe development of this hypertension subtype. Our findings notonly confirmed the participation of LPL variants in the etiology ofhypertension, but also revealed the intronic sequence variants thatinfluence LPL expression and may in turn contribute to thehypertension development.
The identified risk haplotypes for bin 1 and bin 2 represent 17%and 15% of all haplotypes, respectively, in our study. The sameSNP sequence for risk haplotype of bin 1 can be found in 26 of 88haplotypes, in a mixture of Caucasian and African Americanpopulation samples [Clark et al., 1998]. With regard to bin 2, thesequence of the risk haplotype we identified can be found in 12 of88 haplotypes. These two risk haplotypes appear to be commonnot only in Chinese but also in Caucasian and Africanpopulations. In the young-onset hypertension families in thisstudy, we found that around 18% of individuals that carried eitherrisk haplotype of bin 1 or bin 2 may be at risk of developinghypertension combined with elevated TG.
Almost 100 naturally occurring LPL mutations have beendescribed in various human lipid metabolism disorders. However,most of these mutations are rare. Among these, more than 58%are located in exons 4, 5, and 6 of LPL [Merkel et al., 2002]. Thestructure of the LPL protein is organized into two distinct regions,an N-terminal catalytic domain (residues 1–312 transcribed and
Table 1. The TDT Association Between Hypertension-Related Phenotypes and SNP Haplotypes, Using the TRANSMIT Program,Based on 10,000 Bootstrap Samples
Bin 1 (SNP 2, 3, 5)b Bin 2 (SNP 10, 11, 12, 13)b Bin 3 (SNP 30, 38)b
Phenotypea N Haplotypec Obs Exp P value N Haplotypec Obs Exp P value N Haplotypec Obs Exp P value
Hypertension 435 CCA 533 545 0.137 435 GTCG 555 565 0.149 431 CC 702 696 0.269
CC– 149 145 0.540 GTAG 142 132 0.049 CG 91 100 0.034
Elevated triglyceride 261 CCA 308 322 0.011 251 GTCG 312 319 0.330 253 CC 415 407 0.067
CC– 100 89 0.013 GTAG 92 75 0.062 CG 50 58 0.037
HTN-ETG 199 CCA 226 245 0.0003d 197 GTCG 234 251 o0.0001d 198 CC 324 321 0.446
CC– 85 72 0.001d GTAG 80 62 o0.0001d CG 41 45 0.208
aPhenotype: elevated triglyceride: fasting plasma triglyceride level Z150 mg/dl; HTN-ETG: hypertension combined with elevated triglyceride.bSNPs number as shown in Fig. 1 and Supplementary Table S1.cHaplotypes with low allele frequency are not shown here.dSignificant after adjusting for multiple comparisons. P value for Bonferroni 5 0.05/6 5 0.0083.
N, number of affected offspring with described phenotypes; Obs, number of the designated haplotype transmitted to affected offspring; Exp, expected number of
transmissions.
Figure 2. The TDT association between LPL SNPs and hyperten-sion combined with elevated triglyceride in 66 young-onset hyperten-sion nucleus families. HTN-ETG (full line) denotes hypertensioncombined with elevated triglyceride. HTN-ETG-obese (dotted line)denotes hypertension and elevated triglyceride combined withobesity. Y axis represents the value of –log10(P value) for TDTassociation. The X axis numbers the SNPs from intron 1 to 30 UTR ofthe LPL gene. These SNP numbers are also shown in Fig. 1 andSupplementary Table S1. [Color figure can be viewed in the onlineissue, which is available at www.interscience.wiley.com.]
HUMAN MUTATION, Vol. 30, No. 1, 49–55, 2009 53
translated from exons 1–6) and a C-terminal domain (residues313–448 from exons 7–9), which binds the lipoprotein substrate[Mead et al, 2002]. The N-terminal domain and C-terminaldomain respectively correspond to the LD blocks 1 to 3 and blocks4 to 6 of LPL that we identified. They are separated by a 1.9-kbregion of recombinational and mutational hotspots located inintron 6 and near the exon 6–intron 6 junction, according to astudy of three ethnic groups [Templeton et al., 2000]. This hotspotmay correspond to the low LD region we identified in Fig. 1. LPLvariants of bin 1 and bin 2 could be related to the expression of thecatalytic domain of LPL.
No variations in the 571-bp promoter region or in the exons ofthe LPL gene were found in our study, except for the previously
reported cSNPs g.7663364C4A in exon 8 and g.7664652C4G inexon 9. The protective haplotype in exons 8–9 had a lower thanexpected transmission frequency to the affected offspring withelevated TG and hypertension. However, the degree of TDTassociation was not as strong as the risk haplotypes for bins 1 and2, nor did it significantly predict the risk of hypertension-relatedphenotypes in the family-based association test. It is generallyaccepted that a polymorphism located in an intron region may bein LD with a functional mutation, either in the coding region or inthe intron-exon junctions of the gene. However, the two riskhaplotypes we identified were not in LD with any exon mutationin LPL in the Taiwanese population studied, and the exactsequence of the variant is shown in this work. Potential roles of
Table 2. A and B. Odd Ratios
A: Comparing the Likelihood of Hypertension-Related Traits in Individuals With at Least One Copy of the Risk Haplotype Allele vs. Individuals With No
Copy of the Risk Haplotype Allele
Bin 1 (SNP 2, 3, 5)b Bin 2 (SNP 10, 11, 12, 13)b Bin 3 (SNP 30, 38)b
TraitaHaplotype
genotypec N OR (95% CI) P value
Haplotype
genotyped N OR (95% CI) P value
Haplotype
genotypee N OR (95% CI) P value
Hypertension 2 29 1.99 (0.60–6.62) 0.263 2 32 0.88 (0.37–2.06) 0.764 2 15 1.89 (0.59–6.04) 0.286
1 189 1.15 (0.79–1.67) 0.462 1 208 1.25 (0.84–1.85) 0.273 1 174 0.92 (0.64–1.33) 0.670
0 359 1 – 0 412 1 – 0 592 1 –
Elevated 2 29 6.54 (2.37–18.06) 0.0003 2 32 3.17 (1.35–7.41) 0.008 2 15 0.93 (0.30–2.88) 0.896
triglyceride 1 189 1.97 (1.33–2.93) 0.0008 1 208 1.80 (1.19–2.72) 0.006 1 174 0.96 (0.74–1.43) 0.837
0 359 1 – 0 412 1 – 0 592 1 –
HTN-TG 2 29 7.03 (2.56–19.30) 0.0002 2 32 3.32 (1.46–7.55) 0.004 2 15 1.03 (0.37–2.92) 0.949
1 189 1.92 (1.29–2.84) 0.001 1 208 1.74 (1.16–2.62) 0.008 1 174 1.04 (0.70–1.55) 0.853
0 359 1 – 0 412 1 – 0 592 1 –
B: Comparing the Risk of Hypertension-Related Traits in Subjects That Are Risk-Haplotype Homozygotes, and in Subjects That are Risk-Haplotype
Heterozygotes vs. Those Protective-Haplotype Homozygotes in Bin 1 and Bin 2
Traita
Number of
risk-haplotype
allelesf N OR (95% CI) P value
Hypertension 4 18 1.64 (0.46–5.83) 0.444
3 19 0.79 (0.24–2.61) 0.705
2 219 1.15 (0.79–1.67) 0.475
0 327 1 –
Elevated triglyceride 4 18 4.74 (1.58–14.28) 0.006
3 19 9.08 (2.11–39.17) 0.003
2 219 1.79 (1.20–2.68) 0.004
0 327 1 –
HTN-ETG 4 18 7.07 (2.26–22.20) 0.0008
3 19 3.56 (1.11–11.47) 0.03
2 219 1.87 (1.26–2.78) 0.002
0 327 1 –
aTraits: Hypertension: SBPZ140 mmHg or DBPZ90 mmHg or taking antihypertensive drugs; elevated triglyceride: fasting plasma triglyceride level Z150 mg/dl; HTN-TG:
hypertension combined with elevated triglyceride.bSNPs number as shown in Fig. 1 and Supplementary Table S1.cThe number represented the number of risk haplotypes. ‘‘2’’ denotes risk haplotype homozygotes: the genotype of bin 1 5 ‘‘CC-/CC-’’; ‘‘1’’ denotes risk haplotype
heterozygotes: the genotype of bin 1 5 ‘‘CC-/CCA’’ or ‘‘CCA/CC-’’; ‘‘0’’ denotes protective haplotype homozygotes: the genotype of bin 1 5 ‘‘CCA/CCA’’.dThe number represented the number of risk haplotypes. ‘‘2’’ denotes risk haplotype homozygotes: the genotype of bin 2 5 ‘‘GTAG/GTAG’’; ‘‘1’’ denotes risk haplotype
heterozygotes: the genotype of bin 2 5 ‘‘GTAG/GTCG’’ or ‘‘GTCG/GTAG’’; ‘‘0’’ denotes protective haplotype homozygotes: the genotype of bin 2 5 ‘‘GTCG/GTCG’’.eThe number represented the number of minor haplotypes. ‘‘2’’ denotes minor haplotype homozygotes: the genotype of bin 3 5 ‘‘CG/CG’’; ‘‘1’’ denotes minor haplotype
heterozygotes: the genotype of bin 3 5 ‘‘CG/CC’’ or ‘‘CC/CG’’; ‘‘0’’ denotes major haplotype homozygotes: the genotype of bin 3 5 ‘‘CC/CC’’.fNumber of risk-haplotype alleles among bin 1 and bin 2:
4: the subjects are risk-haplotype homozygotes of bins 1 and 2.
3: the subjects are risk-haplotype homozygotes in either bin 1 or bin 2, and are risk-haplotype heterozygotes in another bin.
2: the subjects are risk-haplotype heterozygotes of bins 1 and 2.
0: the subjects are protective-haplotype homozygotes of bins 1 and 2.
N, number of subjects.
54 HUMAN MUTATION, Vol. 30, No. 1, 49–55, 2009
intron variants include noncoding RNA, carriers of transcriptionregulatory elements, activators in alternative and trans-splicing,enhancers of meiotic crossing over within coding sequences,substrates for exon shuffling, and signals for mRNA export fromthe nucleus and nonsense-mediated decay [Fedorova and Fedorov,2003; Pagani and Baralle, 2004].
The functional study of LPL expression illustrated an interestingtrend in that the subjects with LPL risk haplotypes tended to havelower LPL expression after a fatty meal challenge, although the datawas not statistically significant because of the small sample size.This result demonstrated that these two identified LPL geneticvariants may influence LPL expression levels and then inducesubsequent events. Moreover, our replication study with a case-control design also revealed that the variant represented in bin 1 ofLPL is associated with hypertension combined with elevated TGand metabolic syndrome. The syndrome is characterized byclustering disorders including hypertension, hypertriglyceridemia,low HDL-C, hyperglycemia, and central obesity. However, it is notaltogether clear how these different facets of metabolic syndromerelate to one another hierarchically. lipotoxicity, steatosis, obesity-induced insulin resistance, and glucotoxicity are among thehypotheses leading to the development of metabolic syndrome[Reaven et al., 1996; den Boer et al., 2004; Grundy, 2004]. Althoughthe sequence of events leading to hypertension and other relatedcomorbidities may be multidirectional, our finding suggests thatlipid accumulation (hypertriglyceridemia) via reduced LPLexpression could potentially develop prior to the development ofhypertension and related disorders.
In conclusion, we identified two LPL haplotypes that areassociated with a hypertension endophenotype with elevated TG.These two haplotypes, composed of iSNPs, appear to be common inseveral populations. Our findings demonstrate the genetic under-pinnings of common sequence variants for common complexdiseases and highlight the potential role of iSNPs on complexdiseases. The public health importance of this finding, along withthe suggestion that the LPL-related mechanism may help elucidatethe etiology of hypertension and the sequential events of metabolicsyndrome, awaits further in-depth investigations.
Acknowledgments
We thank the National Genotyping Center in Taiwan for performing SNP
typing, Dr. Yen-Feng Chiu for her statistical advice, and Dr. Vincent
Mooser, Dr. Lee-Young Chou, and Dr. I-Ping Tu for their insightful
comments on the manuscript.
References
Barrett JC, Fry B, Maller J, Daly MJ. 2005. Haploview: analysis and visualization of
LD and haplotype maps. Bioinformatics 21:263–265.
Chen JW, Wu SY, Pan WH. 2004. Clinical characteristics of young-onset
hypertension—implications for different genders. Int J Cardiol 96:65–71.
Chen P, Jou YS, Fann CSJ, Chen JW, Wu SY, Pan WH. 2005. Lipoprotein lipase gene
is linked and associated with hypertension in Taiwan young-onset hypertension
genetic study. J Biomed Sci 12:651–658.
Clark AG, Weiss KM, Nickerson DA, Taylor SL, Buchanan A, Stengard J, Salomaa V,
Vartiainen E, Perola M, Boerwinkle E, Sing CF. 1998. Haplotype structure and
population genetic inferences from nucleotide-sequence variation in human
lipoprotein lipase. Am J Hum Genet 63:595–612.
Clayton D, Jones H. 1999. Transmission/disequilibrium test for extended marker
haplotypes. Am J Hum Genet 65:1161–1169.
den Boer M, Voshol PJ, Kuipers F, Havekes LM, Romijn JA. 2004. Hepatic steatosis: a
mediator of the metabolic syndrome. Lessons from animal models. Arterioscler
Thromb Vasc Biol 24:644–649.
Fedorova L, Fedorov A. 2003. Introns in gene evolution. Genetica 118:123–131.
Grundy SM. 2004. Obesity, metabolic syndrome, and cardiovascular disease. J Clin
Endocrinol Metab 89:2595–2600.
Hopkins PN, Heiss G, Ellison RC, Province MA, Pankow JS, Eckfeldt JH, Hunt SC.
2003. Coronary artery disease risk in familial combined hyperlipidemia and
familial hypertriglyceridemia: a case-control comparison from the National
Heart, Lung, and Blood Institute Family Heart Study. Circulation 108:519–523.
Hwu CM, Kwok CF, Kuo CS, Hsiao LC, Lee YS, Wei MJ, Kao WY, Lee SH, Ho LT.
2002. Exacerbation of insulin resistance and postprandial triglyceride response
in newly diagnosed hypertensive patients with hypertriglyceridaemia. J Hum
Hypertens 16:487–493.
Lalouel JM. 2003. Large-scale search for genes predisposing to essential hypertension.
Am J Hypertens 16:163–166.
Lee WK, Padmanabhan S, Dominiczak AF. 2000. Genetics of hypertension: from
experimental models to clinical applications. J Hum Hypertens 14:631–647.
Mead JR, Irvine SA, Ramji DP. 2002. Lipoprotein lipase: structure function,
regulation, and role in disease. J Mol Med 80:753–769.
Merkel M, Eckel RH, Goldberg IJ. 2002. Lipoprotein lipase: genetics, lipid uptake,
and regulation. J Lipid Res 43:1997–2006.
NCEP Expert. 2002. Third Report of National Cholesterol Education Program (NCEP)
expert panel on detection, evaluation, and treatment of high blood cholesterol in
adults (Adult Treatment Panel III). Final report. Circulation 106:3143–3421.
Nickerson DA, Taylor SL, Weiss KM, Clark AG, Hutchinson RG, Stengard J, Salomaa
V, Vartiainen E, Boerwinkle E, Sing CF. 1998. DNA sequence diversity in a 9.7-
kb region of the human lipoprotein lipase gene. Nat Genet 19:233–240.
Pagani F, Baralle FE. 2004. Genomic variants in exons and introns: identifying the
splicing spoilers. Nat Rev Genet 5:389–396.
Pan WH, Chen YC, Yu SL, Sun JA, Chang YS, Chen CJ. 1994. Correlates and
predictive models for blood pressure values in residents of two communities in
Taiwan. J Formos Med Assoc 93:582–591.
Pan WH, Chen JW, Fann C, Jou YS, Wu SY. 2000. Linkage analysis with candidate
genes: the Taiwan young-onset hypertension genetic study. Hum Genet
107:210–215.
Pan WH, Fann CJS, Wu JY, Hung YT, Ho MS, Ta TH, Chen YJ, Liao CJ, Yang ML,
Cheng ATA, Chen YT. 2006a. Han Chinese Cell and Genome bank in Taiwan:
purpose, design and ethical considerations. Hum Hered 61:27–30.
Pan WH, Lynn KS, Chen CH, Wu YL, Lin CY, Chang HY. 2006b. Using
endophenotypes for pathway clusters to map complex disease genes. Genet
Epidemiol 30:143–154.
Reaven GM, Lithell H, Landsberg L. 1996. Hypertension and associated metabolic
abnormalities—the role of insulin resistance and the sympathoandernal system.
N Engl J Med 334:374–381.
Shieh SM, Shen M, Fuh MM, Chen YD, Reaven GM. 1987. Plasma lipid and
lipoprotein concentration in Chinese males with coronary artery disease, with
and without hypertension. Atherosclerosis 67:49–55.
Sillanpaa MJ, Auranen K. 2004. Replication in genetic studies of complex traits. Ann
Hum Genet 68:646–657.
Sobel E, Lange K. 1996. Descent graphs in pedigree analysis: applications to haplotyping,
location scores, and marker sharing statistics. Am J Hum Genet 58:1323–1337.
Templeton AR, Clark AG, Weiss KM, Nickerson DA, Boerwinkle E, Sing CF. 2000.
Recombinational and mutational hotspots within the human lipoprotein lipase
gene. Am J Hum Genet 66:69–83.
Williams RR, Hunt SC, Hopkins PN, Stults BM, Wu LL, Hasstedt SJ, Barlow GK,
Stephenson SH, Laiouel JM, Kuida H. 1988. Familial dyslipidemic hypertension:
evidence from 58 Utah families for a syndrome present in approximately 12% of
patients with essential hypertension. JAMA 259:3579–3586.
Wu DA, Bu X, Warden CH, Shen DDC, Jeng CY, Sheu WHH, Fuh MMT, Katsuya T,
Dzau VJ, Reaven GM, Lusis AJ, Rotter JI, Chen YDI. 1996. Quantitative
trait locus mapping of human blood pressure to a genetic region at or near
the lipoprotein lipase gene locus on chromosome 8p22. J Clin Invest 97:
2111–2118.
Yang WJ, Huang JF, Yao CL, Fan ZJ, Ge DL, Gan WQ, Huang GY, Hui RT, Shen Y,
Qiang BQ, Gu DF. 2003. Evidence for linkage and association of the markers
near the LPL gene with hypertension in Chinese families. J Med Genet 40:e57.
Yang WJ, Huang JF, Ge DL, Yao CL, Duan X, Shen Y, Qiang B, Gu DF. 2004.
Lipoprotein lipase gene is in linkage with blood pressure phenotypes in Chinese
pedigrees. Hum Genet 115:8–12.
Yang WJ, Huang JF, Yao CL, Su S, Liu D, Ge DL, Gu DF. 2005. Linkage and linkage
disequilibrium analysis of the lipoprotein lipase gene with lipids profile in
Chinese hypertensive families. Clin Sci 108:137–142.
Zeger SL, Liang KY. 1986. Longitudinal data analysis for discrete and continuous
outcomes. Biometrics 42:121–130.
HUMAN MUTATION, Vol. 30, No. 1, 49–55, 2009 55
Recommended