International Journal of Engineering Research & Science (IJOER) ISSN: [2395-6992] [Vol-2, Issue-12, December- 2016]
Page | 79
Lineaments Determination of Western Part of Iraqi Western
Desert using Aeromagnetic and Gravity Data Ahmed Mousa
1*, Ali Al-Rahim
2
Department of Geology, College of Science, University of Baghdad, Baghdad, Iraq
Abstract— The aim of this study is to investigate the boundaries of geological structures of the western part of Iraqi
Western Desert using aeromagnetic and Bouguer gravity data. To achieve this, The CET (Centre for Exploration Targeting)
Grid Analysis extension was applied to aeromagnetic and gravity data, and It is supposed that the provide results are
unbiased. Decompensative anomaly map of an isostatic residual gravity anomaly map shows NNW maxima trend in western
part of the study area, while the eastern part shows NS minima, where this gravity low is thought to be an important basin.
The reduced to the pole magnetic map in general agrees with the gravity interpretation, however there are some differences
related to the magnetic susceptibility variations within the basement. The basement topography was furthermore estimated
using Oasis Montaj that based on Bill Pearson’s implementation of R. L. Parker’s algorithm (1972). Four sets of lineaments
were determined using the CET grid and derivative analysis. These lineaments are thought to be related to the formation of
the basins in the Western Desert.
Keywords— Iraq, Aeromagnetic methods, Gravity methods, Lineaments Determination.
I. INTRODUCTION
The Western Desert region of Iraq is part of the Arabian plate which created nearly 25 Ma when the Red Sea and Gulf of
Aden rifted away from northeast Africa (Stern and Johnson, 2010). The Arabian plate is surrounded by active tectonic
margins (Stern and Johnson, 2010); the northern and eastern margins of the plate are composed of the compressional regimes
of the Taurus suture zone to the north and Zagros thrust zone in the east (Fox and Ahlbrandt, 2002; Stern and Johnson, 2010).
To the west and the south, the margins are extensional defined by the Red Sea and Gulf of Aden rifts.
Gravity and magnetic measurements have a chief role in understanding the structure and evolution of sedimentary basins and
basement. The basement structures can propagate into the overlying sedimentary rocks and influence fluid flow and the
distribution of hydrocarbon traps. For example, many oil and gas fields occur along fault-controlled linear trends. Therefore,
the structural framework of the basement has a significant impact on basin evolution (Ali et. al, 2014).
In 1974, an aeromagnetic survey of Iraq was performed by Compagnie General de Geophysique (CGG). GETECH Group
has carried out a detailed reprocessing study to recover all the aeromagnetic and gravity data into a standard Geosoft database
format. Gravity and magnetic maps have commonly been used in hydrocarbon exploration to the thickness of sedimentary
basins (Hinze, 1985). The Western Desert within which the study area (Fig. 1) is mainly within Iraq but extends to the west
and south into Syria, Jordan and Saudi Arabia. Most of the Western Desert has been a region of erosion a land since the
Oligocene.
The gravity map of Iraq shows two main gravity minima separated by a chief central gravity high. The highest Bouguer
gravity value is located in the central gravity high in the Jezira area of North West of Iraq. The Bouguer gravity value
steadily drops along the same zone to the South East within this gravity high to about 5 mGal to the west of Razzaza Lake in
Central Iraq. The western gravity low of west Iraq is complicated. Originally two gravity lows exist between longitudes 42°
and 44°. These gravity lows are separated from a gravity low in the Rutba area of West Iraq by a series of NNW-SSE
trending gravity highs. Several derivations such as total horizontal derivative of the gravity and residual gravity were used
for the study of fault systems and delineation of structural highs. Comparison of the gravity residuals with seismic data
shows some association between structural highs and positive gravity residuals, except for residuals in S Iraq and the gravity
low between longitudes 42° and 44° of W Iraq. The apparent differences between the gravity and magnetic fields can be
clarified by the pseudo-gravity field calculated from the magnetic field. The pseudo-gravity map shows a relatively good
correlation with the gravity map apart from in the Rutba area of West Iraq where low gravity corresponds to high pseudo
gravity that related with high magnetic susceptibility in the Precambrian basement of that region (Jassim and Goff, 2006).
International Journal of Engineering Research & Science (IJOER) ISSN: [2395-6992] [Vol-2, Issue-12, December- 2016]
Page | 80
FIGURE 1: DEM MAP SHOWING THE STUDY AREA (BLUE POLYGON) WITHIN THE IRAQI WESTERN DESERT
(YELLOW POLYGON)
Scattered seismic reflection studies and exploratory few deep wells by various petroleum companies have shown that the
Western Desert is a potential region for petroleum resources. However, there has not been sufficient seismic exploration to
determine the total petroleum potential of the region. To determine its potential, more geological work and a better
understanding of the subsurface geology of the Western Desert is needed. Depth to Crystalline Precambrian basement was
derived (in meters relative to see level) from 3D inversion of gravity data (Jassim and Goff, 2006).
Faults were estimated from different sources comprising satellite images, gravity and magnetic gradients, and to a minor
degree seismic data. The Total Horizontal Derivative of the gravity was established to be the most valuable parameter for
defining fault trends. Main fault zones relate to the NW-SE Najd Fault System and the NE-SW Transversal System. The
three chief fault systems are the N-S Nabitah (Idsas) System, the NW-SE Najd System and the NE-SW or E- W Transversal
System. Those fault systems created through Late Precambrian Nabitah orogeny. It is believed that they were re-activated
frequently during the Phanerozoic.
The chief objective of this work is to explore the lineaments in western part of the Western Desert region which includes
main graben, and to provide an updated lineament map for the study area based on aeromagnetic and Bouguer gravity
anomaly data (Jassim and Goff, 2006 and Aqrawi, et al., 2010).
II. GEOLOGICAL SETTING
Geological interest in the Western Desert of Iraq began in the early 1930s when gold was found in the Ga'ara area. The
tectonics of Iraq is influenced by Alpine tectonism but the western part of the country, is influenced also by older tectonic
events from the Carboniferous onwards. Rutbaa-Jazira zone represents important tectonic part of the Western Desert which
involved the study area (a Hercynian basin followed by formation of the Rutba uplift with NW-SE, N-S and E-W antiforms.
The other tectonic part is Salman zone (a Hercynian Uplift with N-S antiforms). Major fault zones correspond to the NW-SE
Najd Fault System and the NE-SW Transversal System (Fig. 2).

International Journal of Engineering Research & Science (IJOER) ISSN: [2395-6992] [Vol-2, Issue-12, December- 2016]
Page | 81
FIGURE 2: DISTRIBUTION OF FAULTS THROUGH IRAQ, THE STUDY AREA (BLUE POLYGON) WITHIN THE IRAQI
WESTERN DESERT (YELLOW POLYGON)
The basic geology of Iraq is not difficult. Essentially a depression with Neogene and Quaternary sediments surrounded by a
monocline in the direction of the west (the Western Desert) and a folded zone toward the east. The western monocline
culminates close the Iraq-Syria-Jordan border into the Rutba Uplift, the core of which exposes Permo-carboniferous rocks
overlain by Triassic and younger sediments. The first comprehensive geological study of the Western Desert was the
compilation work was carried out by Al-Naqib (1963) and was later published as a professional paper by the USGS.The
Western Desert is a part of the northern Arabian Platform, where relatively thin Phanerozoic sediments cover the
Precambrian continental basement complex which contains north- and northeast-trending fractures. The Arabian platform can
be divided into two parts: 1) a stable part to the west (within which the study area is located) and 2) an unstable one to north
and east. Structurally, two major Paleozoic Orogenies (Caledonian and Hercynian) were identified by their effects on sea
level changes rather than their orogenic deformation (Fouad, 2007). The landforms of the Western Desert are result of the
interaction of structure, lithology and climate. The tectonic history of the Stable Shelf, in which the study area is located, has
controlled the development of the main landforms and lithology. The lithological column of the exposed rocks in the Western
Desert consists of limestone, dolomitic limestone, dolomite, sandstone, marl, claystone and phosphorite with rare gypsum.
Detailed geological mapping and study of fractures gave orientation of stress that caused fracturing and uplifting of Rutba
uplift. Rutba uplift has been subjected to tension stress since the late Cretaceous created by one of the hot spot that lead to
fracturing and subsidence of basement rocks. The regional stress that controlled the openings the Red Sea, Gulf of Aden and
the uplift under Afar triangle and Gulf of Suez which formed a linear uplift along Rutba Hail arch, also affected the study
area (Nadir, 1990).
The Western Desert is a major plateau of rocky desert. Rutbah Uplift has played a great role in the historical geomorphology
of the Western Desert. Since Late Cretaceous the crest remained as dry land, starting to develop plateaus on different
formations. The major changes in direction of valleys coincide, mainly with major faults. The number of the developed
plateaus on the top of different formations is 18, the younger one being developed on the top of the Ga`ara Formation. The
International Journal of Engineering Research & Science (IJOER) ISSN: [2395-6992] [Vol-2, Issue-12, December- 2016]
Page | 82
rocks have been faulted, fractured and exposed in major plateaus after they have influenced by movement of, Hijaz, Najid
and Alpine Orogenies (Hamza, 2007) and (Fouad, 2007).
Basement outcrops are absent in Iraq. Furthermore, no wells have reached the basement; thus the basement lithology,
structures and depths can only estimate indirectly. Previous depth estimates based on aeromagnetic data ranged between 7
and 10 km with a general north, northeast and east directed slopes (CGG, 1974). The shallowest basement depths were
aligned in a north-south and north northeast to south southeast trending directions, extending from Saudi Arabia through west
Iraq. It is important to state that the basement in the Western Desert of Iraq cannot be imaged with the available seismic
reflection profiles as they have a relatively bad quality.
In the Rutba area of West Iraq the Precambrian basement is predicted to be composed of Halaban Group andesites with
associated Murdama Group molasse basins, separated by areas of gabbro, diorites and granodiorite syntectonic intrusions
and post-tectonic alkali granites. The Afif Terrane in West Iraq is probably dominated by longitudinal N-S trending major
structures that were arranged parallel to the Halaban microplate boundary (Nabitah Suture Zone), (Jassim and Goff, 2006).
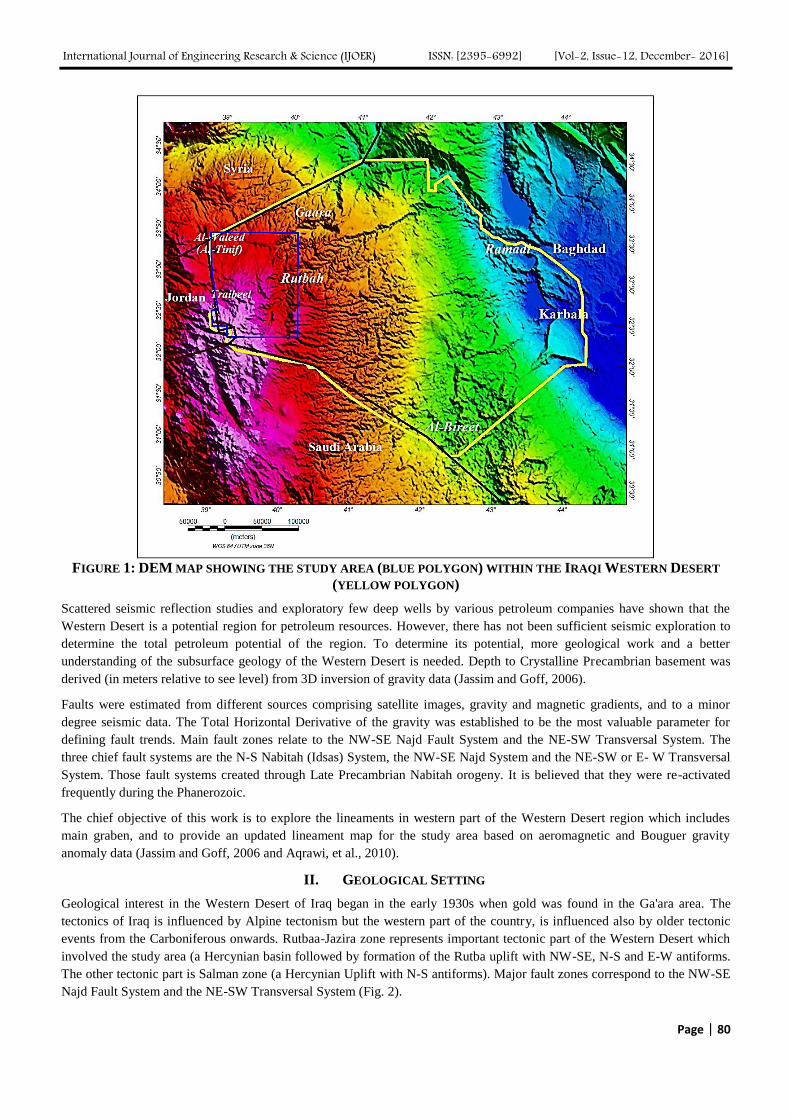
Depth to basement map (Fig. 3) is the product of complex iteration between geological estimates and 3D inversion of
gravity. The map shows a central basement high (at depths of 5-7 km) flanked by two major structural lows on either side. In
the Rutba area of West Iraq, deep basement (at 7-11 km) indicates an inverted Paleozoic basin in which an almost complete
Paleozoic section (up to 9 km thick) is present. This basin was inverted from the Late Permian and formed a major N-S
trending high until the Tithonian when an ENE-WSW oriented structure was formed. NS, E- Wand NWSE trending Upper
Cretaceous basins were located within this inverted Paleozoic basin (Jassim and Goff, 2006).
FIGURE 3: DEPTH TO BASEMENT OF IRAQ AFTER JASSIM AND GOOF, (2007).
III. MATERIALS AND METHODS
The joints of Rutba uplift have nearly a constant strike direction with some exception in several locations. Also joints have
regional extent without clear and sudden change in its general directions. About 95% of joints of Rutba uplift has a dip angel
of about (85-90) that hit almost horizontal strata. Joints dip decrease to (75-80) in eastern parts of Rutba uplift especially in
International Journal of Engineering Research & Science (IJOER) ISSN: [2395-6992] [Vol-2, Issue-12, December- 2016]
Page | 83
Jurassic rocks. Most joints become fissures filled with crystalized calcite and quartz, where those fissures have a width of
about 1 meter mainly for those which has a direction of N30W to 30 cm in some of them which have a direction of N30E.
Six sets of joints that formed due to tension effect have been determined (Nadir, 1999). The most important are N30W,
N60E, N30E and N60W.
The significant phenomena of joints is the absent of a key that relates between them and specific geological time. The
lineaments of study area have been previously investigated by (Al-Amiri, 1984) and as mentioned above (Nadir, 1999). In
these study data sets of gravity and aeromagnetic data has been used to estimate the available lineaments. Therefore, it is
aimed to find the structural boundaries of the western part of Western Desert using CET grid analysis together with three
approaches: theta, analytic signal, and tilt angle.
Understanding of the basement in continental regions to help define the structural boundaries is of vital concern in many
applications of geosciences (ORUC¸ et al. 2013). Recently the Parker–Oldenburg algorithm has been widely used to image
the sediment–basement interface. Some computer programs like 3DINVER and CET (central exploration target), developed
by GEOSOFT, were used to reveal 3D basement topography and to designate the lineaments of study area, respectively.
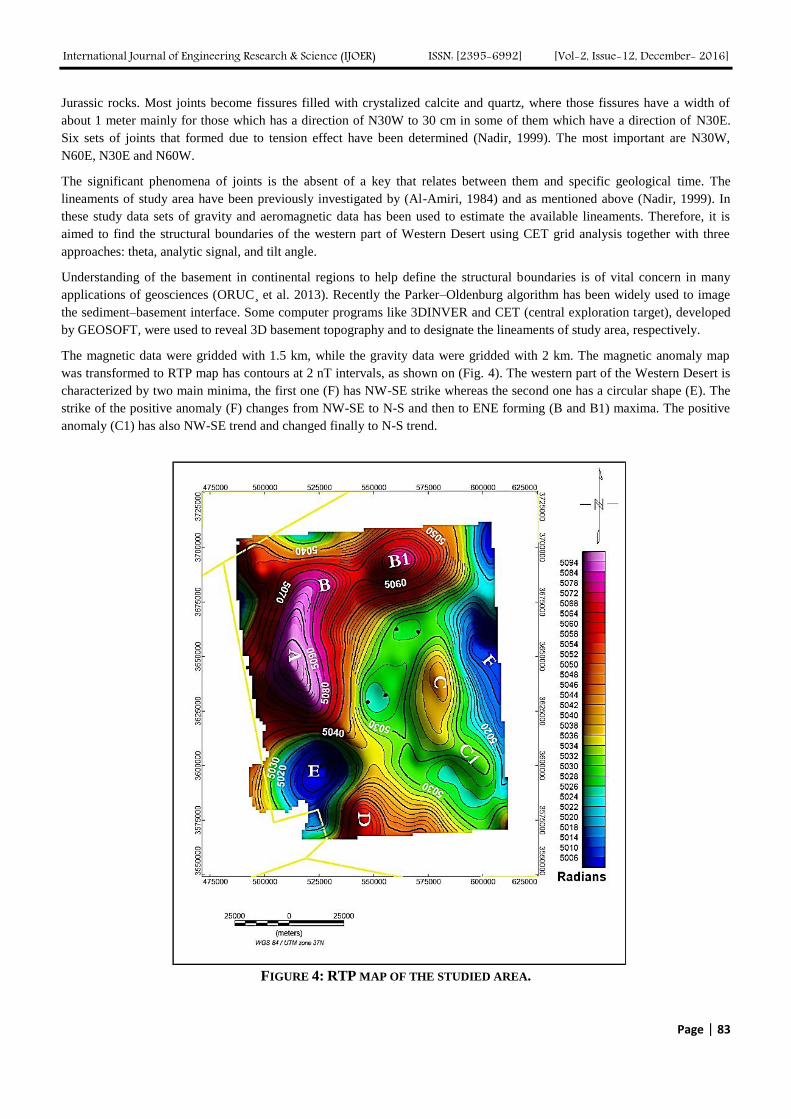
The magnetic data were gridded with 1.5 km, while the gravity data were gridded with 2 km. The magnetic anomaly map
was transformed to RTP map has contours at 2 nT intervals, as shown on (Fig. 4). The western part of the Western Desert is
characterized by two main minima, the first one (F) has NW-SE strike whereas the second one has a circular shape (E). The
strike of the positive anomaly (F) changes from NW-SE to N-S and then to ENE forming (B and B1) maxima. The positive
anomaly (C1) has also NW-SE trend and changed finally to N-S trend.
FIGURE 4: RTP MAP OF THE STUDIED AREA.
International Journal of Engineering Research & Science (IJOER) ISSN: [2395-6992] [Vol-2, Issue-12, December- 2016]
Page | 84
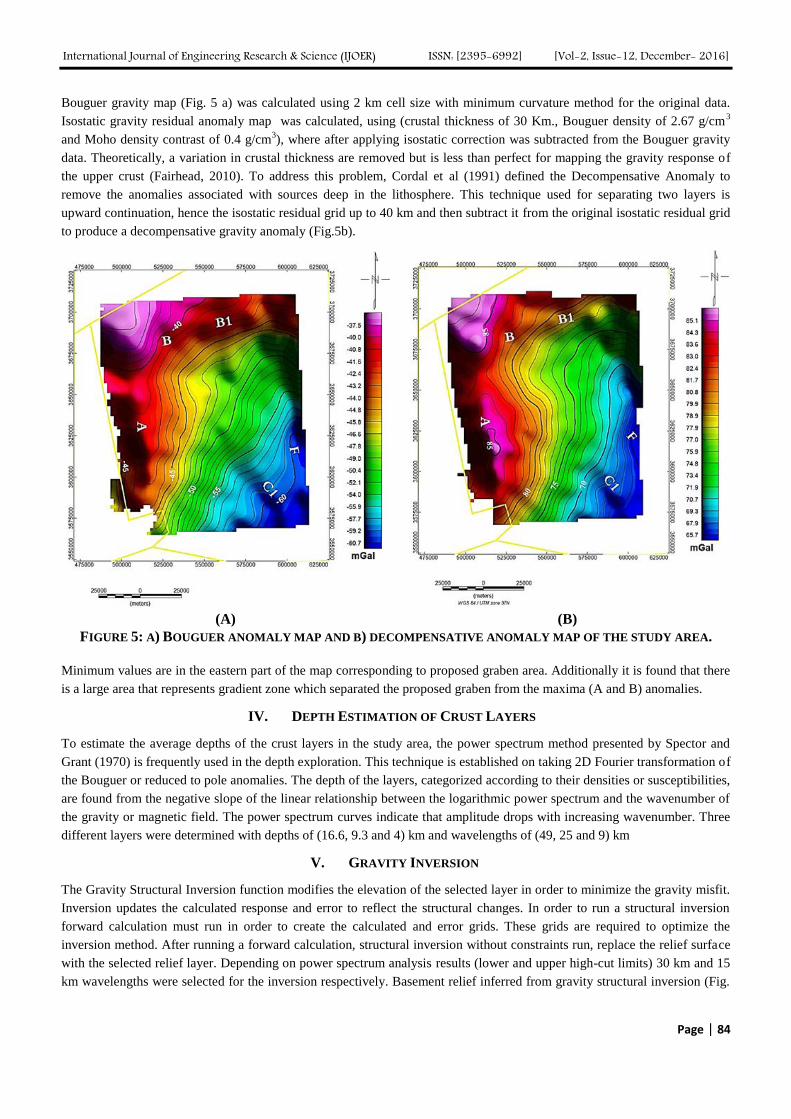
Bouguer gravity map (Fig. 5 a) was calculated using 2 km cell size with minimum curvature method for the original data.
Isostatic gravity residual anomaly map was calculated, using (crustal thickness of 30 Km., Bouguer density of 2.67 g/cm3
and Moho density contrast of 0.4 g/cm3), where after applying isostatic correction was subtracted from the Bouguer gravity
data. Theoretically, a variation in crustal thickness are removed but is less than perfect for mapping the gravity response of
the upper crust (Fairhead, 2010). To address this problem, Cordal et al (1991) defined the Decompensative Anomaly to
remove the anomalies associated with sources deep in the lithosphere. This technique used for separating two layers is
upward continuation, hence the isostatic residual grid up to 40 km and then subtract it from the original isostatic residual grid
to produce a decompensative gravity anomaly (Fig.5b).
(A) (B)
FIGURE 5: A) BOUGUER ANOMALY MAP AND B) DECOMPENSATIVE ANOMALY MAP OF THE STUDY AREA.
Minimum values are in the eastern part of the map corresponding to proposed graben area. Additionally it is found that there
is a large area that represents gradient zone which separated the proposed graben from the maxima (A and B) anomalies.
IV. DEPTH ESTIMATION OF CRUST LAYERS
To estimate the average depths of the crust layers in the study area, the power spectrum method presented by Spector and
Grant (1970) is frequently used in the depth exploration. This technique is established on taking 2D Fourier transformation of
the Bouguer or reduced to pole anomalies. The depth of the layers, categorized according to their densities or susceptibilities,
are found from the negative slope of the linear relationship between the logarithmic power spectrum and the wavenumber of
the gravity or magnetic field. The power spectrum curves indicate that amplitude drops with increasing wavenumber. Three
different layers were determined with depths of (16.6, 9.3 and 4) km and wavelengths of (49, 25 and 9) km
V. GRAVITY INVERSION
The Gravity Structural Inversion function modifies the elevation of the selected layer in order to minimize the gravity misfit.
Inversion updates the calculated response and error to reflect the structural changes. In order to run a structural inversion
forward calculation must run in order to create the calculated and error grids. These grids are required to optimize the
inversion method. After running a forward calculation, structural inversion without constraints run, replace the relief surface
with the selected relief layer. Depending on power spectrum analysis results (lower and upper high-cut limits) 30 km and 15
km wavelengths were selected for the inversion respectively. Basement relief inferred from gravity structural inversion (Fig.

International Journal of Engineering Research & Science (IJOER) ISSN: [2395-6992] [Vol-2, Issue-12, December- 2016]
Page | 85
6) shows several moderate changes giving more details especially for the basin that shows NNW trend along the eastern part
of the studied area.
FIGURE 6: GRAVITY STRUCTURAL INVERSION FOR THE STUDY AREA.
VI. LINEAMENT DETERMINATION
The CET (Centre for Exploration Targeting) Grid Analysis extension for Oasis montaj™ was applied to aeromagnetic and
gravity data, and It is supposed that the provide results are unbiased, but to test and support the results different type of
derivative were applied. These include differential reduction to the pole of the magnetic data (DRTP), derivative methods
including analytic signals (AS) and tilt derivatives (TDR), and isostatic gravity residuals, upward continuation and
wavelength filtering.
The CET Grid Analysis extension contains tools for texture analysis, phase analysis, and structure detection. These are
versatile algorithms useful for grid texture analysis, lineament detection, edge detection, and threshold detection. The CET
Grid Analysis provides a step-by-step trend detection menu which offers two different approaches to trend estimation, which
they are:
The first method, Texture analysis-based image enhancement, is suitable for analyzing regions of subdued magnetic or
gravity responses where texture analysis can first enhance the local data contrast.
The second method, Discontinuity structure detection, is useful in identifying linear discontinuities and edge detection.
This approach applies phase-based edge detection directly to data to find edges whose noise characteristics and poor contrast
limit the effectiveness of traditional gradient-based approaches. As an alternative method of identifying linear discontinuities,
edge detection can be performed directly on magnetic or gravity data. Using a phase-based approach will ensure that even
features lying in low contrast regions will be detected. This process emulates the traditional manual drawing of interpretive
lines along the discontinuity.
The power spectrum technique presented by Spector and Grant (1970) is usually used in the depth and wavelength analysis.
The method is based on taking 2D Fourier transformation of the Bouguer and reduced to pole anomalies. The power
spectrum slopes indicate that amplitude drops with increasing wavenumber. Power spectrum analysis for the studied area
International Journal of Engineering Research & Science (IJOER) ISSN: [2395-6992] [Vol-2, Issue-12, December- 2016]
Page | 86
shows three layers with (19.5, 9 and 4) km and three significant wavelengths (45, 25 and 9) km. Depending on the results of
power spectrum regional fields for both gravity and magnetic data were calculated using the Butterworth filter with cutoff of
45 km, which is excellent for applying straightforward low-pass filter. Since the cutoff rolls off over a range of
wavenumbers, the outcome does not suffer from the Gibb's oscillation phenomena. Residual fields were calculated by
subtract the calculated regional grid from the origin grids of gravity and magnetic ones.
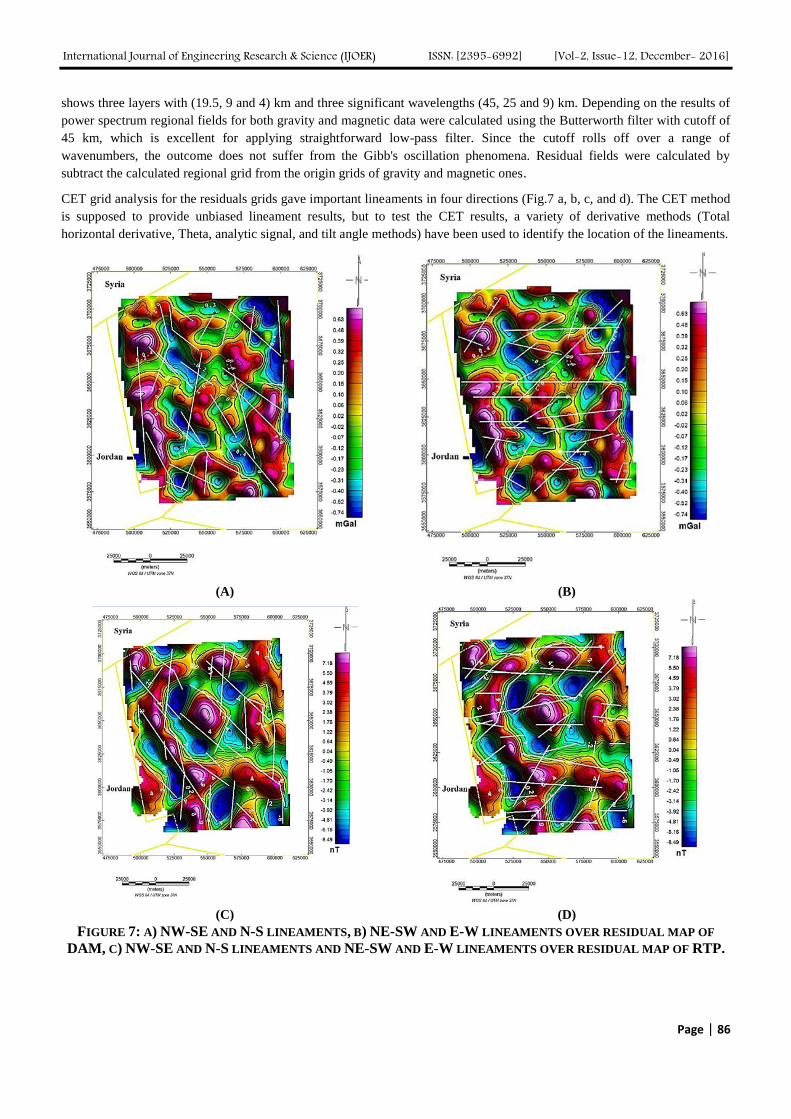
CET grid analysis for the residuals grids gave important lineaments in four directions (Fig.7 a, b, c, and d). The CET method
is supposed to provide unbiased lineament results, but to test the CET results, a variety of derivative methods (Total
horizontal derivative, Theta, analytic signal, and tilt angle methods) have been used to identify the location of the lineaments.
(A) (B)
(C) (D)
FIGURE 7: A) NW-SE AND N-S LINEAMENTS, B) NE-SW AND E-W LINEAMENTS OVER RESIDUAL MAP OF
DAM, C) NW-SE AND N-S LINEAMENTS AND NE-SW AND E-W LINEAMENTS OVER RESIDUAL MAP OF RTP.
International Journal of Engineering Research & Science (IJOER) ISSN: [2395-6992] [Vol-2, Issue-12, December- 2016]
Page | 87
(A) (B)
(C) (D)
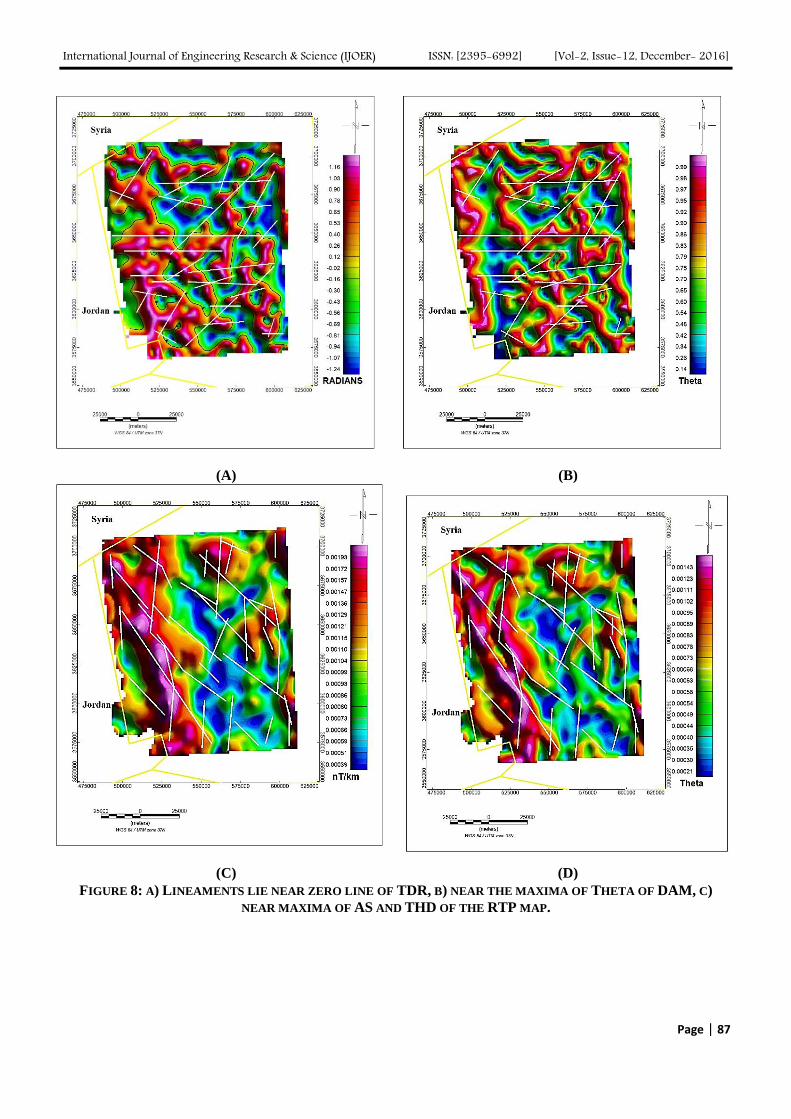
FIGURE 8: A) LINEAMENTS LIE NEAR ZERO LINE OF TDR, B) NEAR THE MAXIMA OF THETA OF DAM, C)
NEAR MAXIMA OF AS AND THD OF THE RTP MAP.

International Journal of Engineering Research & Science (IJOER) ISSN: [2395-6992] [Vol-2, Issue-12, December- 2016]
Page | 88
(A) (B)
FIGURE 9: A) LINEAMENTS OF NW-SE AND N-S AND B) LINEAMENTS OF NE-SW AND E-W TRENDS
SUPERIMPOSED OVER 3D INVERSION MAP OF THE BASEMENT.
VII. HORIZONTAL AND THETA DERIVATIVES
In Cartesian co-ordinates, the 1st horizontal derivatives are: dT/dx and dT/dy where T is the anomaly, the 2nd horizontal
derivatives are d2T/dx2 and dT
2/dy
2, dT/dx can be useful in delineating magnetic contacts. It is severely affected by the
inclination of the inducing geomagnetic field and is therefore not a good indicator of the true location of a contact until the
magnetic data have been reduced to the pole. The horizontal derivative can be simply calculated in the space domain. By
itself this is not a too useful derivative since in profile form it is directional (i.e. depending on the direction of + x the
gradient could be either negative or positive). This limits its use for mapping. Total Horizontal Derivative (THDR) as the
name suggests it measures the full horizontal gradient.
The gradients are all positive thus this derivative is easy to map. In the case of a gravity anomaly the maxima will lie close to
(not necessarily precisely over) the boundary of the structure causing the gravity anomaly. In the case of magnetic anomalies
the THDR will give an indication of the boundary but due to the complexity of the anomaly will not made mapping of the
edges of structures very easy. To make it easy the magnetic anomaly needs first to be transformed to (RTP) Reduced to pole
or to pseudo gravity. Wijns et al., (2005) propose mapping the value of cos (θ), where θ is defined as the angle to the horizontal plane of the full
vector direction of the analytic signal. Theta (θ) is actually the absolute value of the Tilt angle defined below. The value of
the cosine of either θ or the Tilt is identical. The Theta function is limited to values between 0 and 1, and peaks over a simple
vertical contact and coincides with the zero crossings of the vertical.
7.1 The Analytic Signal (AS)
The Analytic Signal AS method is similarly known as the total gradient method.

International Journal of Engineering Research & Science (IJOER) ISSN: [2395-6992] [Vol-2, Issue-12, December- 2016]
Page | 89
For grid in x, y direction
Where is the total horizontal derivative and is the vertical derivative.
An important characteristic of the (AS) is that it is essentially independent of the direction of magnetization of the
source (I). Thus, the (AS) will peak over the magnetic structure with local maxima over its edges (boundaries or
contacts). The resulting sum is positive.
It has lower resolution than total horizontal derivative THD.
The width of the highs is an indicator of the depth to the contact. The rule is that (half width at half maximum =
depth).
One can also consider that the amplitude of (AS) is simply related to amplitude of magnetization.
For qualitative interpretation, it may be preferable to have a function that produces highs over magnetic bodies. This
can be partially achieved by first integration of the total field anomaly (Nabighian, 1972, 1974) and (Nabighian,
1984).
7.2 Local Phase or Tilt Derivative (θ or TDR)
TDR is defined as follows:-
tan θ =
θ = tan-1
When analyzing potential field data the vertical derivative (VDR) and total horizontal derivative (THDR) of the
gravity and RTP magnetic data are used to map the lateral extent of anomalous density and magnetization bodies and
their edges. This is true for VDR, THDR and analytical signal (AS).
The TDR are defined as follows:-
Profile in x direction TDR = tan-1
Grid (x, y) TDR= tan-1
The zero crossing of the TDR closely delineates the edges of the structures. The major advantages of the TDR in grid are:
Its effect is amplifying weak signals and suppressing strong signals.
Its sign controlled by the VDR; this allows easy comparison between the TDR and VDR derivatives.
Thus, THDR is always positive and as a result, the comparison will be easy between VDR and TDR because they
have zero crossing.
TDR filter works in main to make some suppression for the strong signals, but make some enhancement for the weak
signals, so a study for both signals can be made (Verduzco et al., 2004).
The analytical signal and horizontal derivative of the tilt derivative are independent of inclination, and this is one of
the advantages of using these approaches to define edges of a body. It assumes the anomaly causative source has a
vertical contact and that there is no remnant magnetization (Salem et al., 2007). Among its recent application in the
International Journal of Engineering Research & Science (IJOER) ISSN: [2395-6992] [Vol-2, Issue-12, December- 2016]
Page | 90
potential field community, analytical signal and tilt-derivative have been used to compute depth-to-source, using the
simple amplitude half-width rule to estimate source characteristics (Roest et al., 1992) and (Salem et al., 2007).
VIII. RESULTS
It is observed that N-S trending negative gravity anomaly is correlated with a graben developed in the eastern part of the
study area (F) while the western and southern parts area characterized by NN-W and nearly E-W trending positive gravity
anomalies that correlated with horst respectively that correlated with uplifted basement (Figs. 5 a and 6). The significant
feature of the decompensative anomaly map is the large area that represent that separates between the maxima and the
minima (the gradient zone). In general RTP map (Fig. 4) shows good relationship if compared with that of the DAM, but
with expected intrusion body (C) and Negative anomaly (E) in the western south part of the studied area. Residuals maps for
DAM and RTP grids (Fig. 7) show different and important structures that distributed along the area. RTP map reflected the
effect of the basement rocks with clear major ring structure.
Lineaments which be related to faulting were determined using maximum values for total horizontal, analytic signal, local
wavenumber and zero contours for local phase derivatives (Salem et al. 2008, Aboud et al. 2010, Fairhead, 2010 and Figen et
al. 2015), also theta map gave good indication for determining locations of lineaments. Lineaments related with faults that
shown in (Fig. 6) are proved applying the rules mentioned above (Fig. 7 a, b, c and d). Lineament analysis for gravity and
magnetic data indicates four basement trends in the Western Desert that oriented E-W, NE–SW, N–S and NW–SE (Figs. 7).
These lineaments might show the location of reactivated basement faults. (Fig. 7) gives important lineaments in four
directions, the NW-SE and N-S group show regional lineaments that extended from outside the studied area (bounded with
yellow line), from the Eastern Desert, Saudi Arabia and Syria. The E-W trend is represented mainly strike slips faults that
plays important role in distribution of geological.. The NE-SW trend is another strike slip faults related with transverse faults
mentioned by Jassim and Goff (2006) and might be conjugated with Najd fault system, but actually there is some shift for
these faults trend that delineated from CET toward the north. Well defined E-W and NE-SW trends occur in Western Desert.
Some faults of this system have left strike slip movement in DRTP map like lineament. N–S and NW–SE trend system is
prominent in study area. N-S fault system is (Nabitah or Idsas fault system) that related with opening of Paleo-Tethys. Idsas
system separated low and high long wavelength gravity and magnetic anomalies.
Major NW-SE fault system (Najd fault system) interpreted mainly as normal faults that separate horsts and graben structures
attributed to the rifting phase that affected the Arabian plate during the Precambrian to Cambrian and that lead to the opening
of the Paleo-Tethys Ocean. The system is best compiled from magnetic and gravity interpretation of CET. It is clear that the
system is developed in left transpressional shear zone during Nabitah Orogenies (Jassim and Goff, 2007). Many of N-S
structures are offset and deformed by Najd shears.
Defining the basement topography is important to delineate the structural boundaries of the study area. It is found that the
crystalline basement depths of the study area fluctuates from 7.88 km to 10 km (Fig. 6). Before starting the inversion
procedure, haning filter is applied to remove the effect of noise. The acquired basement topography map, specified in (Fig.
6), shows that the Bouguer anomalies of the study field are properly related with the basement topography. Moreover, it is
observed that the estimated topography undulation is considerably associated with the main tectonic structure of the study
area. The observation is well-matched with the anticipation because it is known that the boundaries between the horsts and
grabens in the basement undulation are associated to the fault zones (Fig 7). It was detected that the estimated fault zones and
the basement undulation are in good correlation.
The high values of THD and AS maps display essentially NW–SE, N-S, NE-SW and E-W trending tectonic discontinuities
shown in (Fig. 7a, b, c and d). Also it is found that the zero values of the TDR in the boundaries of the grabens and the
negative values in the graben zones. It is suggested that the observed positive and negative anomalies are related with the
distribution of the Granodiorite and Murdama Molasse rocks respectively.
IX. DISCUSSION
In this study, tectonic lineaments of the western part of Iraqi Western Desert were identified using CET grid analysis and the
edge detection methods, THD, AS, and TDR. The latest three techniques are not new, but they used to prove the results of
CET grid analysis technique. The lineaments were correlated with the basement topography. Analytical signal derivative is
inclination independent; there are no effects from remanence magnetization. Maximum will also be generated above the
structure. High amplitudes are due to combination of high susceptibility and/or shallow depth, as depth increases amplitude
anomaly decreases in size. The study area is composed of secondary basins separated by elevated basement relief that show
International Journal of Engineering Research & Science (IJOER) ISSN: [2395-6992] [Vol-2, Issue-12, December- 2016]
Page | 91
higher values of (AS). Theta and total horizontal derivative show where the edges of fault structures of the basin are. They
allow to detect maximum gradients in the DRTP which are located vertically above vertical contacts, and this allows the
tectonic fabric of the basement and basin boundaries and internal basin structures to be recognized. Boundaries of many
structures were determined by two maxima that surrounded the body. Weakly magnetized source bodies will cause small
RTP derivative anomalies and the converse is true. Tilt derivative is controlled by phase spectrum which is independent of
magnetization and inclination if the data are RTP. Tilt derivative anomalies of weakly and strongly magnetized source bodies
will be seen with comparable resolution as the anomalies are normalized by tangent function. It will be better than vertical
derivative. Several detailed anomalies in RTP and DAM can be seen and study using this derivative. Zero contours helps to
outline structural edges, so zero contour line of tilt derivative will represent generally the contacts of the faults.
Fault system is drawn using CET technique in which is useful in highlighting local intensity variations, the method enhances
regions of discontinuity within aeromagnetic and gravity dat. (Fig. 7), Fault systems has important role in the distribution of
positive and negative anomalies. The gravity and RTP magnetic anomaly maps indicate several well-defined gravity and
magnetic anomalies in the Western Desert. The decompensative gravity anomaly map DAM (Fig. 5b) which probably
represents upper crustal density sources better than the other gravity maps was used to interpret the crustal structure. The
petroleum production within the Iraqi Western Desert and the chief Paleozoic reservoir rocks are sandstones of the
Ordovician Upper Khabour and Silurian Akkas Formations with the exception of the Risha field where the reservoir rocks at
the sandstones of Risha Formation. Structural features that control accumulation of petroleum are mainly northwest-trending
block-faulted anticlines that were reactivated above Precambrian basement fault blocks Fox and Ahlbrandt, 2002). The
Paleozoic traps are usually restricted be high gradient structures with small regions of closure with some traps related to
basement faulting (e.g., Akkas Field (Fox and Ahlbrandt, 2002)). In the study arae the significant feature is the occurrence of
lineaments as two crossed set and that may explain the effect of the uplifted force in this region that include Rutba Hail arch.
X. CONCLUSION
The study area is an important one because of its tectonic structure, with its resources of ground water, mines, quarries and
oil and gas. For the first time, several fault sets located in the study area are estimated. Lineaments area detected using CET
grid analysis, then THD, AS, and TDR methods under the concern of the DAM and RTP anomaly data of the area. The
lineament maps of the study area have been offered in this paper. The results are summarized as follows:
1. 3D model of the basement topography of the study field have been presented.
2. The new lineaments have been discovered using the CET grid analysis and to prove the results three approaches as the
maximum of the THD and AS maps and zero contours of the TDR maps.
3. The lineaments have been compared with the 3D inversion map of the gravity field, and four direction lineament sets
have been predicted.
4. The minima represents sedimentary basins, this case is dominated in the study area (Afif Terrane). Actually the
basement is uplifted in such location. Valleys of the study area may controlled by N-S fault system.
5. Major NW-SE fault system (Najd fault system) interpreted mainly as normal faults that separate horsts and graben
structures attributed to the rifting phase that affected the Arabian plate during the Precambrian to Cambrian and that
lead to the opening of the Paleo-Tethys Ocean. The system is best compiled from magnetic and gravity interpretation
of CET. It is clear that the system is developed in left transpressional shear zone during Nabitah Orogenies (Jassim
and Goff, 2007). Many of N-S structures are offset and deformed by Najd shears.
6. 3D inversion map of DAM shows detailed features in the study area, but these maps need constrains which are not
available now (seismic reflection controls. However, many oilfields occur at the edge of the basement blocks with low
magnetic susceptibility outside study area, It is believed that the tectonic events causing re-activation of Precambrian
basement contacts, faulting and folding of the overlying sediments causing the formation of domal oilfield structures
So maps show two main trends: NE-SW to E-W trend is represented mainly by strike slips lineaments, they represent
the transversal faults. NW-SE to N-S trend is represented mainly by normal faults that separate horsts and graben
structures attributed to the rifting phase that affected the Arabian plate during the Precambrian to Cambrian and that
lead to the opening of the Paleo-Tethys Ocean, they represent the Najd and Nabitah faults systems.
International Journal of Engineering Research & Science (IJOER) ISSN: [2395-6992] [Vol-2, Issue-12, December- 2016]
Page | 92
7. In offshore of Abu Dhabi most of the oilfields are located at the edge of the two positive magnetic anomalies and
along magnetic linear trends, suggesting that the blocks are possibly bounded by steep faults. It is hypothesized that
the faults in the basement may have triggered migration of infra-Cambrian Hormuz salt bodies, folding of the
overlying sediments and formation of domal oilfield structures (Salem, 2015) and (Ali et al, 2013), actually this is
may be the case in the study area, many expected structures that could relate with oil field lie on gradient zones in
DRTP map where there is a faults separate between different basement blocks and after reactivation of those faults
many positive structures formed in Paleozoic sediments.
8. The Western Desert affected by different stages of Orogenies as mentioned above, the main effects generated from
basement tectonic that are reactivated later for several times among different blocks. The normal faults and strike slip
faults are the dominant in the studied area, usually extension forces caused normal faults associated with horse and
graben, but it is though that the most important effect is due to transtension (phase of oblique extension) and
transpression (the later phase of oblique compression). Focusing should be along the zone that separated between any
two faulted adjacent basement blocks as several of structures align there, that later affected by strike slip faults
structures may be very good targets. Western Desert shows heavy faulted blocks, determination of them is important
for future seismic surveys, where the most important targets are surrounded by those fault systems. Divided the
Western Desert at least to three zones for more detailed gravity and magnetic studies
9. Depending on the results focusing should be on gradient zones for the purpose of oil and gas investigation speciously
around anomalies (A, B, C and E), (Fig. 4)
REFERENCES
[1] Al-Amiri, H.M., 1978. Structural interpretation of Landsat satellite imagery for Western Desert of Iraq. GEOSURV, Int. Report.
Baghdad.
[2] Ali, M.Y., Watts, A.B. and Farid, A., 2013. Gravity anomalies of the United Arab Emirates: Implications for basement structures and
infra-Cambrian salt distribution. GeoArabia, Vol.18, No.4, p.49-80.
[3] Aqrawi, A.A.M., Goff, J.C., Horbury, A.D., Sadooni, F.N., 2010. The petroleum geology of Iraq, Scientific Press, UK, 424P.
[4] Compagnie General De Geophysique (C.G.G,), 1974. Aeromagnetic and aerospectrometric survey of Iraq, GEOSURV, Int. report.
[5] Fairhead, J. D., 2011, Gravity and Magnetics in today's oil and minerals industry GETECH / Univ. of Leeds.
[6] Fouad, S.F.A., 2007, Tectonic and structural evolution, Iraqi Bulleten of Geology and Mining, special Issue, Geology of Iraqi Western
desert, p. 29-50.
[7] Hamza, N.M., 2007, Geomorphology, Iraqi Bulleten of Geology and Mining, special Issue, Geology of Iraqi Western desert, pp. 9-27.
[8] Hinze, W. J., Ed., 1985. The Utility of Regional Gravity and Magnetic Anomaly Maps: SEG.
[9] Jassim, S.Z., Goff, J.C. (Eds.). Geology of Iraq, Dolin, Prague and Moravian Museum, Brno, Czech Republic, pp.341.
[10] .Fox, J., Ahlbrandt, T. S., 2002. Petroleum geology and total petroleum systems of the Widyan
[11] Basin and Interior Platform of Saudi Arabia and Iraq. USGS Bulletin 2202-E.
[12] Nabighian, M. N., 1972. The analytic signal of two -dimensional magnetic bodies with polygonal cross-section - Its properties and use
for automated anomaly interpretation: Geophysics, 37, 507-517.
[13] Nabighian, M. N., 1974. Additional comments on the analytic signal of two -dimensional magnetic bodies with polygonal cross-
section: Geophysics, 39, 85-92.
[14] Nabighian, M. N., 1984. Toward a three -dimensional automatic interpretation of potential field data via generalized Hilbert
transforms - Fundamental relations: Geophysics, 49, 780-786.
[15] Rost, W.R., Verhoef, J. and Pilkington, M., 1992. Magnetic interpretation using the 3-D analytic signal GEOPHYSICS, Vol. 57, no.
1, p. 116-125
[16] Salem, A., Williams, J. D. Fairhead, D. Ravat, and R. Smith, 2007, Tilt-depth method: A simple depth estimation method using first-
order magnetic derivatives: The Leading Edge.
[17] Spector, A., Grant, F., 1970. Statistical models for interpreting magnetic data, Geophysics, Vol. p. 35, 293-302.
[18] Stern, R., 2002, Crustal evolution of the East African Orogen: a neodymium isotopic perspective.
[19] J. Afr. Earth Sci., 34, 109-117.
[20] Wijns, C., Perez, C., Kowalczyk and P. (2005) Theta map: edge detection in magnetic data. Geophysics, Vol.70, no.4, p. 39– 43.
[21] Verduzco, B., Green, C.M. and Mackenzie, C., 2004. New insights into magnetic derivatives for structural mapping. THE METER
READER Coordinated by John Peirce.
Recommended