TAPESTRYSEGMENTATION
TM
esri.com/tapestry
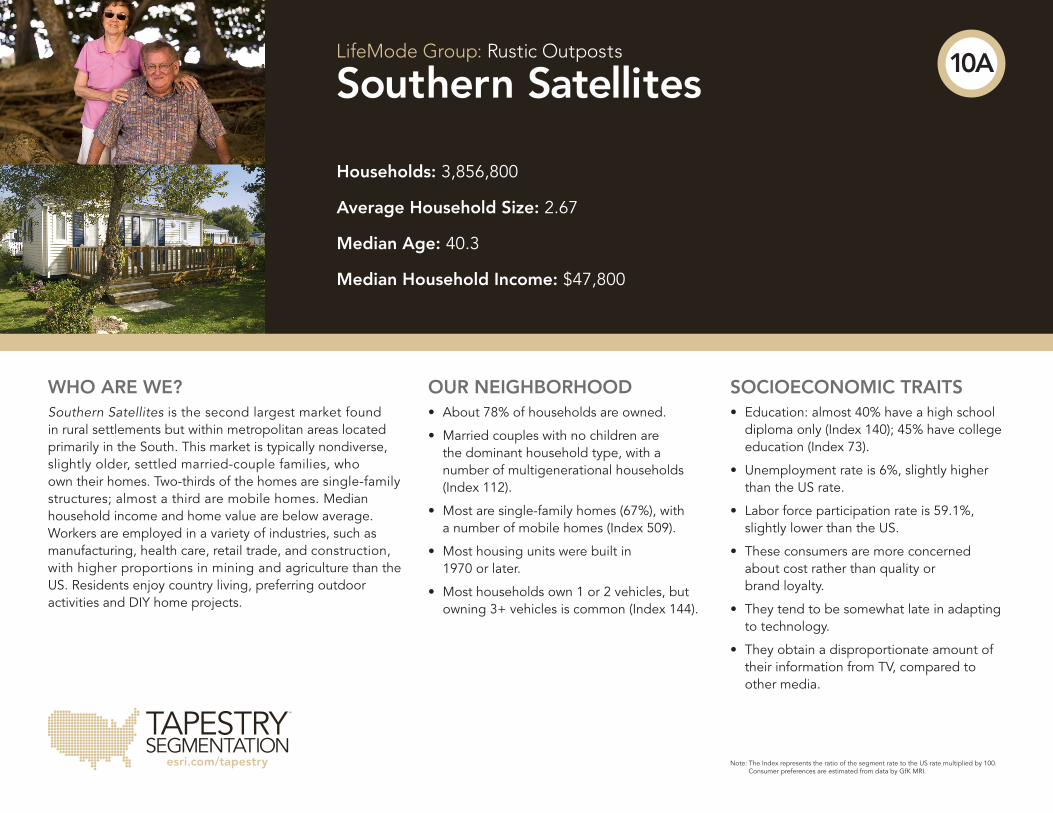
Households: 3,856,800
Average Household Size: 2.67
Median Age: 40.3
Median Household Income: $47,800
LifeMode Group: Rustic Outposts
Southern Satellites
WHO ARE WE?Southern Satellites is the second largest market found in rural settlements but within metropolitan areas located primarily in the South. This market is typically nondiverse, slightly older, settled married-couple families, who own their homes. Two-thirds of the homes are single-family structures; almost a third are mobile homes. Median household income and home value are below average. Workers are employed in a variety of industries, such as manufacturing, health care, retail trade, and construction, with higher proportions in mining and agriculture than the US. Residents enjoy country living, preferring outdoor activities and DIY home projects.
OUR NEIGHBORHOOD• About 78% of households are owned.
• Married couples with no children are the dominant household type, with a number of multigenerational households (Index 112).
• Most are single-family homes (67%), with a number of mobile homes (Index 509).
• Most housing units were built in 1970 or later.
• Most households own 1 or 2 vehicles, but owning 3+ vehicles is common (Index 144).
SOCIOECONOMIC TRAITS• Education: almost 40% have a high school diploma only (Index 140); 45% have college education (Index 73).
• Unemployment rate is 6%, slightly higher than the US rate.
• Labor force participation rate is 59.1%, slightly lower than the US.
• These consumers are more concerned about cost rather than quality or brand loyalty.
• They tend to be somewhat late in adapting to technology.
• They obtain a disproportionate amount of their information from TV, compared to other media.
Note: The Index represents the ratio of the segment rate to the US rate multiplied by 100. Consumer preferences are estimated from data by GfK MRI.
10A
TAPESTRYSEGMENTATION
TM
esri.com/tapestry
LifeMode Group: Rustic Outposts
Southern Satellites10A
85+80–8475–7970–7465–6960–6455–5950–5445–4940–4435–3930–3425–2920–2415–1910–14
5–9<5
8% 4% 0 4% 8%
Male Female
Median Household Income
Median Net Worth
$56,100
$93,300
$47,800
$94,900
$0 $100,000 $200,000 $300,000 $400,000 $500,000 $600,000
EsriMedianHHIncome
EsriMedianNetWorth
Series2 Series1
$56,100
$93,300
$47,800
$94,900
$0 $100,000 $200,000 $300,000 $400,000 $500,000 $600,000
EsriMedianHHIncome
EsriMedianNetWorth
Series2 Series1
Housing
Food
Apparel & Services
Transportation
Health Care
Entertainment & Recreation
Education
Pensions & Social Security
Other
0.0% 0.5% 1.0% 1.5% 2.0% 2.5% 3.0% 3.5% 4.0%
MaleAge0-4
MaleAge5-9
MaleAge10-14
MaleAge15-19
MaleAge20-24
MaleAge25-29
MaleAge30-34
MaleAge35-39
MaleAge40-44
MaleAge45-49
MaleAge50-54
MaleAge55-59
MaleAge60-64
MaleAge65-69
MaleAge70-74
MaleAge75-79
MaleAge80-84
MaleAge85+
AgebySex- Male
Series2 Series1
0.0% 0.5% 1.0% 1.5% 2.0% 2.5% 3.0% 3.5% 4.0%
FemaleAge0-4
FemaleAge5-9
FemaleAge10-14
FemaleAge15-19
FemaleAge20-24
FemaleAge25-29
FemaleAge30-34
FemaleAge35-39
FemaleAge40-44
FemaleAge45-49
FemaleAge50-54
FemaleAge55-59
FemaleAge60-64
FemaleAge65-69
FemaleAge70-74
FemaleAge75-79
FemaleAge80-84
FemaleAge85+
ChartTitle
Series2 Series1
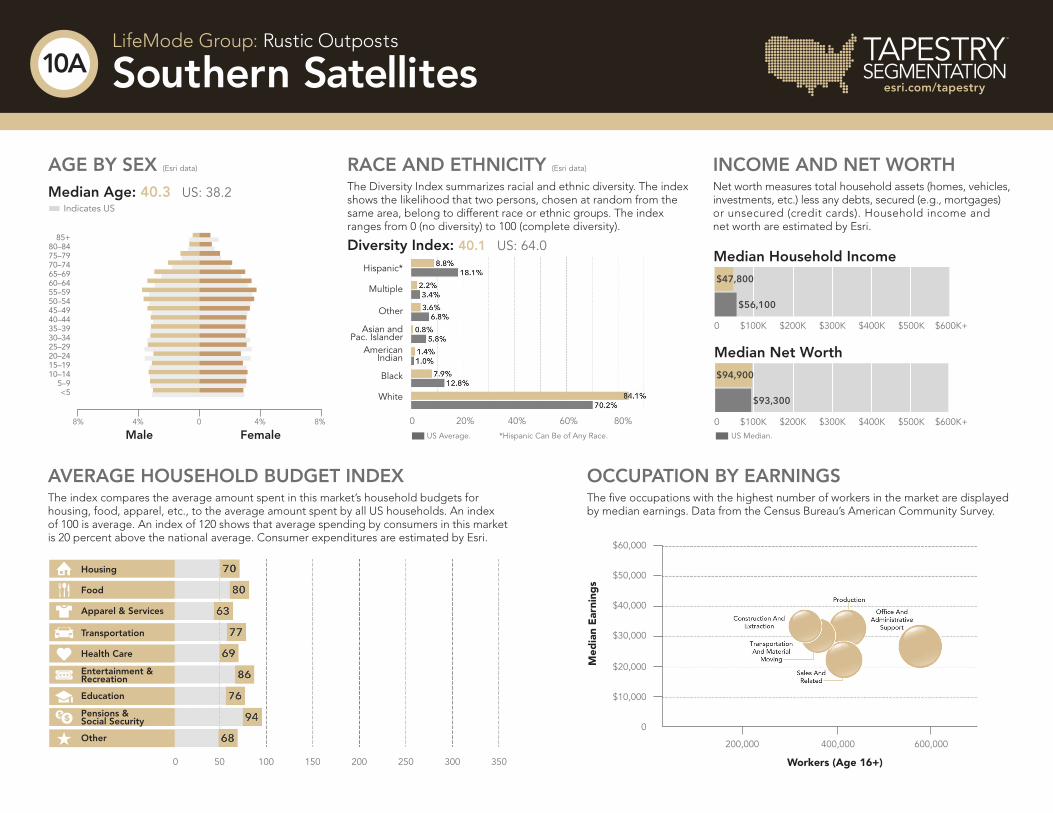
INCOME AND NET WORTHNet worth measures total household assets (homes, vehicles, investments, etc.) less any debts, secured (e.g., mortgages) or unsecured (credit cards). Household income and net worth are estimated by Esri.
OCCUPATION BY EARNINGSThe five occupations with the highest number of workers in the market are displayed by median earnings. Data from the Census Bureau’s American Community Survey.
AVERAGE HOUSEHOLD BUDGET INDEXThe index compares the average amount spent in this market’s household budgets for housing, food, apparel, etc., to the average amount spent by all US households. An index of 100 is average. An index of 120 shows that average spending by consumers in this market is 20 percent above the national average. Consumer expenditures are estimated by Esri.
AGE BY SEX (Esri data)
Median Age: 40.3 US: 38.2 Indicates US
RACE AND ETHNICITY (Esri data)
The Diversity Index summarizes racial and ethnic diversity. The index shows the likelihood that two persons, chosen at random from the same area, belong to different race or ethnic groups. The index ranges from 0 (no diversity) to 100 (complete diversity).
Diversity Index: 40.1 US: 64.0
Hispanic*
Multiple
Other
Asian and Pac. Islander
American Indian
Black
White
$60,000
$50,000
$40,000
$30,000
$20,000
$10,000
0
200,000 400,000 600,000
*Hispanic Can Be of Any Race.
0 20% 40% 60% 80%
0 50 100 150 200 250 300 350
0 $100K $200K $300K $400K $500K $600K+
0 $100K $200K $300K $400K $500K $600K+US Average. US Median.
Med
ian
Ear
ning
s
Workers (Age 16+)
Own77.7%
Rent22.3%
ChartTitle
Own Rent
Population
Population Growth (Annual %)
Population Density (Persons per sq. mile)
350
350
350
0
0
0
900,000
-0.5%
0
11,000,000
3.0%
25,000
10,404,500
0.7%
1000
Wealth Index
Socioeconomic Status Index
Housing Affordability Index
91
71
18451
HomeOwnershipUS Percentage:
62.7% Own 37.3% Rent
TAPESTRYSEGMENTATION
TM
esri.com/tapestry
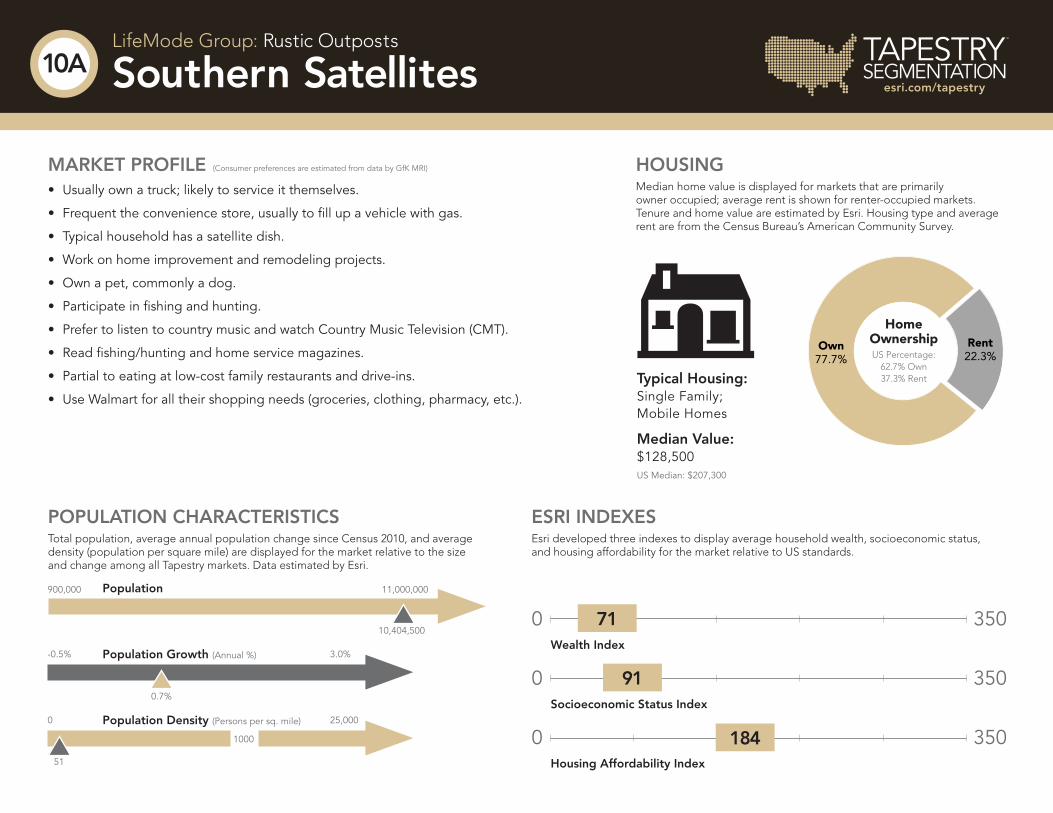
MARKET PROFILE (Consumer preferences are estimated from data by GfK MRI)
• Usually own a truck; likely to service it themselves.
• Frequent the convenience store, usually to fill up a vehicle with gas.
• Typical household has a satellite dish.
• Work on home improvement and remodeling projects.
• Own a pet, commonly a dog.
• Participate in fishing and hunting.
• Prefer to listen to country music and watch Country Music Television (CMT).
• Read fishing/hunting and home service magazines.
• Partial to eating at low-cost family restaurants and drive-ins.
• Use Walmart for all their shopping needs (groceries, clothing, pharmacy, etc.).
ESRI INDEXESEsri developed three indexes to display average household wealth, socioeconomic status, and housing affordability for the market relative to US standards.
POPULATION CHARACTERISTICSTotal population, average annual population change since Census 2010, and average density (population per square mile) are displayed for the market relative to the size and change among all Tapestry markets. Data estimated by Esri.
LifeMode Group: Rustic Outposts
Southern Satellites10A
HOUSINGMedian home value is displayed for markets that are primarily owner occupied; average rent is shown for renter-occupied markets. Tenure and home value are estimated by Esri. Housing type and average rent are from the Census Bureau’s American Community Survey.
Typical Housing:Single Family; Mobile Homes
Median Value:$128,500US Median: $207,300
High
Low
TAPESTRYSEGMENTATION
TM
esri.com/tapestry
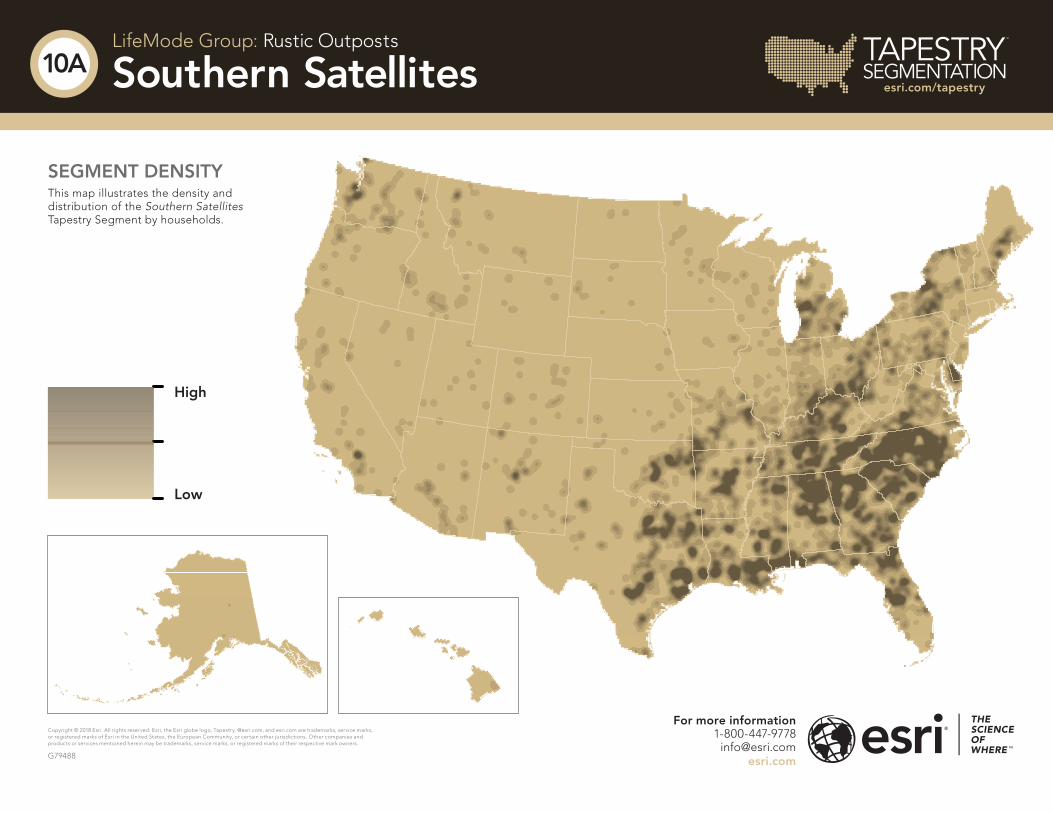
SEGMENT DENSITYThis map illustrates the density and distribution of the Southern Satellites Tapestry Segment by households.
LifeMode Group: Rustic Outposts
Southern Satellites10A
For more information1-800-447-9778
Copyright © 2018 Esri. All rights reserved. Esri, the Esri globe logo, Tapestry, @esri.com, and esri.com are trademarks, service marks, or registered marks of Esri in the United States, the European Community, or certain other jurisdictions. Other companies and products or services mentioned herein may be trademarks, service marks, or registered marks of their respective mark owners.
G79488
Recommended