LIFE CYCLE IMPACTS OF PLASTIC PACKAGING COMPARED TO
SUBSTITUTES IN THE UNITED STATES AND CANADA Theoretical Substitution Analysis
PREPARED FOR
The Plastics Division of the American Chemistry Council (ACC)
BY
Franklin Associates, A Division of Eastern Research Group (ERG)
April 2018

CLIENTS\ACC\KC182695 04.18.18 4103.00.001
ii
Table of Contents
EXECUTIVE SUMMARY .................................................................................................................... 1
ES.1. INTRODUCTION & BACKGROUND....................................................................................... 1 ES.2. METHODOLOGY ..................................................................................................................... 3
ES.2.1. Functional Unit ................................................................................................................... 3 ES.2.2. Product Systems Studied ..................................................................................................... 4 ES.2.3. Data Sources ....................................................................................................................... 8 ES.2.4. Reuse & Recycling Modeling Approach .............................................................................. 8 ES.2.5. Key Assumptions ................................................................................................................ 9
ES.3. KEY FINDINGS ...................................................................................................................... 10
CHAPTER 1. GOAL & SCOPE DEFINITION .................................................................................. 17
1.1. GOAL ......................................................................................................................................... 17 1.2. SCOPE OF THE STUDY ............................................................................................................ 18
1.2.1. Functional Unit .................................................................................................................... 18 1.2.2. Product Systems Studied ...................................................................................................... 19 1.2.3. System Boundary ................................................................................................................. 23 1.2.4. Allocation Procedures .......................................................................................................... 27 1.2.5. Recycling Methodology ....................................................................................................... 27 1.2.6. Data Requirements ............................................................................................................... 30 1.2.7. Data Sources ........................................................................................................................ 32 1.2.8. Impact Assessment............................................................................................................... 37 1.2.9. Assumptions and Limitations ............................................................................................... 41 1.2.10. Critical Review of the Substitution Model Methodology ..................................................... 46
CHAPTER 2. SUBSTITUTION MODEL............................................................................................ 47
2.1. INTRODUCTION ....................................................................................................................... 47 2.1.1. Similarities .......................................................................................................................... 47 2.1.2. Differences .......................................................................................................................... 48
2.2. SUBSTITUTION MODEL OVERVIEW..................................................................................... 49 2.3. OTHER RIGID PACKAGING MARKETS ................................................................................. 55
2.3.1. Introduction ......................................................................................................................... 55 2.3.2. Non-Bulk Rigid Packaging ................................................................................................... 55 2.3.3. Rigid Protective Packaging .................................................................................................. 58 2.3.4. Rigid Bulk Packaging .......................................................................................................... 60
2.4. OTHER FLEXIBLE PACKAGING MARKETS.......................................................................... 66 2.4.1. Introduction ......................................................................................................................... 66 2.4.2. Converted Flexible Packaging .............................................................................................. 66 2.4.3. Flexible Protective Packaging .............................................................................................. 69 2.4.4. Flexible Bulk Packaging ...................................................................................................... 71
2.5. BEVERAGE PACKAGING MARKETS ..................................................................................... 78 2.6. CARRIER BAGS PACKAGING MARKETS.............................................................................. 84 2.7. CAPS AND CLOSURES MARKETS ......................................................................................... 88
2.7.1. Simultaneous Substitution Analysis ...................................................................................... 91 2.8. SHRINK AND STRETCH FILM PACKAGING MARKETS ...................................................... 95
CHAPTER 3. LIFE CYCLE INVENTORY ...................................................................................... 100
3.1. OVERVIEW ............................................................................................................................. 100 3.1.1. Methodology for Data Compilation/Verification ................................................................. 100
3.2. COMPARISON OF PACKAGING SYSTEM DISTRIBUTION SPECIFICATIONS ................. 100 3.3. PLASTIC PACKAGING SYSTEMS ......................................................................................... 101
3.3.1. Production of Plastic Resins ............................................................................................... 101 3.3.2. Plastic Converting Processes .............................................................................................. 101
CLIENTS\ACC\KC182695 04.18.18 4103.00.001
iii
3.4. NON-PLASTIC PACKAGING SYSTEMS ............................................................................... 103 3.4.1. Steel Packaging .................................................................................................................. 103 3.4.2. Aluminum Packaging ......................................................................................................... 105 3.4.3. Glass Packaging ................................................................................................................. 107 3.4.4. Paper, Paperboard, & Corrugated Packaging....................................................................... 108 3.4.5. Cork, Rubber, Textile, Wood, and Cellophane Packaging ................................................... 111
3.5. RECYCLING & END-OF-LIFE WASTE MANAGEMENT ..................................................... 112 3.5.1. Plastic Recycling ............................................................................................................... 112 3.5.2. Alternative Packaging Recycling ........................................................................................ 115 3.5.3. Disposal ............................................................................................................................. 126
CHAPTER 4. RESULTS FOR PACKAGING SYSTEMS ................................................................ 128
4.1. INTRODUCTION ..................................................................................................................... 128 4.2. COMPARATIVE WEIGHTS .................................................................................................... 128 4.3. OVERVIEW OF RESULTS ...................................................................................................... 130 4.4. ENERGY RESULTS................................................................................................................. 134
4.4.1. Cumulative Energy Demand............................................................................................... 134 4.4.2. Expended Energy ............................................................................................................... 136
4.5. WATER CONSUMPTION RESULTS ...................................................................................... 140 4.6. SOLID WASTE RESULTS ....................................................................................................... 142
4.6.1. Weight of Solid Waste ....................................................................................................... 142 4.6.2. Volume of Solid Waste ...................................................................................................... 145
4.7. GWP RESULTS........................................................................................................................ 147 4.8. ACIDIFICATION POTENTIAL RESULTS .............................................................................. 150 4.9. EUTROPHICATION POTENTIAL RESULTS ......................................................................... 153 4.10. SMOG FORMATION POTENTIAL ....................................................................................... 155 4.11. OZONE DEPLETION POTENTIAL ....................................................................................... 157 4.12. EQUIVALENTS ..................................................................................................................... 159 4.13. SUMMARY ............................................................................................................................ 160
List of Tables
Table ES–1. Functional Unit of Comparison for Investigated Packaging Categories ................................... 4 Table ES–2. Environmental Indicators Evaluated .................................................................................... 11 Table ES–3. Plastic Packaging Results Compared to Substitutes .............................................................. 14 Table ES–4. Summary of Savings for Plastic Packaging Compared to Substitutes .................................... 15 Table ES–5. Savings Equivalents for Plastic Packaging Compared to Substitutes ..................................... 16
Table 1-1. Functional Unit of Comparison for Investigated Packaging Categories .................................... 19 Table 1-2. Details on Contents of Plastic Packaging Categories ............................................................... 21 Table 1-3. Summary of Data Sources ...................................................................................................... 34 Table 1-4. Environmental Indicators Evaluated ....................................................................................... 38 Table 2-1. Differences in Packaging Categories Investigated in the Current North American and 2010
European Analyses ................................................................................................................................. 49 Table 2-2. Investigated Packaging Categories and Overview of US Plastic Packaging .............................. 51 Table 2-3. Investigated Packaging Categories and Overview of Canadian Plastic Packaging .................... 51 Table 2-4. Details on Contents of Plastic Packaging Categories ............................................................... 52 Table 2-5. US Other Rigid Packaging - Current Market Share by Material ............................................... 62 Table 2-6. US Other Rigid Packaging - Substitution Weights by Material ................................................ 63 Table 2-7. Canadian Other Rigid Packaging - Current Market Share by Material ..................................... 64 Table 2-8. Canadian Other Rigid Packaging - Substitution Weights by Material ...................................... 65 Table 2-9. US Other Flexible Plastic Packaging - Current Market Share by Material ................................ 74 Table 2-10. US Other Flexible Packaging - Substitution Weights by Material .......................................... 75 Table 2-11. Canadian Other Flexible Plastic Packaging - Current Market Share by Material .................... 76 Table 2-12. Canadian Other Flexible Packaging - Substitution Weights by Material................................. 77

CLIENTS\ACC\KC182695 04.18.18 4103.00.001
iv
Table 2-13. US Beverage Containers - Current Market Share by Material ................................................ 80 Table 2-14. US Beverage Containers - Substitution Weights by Material ................................................. 81 Table 2-15. Canadian Beverage Containers - Current Market Share by Material....................................... 82 Table 2-16. Canadian Beverage Containers - Substitution Weights by Material........................................ 83 Table 2-17. US Carrier/Retail Bags - Current Market Share by Material .................................................. 86 Table 2-18. US Carrier/Retail Bags - Substitution Weights by Material ................................................... 86 Table 2-19. Canadian Carrier/Retail Bags - Current Market Share by Material ......................................... 87 Table 2-20. Canadian Carrier/Retail Bags - Substitution Weights by Material .......................................... 87 Table 2-21. US Caps & Closures - Current Market Share by Material ...................................................... 93 Table 2-22. US Caps & Closures - Substitution Weights by Material ....................................................... 93 Table 2-23. Canadian Caps & Closures - Current Market Share by Material ............................................ 94 Table 2-24. Canadian Caps & Closures - Substitution Weights by Material.............................................. 94 Table 2-25. US Stretch & Shrink Film - Current Market Share by Material .............................................. 98 Table 2-26. US Stretch & Shrink Film - Substitution Weights by Material ............................................... 98 Table 2-27. Canadian Stretch & Shrink Film - Current Market Share by Material .................................... 99 Table 2-28. Canadian Stretch & Shrink Film - Substitution Weights by Material...................................... 99 Table 3-1. Electricity Grids Specific to Steps in the Production of Primary Aluminum ........................... 106 Table 3-2. Bauxite Sourcing & Alumina Production by Country ............................................................ 106 Table 3-3. Recovery Rates for US Plastic and Substitute Packaging ....................................................... 122 Table 3-4. Recovery Rates for Canadian Plastic and Substitute Packaging ............................................. 124 Table 3-5. National Waste Management Statistics ................................................................................. 126 Table 4-1. Weights of US Plastic and Substitute Packaging ................................................................... 128 Table 4-2. Weights of Canadian Plastic and Substitute Packaging .......................................................... 129 Table 4-3. Example Calculation of Life Cycle Energy Results for US Carrier Bags ................................ 129 Table 4-4. Cumulative Energy Demand for US Plastic Packaging and Substitutes (billion MJ)............... 135 Table 4-5. Cumulative Energy Demand for Canadian Plastic Packaging and Substitutes (billion MJ) ..... 135 Table 4-6. Expended Energy for US Plastic Packaging and Substitutes (billion MJ) ............................... 137 Table 4-7. Expended Energy for Canadian Plastic Packaging and Substitutes (billion MJ) ..................... 138 Table 4-8. Water Consumption for US Plastic Packaging and Substitutes .............................................. 141 Table 4-9. Water Consumption for Canadian Plastic Packaging and Substitutes (thousand cubic meters) 141 Table 4-10. Solid Waste by Weight for US Plastic Packaging and Substitutes (thousand metric tonnes) . 143 Table 4-11. Solid Waste by Weight for Canadian Plastic Packaging and Substitutes (thousand metric
tonnes) ................................................................................................................................................. 144 Table 4-12. Solid Waste by Volume for US Plastic Packaging and Substitutes (million cubic meters) .... 146 Table 4-13. Solid Waste by Volume for Canadian Plastic Packaging and Substitutes (million cubic meters)
............................................................................................................................................................ 146 Table 4-14. GWP Results for US Plastic and Substitute Packaging (million metric tonnes CO2 eq) ........ 149 Table 4-15. GWP Results for Canadian Plastic and Substitute Packaging (million metric tonnes CO2 eq) 149 Table 4-16. Acidification Potential for US Plastic Packaging and Substitutes (thousand metric tonnes SO2
eq) ........................................................................................................................................................ 151 Table 4-17. Acidification Potential for Canadian Plastic Packaging and Substitutes (thousand metric tonnes
SO2 eq) ................................................................................................................................................. 152 Table 4-18. Eutrophication Potential for US Plastic Packaging and Substitutes (thousand metric tonnes N
eq) ........................................................................................................................................................ 154 Table 4-19. Eutrophication Potential for Canadian Plastic Packaging and Substitutes (thousand metric
tonnes N eq) ......................................................................................................................................... 154 Table 4-20. Smog Formation Potential for US Plastic Packaging and Substitutes (thousand metric tonnes O3
eq) ........................................................................................................................................................ 156 Table 4-21. Smog Formation Potential for Canadian Plastic Packaging and Substitutes (thousand metric
tonnes O3 eq) ........................................................................................................................................ 156 Table 4-22. Ozone Depletion Potential for US Plastic Packaging and Substitutes (metric tonnes CFC-11 eq) ............................................................................................................................................................ 158 Table 4-23. Ozone Depletion Potential for Canadian Plastic Packaging and Substitutes (metric tonnes CFC-
11 eq) ................................................................................................................................................... 158 Table 4-24. Savings Equivalents for Plastic Packaging Compared to Substitutes .................................... 160
CLIENTS\ACC\KC182695 04.18.18 4103.00.001
v
List of Figures
Figure ES–1. Thermoplastic Resins Demand in Packaging vs. Non-Packaging Markets – 2007-2011 ......... 1 Figure ES–2. Packaging Products System Boundaries ............................................................................... 7 Figure ES–3. Normalized US Results for Plastic Packaging and Substitutes ............................................. 12 Figure ES–4. Normalized Canadian Results for Plastic Packaging and Substitutes ................................... 13
Figure 1-1. Packaging Product System Boundaries .................................................................................. 25 Figure 1-2. System Expansion Recycling Method (100% Recycling) ....................................................... 30 Figure 4-1. Normalized US Results for Plastic Packaging and Substitutes .............................................. 131 Figure 4-2. Normalized Canadian Results for Plastic Packaging and Substitutes .................................... 132 Figure 4-3. Cumulative Energy Demand by Category for US Plastic Packaging and Substitutes (billion MJ)
............................................................................................................................................................ 136 Figure 4-4. Cumulative Energy Demand by Category for Canadian Plastic Packaging and Substitutes
(billion MJ) .......................................................................................................................................... 136 Figure 4-5. Expended Energy by Category for US Plastic Packaging and Substitutes (billion MJ) .......... 138 Figure 4-6. Expended Energy by Category for Canadian Plastic Packaging and Substitutes (billion MJ). 139 Figure 4-7. Expended Energy as a Percent of Total Energy for US Plastic Packaging and Substitutes ..... 139 Figure 4-8. Expended Energy as a Percent of Total Energy for Canadian Plastic Packaging and Substitutes
............................................................................................................................................................ 140 Figure 4-9. Water Consumption by Category for US Plastic Packaging and Substitutes (thousand cubic
meters) ................................................................................................................................................. 142 Figure 4-10. Water Consumption for Canadian Plastic Packaging and Substitutes (thousand cubic meters)
............................................................................................................................................................ 142 Figure 4-11. Solid Waste by Weight by Category for US Plastic Packaging and Substitutes (thousand
metric tonnes) ....................................................................................................................................... 144 Figure 4-12. Solid Waste by Weight by Category for Canadian Plastic Packaging and Substitutes (thousand
metric tonnes) ....................................................................................................................................... 145 Figure 4-13. Solid Waste by Volume by Category for US Plastic Packaging and Substitutes (million cubic meters) ................................................................................................................................................. 147 Figure 4-14. Solid Waste by Volume by Category for Canadian Plastic Packaging and Substitutes (million
cubic meters) ........................................................................................................................................ 147 Figure 4-15. GWP Results by Category for US Plastic Packaging and Substitutes (million metric tonnes
CO2 eq) ................................................................................................................................................ 150 Figure 4-16. GWP Results by Category for Canadian Plastic Packaging and Substitutes (million metric
tonnes CO2 eq) ..................................................................................................................................... 150 Figure 4-17. Acidification Potential by Category for US Plastic Packaging and Substitutes (thousand metric
tonnes SO2 eq) ...................................................................................................................................... 152 Figure 4-18. Acidification Potential by Category for Canadian Plastic Packaging and Substitutes (thousand
metric tonnes SO2 eq) ........................................................................................................................... 153 Figure 4-19. Eutrophication Potential by Category for US Plastic Packaging and Substitutes (thousand
metric tonnes N eq) .............................................................................................................................. 155 Figure 4-20. Eutrophication Potential by Category for Canadian Plastic Packaging and Substitutes
(thousand metric tonnes N eq) ............................................................................................................... 155 Figure 4-21. Smog Formation Potential by Category for US Plastic Packaging and Substitutes (thousand
metric tonnes O3 eq) ............................................................................................................................. 157 Figure 4-22. Smog Formation Potential by Category for Canadian Plastic Packaging and Substitutes
(thousand metric tonnes O3 eq) ............................................................................................................. 157 Figure 4-23. Ozone Depletion Potential by Category for US Plastic Packaging and Substitutes (metric
tonnes CFC-11 eq) ................................................................................................................................ 159 Figure 4-24. Ozone Depletion Potential by Category for Canadian Plastic Packaging and Substitutes
(metric tonnes CFC-11 eq) .................................................................................................................... 159
CLIENTS\ACC\KC182695 04.18.18 4103.00.001
vi
Preface
This work is an expansion and update of an energy and greenhouse gas analysis conducted
in 2014 for The Plastics Division of the American Chemistry Council (ACC) and the
Canadian Plastics Industry Association (CPIA) under the direction of Mike Levy for ACC,
Cathy Cirko and Fred Edgecombe for CPIA, and Ashley Carlson of Ashley Carlson
Consulting. Emily Tipaldo of ACC provided leadership for the expanded version of the
analysis. We gratefully acknowledge their assistance in the development of this report.
At Franklin Associates, the project to expand the scope of the analysis to include additional
environmental impacts was led by Beverly Sauer, Senior Chemical Engineer and Project
Manager, who served as reviewer of the original substitution model and report, as well as
assisting with modeling and writeup of results in both the original study and the expanded
study. For the original substitution analysis, Rebe Feraldi was the lead in developing the
substitution model and writeup and conducted the majority of the modeling with assistance
from Janet Mosley. Shelly Schneider and Anne Marie Molen assisted with research tasks
and development of the report. Lori Snook contributed to report preparation tasks.
Franklin Associates gratefully acknowledges significant contributions to the original
substitution analysis project by external reviewers Harald Pilz of Denkstatt GmbH and
Roland Hischier of the Empa Research Institute. Revisions made in response to their
review comments improved the quality and transparency of the report.
The work was performed by Franklin Associates, A Division of ERG as an independent
contractor. The findings and conclusions are strictly those of Franklin Associates acting in
this role. Franklin Associates makes no statements nor supports any conclusions other than
those presented in this report.
April 2018

CLIENTS\ACC\KC182695 04.18.18 4103.00.001
vii
List of Acronyms (Alphabetical)
ACC American Chemistry Council
CPIA Canadian Plastics Industry Association
CED Cumulative Energy Demand
DC Distribution Center
EGRID Emissions & Generation Resource Integrated Database
EMR Energy of Material Resource
EOL End of Life
ERG Eastern Research Group, Inc.
EQ Equivalents
EPS Expanded Polystyrene
GHG Greenhouse Gas
GWP Global Warming Potential
HDPE High Density Polyethylene
IEA International Energy Agency
IPCC Intergovernmental Panel on Climate Change
ISBM Injection Stretch Blow Molding
ISO International Organization for Standardization
LCA Life Cycle Assessment
LCI Life Cycle Inventory
LCIA Life Cycle Impact Assessment
LDPE Low Density Polyethylene
LF Landfill
LMOP Landfill Methane Outreach Program
NREL National Renewable Energy Laboratory

CLIENTS\ACC\KC182695 04.18.18 4103.00.001
viii
ODP Ozone Depletion Potential
PC Postconsumer
PET Polyethylene Terephthalate
PP Polypropylene
PS Polystyrene
PVC Polyvinyl Chloride
TRACI Tool for the Reduction and Assessment of Chemical and Other Environmental
Impacts
WTE Waste-to-Energy Incineration

CLIENTS\ACC\KC182695 04.18.18 4103.00.001
ix
Terms and Definitions (Alphabetical)
Acidification Potential— potential of emissions such as sulfur dioxide and nitrogen oxides to result in acid rain, with damaging effects on ecosystems and buildings.
Allocation—partitioning the input or output flows of a process or a product system between the
product system under study and one or more other product systems.
Biomass—the total dry organic matter or stored energy content of living organisms that is present
at a specific time in a defined unit of the Earth's surface. As an energy source, the Energy Information Administration defines biomass as organic non-fossil material of biological origin
constituting a renewable energy source.
Carbon Sequestration—removal of carbon from the atmosphere.1
Carbon Storage—retaining carbon of biogenic or atmospheric origin in a form other than as an
atmospheric gas.2 In this analysis, carbon storage occurs when packaging materials containing biogenic carbon are disposed in a landfill and do not decompose.
Characterization Factor—factor derived from a characterization model which is applied to
convert an assigned life cycle inventory analysis result to the common unit of the category indicator.
Closed-Loop Recycling—transformation of a recovered material into an equivalent form (e.g.
recycled product is equivalent to product in previous life, no loss in inherent material properties), and/or use of postconsumer recycled material as an input to the same type of product system from
which the material was recovered.
Combustion Energy—the higher heat value directly released when coal, fuel oil, natural gas, or
biomass is burned for energy consumption.
Co-product—any of two or more products coming from the same unit process or product system.
Cradle-to-Material—refers to an LCA or LCI covering life cycle stages from raw material
extraction through raw material production (i.e. does not cover entire life cycle of a product system).
Cradle-to-Grave—an LCA or LCI covering all life cycle stages of a product system from raw
material extraction through end-of-life and recycling when applicable.
End-of-Life—refers to the life cycle stage of a product following disposal.
Energy Demand—energy requirements of a process/product, including energy from renewable
and non-renewable resources). In this study, energy demand is measured by the higher heating
value of the fuel at point of extraction.
1 Definition from PAS 2050: 2008, Specifications for the assessment of the life cycle greenhouse gas
(GHG) emissions of goods and services. 2 Definition from PAS 2050: 2008, Specifications for the assessment of the life cycle greenhouse gas
(GHG) emissions of goods and services.

CLIENTS\ACC\KC182695 04.18.18 4103.00.001
x
Energy of Material Resource—the energy value of fuel resources withdrawn from the planet’s
finite fossil reserves and used as material inputs. Some of this energy remains embodied in the
material and can potentially be recovered. Alternative terms used by other LCA practitioners include “Feedstock Energy” and “Inherent Energy.”
Eutrophication Potential—assesses the potential of nutrient releases to the environment to decrease oxygen content in bodies of water, which can lead to detrimental effects such as algal
blooms and fish kills.
Expended Energy—energy that has been consumed (e.g., through combustion) and is no longer recoverable
Fossil Fuel—fuels with high carbon content from natural processes (e.g. decomposition of buried dead organisms) that are created over a geological time frame (e.g. millions of years). Natural gas,
petroleum and coal are examples of fossil fuels.
Fugitive Emissions—unintended leaks of substances that escape to the environment without
treatment. These are typically from the processing, transmission, and/or transportation of fossil
fuels, but may also include leaks and spills from reaction vessels, other chemical processes,
methane emissions escaping untreated from landfills, etc.
Functional Unit—quantified performance of a product system for use as a reference unit.
Global Warming Potential—an index, describing the radiative characteristics of well-mixed
greenhouse gases, that represents the combined effect of the differing times these gases remain in
the atmosphere and their relative effectiveness in absorbing outgoing infrared radiation. This index
approximates the time-integrated warming effect of a unit mass of a given greenhouse gas in today’s atmosphere, relative to that of carbon dioxide.3
Greenhouse Gas—gaseous constituents of the atmosphere, both natural and anthropogenic, that
absorb and emit radiation at specific wavelengths within the spectrum of infrared radiation emitted by the Earth’s surface, the atmosphere, and clouds. This property causes the greenhouse effect.
Water vapor, carbon dioxide, nitrous oxide, methane, and ozone are the primary greenhouse gases
in the Earth’s atmosphere.
Impact Category—class representing environmental issues of concern to which life cycle
inventory analysis results may be assigned.
Life Cycle—consecutive and interlinked stages of a product system, from raw material acquisition
or generation from natural resources to final disposal.
Life Cycle Assessment—compilation and evaluation of the inputs, outputs and the potential
environmental impacts of a product system throughout its life cycle.
Life Cycle Inventory—phase of life cycle assessment involving the compilation and quantification
of inputs and outputs for a product throughout its life cycle.
3 Definition from the glossary of the Intergovernmental Panel on Climate Change (IPCC) Third
Assessment Report - Climate Change 2001.
CLIENTS\ACC\KC182695 04.18.18 4103.00.001
xi
Life Cycle Impact Assessment—phase of life cycle assessment aimed at understanding and
evaluating the magnitude and significance of the potential environmental impacts for a product
system throughout the life cycle of the product.
Life Cycle Interpretation—phase of life cycle assessment in which the findings of either the
inventory analysis or the impact assessment, or both, are evaluated in relation to the defined goal and scope in order to reach conclusions and recommendations.
Non-Renewable Energy—energy from resources that cannot be created on scale to sustain
consumption (i.e. cannot re-generate on human time-scale). Fossil fuels (e.g. coal, petroleum, natural gas) and nuclear power (uranium) are considered non-renewable energy resources.
Open-Loop Recycling—recycling in which the inherent properties of the recycled material changes with recycling and/or when the recycled material is used as an input to a different product
than its previous use.
Ozone Depletion Potential—potential of emissions to result in depletion of stratospheric ozone,
which increases exposure to radiation. This can lead to increased frequency of human health issues
such as skin cancers and cataracts as well as detrimental effects on crops, other plants, and marine
life.
Postconsumer Content—the quantity of material input to a product that is derived from recycled
materials.
Postconsumer Waste—waste resulting directly from consumer disposal of the product system of
the analysis.
Process Waste—wastes from processes along the entire life cycle of the product system. Does not
include postconsumer waste.
Precombustion Energy—the energy required for the production and processing of energy fuels,
such as coal, fuel oil, natural gas, or uranium, starting with their extraction from the ground, up to
the point of delivery to the customer.
Raw Material—primary or shipping (i.e., recycled) material that is used to produce a product.
Renewable Energy—energy from natural resources that can be replenished (e.g. biomass) or are not depleted by use (e.g., hydropower, sunlight, wind).
Smog Formation Potential— potential of emissions to form ground-level ozone which can affect human health and ecosystems.
Solid Waste—any wastes resulting from fuel extraction and combustion, processing, or postconsumer disposal. Solid waste in this study is measured as waste to a specific fate (e.g. landfill,
incinerator).
System Boundary—set of criteria specifying which unit processes are part of a product system.

CLIENTS\ACC\KC182695 04.18.18 4103.00.001
xii
System Expansion—a methodology to expand the system boundaries, thus avoiding the need for
allocation. In this study, system expansion is used, for instance, to model recycling. If the end-of-
life recycling rate is higher than the recycled content of the product, the system is a net producer of recycled material, so the system is credited with avoiding production of the equivalent amount of
virgin material. If the end-of-life recycling rate is less than the recycled content, the system is a net
user of recycled material, so the system is applied a burden for the equivalent amount of virgin material.
Transportation Energy—energy used to move materials or goods from one location to another
throughout the various stages of a product’s life cycle
Unit Process—smallest element considered in the life cycle inventory analysis for which input and
output data are quantified.
Waste-to-Energy Combustion—creating energy (electricity or heat) from combustion of waste
materials.
Water Consumption—consumptive use of water includes freshwater that is withdrawn from a
water source or watershed and not returned to that source. Consumptive water use includes water
consumed in chemical reactions, water that is incorporated into a product or waste stream, water that becomes evaporative loss, and water that is discharged to a different watershed or water body
than the one from which it was withdrawn.

Executive Summary
CLIENTS\ACC\KC182695 04.18.18 4103.00.001
1
EXECUTIVE SUMMARY
ES.1. INTRODUCTION & BACKGROUND
Packaging is an important focus today as businesses and other organizations strive to create
the most efficient environmental “footprint” for their products. Figure ES–1 shows
thermoplastic resin demand in North American packaging versus non-packaging markets
from 2007 to 2011. Packaging uses account for over a third of sales and captive use of
thermoplastic resins.4 The packaging categories analyzed in this study are estimated to
capture 95-99 percent of plastic use in North American packaging.5 Relative to other
packaging materials such as steel, aluminum, glass, paper, etc., plastic-based packaging is
39 to 100 percent of total North American market demand for packaging categories
analyzed in this study.
Figure ES–1. Thermoplastic Resins Demand in Packaging
vs. Non-Packaging Markets – 2007-2011
(per data from the ACC 2012 Resin Review)
The goal of the substitution analysis presented in this report is to use LCA methodology to
assess the environmental impacts of plastics packaging relative to alternative packaging in
North America and answer the question: "If plastic packaging were replaced with
alternative types of packaging, how would environmental impacts be affected?" Impact
4 ACC (2012). The Resin Review: The Annual Statistical Report of the North American Plastics
Industry, American Chemistry Council, 2012 Edition. 5 Per cross-checking total weights of plastic packaging in North America as calculated based on data
provided by Freedonia market reports with total weights of plastic reported by the American Chemistry
Council and US and Canadian national statistics on annual waste generation.
0%
10%
20%
30%
40%
50%
60%
70%
80%
90%
100%
2007 2008 2009 2010 2011
Non-Packaging Applications Packaging
Executive Summary
CLIENTS\ACC\KC182695 04.18.18 4103.00.001
2
categories addressed in the analysis include energy demand, water consumption, solid
waste, global warming potential, acidification potential, eutrophication potential, smog
formation potential, and ozone depletion potential.
In the theoretical substitution analysis, the impacts of current amounts of plastic packaging
products are compared to a scenario in which plastic packaging is substituted by alternative
materials (e.g., paper and paperboard, glass, steel, aluminum, textiles, rubber, and cork).
All of the plastic resins investigated in this study are modeled to be sourced from fossil
fuels (i.e., natural gas and petroleum). Though there have been recent developments in the
production of biomass-based plastic resin, the market shares of these materials is not yet
sufficient to warrant analyzing their substitution with other materials.
The geographic scope of this study is for packaging materials of the selected applications
produced and sold in the US and Canada. The boundaries for this study incorporate raw
material extraction through production of the packaging materials, their distribution, and
their end-of-life management. This study examines greenhouse gas (GHG) emissions and
energy demand.
This analysis was conducted to provide ACC and CPIA with transparent, detailed Life
Cycle Assessment (LCA) results serving several purposes:
1. To provide stakeholders with valuable information about the relative life cycle
impacts of plastic packaging and alternative packaging materials that might be used
to substitute for plastic packaging in applications in the US and Canada,
2. To communicate plastics packaging sustainability information, important for
customer purchasing and procurement, to ACC and CPIA, their member
companies, and the plastics value chain, and
3. To provide the North American market with key regional data for plastic packaging
to show plastics’ contribution to sustainable development.
The results of the substitution analysis in this report are not intended to be used as the basis
for comparative environmental claims or purchasing decisions for specific packaging
products, but rather are intended to provide a snapshot of the environmental impacts of the
current overall mix of plastic packaging in several categories, and the environmental
impacts of the overall mix of alternative types of packaging that might be used as
substitutes. Because the study addresses packaging products in broad categories rather than
comparing specific packages that compete in specific end use applications, the analysis
presented in this report is not considered to fall under the ISO 14040 requirements for
“comparative assertions,” defined in ISO 14040 as environmental claims regarding the
superiority or equivalence of one product versus a competing product that performs the
same function. However, the substitution analysis used as the basis of the report was
reviewed by two external LCA experts, Harald Pilz of Denkstatt GmbH and Roland
Hischier of the Empa Research Institute.
Executive Summary
CLIENTS\ACC\KC182695 04.18.18 4103.00.001
3
ES.2. METHODOLOGY
The LCA method as defined in ISO standards has four distinct phases:
1. Goal and Scope Definition: defines the boundaries of the product system to be
examined.
2. Life Cycle Inventory (LCI): examines the sequence of steps in the life cycle
boundaries of the product system, beginning with raw material extraction and
continuing on through material production, product fabrication, use, and reuse or
recycling where applicable, and final disposition. For each life cycle step, the
inventory identifies and quantifies the material inputs, energy consumption, and
environmental emissions (atmospheric emissions, waterborne wastes, and solid
wastes). In other words, the LCI is the quantitative environmental profile of a
product system. Substances from the LCI are organized into air, soil, and water
emissions or solid waste.
3. Life Cycle Impact Assessment (LCIA): characterizes the results of the LCI into
categories of environmental problems or damages based on the substance’s relative
strength of impact. Characterization models are applied to convert masses of
substances from the LCI results into common equivalents of one category indicator.
4. Interpretation: uses the information from the LCI and LCIA to compare product
systems, rank processes, and/or pinpoint areas (e.g., material components or
processes) where changes would be most beneficial in terms of reduced
environmental impacts. The information from this type of assessment is
increasingly used as a decision-support tool.
This study has been conducted with an LCA approach as defined in ISO standards 14040
and 14044. As stated previously, two LCA experts familiar with packaging analyses
reviewed the details of the substitution analysis to ensure that the approach was reasonable
and that the data sources and assumptions used were robust. The results presented in this
report are specific to the US and Canadian geographic context and should not be interpreted
as representing current or future plastic packaging substitution in other geographic areas.
The following sections discuss the specifics of this methodology as applied in this study.
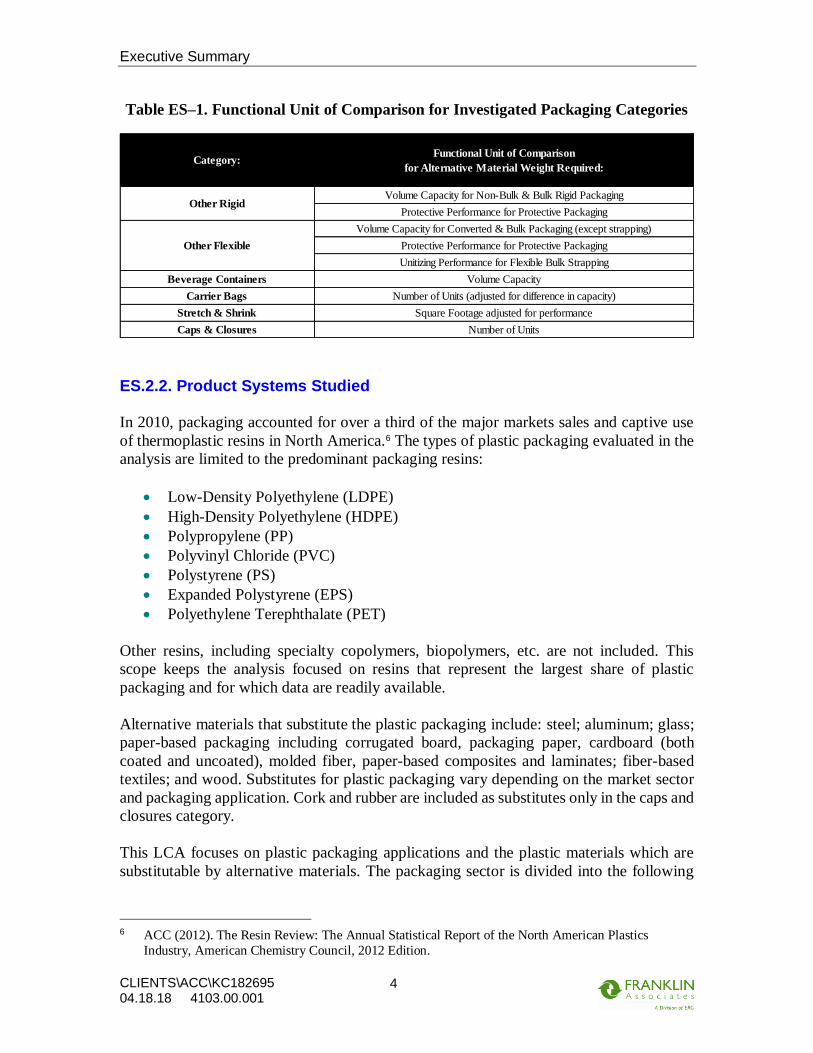
ES.2.1. Functional Unit
In any life cycle study, products are compared on the basis of providing the same defined
function or unit of service (called the functional unit). This study uses a modeling approach
to account for the standard LCI basis of product functionality for packaging materials. The
general functional unit of the overall study is the substitution of total consumption of plastic
used in each packaging category for the data year in which the most recent market data is
available. Because the function of plastic packaging products differs amongst the
investigated packaging categories, the functional unit is unique for each packaging
category. Table ES-1 summarizes the functional unit considered for each packaging
category.
Executive Summary
CLIENTS\ACC\KC182695 04.18.18 4103.00.001
4
Table ES–1. Functional Unit of Comparison for Investigated Packaging Categories
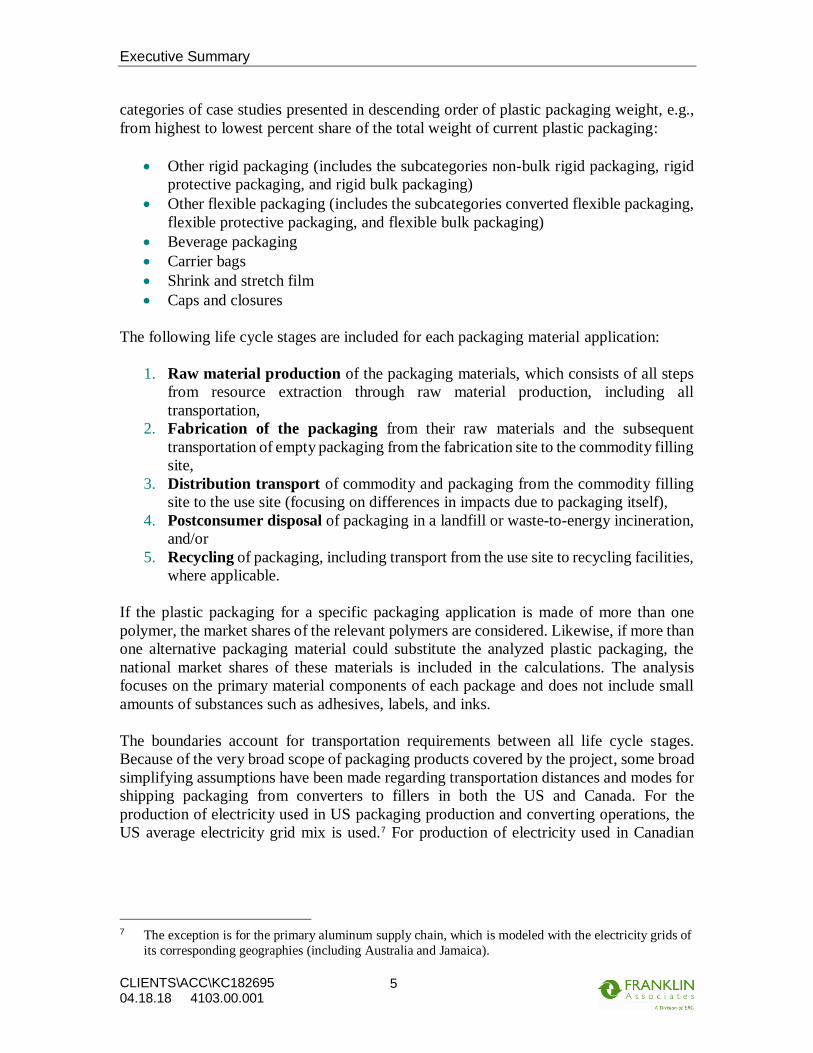
ES.2.2. Product Systems Studied
In 2010, packaging accounted for over a third of the major markets sales and captive use
of thermoplastic resins in North America.6 The types of plastic packaging evaluated in the
analysis are limited to the predominant packaging resins:
• Low-Density Polyethylene (LDPE)
• High-Density Polyethylene (HDPE)
• Polypropylene (PP)
• Polyvinyl Chloride (PVC)
• Polystyrene (PS)
• Expanded Polystyrene (EPS)
• Polyethylene Terephthalate (PET)
Other resins, including specialty copolymers, biopolymers, etc. are not included. This
scope keeps the analysis focused on resins that represent the largest share of plastic
packaging and for which data are readily available.
Alternative materials that substitute the plastic packaging include: steel; aluminum; glass;
paper-based packaging including corrugated board, packaging paper, cardboard (both
coated and uncoated), molded fiber, paper-based composites and laminates; fiber-based
textiles; and wood. Substitutes for plastic packaging vary depending on the market sector
and packaging application. Cork and rubber are included as substitutes only in the caps and
closures category.
This LCA focuses on plastic packaging applications and the plastic materials which are
substitutable by alternative materials. The packaging sector is divided into the following
6 ACC (2012). The Resin Review: The Annual Statistical Report of the North American Plastics
Industry, American Chemistry Council, 2012 Edition.
Volume Capacity for Non-Bulk & Bulk Rigid Packaging
Protective Performance for Protective Packaging
Volume Capacity for Converted & Bulk Packaging (except strapping)
Protective Performance for Protective Packaging
Unitizing Performance for Flexible Bulk Strapping
Beverage Containers Volume Capacity
Carrier Bags Number of Units (adjusted for difference in capacity)
Stretch & Shrink Square Footage adjusted for performance
Caps & Closures Number of Units
Other Flexible
Category:Functional Unit of Comparison
for Alternative Material Weight Required:
Other Rigid
Executive Summary
CLIENTS\ACC\KC182695 04.18.18 4103.00.001
5
categories of case studies presented in descending order of plastic packaging weight, e.g.,
from highest to lowest percent share of the total weight of current plastic packaging:
• Other rigid packaging (includes the subcategories non-bulk rigid packaging, rigid
protective packaging, and rigid bulk packaging)
• Other flexible packaging (includes the subcategories converted flexible packaging,
flexible protective packaging, and flexible bulk packaging)
• Beverage packaging
• Carrier bags
• Shrink and stretch film
• Caps and closures
The following life cycle stages are included for each packaging material application:
1. Raw material production of the packaging materials, which consists of all steps
from resource extraction through raw material production, including all
transportation,
2. Fabrication of the packaging from their raw materials and the subsequent
transportation of empty packaging from the fabrication site to the commodity filling
site,
3. Distribution transport of commodity and packaging from the commodity filling
site to the use site (focusing on differences in impacts due to packaging itself),
4. Postconsumer disposal of packaging in a landfill or waste-to-energy incineration,
and/or
5. Recycling of packaging, including transport from the use site to recycling facilities,
where applicable.
If the plastic packaging for a specific packaging application is made of more than one
polymer, the market shares of the relevant polymers are considered. Likewise, if more than
one alternative packaging material could substitute the analyzed plastic packaging, the
national market shares of these materials is included in the calculations. The analysis
focuses on the primary material components of each package and does not include small
amounts of substances such as adhesives, labels, and inks.
The boundaries account for transportation requirements between all life cycle stages.
Because of the very broad scope of packaging products covered by the project, some broad
simplifying assumptions have been made regarding transportation distances and modes for
shipping packaging from converters to fillers in both the US and Canada. For the
production of electricity used in US packaging production and converting operations, the
US average electricity grid mix is used.7 For production of electricity used in Canadian
7 The exception is for the primary aluminum supply chain, which is modeled with the electricity grids of
its corresponding geographies (including Australia and Jamaica).

Executive Summary
CLIENTS\ACC\KC182695 04.18.18 4103.00.001
6
packaging production and converting operations, the average Canadian electricity grid mix
is used.8
Filling requirements for the products contained in the investigated packaging applications
are excluded from the boundaries of this study as they are beyond the scope of this study.
Storage, refrigeration, and/or freezing requirements as well as the burdens associated with
the product use phase are considered equivalent between directly substituted packaging
materials and so are excluded from the analysis. This analysis is based on the amounts and
types of substitutes that would provide equivalent functionality to plastic packaging and
therefore does not attempt to evaluate differences in product damage associated with use
of different packaging materials.
For the average US or Canadian geographic context, average recycling rates and pathways
for packaging used in the analyzed applications have been developed from research, recent
publications, and previous work conducted by Franklin Associates. For the US geographic
scope, postconsumer disposal of the percentage of packaging not recycled is modeled with
current US EPA statistics for waste management.9 For the Canadian geographic scope,
average recycling rates and pathways for packaging used in Canada are modeled with
current Canadian national waste management statistics.10 Franklin Associates uses the
system expansion end-of-life (EOL) recycling methodology to account for changes in life
cycle burdens due to the recycling of packaging materials and the use of recycled material
in packaging products.
A summary flow diagram of the boundaries for the packaging applications is shown in
Figure ES–2. These boundaries are identical for either the US or Canadian geographic
scope.
8 IEA 2014 electricity generation data for Canada accessed at
http://www.iea.org/statistics/statisticssearch/report/?country=CANADA=&product=electricityandheat
in November 2017. 9 US Environmental Protection Agency. Municipal Solid Waste Generation, Recycling, and Disposal in
the United States, see: http://www.epa.gov/wastes/nonhaz/municipal/msw99.htm. 10 Statistics Canada (2012). Human Activity and the Environment: Waste Management in Canada, 2012
– Updated, Statistique Canada, Catalogue no. 16-201-X, Ministry of Industry, September 2012.

Executive Summary
CLIENTS\ACC\KC182695 04.18.18 4103.00.001
7
Figure ES–2. Packaging Products System Boundaries

Executive Summary
CLIENTS\ACC\KC182695 04.18.18 4103.00.001
8
ES.2.3. Data Sources
The primary source of market data (i.e., market shares of packaging product applications
by type and by material) for packaging materials in the US and Canada were from
Freedonia Market Reports for data years 2007-2011 and from the ACC 2012 Resins
Review.11 These data along with public and private LCA and packaging case studies and
assumptions made by Franklin Associates were used to compile the weight factors for non-
plastic materials to substitute for plastic packaging resins. To model the life cycle impacts
of plastic versus non-plastic packaging materials, Franklin Associates uses the most current
North American life cycle data on materials and fuels used in each system. Data
transparency is important, so wherever possible we have used data from publicly available
sources, such as the US LCI Database.12 For unit processes for which public data were not
available, Franklin Associates has clearly cited the private data sources and disclosed as
much information as possible without compromising the confidentiality of the data source.
For example, where data from the ecoinvent database are used, Franklin Associates has
adapted the data so it is consistent with other North American data modules used in the
study and representative of the energy production and transportation.13
ES.2.4. Reuse & Recycling Modeling Approach
In this study, national reuse and recycling rates for the packaging product type and/or
material are applied for the US and Canadian geographic scopes. When material is used in
one system and subsequently recovered, reprocessed, and used in another application, there
are different methods that can be used to allocate environmental burdens among different
useful lives of the material.
In this study, burdens associated with recycled content of products include collection,
transport, and reprocessing of the postconsumer material. None of the virgin production
burdens for the material are allocated to its secondary use(s).
For packaging material that is recycled at end of life, the recycling of packaging materials
is modeled as a mix of closed- and open-loop recycling, as appropriate for each packaging
application and/or material. System expansion is the approach used to avoid allocation in
this analysis. Under the system expansion approach, the types and quantities of materials
11 ACC (2012). The Resin Review: The Annual Statistical Report of the North American Plastics
Industry, American Chemistry Council, 2012 Edition. 12 National Renewable Energy Lab (NREL). US LCI Database. See:
http://www.nrel.gov/lci/database/default.asp. 13 In addition to data developed specifically for North American processes and materials, Franklin
Associates has an LCI database of materials and processes adapted from the ecoinvent LCI Database
for the North American context. The database generally contains materials and processes specific to
commodities sold in North America for which U.S. LCI data are not currently available. To adapt the LCI processes to the North American geographic context, most of the following (foreground and
background) material and fuel unit processes within the European module were substituted with those
inventoried in North America: 1) transport processes, 2) fossil fuels extraction, processing, and
combustion, 3) mineral and metals extraction and fabrication processes, 4) plastic resin production and
plastics fabrication processes, 5) paper and paperboard products production , 6) organic chemicals
production, and 7) inorganic chemicals production.

Executive Summary
CLIENTS\ACC\KC182695 04.18.18 4103.00.001
9
that are displaced by the recovered post-consumer material determine the types and
quantities of avoided environmental material production credits. If the end-of-life recycling
rate is higher than the recycled content of the product, the system is a net producer of
material, so the system receives open-loop credit for avoiding production of virgin material
equivalent to the amount of end-of-life recycling that exceeds the system’s recycled
content. Conversely, if the end-of-life recycling rate is lower than the recycled content of
the product, then the system is a net consumer of material and is charged with burdens for
the production of material needed to make up the deficit.
ES.2.5. Key Assumptions
Although the foreground processes in this analysis were populated with reliable market
data and the background processes come from reliable LCI databases, most analyses still
have limitations. Further, it is necessary to make a number of assumptions when modeling,
which could influence the final results of a study. Key limitations and assumptions of this
analysis are:
• Because of the large scope of this study, this analysis uses the LCA approach to
identify overall trends in the GWP and energy demand of packaging categories
rather than performing a detailed LCA on hundreds of packaging products for
individual applications;
• For each plastic packaging category, the current market share of plastic resins
determines the weight of replaced resin. The weight of replaced resin is multiplied
by the substitute material-to-plastic weight ratio calculated for each packaging
application (based on functional equivalency to the representative plastic packaging
product) to provide the weight of alternative material projected to substitute for the
plastic package.
• For the substitutions, it is assumed that the product contained/unitized by the
packaging would not be changed or altered in any way (e.g., a rigid plastic container
for liquid soap must be substituted by another rigid container designed for liquids
rather than projecting that the weight of a paperboard box designed for powdered
soap may substitute for the plastic container)
• For each geographic scope, all foreground processes are assumed to utilize the
national average electricity grid fuel mix; the exception is for the primary aluminum
supply chain. The electricity grids for each aluminum production step from bauxite
mining through alumina production are modeled based on the mix of geographies
(including Australia and Jamaica) where each production step takes place.
• LCI requirements for filling, storage, freezing, refrigeration, product
manufacturing, capital equipment, and support personnel as well as differences in
product damage in various packaging materials are excluded from the analysis
• Transportation requirements inventoried for specific transportation modes are
based on industry averages for that mode for each country;
• Transportation requirements do not include environmental burdens for transporting
the weight of the products contained by the packaging as this weight is equivalent
between the packaging materials/types and the life cycle burdens of the contained
products are outside the scope of this study;

Executive Summary
CLIENTS\ACC\KC182695 04.18.18 4103.00.001
10
• For each geographic scope, estimates of the end results of landfilling and waste-to-
energy (WTE) combustion are limited to global warming potential (GWP) effects,
electricity credits, and requirements for transporting waste to a landfill and
operating landfill equipment. Recycling energy requirements are also taken into
account, and include transportation and reprocessing of the material as well as
credit for virgin material displaced by the recycled material.
ES.3. KEY FINDINGS
The LCI results are characterized to give an overview of environmental impacts for plastic
and alternative material packaging systems. The categories included the study and the
methods used to evaluate each category are shown in Table ES-2.
Two scenarios are analyzed for substitute packaging. The “no decomposition” scenario
includes biogenic CO2 sequestration credit for all the biogenic carbon in landfilled
packaging (i.e., no decomposition over time of any landfilled biomass-derived packaging),
while the “maximum decomposition” scenario is based on maximum decomposition of
uncoated paper and paperboard packaging that is disposed in landfills. For
coated/laminated paper and paperboard products, the barrier layers are assumed to
minimize any decomposition of the fiber content; therefore, to use a conservative approach,
no decomposition of the fiber content of coated/laminated paper-based packaging is
modeled in either decomposition scenario.
An overview of comparative results for all packaging categories for all impacts is shown
in Figure ES-3 for US packaging and Figure ES-4 for Canadian packaging. Results for
each impact category are normalized to the highest value for that category among the
packaging system scenarios evaluated. The figures show that plastic packaging has lower
impacts than substitute packaging for all impacts evaluated for both the US and Canadian
scenarios for both decomposition scenarios.
The main factors influencing differences in results for plastics and alternative packaging
types include the following:
• Less weight of plastic packaging required to perform same packaging function
• Higher embodied energy for plastics compared to substitute materials
• Lower water consumption per kg for plastic materials compared to alternatives
• No decomposition (and therefore, no associated methane releases) for landfilled
plastics
• Carbon sequestration credits for landfilled material is only assigned to biomass-
based carbon content (e.g., in paper, paperboard, wood) and not to fossil fuel-
derived carbon content in plastic packaging
• Higher embodied energy/kg for plastics, so higher energy credits for plastics
disposed via waste-to-energy combustion.

Executive Summary
CLIENTS\ACC\KC182695 04.18.18 4103.00.001
11
Table ES–2. Environmental Indicators Evaluated
Impact/Inventory
Category Description Unit
LCIA/LCI
Methodology
LC
I C
ate
gorie
s
Total energy
demand
Measures the total energy from point
of extraction; results include both renewable and non-renewable energy
sources
MJ Cumulative energy inventory
Expended energy
Energy irretrievably consumed;
calculated as total energy minus the
potentially recoverable energy
embodied in the material.
MJ
Cumulative energy
inventory minus
energy embodied in
material
Water
consumption
Freshwater withdrawals which are
evaporated, incorporated into products
and waste, transferred to different
watersheds, or disposed into the sea
after usage
liters H2O
Cumulative water
consumption
inventory
Solid waste by
weight
Measures quantity of fuel, process and
postconsumer waste to a specific fate
(e.g., landfill, WTE) for final disposal
on a mass basis
kg Cumulative solid
waste inventory
Solid waste by
volume
Measures quantity of fuel, process and
postconsumer waste to a specific fate (e.g., landfill, WTE) for final disposal
on a volume basis
m3 Cumulative solid waste inventory
LC
IA C
ate
gorie
s
Global warming
potential (GWP)
Represents the heat trapping capacity
of the greenhouse gases. Important
emissions: CO2 fossil, CH4, N2O
kg CO2
equivalents
(eq)
IPCC (2013) GWP
100a
Acidification
potential
Quantifies the acidifying effect of
substances on their environment. Important emissions: SO2, NOx, NH3,
HCl, HF, H2S
kg SO2 eq TRACI v2.1
Eutrophication
potential
Assesses impacts from excessive load
of macro-nutrients to the environment.
Important emissions: NH3, NOx, COD
and BOD, N and P compounds
kg N eq TRACI v2.1
Smog formation
potential
Determines the formation of reactive
substances (e.g. tropospheric ozone)
that cause harm to human health and
vegetation. Important emissions: NOx,
BTEX, NMVOC, CH4, C2H6, C4H10,
C3H8, C6H14, acetylene, Et-OH,
formaldehyde
kg O3 eq TRACI v2.1
Ozone depletion
potential
Measures stratospheric ozone
depletion. Important emissions: CFC
compounds and halons
kg CFC-11 eq TRACI v2.1

Executive Summary
CLIENTS\ACC\KC182695 04.18.18 4103.00.001
12
Figure ES–3. Normalized US Results for Plastic Packaging and Substitutes

Executive Summary
CLIENTS\ACC\KC182695 04.18.18 4103.00.001
13
Figure ES–4. Normalized Canadian Results for Plastic Packaging and Substitutes
Executive Summary
CLIENTS\ACC\KC182695 04.18.18 4103.00.001
14
Results for US and Canadian packaging generally show similar trends by impact category
and by packaging category; however, there are some differences. Factors influencing
differences in results for US and Canada include:
• Less packaging used (lower population) in Canada
• Canadian electricity is less fossil fuel intensive (lower energy, emissions, and fuel-
related solid waste) but more hydropower dependent (higher evaporative losses of
water)
• Recycling rates for some types of packaging are higher in Canada, so a smaller
share of packaging is sent to landfill
• For packaging that is not recycled, there is more landfilling, less landfill gas
recovery, and less waste-to-energy combustion of solid waste in Canada
o More landfilling means more carbon sequestration credit for disposed
biomass-derived materials that don’t decompose, but more methane
emissions for biomass-derived materials that do decompose
o Less energy recovery credits for all materials, since less waste-to-energy
disposal of unrecycled waste.
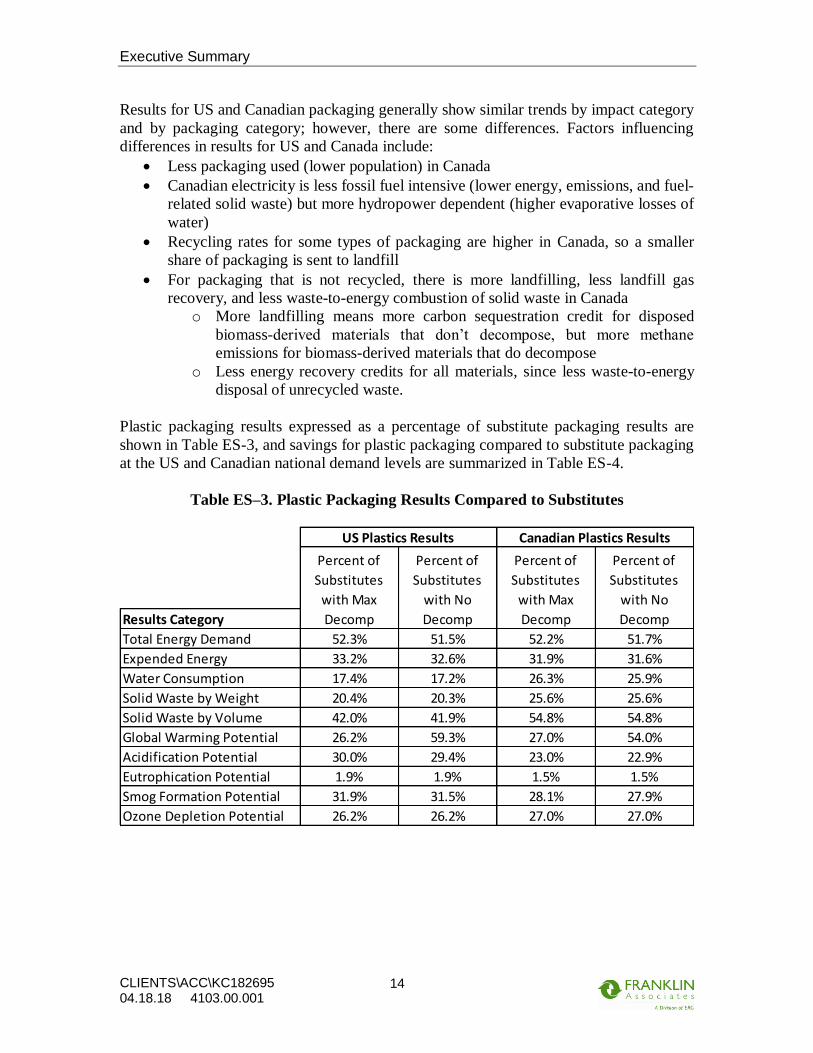
Plastic packaging results expressed as a percentage of substitute packaging results are
shown in Table ES-3, and savings for plastic packaging compared to substitute packaging
at the US and Canadian national demand levels are summarized in Table ES-4.
Table ES–3. Plastic Packaging Results Compared to Substitutes
Results Category
Total Energy Demand 52.3% 51.5% 52.2% 51.7%
Expended Energy 33.2% 32.6% 31.9% 31.6%
Water Consumption 17.4% 17.2% 26.3% 25.9%
Solid Waste by Weight 20.4% 20.3% 25.6% 25.6%
Solid Waste by Volume 42.0% 41.9% 54.8% 54.8%
Global Warming Potential 26.2% 59.3% 27.0% 54.0%
Acidification Potential 30.0% 29.4% 23.0% 22.9%
Eutrophication Potential 1.9% 1.9% 1.5% 1.5%
Smog Formation Potential 31.9% 31.5% 28.1% 27.9%
Ozone Depletion Potential 26.2% 26.2% 27.0% 27.0%
Percent of
Substitutes
with Max
Decomp
Percent of
Substitutes
with No
Decomp
Percent of
Substitutes
with Max
Decomp
Percent of
Substitutes
with No
Decomp
US Plastics Results Canadian Plastics Results

Executive Summary
CLIENTS\ACC\KC182695 04.18.18 4103.00.001
15
Table ES–4. Summary of Savings for Plastic Packaging Compared to Substitutes
Although expended energy is a subset of total energy demand, Table ES-4 shows that
expended energy savings are greater than total energy savings. Feedstock energy is a much
greater share of total energy demand for plastics compared to substitutes; therefore, the
difference in expended energy (total energy demand minus feedstock energy) for plastics
compared to substitutes is greater than the difference in total energy results.
GWP savings for plastics compared to substitutes are higher for the substitute maximum
decomposition scenario than for the no decomposition scenario. Substitute packaging
GWP results are higher in the maximum decomposition scenario due to methane emissions
from landfill decomposition of some of the biomass-derived packaging. However, the
energy savings for plastics are slightly smaller for the substitute maximum decomposition
scenario than for the no decomposition scenario. This is because the maximum
decomposition scenario for substitutes includes some energy credits for energy recovered
from combustion of captured landfill gas from biomass-based substitute packaging that
decomposes.
Because the magnitude of the savings results shown in Table ES-4 may be difficult to
interpret, equivalency factors are used to provide perspective for the study results. The
equivalency factors are derived from the US EPA Greenhouse Gas Equivalencies
Calculator14 and other published sources. A summary of savings equivalents for several
results categories are shown in Table ES-5.
14 https://www.epa.gov/energy/greenhouse-gas-equivalencies-calculator
Results Category Units
Total Energy Demand billion MJ 1,196 1,235 121 123
Expended Energy billion MJ 1,396 1,435 143 145
Water Consumption billion liters 1,106 1,121 130 133
Solid Waste by Weight thousand metric tons 52,887 53,162 4,044 4,050
Solid Waste by Volume million cubic meters 55.1 55.4 3.73 3.74Global Warming Potential million metric tonnes CO2 eq 67.1 39.5 8.66 3.65
Acidification Potential thousand metric tonnes SO2 eq 526 541 52.3 52.7
Eutrophication Potential thousand metric tonnes N eq 340 341 37.4 37.4
Smog Formation Potential thousand metric tonnes O3 eq 6,549 6,682 666 670
Ozone Depletion Potential metric tonnes CFC-11 eq 1.15 1.15 0.13 0.13
Compared to
Substitutes
with Max
Decomp
Compared to
Substitutes
with No
Decomp
US Savings Canadian Savings
Compared to
Substitutes
with Max
Decomp
Compared to
Substitutes
with No
Decomp

Executive Summary
CLIENTS\ACC\KC182695 04.18.18 4103.00.001
16
Table ES–5. Savings Equivalents for Plastic Packaging Compared to Substitutes
Plastics have many properties that make them a popular choice in packaging applications.
Properties such as light weight, durability, flexibility, cushioning, and barrier properties
make plastic packaging well suited for efficiently containing and protecting many types of
products during shipment and delivery to customers without leaks, spoilage, or other
damage. The results of this substitution analysis show that plastic packaging is also an
efficient packaging choice in terms of a variety of environmental impacts.
Results Category Equivalence FactorMillion passenger vehicles per year 18 18 1.8 1.8
Thousand tanker trucks of gasoline 1,073 1,108 108 110
Million passenger vehicles per year 14 8.5 1.9 0.8
Thousand tanker trucks of gasoline 889 523 115 48
Water Consumption Thousand Olympic swimming pools 461 467 54 55
Solid Waste by Weight Thousand 747 airplanes 290 291 22 22
Solid Waste by Volume U.S. Capitol Rotundas 1,496 1,505 101 102 Acidification Thousand railcars of coal 292 301 29 29
Total Energy
Global Warming
Potential
US Savings Canadian Savings
Plastics
compared to
Substitutes
with Max
Decomp
Plastics
compared to
Substitutes
with No
Decomp
Plastics
compared to
Substitutes
with Max
Decomp
Plastics
compared to
Substitutes
with No
Decomp

Chapter 1. Goal & Scope Definition
CLIENTS\ACC\KC182695 04.18.18 4103.00.001
17
CHAPTER 1. GOAL & SCOPE DEFINITION
1.1. GOAL
The entire supply chain or value chain should be considered when evaluating the
sustainability of a product system. Life Cycle Assessment (LCA) has been recognized as a
scientific method for making comprehensive, quantified evaluations of the environmental
benefits and tradeoffs for the entire life cycle of a product system, beginning with raw
material extraction and continuing through disposition at the end of its useful life. LCA
creates the basic environmental information for any product, package, or process.
The goal of the original study was to assess the energy consumption and greenhouse gas
emissions of plastics packaging relative to alternative packaging in North America using
the LCA methodology. The substitution analysis assessed the life cycle impacts of plastic
packaging relative to alternative materials to answer the question: "If plastic packaging
were replaced with alternative types of packaging, how would energy consumption and
greenhouse gas emissions be affected?"
For a more comprehensive understanding of the environmental benefits and tradeoffs for
substituting alternative packaging for plastic packaging, this updated and expanded version
of the study adds comparative results for several other important environmental indicators:
• Water Consumption
• Solid Waste
• Acidification Potential
• Eutrophication Potential
• Smog Formation Potential
• Ozone Depletion Potential
Besides expanding the scope of the analysis to include additional results categories, this
analysis also incorporates available updated industry data on material production, updated
electricity grid mixes, updates to landfill gas management practices, and revisions to
system expansion recycling credits to better reflect the credits for recycled paper products
(i.e., so that recycled paper receives credits not only for displacing material inputs to virgin
paper production but also receives credits for displacing chemical pulping of the virgin
inputs). An update was also made to the method used in the modeling for toggling between
use of US and Canadian electricity for the country-specific scenarios. The method used in
the original analysis had overstated the contribution of Canadian electricity to results for
Canadian systems.
The theoretical substitution analysis takes into account the mix of plastic resins and
substitutes for plastic packaging in each packaging market sector. Because of the extensive
level of effort and resources required to develop the substitution model, the substitution
model itself (types and weights of plastic resins used in each packaging category and types
Chapter 1. Goal & Scope Definition
CLIENTS\ACC\KC182695 04.18.18 4103.00.001
18
and weights of alternative packaging materials that would substitute them) was not
updated.
The geographic scope of this study is for packaging materials of the selected applications
produced and sold in the US and Canada. The boundaries for this study incorporate raw
material extraction through production of the packaging materials, their distribution, and
their end-of-life management.
This analysis was conducted to provide ACC and CPIA with transparent, detailed Life
Cycle Assessment (LCA) results serving several purposes:
1. To provide stakeholders with valuable information about the relative life cycle
environmental impacts of plastic packaging and alternative packaging materials
that might be used to substitute for plastic packaging in applications in the US and
Canada,
2. To communicate plastics packaging sustainability information, important for
customer purchasing and procurement, to ACC and CPIA, their member
companies, and the plastics value chain, and
3. To provide the North American market with key regional data for plastic packaging
to show plastics’ contribution to sustainable development.
The primary intended use of this substitution analysis report is to quantify and
communicate the environmental impacts of plastic packaging materials relative to a mix of
alternative packaging materials that would be used to substitute plastic on a functionally
equivalent basis.
1.2. SCOPE OF THE STUDY
This chapter discusses the overall scope of the study necessary to accomplish the stated
goal. The LCA components covered include the functional unit, product systems studied,
study boundaries, sensitivity analysis, data requirements, data sources, allocation, impact
assessment methodology, assumptions and limitations, and critical review.
1.2.1. Functional Unit
In any life cycle study, products are compared on the basis of providing the same defined
function or unit of service (called the functional unit). This study uses a modeling approach
to account for the standard LCI basis of product functionality for packaging materials. The
general functional unit of the overall study is the substitution of total consumption of plastic
used in each packaging category for the data year in which the most recent market data is
available. Because the requirements for plastic packaging products differ amongst the
investigated packaging categories, the functional unit is unique for each packaging
application.
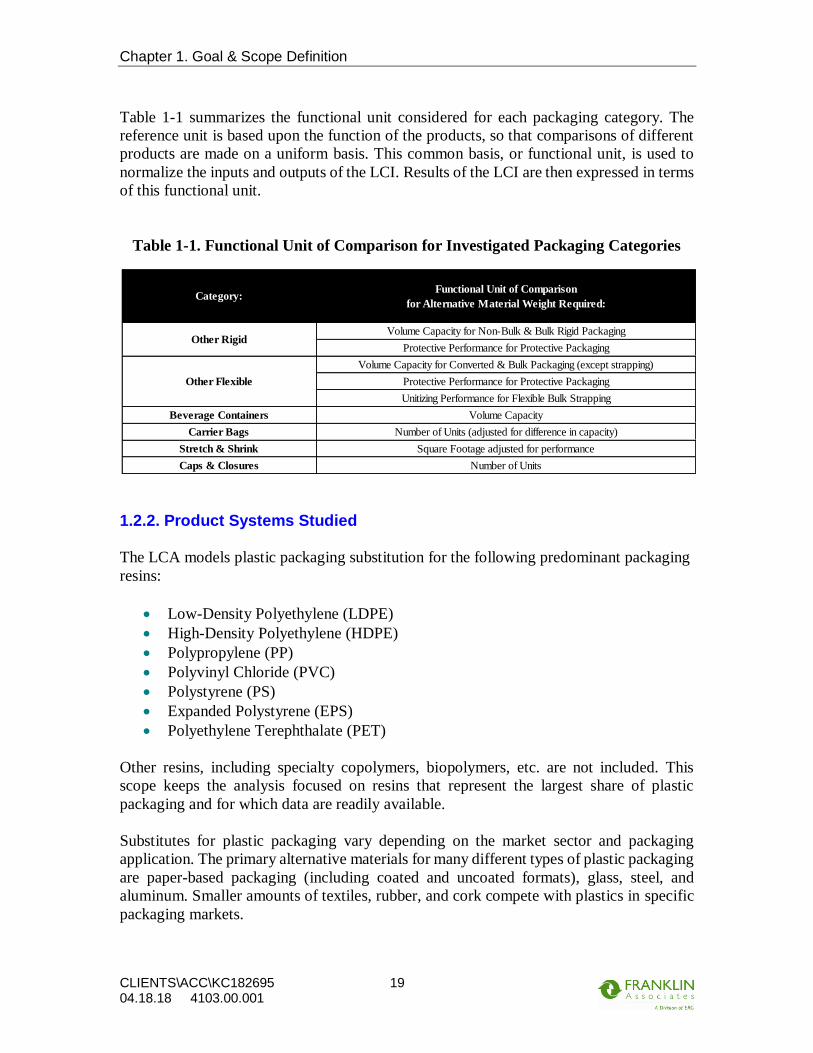
Chapter 1. Goal & Scope Definition
CLIENTS\ACC\KC182695 04.18.18 4103.00.001
19
Table 1-1 summarizes the functional unit considered for each packaging category. The
reference unit is based upon the function of the products, so that comparisons of different
products are made on a uniform basis. This common basis, or functional unit, is used to
normalize the inputs and outputs of the LCI. Results of the LCI are then expressed in terms
of this functional unit.
Table 1-1. Functional Unit of Comparison for Investigated Packaging Categories
1.2.2. Product Systems Studied
The LCA models plastic packaging substitution for the following predominant packaging
resins:
• Low-Density Polyethylene (LDPE)
• High-Density Polyethylene (HDPE)
• Polypropylene (PP)
• Polyvinyl Chloride (PVC)
• Polystyrene (PS)
• Expanded Polystyrene (EPS)
• Polyethylene Terephthalate (PET)
Other resins, including specialty copolymers, biopolymers, etc. are not included. This
scope keeps the analysis focused on resins that represent the largest share of plastic
packaging and for which data are readily available.
Substitutes for plastic packaging vary depending on the market sector and packaging
application. The primary alternative materials for many different types of plastic packaging
are paper-based packaging (including coated and uncoated formats), glass, steel, and
aluminum. Smaller amounts of textiles, rubber, and cork compete with plastics in specific
packaging markets.
Volume Capacity for Non-Bulk & Bulk Rigid Packaging
Protective Performance for Protective Packaging
Volume Capacity for Converted & Bulk Packaging (except strapping)
Protective Performance for Protective Packaging
Unitizing Performance for Flexible Bulk Strapping
Beverage Containers Volume Capacity
Carrier Bags Number of Units (adjusted for difference in capacity)
Stretch & Shrink Square Footage adjusted for performance
Caps & Closures Number of Units
Other Flexible
Category:Functional Unit of Comparison
for Alternative Material Weight Required:
Other Rigid

Chapter 1. Goal & Scope Definition
CLIENTS\ACC\KC182695 04.18.18 4103.00.001
20
The plastic packaging sector is the system studied, and this sector is divided into the
following categories, presented in decreasing order of mass of plastic packaging:
• Other rigid packaging (includes the subcategories non-bulk rigid packaging, rigid
protective packaging, and rigid bulk packaging)
• Other flexible packaging (includes the subcategories converted flexible packaging,
flexible protective packaging, and flexible bulk packaging)
• Beverage packaging
• Carrier bags
• Shrink and stretch film
• Caps and closures
Table 1-2 presents the details on the data year(s) and types of plastic packaging included
and excluded from each investigated category in the analysis.
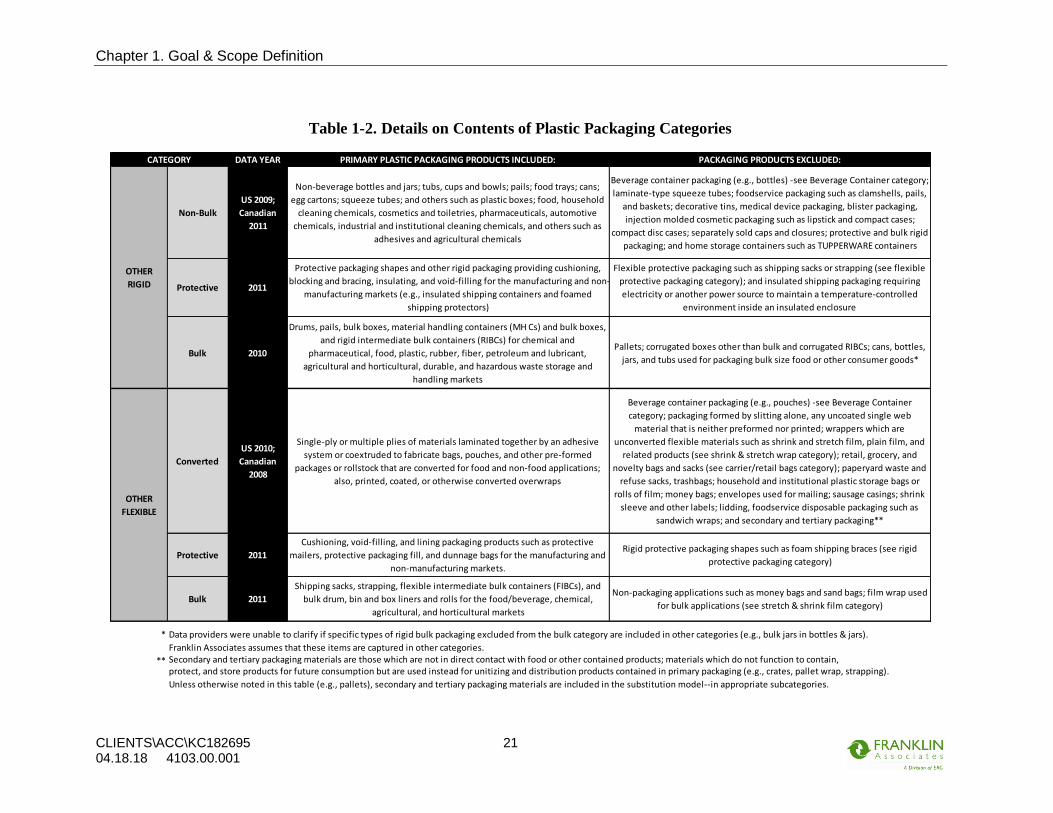
Chapter 1. Goal & Scope Definition
CLIENTS\ACC\KC182695 04.18.18 4103.00.001
21
Table 1-2. Details on Contents of Plastic Packaging Categories
DATA YEAR PRIMARY PLASTIC PACKAGING PRODUCTS INCLUDED: PACKAGING PRODUCTS EXCLUDED:
Non-Bulk
US 2009;
Canadian
2011
Non-beverage bottles and jars; tubs, cups and bowls; pails; food trays; cans;
egg cartons; squeeze tubes; and others such as plastic boxes; food, household
cleaning chemicals, cosmetics and toiletries, pharmaceuticals, automotive
chemicals, industrial and institutional cleaning chemicals, and others such as
adhesives and agricultural chemicals
Beverage container packaging (e.g., bottles) -see Beverage Container category;
laminate-type squeeze tubes; foodservice packaging such as clamshells, pails,
and baskets; decorative tins, medical device packaging, blister packaging,
injection molded cosmetic packaging such as lipstick and compact cases;
compact disc cases; separately sold caps and closures; protective and bulk rigid
packaging; and home storage containers such as TUPPERWARE containers
Protective 2011
Protective packaging shapes and other rigid packaging providing cushioning,
blocking and bracing, insulating, and void-filling for the manufacturing and non-
manufacturing markets (e.g., insulated shipping containers and foamed
shipping protectors)
Flexible protective packaging such as shipping sacks or strapping (see flexible
protective packaging category); and insulated shipping packaging requiring
electricity or another power source to maintain a temperature-controlled
environment inside an insulated enclosure
Bulk 2010
Drums, pails, bulk boxes, material handling containers (MH Cs) and bulk boxes,
and rigid intermediate bulk containers (RIBCs) for chemical and
pharmaceutical, food, plastic, rubber, fiber, petroleum and lubricant,
agricultural and horticultural, durable, and hazardous waste storage and
handling markets
Pallets; corrugated boxes other than bulk and corrugated RIBCs; cans, bottles,
jars, and tubs used for packaging bulk size food or other consumer goods*
Converted
US 2010;
Canadian
2008
Single-ply or multiple plies of materials laminated together by an adhesive
system or coextruded to fabricate bags, pouches, and other pre-formed
packages or rollstock that are converted for food and non-food applications;
also, printed, coated, or otherwise converted overwraps
Beverage container packaging (e.g., pouches) -see Beverage Container
category; packaging formed by slitting alone, any uncoated single web
material that is neither preformed nor printed; wrappers which are
unconverted flexible materials such as shrink and stretch film, plain film, and
related products (see shrink & stretch wrap category); retail, grocery, and
novelty bags and sacks (see carrier/retail bags category); paperyard waste and
refuse sacks, trashbags; household and institutional plastic storage bags or
rolls of film; money bags; envelopes used for mailing; sausage casings; shrink
sleeve and other labels; lidding, foodservice disposable packaging such as
sandwich wraps; and secondary and tertiary packaging**
Protective 2011
Cushioning, void-filling, and lining packaging products such as protective
mailers, protective packaging fill, and dunnage bags for the manufacturing and
non-manufacturing markets.
Rigid protective packaging shapes such as foam shipping braces (see rigid
protective packaging category)
Bulk 2011
Shipping sacks, strapping, flexible intermediate bulk containers (FIBCs), and
bulk drum, bin and box liners and rolls for the food/beverage, chemical,
agricultural, and horticultural markets
Non-packaging applications such as money bags and sand bags; film wrap used
for bulk applications (see stretch & shrink film category)
* Data providers were unable to clarify if specific types of rigid bulk packaging excluded from the bulk category are included in other categories (e.g., bulk jars in bottles & jars).
Franklin Associates assumes that these items are captured in other categories.
** Secondary and tertiary packaging materials are those which are not in direct contact with food or other contained products; materials which do not function to contain, protect, and store products for future consumption but are used instead for unitizing and distribution products contained in primary packaging (e.g., crates, pallet wrap, strapping).
Unless otherwise noted in this table (e.g., pallets), secondary and tertiary packaging materials are included in the substitution model--in appropriate subcategories.
CATEGORY
OTHER
RIGID
OTHER
FLEXIBLE
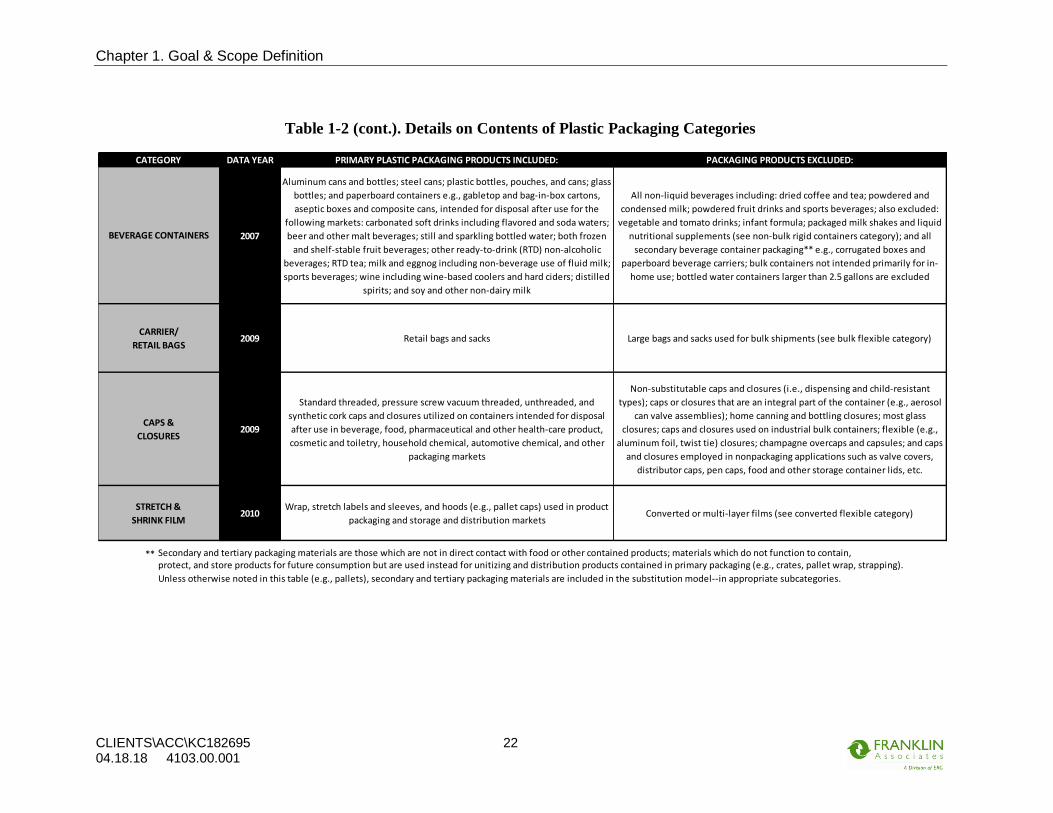
Chapter 1. Goal & Scope Definition
CLIENTS\ACC\KC182695 04.18.18 4103.00.001
22
Table 1-2 (cont.). Details on Contents of Plastic Packaging Categories
DATA YEAR PRIMARY PLASTIC PACKAGING PRODUCTS INCLUDED: PACKAGING PRODUCTS EXCLUDED:
2007
Aluminum cans and bottles; steel cans; plastic bottles, pouches, and cans; glass
bottles; and paperboard containers e.g., gabletop and bag-in-box cartons,
aseptic boxes and composite cans, intended for disposal after use for the
following markets: carbonated soft drinks including flavored and soda waters;
beer and other malt beverages; still and sparkling bottled water; both frozen
and shelf-stable fruit beverages; other ready-to-drink (RTD) non-alcoholic
beverages; RTD tea; milk and eggnog including non-beverage use of fluid milk;
sports beverages; wine including wine-based coolers and hard ciders; distilled
spirits; and soy and other non-dairy milk
All non-liquid beverages including: dried coffee and tea; powdered and
condensed milk; powdered fruit drinks and sports beverages; also excluded:
vegetable and tomato drinks; infant formula; packaged milk shakes and liquid
nutritional supplements (see non-bulk rigid containers category); and all
secondary beverage container packaging** e.g., corrugated boxes and
paperboard beverage carriers; bulk containers not intended primarily for in-
home use; bottled water containers larger than 2.5 gallons are excluded
2009 Retail bags and sacks Large bags and sacks used for bulk shipments (see bulk flexible category)
2009
Standard threaded, pressure screw vacuum threaded, unthreaded, and
synthetic cork caps and closures utilized on containers intended for disposal
after use in beverage, food, pharmaceutical and other health-care product,
cosmetic and toiletry, household chemical, automotive chemical, and other
packaging markets
Non-substitutable caps and closures (i.e., dispensing and child-resistant
types); caps or closures that are an integral part of the container (e.g., aerosol
can valve assemblies); home canning and bottling closures; most glass
closures; caps and closures used on industrial bulk containers; flexible (e.g.,
aluminum foil, twist tie) closures; champagne overcaps and capsules; and caps
and closures employed in nonpackaging applications such as valve covers,
distributor caps, pen caps, food and other storage container lids, etc.
2010Wrap, stretch labels and sleeves, and hoods (e.g., pallet caps) used in product
packaging and storage and distribution marketsConverted or multi-layer films (see converted flexible category)
** Secondary and tertiary packaging materials are those which are not in direct contact with food or other contained products; materials which do not function to contain, protect, and store products for future consumption but are used instead for unitizing and distribution products contained in primary packaging (e.g., crates, pallet wrap, strapping).
Unless otherwise noted in this table (e.g., pallets), secondary and tertiary packaging materials are included in the substitution model--in appropriate subcategories.
STRETCH &
SHRINK FILM
BEVERAGE CONTAINERS
CARRIER/
RETAIL BAGS
CAPS &
CLOSURES
CATEGORY

Chapter 1. Goal & Scope Definition
CLIENTS\ACC\KC182695 04.18.18 4103.00.001
23
1.2.3. System Boundary
This LCA focuses on plastic packaging applications and the plastic materials which are
substitutable by alternative materials. The following life cycle stages are included for each
packaging material application:
1. Raw material production of the packaging materials, which consists of all steps
from resource extraction through raw material production, including all
transportation,
2. Fabrication of the packaging from their raw materials and the subsequent
transportation of empty packaging from the fabrication site to the commodity filling
site,
3. Distribution transport of commodity and packaging from the commodity filling
site to the use site (focusing on differences in impacts due to packaging itself),
4. Postconsumer disposal of packaging in a landfill or waste-to-energy incineration,
and/or
5. Recycling of packaging, including transport from the use site to recycling facilities,
where applicable.
If the plastic packaging for a specific packaging application is made of more than one
polymer, the market shares of the relevant polymers are considered. Likewise, if more than
one alternative packaging material could substitute the analyzed plastic packaging, the
national market shares of these materials are included in the calculations. The analysis
focuses on the primary material components of each package and does not include small
amounts of substances such as adhesives, labels, and inks.
For the US or Canadian geographic context, average national recycling rates and pathways
for packaging used in the analyzed applications have been developed from research, recent
publications, and previous work conducted by Franklin Associates. For the US geographic
scope, postconsumer disposal of the percentage of packaging not recycled is modeled with
current US EPA statistics for waste management.15 For the Canadian geographic scope,
average recycling rates and pathways for packaging used in Canada are modeled with
current Canadian national waste management statistics.16
A summary flow diagram of the boundaries for the packaging applications is shown in
Figure 1-1. These boundaries are identical for either the US or Canadian geographic scope.
The boundaries account for transportation requirements between all life cycle stages and
industrial waste disposal and recycling occurring at each of the life cycle steps. The
boundaries account for transportation requirements between all life cycle stages. Because
of the very broad scope of packaging products covered by the project, some broad
15 US Environmental Protection Agency. Municipal Solid Waste Generation, Recycling, and Disposal in
the United States, see: http://www.epa.gov/wastes/nonhaz/municipal/msw99.htm. 16 Statistics Canada (2012). Human Activity and the Environment: Waste Management in Canada, 2012
– Updated, Statistique Canada, Catalogue no. 16-201-X, Ministry of Industry, September 2012.
Chapter 1. Goal & Scope Definition
CLIENTS\ACC\KC182695 04.18.18 4103.00.001
24
simplifying assumptions have been made regarding transportation distances and modes for
shipping packaging from converters to fillers in both the US and Canada.
Processes excluded from the analysis are shown in dotted lines. Filling requirements for
the products contained in the investigated packaging applications are excluded from the
boundaries of this study as they are beyond the scope of this study. Storage and/or
freezing/refrigeration requirements as well as the burdens associated with the product use
phase are also outside of the boundaries of this project. Exclusions are discussed in the next
section.
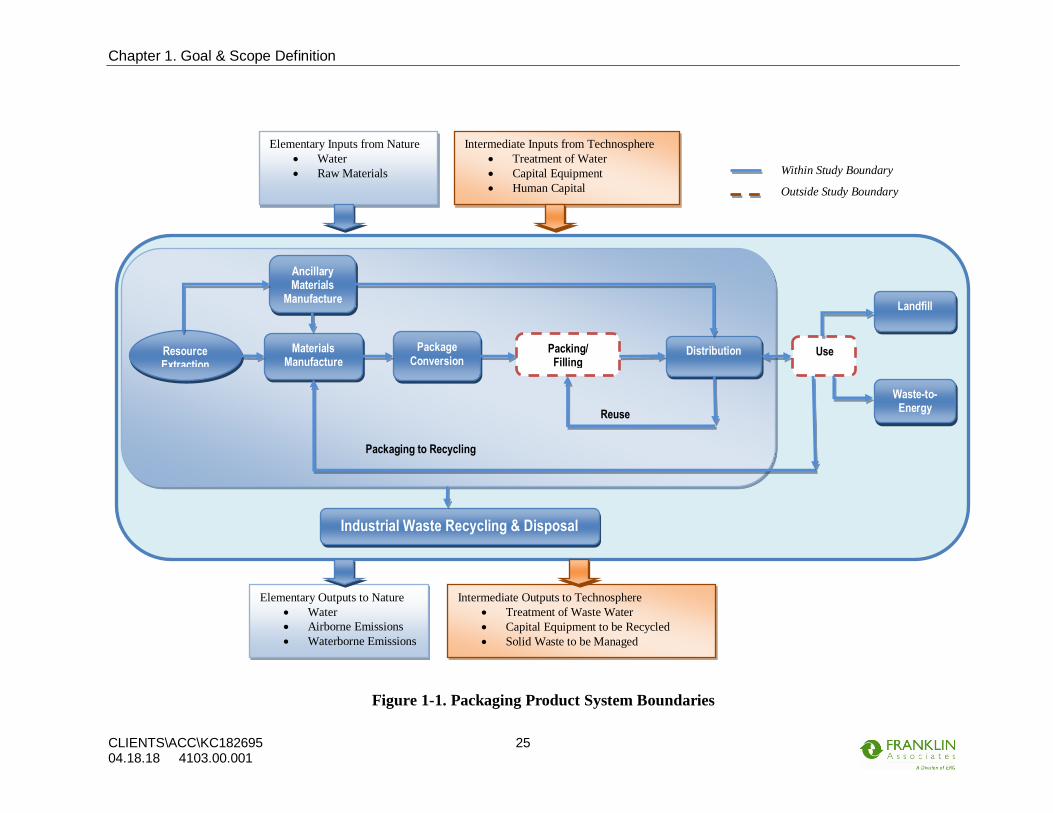
Chapter 1. Goal & Scope Definition
CLIENTS\ACC\KC182695 04.18.18 4103.00.001
25
Ancillary Materials
Manufacture
Package Conversion
Packing/ Filling
Distribution Use Resource Extraction
Landfill
Materials Manufacture
Waste-to-Energy
Industrial Waste Recycling & Disposal
Packaging to Recycling
Reuse
Within Study Boundary
Outside Study Boundary
Intermediate Inputs from Technosphere
• Treatment of Water
• Capital Equipment
• Human Capital
Elementary Inputs from Nature
• Water
• Raw Materials
Elementary Outputs to Nature
• Water
• Airborne Emissions
• Waterborne Emissions
Intermediate Outputs to Technosphere
• Treatment of Waste Water
• Capital Equipment to be Recycled
• Solid Waste to be Managed
Figure 1-1. Packaging Product System Boundaries

Chapter 1. Goal & Scope Definition
CLIENTS\ACC\KC182695 04.18.18 4103.00.001
26
1.2.3.1. System Components Excluded
The following components of each system are not included in this study:
Product Manufacturing. The focus of this study is the life cycle of the commodities’
packaging; therefore, all burdens associated with production of the products inside the
packages are excluded from the analysis.
Filling and/or Packing. The analysis does not include processes for packing, filling, or
wrapping processes required to put package contents into the packaging products analyzed.
Storage, Freezing and/or Refrigeration. Frozen or refrigerated storage is a requirement
for some of the products contained in packaging (e.g., food, beverage, pharmaceutical
applications) in this analysis. In this analysis, the substitution modeling is limited to direct
substitution, e.g., replacement of the primary package with an alternative package that is
used in the same way. For example, refrigerated products packaged in plastic (e.g., milk in
HDPE jugs) are assumed to be replaced with other types of packaging that are refrigerated
(e.g., paperboard cartons), rather than replaced by aseptic packages that have different
product heating and filling requirements and do not require refrigeration during post-filling
transportation and storage. Therefore, where the product requires freezing and/or
refrigeration, these requirements for the substitute package are assumed equivalent and are
not included as a differentiating factor in comparisons of packaging materials.
Inks, Labels, and Printing. Different packaging material schemes may use ancillary
materials for printing and labeling (e.g., inks, adhesives, and tags). However, decoration of
packaging is at the discretion of the user rather than a consistent functional feature across
packaging types within each category, and amounts of these materials are generally small
in comparison to the primary packaging material weight. Inks, labels, and printing are
therefore excluded from the scope of the analysis
Capital Equipment, Facilities, and Infrastructure. The energy and wastes associated
with the manufacture of buildings, roads, pipelines, motor vehicles, industrial machinery,
etc. are not included. The energy and emissions associated with production of capital
equipment, facilities, and infrastructure generally become negligible when averaged over
the total output of product or service provided over their useful lifetimes.
Product Damage. The analysis is based on the amounts of alternative packaging required
to provide the same basic functionality as the plastic packaging being substituted. For
example, the amount of crumpled or shredded paper required to substitute for protective
plastic packaging such as polystyrene foam loose fill shapes is based on equivalent volume
needed to fill the same amount of void space surrounding a packaged product. The analysis
does not make any assumptions or projections about differences in product damage or
breakage when substituting plastic packaging with other types of packaging. Not only
would this require broad assumptions about comparative properties and performance of
plastic and alternative packaging types in all applications, but the energy and wastes
associated with product repair or replacement depend on the specific product content that

Chapter 1. Goal & Scope Definition
CLIENTS\ACC\KC182695 04.18.18 4103.00.001
27
must be repaired or replaced. For example, the energy and emissions for repairing or
replacing a damaged computer are very different from the impacts of replacing a broken
glass vase. It is not feasible to try to evaluate potential comparative damage impacts for the
full scope of packaging applications included in this analysis.
Support Personnel Requirements. The energy and wastes associated with research and
development, sales, and administrative personnel or related activities have not been
included in this study, as energy requirements and related emissions are assumed to be
quite small for support personnel activities.
1.2.4. Allocation Procedures
This LCA follows the guidelines for allocating co-product credit shown in the ISO 14044:
2006 standard on life cycle assessment requirements and guidelines. In this standard, the
preferred hierarchy for handling allocation is (1) avoid allocation where possible, (2)
allocate flows based on direct physical relationships to product outputs, (3) use some other
relationship between elementary flows and product output. No single allocation method is
suitable for every scenario. How product allocation is made will vary from one system to
another but the choice of parameter is not arbitrary. ISO 14044 section 4.3.4.2 states “the
inventory is based on material balances between input and output. Allocation procedures
should therefore approximate as much as possible such fundamental input/output
relationships and characteristics.”
Some processes lend themselves to physical allocation because they have physical
parameters that provide a good representation of the environmental burdens of each co-
product. Examples of various allocation methods are mass, stoichiometric, elemental,
reaction enthalpy, and economic allocation. Simple mass and enthalpy allocation have been
chosen as the common forms of allocation in this analysis. However, these allocation
methods are not selected as a default choice, but made on a case by case basis after due
consideration of the chemistry and basis for production.
In the sequence of processes used to produce plastic resins from natural gas and petroleum
feedstocks, some processes produce material or energy co-products. When the co-product
is heat or steam or a co-product sold for use as a fuel, the energy content of the exported
heat, steam, or fuel is treated as an energy credit for that process (i.e., allocation by energy
content). When the co-product is a material, the process inputs and emissions are allocated
to the primary product and co-product material(s) on a mass basis. Allocation based on
economic value can also be used to partition process burdens among useful co-products;
however, this approach is less preferred under ISO life cycle standards, as it depends on
the economic market, which can change dramatically over time depending on many factors
unrelated to the chemical and physical relationships between process inputs and outputs.
1.2.5. Recycling Methodology
When material is used in one system and subsequently recovered, reprocessed, and used in
another application, there are different methods that can be used to allocate environmental

Chapter 1. Goal & Scope Definition
CLIENTS\ACC\KC182695 04.18.18 4103.00.001
28
burdens among different useful lives of the material. System expansion is the approach
used in this analysis. The types and quantities of materials that are displaced by the
recovery and processing of postconsumer material determine the types and quantities of
avoided environmental burdens. An overview of the system expansion approach used in
this analysis is presented in Figure 1-2.
For packaging made with postconsumer recycled content, burdens associated with recycled
content include collection, transport, and reprocessing of the postconsumer material. None
of the virgin production burdens for the material are allocated to its secondary use(s).
For packaging materials that are recycled at end of life, the recycling is modeled as a mix
of closed- and open-loop recycling, as appropriate for each packaging application and/or
material. System expansion is the approach used to avoid allocation in this analysis. Under
the system expansion approach, the types and quantities of materials that are displaced by
the recovered post-consumer material determine the types and quantities of avoided
material production credits or debits.
Systems with Recovery Rate > Recycled Content
• Packaging products that are recovered at a rate greater than the level needed to
sustain their recycled content are considered net producers of secondary material,
and are credited with avoided production burdens for the material that is displaced
by the excess amount of secondary material produced. The credit is based on the
amount of net material displacement at the end of the material’s current life cycle
as a packaging product. No further adjustments are made based on projections about
previous use cycles of the material prior to its use in the packaging product or
potential additional future cycles of reuse/recycling of the material after its use in
product systems subsequent to its useful life in the packaging product.
• When recovery exceeds the amount of material needed to maintain a system’s
recycled content (closed-loop recycling), the open-loop recycled portion of the
material receives displacement credit based on the mix of virgin and secondary
material it would displace. For example, recycled postconsumer packaging paper is
currently utilized in many products that are made from a mix of virgin and
secondary fiber. The recycled packaging material receives virgin displacement
credit for the percentage of virgin material that it displaces, but does not get virgin
material displacement credit for the portion of excess secondary material that would
be used as a substitute for other secondary material.
Systems with Recycled Content > Recovery Rate
• Systems using postconsumer materials drawn from a pool of secondary material
that is currently fully utilized (e.g., metals, resins) are considered net consumers of
secondary material if their use of postconsumer material exceeds their recovery
rate. If a packaging system’s recovery rate is not sufficient to sustain its recycled
content, the system is charged with burdens for the virgin material that would be
Chapter 1. Goal & Scope Definition
CLIENTS\ACC\KC182695 04.18.18 4103.00.001
29
required to make up for its net withdrawal from the current available supply of
secondary material.
• No makeup virgin material burdens are assigned to systems whose recycled content
is higher than their recovery rate if the net consumption of the secondary material
would be substituted by other secondary material. An example would be molded
pulp cartons or packaging shapes that are made from 100% postconsumer
newspaper but that have recovery rates less than 100%. The molded pulp
packaging’s net withdrawal from the available supply of postconsumer newspaper
would likely be made up not by increased use of virgin fiber but by utilization of
other available grades of postconsumer fiber.
The same material can have different system expansion credits/charges in different
applications. For example, container glass has an average recycled content of 25%. Beer
and soft drink bottles with a 41.4% US recovery rate are net producers of secondary
material and receive virgin material displacement credit for the excess recovered material.
Wine and liquor bottles have a 24.7% US recovery rate that essentially matches their
recycled content, so recycling credits are negligible. Other glass containers, which have an
average US recovery rate of 18.1%, are not recovered at a rate high enough to sustain the
average recycled content. As a result, they are net consumers of secondary material and are
charged with additional virgin glass production burdens to make up for the 7% deficit.

Chapter 1. Goal & Scope Definition
CLIENTS\ACC\KC182695 04.18.18 4103.00.001
30
Figure 1-2. System Expansion Recycling Method
(100% Recycling)
1.2.6. Data Requirements
ISO standards 14040 and 14044 detail various aspects of data quality and data quality
analysis. These ISO Standards state: “descriptions of data quality are important to
understand the reliability of the study results and properly interpret the outcome of the
study.” These ISO Standards list three critical data quality requirements: time-related
coverage, geographical coverage, and technology coverage. The study goals for these three
data quality requirements are discussed in the next sections.
Virgin Material Production
Packaging Manufacture
and Use
End-of-Life Recycle
Open Loop Recycled Avoided burdens** of the production of the material(s) displaced
in other product system(s)
Reprocessed Postconsumer
Material
Closed Loop Recycled Avoided burdens* of primary production
of material displaced by secondary
material processing
*Avoided burden depends on ratio of container recycled content and recycling rate **Devaluation factor applied due to the cascading nature of this portion of the reprocessed postconsumer material
Chapter 1. Goal & Scope Definition
CLIENTS\ACC\KC182695 04.18.18 4103.00.001
31
1.2.6.1. Geographic Coverage
The geographic scope of this study is North American (limited in this analysis to the US
and Canada); however, the scope does include raw material sourced from other regions of
the world (this primarily applies to crude oil imports). The main sources of data and
information for geography-dependent processes (e.g. energy production) are drawn from
North American specific reports and databases.
For materials where production data specific to commodities sold in North America were
not available (e.g., converting cotton yarn to textiles), data were adapted from the ecoinvent
LCI Database for the North American context. The following (foreground and background)
material and fuel unit processes within the European module were substituted with those
inventoried in North America:
• Transport processes
• Fossil fuels extraction, processing, and combustion
• Mineral and metals extraction and fabrication processes
• Plastic resin production, plastics fabrication, and plastics recycling processes
• Paper and paperboard products production
• Organic chemicals production
• Inorganic chemicals production
Also, adapted ecoinvent LCI processes have been modified to be consistent with the system
boundaries of the US data and within this project (for details on these aspects, see the
following section 1.2.7 Data Sources).
1.2.6.2. Technology Coverage
Life cycle inventory (LCI) data for materials and energy production, materials conversion
processes, transportation requirements, and recycling and disposal processes were
compiled from the most recent average North American technology. Data are utilized as is
appropriate for the US and Canadian geographic scope.
1.2.6.3. Temporal Coverage
Total plastic resin weight currently utilized in the US and Canada and the current market
share of plastic represented relative to competing packaging materials is based on market
report data for years 2007-2011. For LCI data, the most current publicly available data for
North America is utilized. A goal of this study is to use data with six or less years of
difference to the reference year (2011). Six years is chosen as the goal because it meets the
top two data scores for temporal correlation as identified in the pedigree matrix.17
17 Weidema B and Wesnaes MS (1996). Data quality management for life cycle inventories - an example
of using data quality indicators. International Journal of Cleaner Production, 4: 167-74.

Chapter 1. Goal & Scope Definition
CLIENTS\ACC\KC182695 04.18.18 4103.00.001
32
1.2.7. Data Sources
Summaries of the market and LCI data sources used for the US and Canadian geographic
scope are presented in Table 1-3.
Foreground data for production of plastic resins used in North America are from Franklin
Associates’ virgin and recycled resin data compiled for the American Chemistry Council
updated in 2011.18 LCI data for production of primary aluminum are from the Aluminum
Association’s 2013 report on semi-finished products19, and secondary aluminum data are
from the Aluminum Association’s 2010 aluminum can report.20 Data for production of fiber
corrugated materials are adapted from a gate-to-gate inventory of converted corrugated
boxes published by the Corrugated Packaging Alliance (CPA) in 2014.21 The LCI data for
producing lumber products utilize updated forestry LCI data from CORRIM Phase I and
Phase II reports.22,23 The updated CORRIM LCI data include seeding, cultivation, and
harvesting of lumber from four US forestry regions: the South East (SE), the Pacific North
West (PNW), the Inland North West (INW), and the North East-North Central (NE-NC)
areas. Data for the production of blast oxygen furnace (BOF) and electric arc furnace (EAF)
steel, virgin and recycled glass, virgin and recycled unbleached and bleached paperboard,
natural rubber, and cellophane are from Franklin Associates’ Private LCI Database.24
Cotton textile and cork data are adapted from ecoinvent.
Transport distances and logistics during the life cycle of the plastic and alternative
packaging materials were estimated by Franklin Associates based on average requirements
for product category life cycles in the US and Canada. Data for average fuel requirements
of transport per ton-mile or tonne-km have been compiled by Franklin Associates for the
US LCI Database.25
18 American Chemistry Council (2011). Cradle-to-Gate LCI of Nine Plastic Resins and Two
Polyurethane Precursors. Revised Final Report. Franklin Associates, A Division of ERG. 19 Aluminum Association. December 2013. The Environmental Footprint of Semi-Finished Aluminum
Products in North America, see:
http://www.aluminum.org/sites/default/files/LCA_Report_Aluminum_Association_12_13.pdf. 20 Aluminum Association (2010). Life Cycle Impact Assessment of Aluminum Beverage Cans, May
2010. Available at: http://www.aluminum.org/Content/ContentFolders/LCA/LCA_REPORT.pdf. 21 NCASI (2014). Life Cycle Assessment of U.S. Average Corrugated Product, Final Report. Prepared
for the Corrugated Packaging Alliance (CPA), a joint venture of the American Forest & Paper
Association (AF&PA), the Fibre Box Association (FBA), the Association of Independent Corrugated
Converters (AICC), and TAPPI. April 24, 2014. 22 Bowyer J, Briggs D, Lippke B, Perez-Garcia J, Wilson J (2004). Life Cycle Environmental
Performance of Renewable Materials in Context of Residential Building Construction: Phase I
Research Report. Consortium for Research on Renewable Industrial Materials, CORRIM Inc. Seattle,
WA. Report modules accessed at: http://www.corrim.org/pubs/reports/2005/Phase1/index.asp. 23 Lippke B, Wilson J, Johnson L, Puettmann M (2009). Phase II Research Report. Life Cycle
Environmental Performance of Renewable Materials in the Context of Building Construction.
Consortium for Research on Renewable Industrial Materials, CORRIM Inc. Seattle, WA. Report
modules accessed at: http://www.corrim.org/pubs/index.asp. 24 Franklin Associates (2010). Franklin Associates’ Private LCI Database 25 National Renewable Energy Lab (NREL). US LCI Database. See:
http://www.nrel.gov/lci/database/default.asp.
Chapter 1. Goal & Scope Definition
CLIENTS\ACC\KC182695 04.18.18 4103.00.001
33
Where LCI data is adapted from databases other than Franklin Associates’ Private LCI
Database or the US LCI Database (e.g., public study or ecoinvent LCI data) for use in either
the US and Canadian geographic scope, it has been modified to ensure consistency within
the system boundaries of this project. The following aspects were considered:
• Capital/Infrastructure requirements are removed, if necessary.
• Biomass raw material credits for carbon dioxide inputs from nature (e.g., reflecting
carbon uptake during growth) are replaced with end of life net storage credits, as
appropriate for each product. Franklin Associates’ methodology for carbon balance
of forestry and agricultural products reflects carbon sequestration and/or storage
specific to the lifespan of the product application incorporating the biomass-derived
material(s). Carbon storage in products is considered only when the carbon in the
bio-component of the product is not biodegradable and/or is not re-emitted to the
atmosphere within the 100-year assessment period. For products that meet these
requirements, Franklin Associates assigns a carbon storage credit to the fraction of
bio-component contained in the closed-loop recycled content of the product.
• In adapting ecoinvent LCI data sets for this analysis, the following global warming
air emissions have been removed from ecoinvent crude oil production processes:
o methane, bromotrifluoro (a.k.a. bromochlorotrifluoromethane or Halon
1301;
o methane, bromochlorodifluoro (a.k.a. bromochlorodifluoromethane or
Halon 1211).
Corresponding data sets used to model crude oil production in the US LCI Database
do not report these emissions. Because this likely reflects a difference in data
availability/reporting rather than actual process differences in crude oil extraction,
the ecoinvent emissions have been removed for consistency in GWP results using
the two LCI databases.

Chapter 1. Goal & Scope Definition
CLIENTS\ACC\KC182695 04.18.18 4103.00.001
34
Table 1-3. Summary of Data Sources
Temporal Information Geographical Coverage
Technological
Coverage Data Sources
Electrical &
Energy Sources
Energy source data from
late 1990s to 2008.
Electricity is 2014
generating mix
Based on average US or
Canadian grid
The most
representative
technologies
EPA eGRID 2014 generating fuel mix
for US26, IEA 2014 generating fuel mix
for Canada27, with generation data for
each fuel modeled using data from US
LCI database.
Raw Materials
(Natural Gas
and Oil)
Data from late 1990s to
2011
Natural Gas and Crude Oil based
on North American data;
transport represents average
amounts of domestic and foreign
oil.
The most
representative
technologies.
Compiled by Franklin Associates;
publicly available in the US LCI
Database
Raw Materials
for Lumber &
Fiber Pulp
Data from 2004 – 2009
Tree harvesting and processing
based on CORRIM Phase I and
II covering US SE, PNW, INW,
& NENC
The most
representative
technologies.
CORRIM Phase I and II LCI data
publicly available in the US LCI
Database
Virgin Resins
Production
Data from 2003-2007,
updated in 2011 North American average
The most
representative
technologies.
Franklin Associates virgin resin data
compiled for the American Chemistry
Council (ACC)28
Recycled Resins
Production Data from 2010 North American average
The most
representative
technologies.
Franklin Associates recycled resin data
compiled for ACC (2010 Recycled
Resins report)
26 Based on eGRID 2014 tables accessed at https://www.epa.gov/energy/emissions-generation-resource-integrated-database-egrid in November 2017. 27 Based on IEA 2014 electricity generation data for Canada accessed at
http://www.iea.org/statistics/statisticssearch/report/?country=CANADA=&product=electricityandheat in November 2017. 28 American Chemistry Council. 2011. Cradle-to-Gate LCI of Nine Plastic Resins and Two Polyurethane Precursors. Revised Final Report. Franklin
Associates, A Division of ERG. Accessible at https://plastics.americanchemistry.com/LifeCycle-Inventory-of-9-Plastics-Resins-and-4-Polyurethane-
Precursors-Rpt-Only/.
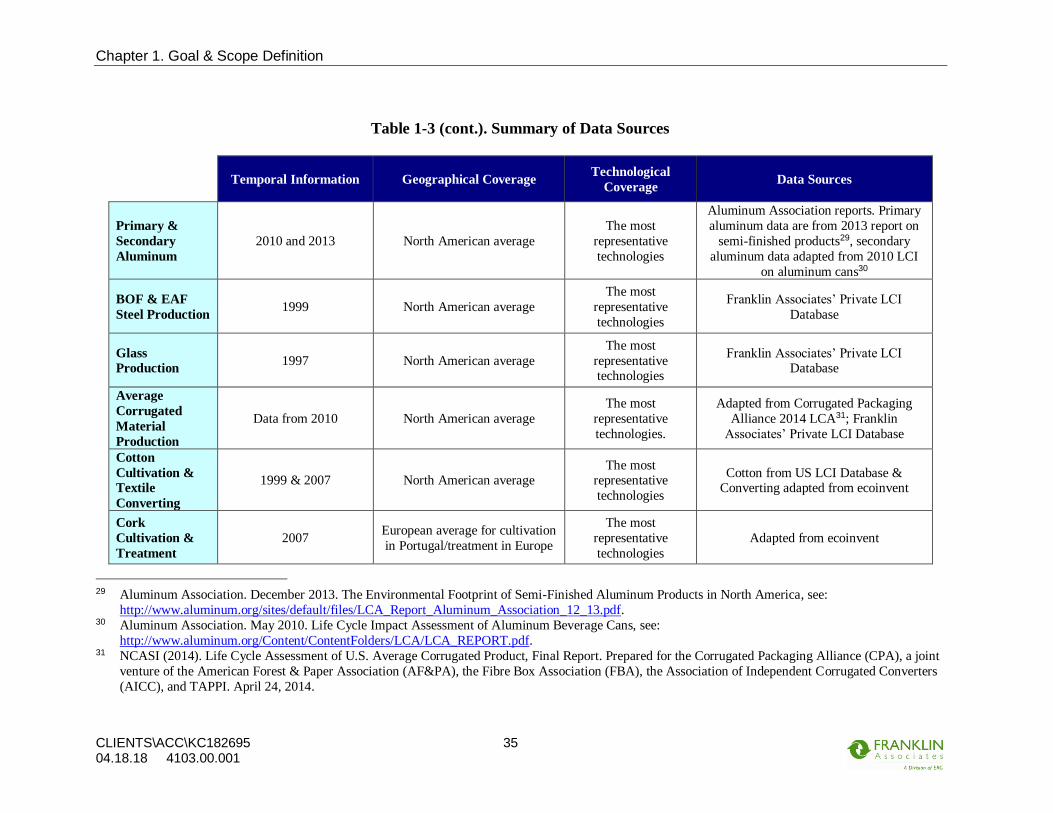
Chapter 1. Goal & Scope Definition
CLIENTS\ACC\KC182695 04.18.18 4103.00.001
35
Table 1-3 (cont.). Summary of Data Sources
Temporal Information Geographical Coverage Technological
Coverage Data Sources
Primary &
Secondary
Aluminum
2010 and 2013 North American average
The most
representative
technologies
Aluminum Association reports. Primary
aluminum data are from 2013 report on
semi-finished products29, secondary
aluminum data adapted from 2010 LCI
on aluminum cans30
BOF & EAF
Steel Production 1999 North American average
The most
representative
technologies
Franklin Associates’ Private LCI
Database
Glass
Production 1997 North American average
The most
representative technologies
Franklin Associates’ Private LCI Database
Average
Corrugated
Material
Production
Data from 2010 North American average
The most
representative
technologies.
Adapted from Corrugated Packaging
Alliance 2014 LCA31; Franklin
Associates’ Private LCI Database
Cotton
Cultivation &
Textile
Converting
1999 & 2007 North American average The most
representative
technologies
Cotton from US LCI Database & Converting adapted from ecoinvent
Cork
Cultivation &
Treatment
2007 European average for cultivation
in Portugal/treatment in Europe
The most
representative
technologies
Adapted from ecoinvent
29 Aluminum Association. December 2013. The Environmental Footprint of Semi-Finished Aluminum Products in North America, see:
http://www.aluminum.org/sites/default/files/LCA_Report_Aluminum_Association_12_13.pdf. 30 Aluminum Association. May 2010. Life Cycle Impact Assessment of Aluminum Beverage Cans, see:
http://www.aluminum.org/Content/ContentFolders/LCA/LCA_REPORT.pdf. 31 NCASI (2014). Life Cycle Assessment of U.S. Average Corrugated Product, Final Report. Prepared for the Corrugated Packaging Alliance (CPA), a joint
venture of the American Forest & Paper Association (AF&PA), the Fibre Box Association (FBA), the Association of Independent Corrugated Converters
(AICC), and TAPPI. April 24, 2014.

Chapter 1. Goal & Scope Definition
CLIENTS\ACC\KC182695 04.18.18 4103.00.001
36
Table 1-3 (cont.). Summary of Data Sources
Temporal Information Geographical Coverage
Technological
Coverage Data Sources
Natural Rubber
Production 1995-1999 North American average
The most
representative technologies.
Franklin Associates’ Private LCI Database
Paper &
Paperboard
Production
2006-2010 North American average
The most
representative
technologies
Franklin Associates’ Private LCI Database based on
Environmental Paper Network (EPN) Paper
Calculator
Material
Converting
Processes
Data from 1997 -2010 North American average
The most
representative
technologies.
Franklin Associates’ Private LCI Database, US LCI
Database, or adapted from ecoinvent
Transport
Processes Data from 2003-2010
Supply chain and geography
specific
The most
representative
technologies.
Distances supply chain and geography-specific
national averages compiled by Franklin Associates;
LCI data for transport modes from Franklin
Associates compiled for the US LCI Database32
Landfilling,
Energy
Recovery
Data from 2010-2011 US and Canadian national
averages
National average
management
Publicly available from the US EPA (originally
compiled by Franklin Associates)33 for US scope
and from Statistics Canada for Canadian scope34
Landfill Gas
Management Data for 2014
US and Canadian national
averages
National average
management
Publicly available national greenhouse gas
inventories for the US35 and Canada36
32 National Renewable Energy Lab (NREL). US LCI Database. See: http://www.nrel.gov/lci/database/default.asp. 33 US Environmental Protection Agency. Municipal Solid Waste Generation, Recycling, and Disposal in the United States, see:
http://www.epa.gov/wastes/nonhaz/municipal/msw99.htm. 34 Statistics Canada (2012). Human Activity and the Environment: Waste Management in Canada, 2012 – Updated, Statistique Canada, Catalogue no. 16-201-
X, Ministry of Industry, September 2012. 35 US Environmental Protection Agency. Inventory of U.S. Greenhouse Gas Emissions and Sinks: 1990-2015. Landfill gas management for 2014 from Table
7-3 CH4 Emissions from Landfills (MMT CO2 eq) 36 Environment and Climate Change Canada. National Inventory Report 1990-2015: Greenhouse Gas Sources and Sinks in Canada. Canada’s Submission to
the United Nations Framework Convention on Climate Change. Part 2. Landfill gas management for 2014 from Table A3-69 Estimated MSW CH4
Generated, Captured, Flared, and Emitted for 1990-2015.
Chapter 2. Substitution Model
CLIENTS\ACC\KC182695 04.18.18 4103.00.001
37
1.2.8. Impact Assessment
The output of a life cycle inventory is a lengthy and diverse list of elementary and
intermediate inputs and outputs, making it difficult to interpret systems’ differences in
impacts in a concise and meaningful manner. Life Cycle Impact Assessment (LCIA) helps
with interpretation of the emissions inventory. LCIA is defined in ISO 14044 section 3.4
as the “phase of life cycle assessment aimed at understanding and evaluating the magnitude
and significance of the potential environmental impacts for a product system throughout
the life cycle of the product.” In the LCIA phase, the inventory of emissions is first
classified into categories in which the emissions may contribute to impacts on human
health or the environment. Within each impact category, the emissions are then normalized
to a common reporting basis, using characterization factors that express the impact of each
substance relative to a reference substance.
Characterization factors have been defined to estimate the amount of impact potential of
LCI results. Impacts can be characterized as midpoint or endpoint indicators. The
‘midpoint’ approach links results to categories of commonly defined environmental
concerns like eutrophication and climate change. The ‘endpoint’ approach further models
the causality chain of environmental stressors to link LCI results to environmental damages
(e.g., to human and ecosystem health). ISO standards allow the use of either method in the
LCIA characterization step. Overall, indicators close to the inventory result (midpoint)
have a higher level of scientific consensus, as less of the environmental mechanism is
modeled. Conversely, endpoint and damage-oriented characterization models inevitably
include much aggregation and some value-based weighting of parameters. To reduce
uncertainty in communication of the results, this study focuses on indicators at the midpoint
level.
1.2.8.1. Scope of Impact Assessment
This study evaluates the comparative performance of plastic and alternative material
packaging systems for a variety of environmental indicators. The indicators, along with
brief descriptions, evaluation methodology, and reporting units, are shown in Table 1-4.

Chapter 2. Substitution Model
CLIENTS\ACC\KC182695 04.18.18 4103.00.001
38
Table 1-4. Environmental Indicators Evaluated
Impact/Inventory
Category Description Unit
LCIA/LCI
Methodology
LC
I C
ate
gorie
s
Total energy
demand
Measures the total energy from point
of extraction; results include both
renewable and non-renewable energy
sources
MJ Cumulative energy
inventory
Expended energy
Energy irretrievably consumed;
calculated as total energy minus the
potentially recoverable energy
embodied in the material.
MJ
Cumulative energy
inventory minus
energy embodied in
material
Water
consumption
Freshwater withdrawals which are
evaporated, incorporated into products
and waste, transferred to different
watersheds, or disposed into the sea
after usage
liters H2O
Cumulative water
consumption
inventory
Solid waste by
weight
Measures quantity of fuel, process and
postconsumer waste to a specific fate
(e.g., landfill, WTE) for final disposal
on a mass basis
kg Cumulative solid
waste inventory
Solid waste by
volume
Measures quantity of fuel, process and
postconsumer waste to a specific fate
(e.g., landfill, WTE) for final disposal
on a volume basis
m3 Cumulative solid
waste inventory
LC
IA C
ate
gorie
s
Global warming
potential (GWP)
Represents the heat trapping capacity of the greenhouse gases. Important
emissions: CO2 fossil, CH4, N2O
kg CO2 equivalents
(eq)
IPCC (2013) GWP 100a
Acidification
potential
Quantifies the acidifying effect of
substances on their environment.
Important emissions: SO2, NOx, NH3,
HCl, HF, H2S
kg SO2 eq TRACI v2.1
Eutrophication
potential
Assesses impacts from excessive load
of macro-nutrients to the environment.
Important emissions: NH3, NOx, COD
and BOD, N and P compounds
kg N eq TRACI v2.1
Smog formation
potential
Determines the formation of reactive
substances (e.g. tropospheric ozone)
that cause harm to human health and vegetation. Important emissions: NOx,
BTEX, NMVOC, CH4, C2H6, C4H10,
C3H8, C6H14, acetylene, Et-OH,
formaldehyde
kg O3 eq TRACI v2.1
Ozone depletion
potential
Measures stratospheric ozone
depletion. Important emissions: CFC
compounds and halons
kg CFC-11 eq TRACI v2.1
Chapter 2. Substitution Model
CLIENTS\ACC\KC182695 04.18.18 4103.00.001
39
1.2.8.2. Energy Demand Accounting
Franklin Associates uses its own method to assess energy demand. The energy demand
method is not an impact assessment, but rather is a cumulative inventory of energy
extracted and utilized, including both renewable and non-renewable energy. Non-
renewable fuels include fossil fuels (i.e., natural gas, petroleum, and coal) and nuclear
energy, while fuels classified as renewable include hydroelectric energy, wind energy,
hydropower, geothermal energy, and biomass energy. All of the results for energy demand
are expressed in units of mega joule (MJ) equivalents.
Energy demand results include consumption of fuels for process and transportation energy,
as well as the fuel-energy equivalent for materials that are derived from fossil fuels or
biomass. The energy value of resources used as material feedstock is referred to as energy
of material resource, or EMR. EMR is not expended energy (i.e., energy that is consumed
through combustion) but the energy value of resources with fuel value (e.g., oil, natural
gas, wood) that are used to provide material content for products such as plastic resins or
corrugated boxes. Some of this energy remains embodied in the material produced rather
than being irretrievably expended through combustion, as is the case for process and
transportation fuels. In this study, EMR applies to the crude oil and natural gas used to
produce the plastic packaging. A fuel-energy equivalent (biomass EMR) is also assigned
to biomass materials used as material feedstock in substitute packaging (e.g., corrugated
fiber).
The energy values for fuels and electricity consumed in each industrial process are summed
and categorized into an energy profile including the energy types (i.e., sources) listed
below:
• Natural gas
• Petroleum
• Coal
• Nuclear
• Hydropower
• Biomass
• Other non-fossil
• Other fossil
The “other non-fossil” category includes sources such as solar, wind, and geothermal
energy. The “other fossil” category refers to other fuels derived from fossil fuel sources
such as combustion of fossil-derived plastics and rubbers in municipal solid waste.
All conversions for fuel inputs reflect the fuels’ higher heating values (HHV). Fuel
production is from the Franklin Associates Private LCI Database. The values for densities
and heat of combustion for coal and fossil fuels are calculated using data published in
Chapter 2. Substitution Model
CLIENTS\ACC\KC182695 04.18.18 4103.00.001
40
version 1.8b of Argonne National Laboratory’s GREET model.37 The fuels and energy LCI
data used by Franklin Associates is based on modules available in the US LCI Database,
with more recent updates from eGRID 2014 and GREET 1.8b.
1.2.8.3. Global Warming Potential
For GWP in both geographic scopes, contributing elementary flows are characterized using
factors reported by the Intergovernmental Panel on Climate Change (IPCC) in 2013 with a
100 year time horizon. The primary 100-year GWPs used in the models are fossil carbon
dioxide—1, methane—28, and nitrous oxide—265 as developed by the Intergovernmental
Panel on Climate Change (IPCC) in 2013. Carbon dioxide emissions resulting from landfill
decomposition of biomass-derived packaging in landfills are considered carbon neutral, as
the biomass carbon is returned to the atmosphere in the same form that it was removed
during the plant’s growth. Therefore, biogenic CO2 emissions are not included in the net
GWP calculations. However, biogenic methane emissions from decomposition are
included, since the biogenic methane has higher global warming impacts in the atmosphere
until it converts to CO2. Consistent with the TRACI methodology, a lower GWP factor is
used for biogenic methane (25.25, compared to 28 for fossil methane) to adjust for the
eventual atmospheric transformation of biogenic methane to carbon-neutral biogenic
CO2.38
1.2.8.4. Plastic Packaging Substitution Footprint
The results are scaled to represent the annual impacts for plastics versus alternative material
packaging at both US and Canadian demand levels. The material substitution footprint is
only for the specified plastic packaging product groups as designated in Section 1.2.3.
System Boundaries in the US and Canada; these scaled-up results should not be interpreted
as totals for alternative geographic scopes or for global packaging systems.
1.2.8.5. Interpretation of Results Using Equivalencies
The magnitude of impact assessment results can be difficult to interpret. Equivalencies can
be used as an aid for providing perspective on results. Factors from sources such as the US
EPA Greenhouse Gas Equivalencies Calculator39 are used in this analysis to convert
savings into more easily visualized terms, such as the equivalent number of passenger
vehicles’ annual use, railcars of coal burned, etc. Equivalency factors are presented in
Chapter 4.
37 GREET Version 1.6. Developed by Michael Wang. Center for Transportation Research, Argonne
National Laboratory. October 2001. Updates from Version 1.8b. 38 EPA (2010). Methane and Nitrous Oxide Emissions from Natural Sources, Office of Atmospheric
Programs, Washington DC. US Environmental Protection Agency, Report EPA 430-R-10-001. April
2010. Available at: http://www.epa.gov/outreach/pdfs/Methane-and-Nitrous-Oxide-Emissions-From-
Natural-Sources.pdf. 39 Accessed at http://www.epa.gov/cleanenergy/energy-resources/calculator.html
Chapter 2. Substitution Model
CLIENTS\ACC\KC182695 04.18.18 4103.00.001
41
1.2.9. Assumptions and Limitations
Although the foreground material production, converting, recycling, transportation, and
disposal processes in this analysis were populated with data from reliable, most analyses
still have limitations. Further, it is necessary to make a number of assumptions when
modeling, which could influence the final results of a study. Key limitations and
assumptions of this analysis are described in this section.
1.2.9.1. LCI Composition and Weight Factors
Material weights for plastic packaging are provided by Freedonia market data for the years
2007-2011. These data were cross-checked with totals indicated in other reliable
publications.40,41 The weights of alternative packaging materials projected for plastic
packaging substitution are compiled by Franklin Associates using: 1) case study examples
in packaging studies, 2) primary data from previous public and private LCAs performed
by Franklin Associates, and/or 3) publicly available specifications from packaging
providers. It was assumed that the product contained/unitized by the packaging would not
be changed or altered in any way. For example, substitution of a liquid product packaged
in a plastic bottle (e.g., liquid hand soap or laundry detergent) with a solid form of the
product packaged in a different material (e.g., a bar of hand soap in a paper wrapper,
powdered detergent granules in a paperboard box) are not accepted substitutions. The
substitution modeling is also limited to direct substitution, e.g., replacement of the primary
package with an alternative package that is used in the same way. For example, refrigerated
products packaged in plastic (e.g., milk in HDPE jugs) are assumed to be replaced with
other types of packaging that are refrigerated (e.g., paperboard cartons), rather than
replaced by aseptic packages that have different product heating and filling requirements
and do not require refrigeration during post-filling transportation and storage.
In some types of substitute packaging, some use of plastic is still required for functionality,
e.g., plastic coatings on gable-top cartons for liquids, laminated plastic coatings on aseptic
cartons, and plastic liners used inside of rigid paper-based containers used with liquid
contents. In all cases, the plastic content in substitute packaging is less than half of its mass.
1.2.9.2. Electricity Grid Profile
It is generally not possible to determine the mix of locations for supply chain sourcing for
all the materials and processes contributing to the life cycle of a given product. In addition,
electricity production and distribution systems in North America are interlinked; there are
imports and exports of generated electricity between regions so that the mix of fuels used
to generate electricity in a specific area is not necessarily the same as the generating mix
for the electricity consumed in that area. The generating mix used for US packaging
40 ACC (2012). The Resin Review: The Annual Statistical Report of the North American Plastics
Industry, American Chemistry Council, 2012 Edition. 41 EPA (2011). Municipal Solid Waste Generation, Recycling, and Disposal in the United States,
Detailed Tables and Figures for 2010. Compiled by Franklin Associates, A Division of ERG for the
US Environmental Protection Agency.

Chapter 2. Substitution Model
CLIENTS\ACC\KC182695 04.18.18 4103.00.001
42
systems is modeled using U.S. EPA eGRID tables for 201442, which was the most recent
eGRID data available during the modeling for this analysis. For temporal consistency, the
Canadian electricity grid is modeled with 2014 generating data from the International
Energy Agency43 All foreground processes (e.g., packaging conversion, re-processing, and
disposal processes) are assumed to be supplied with US and Canadian average grid mix,
for the US and Canadian geographic scope, respectively.
The electricity grids used in this analysis are not specific to a type of industry, with the
exception of the primary aluminum supply chain, which has specific geographic sourcing
for raw materials and intermediate processing steps. For the primary aluminum supply
chain, the fuel profile for electricity supplied for bauxite mining and alumina production is
modeled with the electricity grids of its corresponding geographies (including Australia
and Jamaica). All electricity grids were modeled to take into account line losses during
transmission.
1.2.9.3. Transportation
The data in the Franklin Associates LCI models include transportation requirements
between manufacturing steps. For upstream processes (such as crude oil extraction,
petrochemical production, etc.) the transportation modes and distances are based on
average industry data. For the foreground converting steps of producing plastic and
alternative material packaging products, the transportation requirements were based on the
transportation modes and distances typical for each supply chain in each geographic scope.
Data for these transport distances and modalities were compiled by Franklin Associates
based on previous public and private LCA studies and publicly available transportation
reports. Only the weights of the packages, not the weights of the products contained in the
packaging materials, are included in the transportation calculations. For either geographic
scoping, the boundaries of this LCA include the environmental burdens of the packaging,
not the environmental burdens of the product inside the packaging.
1.2.9.4. Waste Management
In this portion of the study, estimates of the end results of landfilling and waste-to-energy
(WTE) combustion are limited to global warming potential (GWP) effects, electricity
credits, and requirements for transporting waste to a landfill and operating landfill
equipment. Recycling energy requirements are also taken into account.
In the US, municipal solid waste (MSW) that is not recovered for recycling or composting
is managed 82 percent by weight to landfill (LF) and 18 percent by weight to waste-to-
42 Based on eGRID 2014 tables accessed at https://www.epa.gov/energy/emissions-generation-resource-
integrated-database-egrid in November 2017. 43 Based on IEA 2014 electricity generation data for Canada accessed at
http://www.iea.org/statistics/statisticssearch/report/?country=CANADA=&product=electricityandheat
in November 2017.

Chapter 2. Substitution Model
CLIENTS\ACC\KC182695 04.18.18 4103.00.001
43
energy (WTE) incineration.44 In Canada, 95 percent by weight of disposed weight goes to
LF, three percent to WTE, and the remaining two percent to incineration without energy
recovery.45 Thus, the calculations of the GWP impacts for the portion of packaging that is
discarded are based on a scenario in which 82 percent of the postconsumer packaging that
is not recycled goes to LF and 18 percent to WTE combustion in the US and 95 percent of
packaging that is not recycled goes to LF, three percent to WTE, and the remaining two
percent to incineration without energy recovery in Canada. The following factors are
considered in modeling the landfilling and WTE processes:
• The ash resulting from WTE combustion is later landfilled, but does not result in
landfill gas emissions. The US EPA’s Landfill Methane Outreach Program
(LMOP) Landfill Database46 and Environment Canada47 indicate that the majority
of landfill gas burned with energy recovery is used to produce electricity. The gross
energy recovered from combustion of LF gas (calculated per material for each
geographic scope) is modeled to be converted to displaced quantities of grid
electricity for each geographic scope using an efficiency factor of 1 kWh generated
per 11,700 Btu of LF gas burned.48
• The HHV (higher heating value) was used for the modeling of energy recovery
from the combustion of postconsumer waste. These heating values are calculated
based on the material composition of the disposed container components.
• GWP contributions from WTE combustion of postconsumer packaging and from
fugitive emissions of landfill methane from anaerobic decomposition of biomass-
derived materials are included. Credits for grid electricity displaced by the
generation of electricity from WTE combustion of postconsumer containers and
from WTE combustion of methane recovered from decomposition of landfilled
corrugated board are also included. Some carbon is also sequestered in the biomass-
derived materials that do not decompose. The US EPA greenhouse gas accounting
methodology does not assign a carbon sequestration credit to landfilling of fossil-
derived materials because this is considered a transfer between carbon stocks (from
oil deposit to landfill) with no net change in the overall amount of carbon stored.49
Decomposition of landfilled paper and paperboard can vary, depending not only upon the
conditions in individual landfills (e.g., temperature, moisture, microbial activity) but also
44 US EPA. Municipal Solid Waste Facts and Figures 2011. Accessible at
http://www.epa.gov/msw/msw99.htm. 45 Statistics Canada (2012). Human Activity and the Environment: Waste Management in Canada, 2012
– Updated, Statistique Canada, Catalogue no. 16-201-X, Ministry of Industry, September 2012. 46 Operational LFG energy projects spreadsheet, sorted by LFGE utilization type and project type.
Accessible at http://www.epa.gov/lmop/proj/#1. 47 Jackson (2005). Landfill Gas Management in Canada: What’s Going on North of the Border?
Presentation by Dennis Jackson of the National Office of Pollution Prevention, Environment Canada at
the 8th Annual LMOP Conference, January 2005. Accessible at:
http://www.epa.gov/lmop/documents/pdfs/conf/8th/presentation-jackson.pdf. 48 LMOP Benefits Calculator. Calculations and References tab. Accessible at
http://www.epa.gov/lmop/documents/xls/lfge_benefitscalc.xls. 49 US EPA. Solid Waste Management and Greenhouse Gases: A Life-Cycle Assessment of
Emissions and Sinks. Third Edition. September 2006. Section 1.3, subsection Carbon Stocks, Carbon
Storage, and Carbon Sequestration. Page 6.
Chapter 2. Substitution Model
CLIENTS\ACC\KC182695 04.18.18 4103.00.001
44
on the presence or absence of coatings, laminations, or additives that inhibit decomposition.
This analysis presents results for two landfill decomposition scenarios for paper and
paperboard packaging:
• A conservative scenario in which there is no decomposition of landfilled
paper/paperboard and all the biogenic carbon content is sequestered.
• A scenario in which the fiber content of uncoated paper/paperboard packaging
decomposes to the maximum degree, and fiber content in coated and laminated
paper/paperboard does not decompose.
The maximum decomposition of landfilled paper and paperboard packaging in this analysis
is modeled based on the maximum decomposition of corresponding types of paper-based
materials in landfill simulation experiments conducted by William Eleazer, et al.50 Landfill
simulation experiments conducted by Eleazer, et al. analyzed decomposition of office
paper, clay-coated magazine paper, newspaper, and corrugated material. For paper-based
materials, the cellulose and hemicellulose fractions of the material decompose to some
extent, while the lignin fraction of the material tends to decompose to a much lesser extent
under anaerobic conditions. Thus, the potentially degradable carbon content of the
landfilled material is based on its cellulose and hemicellulose content. This analysis uses
experimental data on office paper to estimate decomposition of bleached kraft paperboard
in packaging materials (e.g., paperboard cartons). Experimental data on decomposition of
corrugated is used to estimate decomposition of all types of uncoated unbleached paper
and paperboard packaging, while experimental data on decomposition of newspaper is used
to represent molded fiber products made from postconsumer newspaper (e.g., molded pulp
egg cartons and packaging shapes). Based on the cellulose, hemicellulose, and lignin
percentages in each material, and the carbon content of each fraction, the total carbon
content of bleached office paper is calculated as 44.1 percent by weight (42.6 percent
potentially degradable carbon in the cellulose and hemicellulose fractions, 1.5 percent
carbon in lignin); for corrugated, the total carbon content of corrugated is calculated as
43.2 percent (29.9 percent potentially degradable, 13.3 percent in lignin); and the total
carbon content of newspaper is calculated as 40.9% by weight (25.6% potentially
degradable carbon in the cellulose and hemicellulose fractions, 15.2% carbon in lignin).
Plastic-coated paperboard items were not included in the simulated landfill experiments,
but it is likely that the coating on the containers will delay or significantly inhibit
decomposition of the paper; therefore, this analysis uses a conservative approach in
assuming that the fiber content of paper and paperboard packaging does not decompose.
Because the landfill simulation experiments were designed to maximize decomposition,
the baseline estimates in this study for uncoated paper and paperboard packaging should
be considered an upper limit for landfill gas generation from decomposition.
In the experiments conducted by Eleazer, et al., the following conditions were used to
simulate enhanced decomposition in a landfill: addition of a seed of well-decomposed
refuse to help initiate decomposition, incubation at about 40C, and leachate recycling and
50 Eleazer, William, et al. “Biodegradability of Municipal Solid Waste Components in Laboratory-Scale
Landfills.” Published in Environmental Science & Technology. Volume 31, Number 3, 1997.

Chapter 2. Substitution Model
CLIENTS\ACC\KC182695 04.18.18 4103.00.001
45
neutralization. The maximum degree of decomposition for the cellulose and hemicellulose
fractions of office paper was 98 percent and 86 percent, respectively. In the corrugated
samples, the degree of decomposition was 64 percent for the cellulose and 62 percent for
the hemicellulose. The maximum degree of decomposition for the cellulose and
hemicellulose fractions of newspaper were 27% and 54%, respectively. Overall, 41 percent
by weight of the office paper, 19 percent by weight of the corrugated, and 8 percent of the
newspaper degraded to produce CO2 and methane. The remaining biomass carbon content
of each material did not degrade. It is assumed that all the carbon that degrades produces
methane and CO2.
Biomass CO2 released directly from decomposition of paper products or indirectly from
oxidation of biomass-derived methane to CO2 is considered carbon neutral, as the CO2
released represents a return to the environment of the carbon taken up as CO2 during the
plant’s growth cycle and does not result in a net increase in atmospheric CO2. Thus,
biomass-derived CO2 is not included in the GHG results shown in this analysis. Methane
releases to the environment from anaerobic decomposition of biomass are not considered
carbon neutral, however, because these releases resulting from human intervention have a
higher GWP than the CO2 taken up or released during the natural carbon cycle.
The gross energy recovered from combustion of LF gas from each material in both the US
and Canada is converted to displaced quantities of grid electricity using an efficiency factor
of 1 kWh generated per 11,700 Btu of LF gas burned.51 Each packaging system is credited
with avoiding the GWP associated with production of the offset quantity of grid electricity.
The grid electricity offset was assumed to be the average US electricity grid for the US
geographic scope and average Canadian electricity grid for the Canadian geographic scope.
For the carbon that remains fixed in the landfilled biomass-derived material (e.g., in the
undecomposed portion of the corrugated packaging), a sequestration credit is given for the
equivalent pounds of CO2 that the sequestered carbon could produce.
Waste-to-energy combustion of postconsumer material is modeled using a similar
approach to the landfill gas combustion credit. However, for WTE combustion of
packaging, the CO2 releases are modeled based on the total carbon content of the material
oxidizing to CO2. For combustion of fiber-based corrugate, the CO2 produced is considered
carbon-neutral biomass CO2, while the CO2 from combustion of plastics is fossil CO2.
The gross heat produced from WTE combustion is calculated based on the pounds of
material burned and the higher heating value of the material. The heat is converted to kWh
of electricity using a conversion efficiency of 1 kWh per 19,120 Btu for mass burn
facilities52, and a credit is given for avoiding the GWP associated with producing the
equivalent amount of grid electricity.
51 LMOP Benefits Calculator. Calculations and References tab. Accessible at
http://www.epa.gov/lmop/res/lfge_benefitscalc.xls. 52 US EPA. Solid Waste Management and Greenhouse Gases: A Life-Cycle Assessment of
Emissions and Sinks. Third Edition. September 2006. Chapter 5 Combustion, section 5.1.5.
Calculation is based on 550 kWh produced per ton of MSW burned, with a heat value of 5,000 Btu per

Chapter 2. Substitution Model
CLIENTS\ACC\KC182695 04.18.18 4103.00.001
46
The net end-of-life GWP for each system is calculated by summing the individual impacts
and credits described above.
As noted, the landfill methane calculations in this analysis are based on the aggregated
emissions of methane that may result from decomposition of the degradable carbon content
of the landfilled material. The long time frame over which those emissions occur has
implications that result in additional uncertainties for the landfill methane GWP estimates.
• In this analysis, the management of the aggregated landfill methane emissions is
modeled based on current percentages of flaring, WTE combustion, and uncaptured
releases for each geographic scope. Over time, it is likely that efforts to mitigate
global warming will result in increased efforts to capture and combust landfill
methane. Combustion of biomass-derived methane converts the carbon back to
CO2, neutralizing the net global warming impact. In addition, if the combustion
energy is recovered and used to produce electricity, there would be credits for
displacing grid electricity. With increased future capture and combustion of landfill
methane, the future net effect of landfill methane could gradually shift from a
negative impact to a net credit.
• Although landfill methane releases from decomposition occur gradually over many
years, the modeling approach used to calculate the impacts of the aggregated
emissions use 100-year global warming potentials. This is consistent with the use
of 100-year global warming potentials used for all other life cycle greenhouse gas
emissions. The total GWP for landfill decomposition over time is reported as a
single cumulative value. Future refinements to end-of-life modeling may include
time-scale modeling of landfill methane emissions; however, this is not part of the
current study.
• Energy and emissions associated with releases or treatment of leachate are not
included in this model due to lack of available data.
1.2.10. Critical Review of the Substitution Model Methodology
The substitution model defining the weight factors for substitution of plastic packaging
relative to alternative packaging materials as well as the national recycling and EOL
statistics used in modeling were reviewed by the following LCA experts:
1. Harald Pilz, Denkstatt GmbH
2. Roland Hischier, Empa Research Institute
The reviewers examined the details of the substitution model methodology, including
description of data sources used, modeling assumptions, and general approach to ensure
that the substitution modeling is reasonable and robust.
pound of MSW. For mass burn facilities, 523 kWh of electricity are delivered per 550 kWh generated.
Full report and individual chapters of the report are accessible at
http://www.epa.gov/climatechange/wycd/waste/SWMGHGreport.html.
Chapter 2. Substitution Model
CLIENTS\ACC\KC182695 04.18.18 4103.00.001
47
CHAPTER 2. SUBSTITUTION MODEL
2.1. INTRODUCTION
Franklin Associates first conducted a life cycle energy analysis of US plastic packaging
and alternatives in 1990 for the Society of the Plastics Industry. The current analysis
employs a similar but more detailed approach compared to the 1990 study and is expanded
here to include the Canadian geographic scope as well as both energy demand and
greenhouse gas (GHG) emissions. The current study is also patterned after a 2010 study on
plastics and alternatives commissioned by PlasticsEurope.53 The primary similarities and
differences between the European and North American analyses assessing effects of a
theoretical substitution of plastics packaging are summarized below.
2.1.1. Similarities
• Goal. Though the European study also investigated plastic products other than
packaging, the goal of both the packaging section of the European analysis and this
North American study is to assess the effect of a theoretical substitution of plastic
packaging at a national/continental level.
• Plastics examined: Both analysis assessed the theoretical substitution of
predominant packaging resins: low- and high-density polyethylene, polypropylene,
polyvinylchloride, polystyrene, expanded polystyrene, and polyethylene
terephthalate.
• Functional unit. The substitution model in both of the analyses considered the
functional unit to be the mass of material(s) required to provide the same packaging
function or service as the theoretically substituted plastic package.
• Results reported. The European study and the original North American study
focused on energy and global warming potential (GWP) impacts; other life cycle
impact assessment categories were not included in the scope of the analyses.
However, this expansion of the North American study includes additional impact
categories.
• Life cycle approach. Both analyses include all stages of the packaging life cycle,
from raw material extraction through end-of-life management and recycling.
• System expansion credit. For plastic and non-plastic packaging with recycling
rates that are higher than their recycled content (i.e., that are net producers of
recycled material), both analyses assign credits for the amount of recovered
material that displaces virgin material. Energy and greenhouse gas credits are also
given for waste-to-energy combustion of packaging that displaces production and
combustion of other types of fuel.
53 Pilz H, Brandt B, Fehringer R (2010). The Impact of Plastics on Life Cycle Energy Consumption and
Green-House Gas Emissions in Europe, Part 1: Effects of a Theoretical Substitution of Plastics.
Prepared by Denkstatt GmbH for PlasticsEurope Association of Plastics Manufacturers Association
and Sustainable Energy Europe, Final Report June 2010.
Chapter 2. Substitution Model
CLIENTS\ACC\KC182695 04.18.18 4103.00.001
48
• Non-substitutable packaging. Both analyses classify some types of plastic
packaging as non-substitutable; that is, plastic packaging with functional
performance that cannot be duplicated by non-plastic alternatives. Non-
substitutable packaging is excluded from the analysis to the extent possible.
2.1.2. Differences
• Data sources for substitution model. The European analysis primarily utilized the
extensive private German GVM database on packaging to determine the types and
weights of packaging that would substitute for plastic packaging. The North
American study primarily utilizes market data purchased from the Freedonia
Group, supplemented with data from Franklin Associates’ extensive history of
North American LCA studies and additional packaging weight data from
manufacturers’ websites and published studies.
• Packaging categories. Both the European and North American analyses break the
substitution analysis out into several packaging categories. Based on the packaging
categories available in the Freedonia market reports, the North American analysis
uses somewhat different categories than the European study, as summarized in the
table below.
• Alternative materials included. Because the European study of plastics and
alternatives included not only packaging but many other types of plastic products,
the study necessarily limited the level of detail in the types of substitute material
options modeled. Because the North American study is focused only on packaging,
there is more detail in the alternative packaging categories modeled (for example,
different types of coated and uncoated paper, paperboard, and cartons; modeling of
individual materials such as cork, wood, cellophane, etc.).
• Geographic differences. Each report uses modeling parameters that are specific to
the region of interest (e.g., packaging market shares; electricity grid fuel mix for
LCI modeling of average kWh; prevalence of refillable beverage bottles;
transportation distances for packaging distribution; packaging recycling rates;
percentages of solid waste that are managed by landfilling and combustion with
and without energy recovery; level of landfill methane capture).
• Study boundaries. While the European analysis does make modeling assumptions
for differences between plastic and alternative material packaging in the use phase
of the packaging products (e.g., prevented food losses and transport volume for
beverage packaging), differences in storage requirements were not considered. The
North American analysis does not include evaluation of energy and greenhouse gas
differences associated with possible differences in filling processes or consumer
use of the alternative package. The comparative effect of such use phase exclusions
is minimized by using direct substitutions wherever possible (e.g., replacement of
the primary package with an alternative package that is used in the same way). For
example, refrigerated plastic containers are assumed to be replaced by similar
volume containers that are also refrigerated. No estimates of food losses prevented
by use of plastic packaging are made in this study.
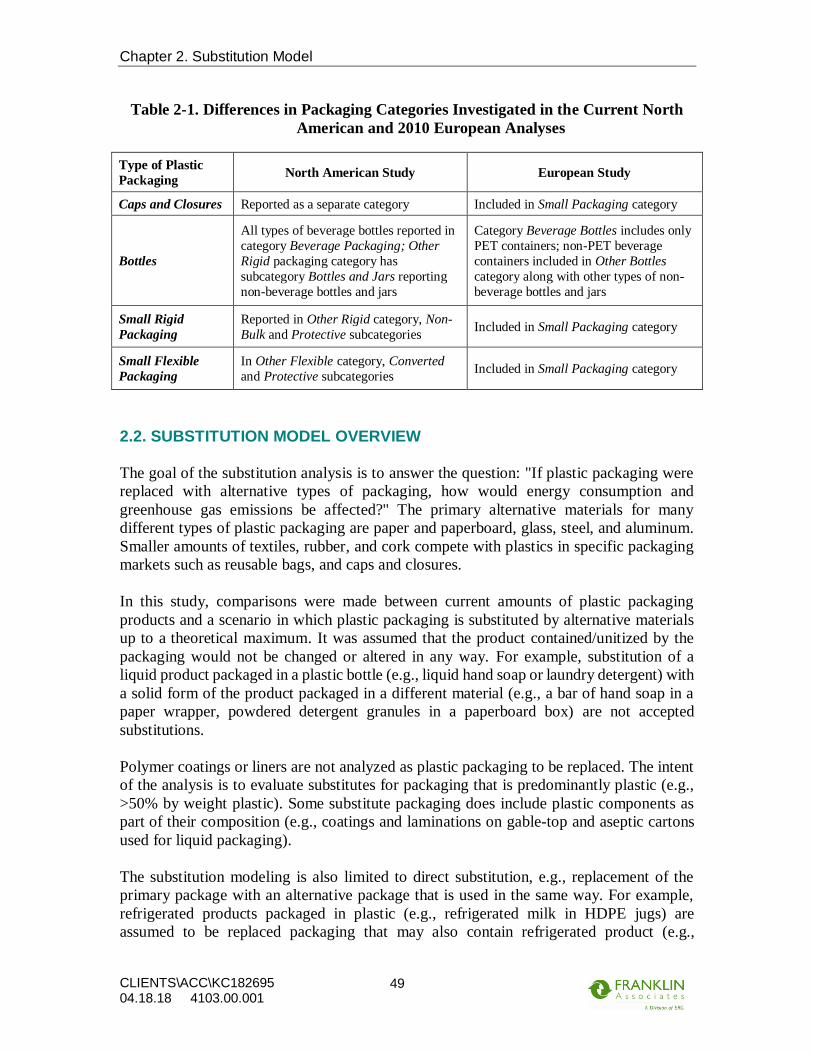
Chapter 2. Substitution Model
CLIENTS\ACC\KC182695 04.18.18 4103.00.001
49
Table 2-1. Differences in Packaging Categories Investigated in the Current North
American and 2010 European Analyses
Type of Plastic
Packaging North American Study European Study
Caps and Closures Reported as a separate category Included in Small Packaging category
Bottles
All types of beverage bottles reported in
category Beverage Packaging; Other
Rigid packaging category has
subcategory Bottles and Jars reporting
non-beverage bottles and jars
Category Beverage Bottles includes only
PET containers; non-PET beverage
containers included in Other Bottles
category along with other types of non-
beverage bottles and jars
Small Rigid
Packaging
Reported in Other Rigid category, Non-
Bulk and Protective subcategories Included in Small Packaging category
Small Flexible
Packaging
In Other Flexible category, Converted
and Protective subcategories Included in Small Packaging category
2.2. SUBSTITUTION MODEL OVERVIEW
The goal of the substitution analysis is to answer the question: "If plastic packaging were
replaced with alternative types of packaging, how would energy consumption and
greenhouse gas emissions be affected?" The primary alternative materials for many
different types of plastic packaging are paper and paperboard, glass, steel, and aluminum.
Smaller amounts of textiles, rubber, and cork compete with plastics in specific packaging
markets such as reusable bags, and caps and closures.
In this study, comparisons were made between current amounts of plastic packaging
products and a scenario in which plastic packaging is substituted by alternative materials
up to a theoretical maximum. It was assumed that the product contained/unitized by the
packaging would not be changed or altered in any way. For example, substitution of a
liquid product packaged in a plastic bottle (e.g., liquid hand soap or laundry detergent) with
a solid form of the product packaged in a different material (e.g., a bar of hand soap in a
paper wrapper, powdered detergent granules in a paperboard box) are not accepted
substitutions.
Polymer coatings or liners are not analyzed as plastic packaging to be replaced. The intent
of the analysis is to evaluate substitutes for packaging that is predominantly plastic (e.g.,
>50% by weight plastic). Some substitute packaging does include plastic components as
part of their composition (e.g., coatings and laminations on gable-top and aseptic cartons
used for liquid packaging).
The substitution modeling is also limited to direct substitution, e.g., replacement of the
primary package with an alternative package that is used in the same way. For example,
refrigerated products packaged in plastic (e.g., refrigerated milk in HDPE jugs) are
assumed to be replaced packaging that may also contain refrigerated product (e.g.,

Chapter 2. Substitution Model
CLIENTS\ACC\KC182695 04.18.18 4103.00.001
50
refrigerated milk in paperboard gable-top cartons), rather than being replaced by a package
that enables a non-refrigerated shelf-life (e.g., aseptic packages); as these types of packages
would have different product heating and filling requirements and do not require
refrigeration during post-filling transportation and storage.
It should be noted that substitution calculations are limited to replacement of the primary
package component(s). The scope of the study does not include evaluation of energy and
greenhouse gas differences associated with possible differences in filling processes or
consumer use of the alternative package. Refrigeration of filled plastic and alternative
containers during transport and storage is not included. End-of-life management (reuse,
recycling, landfill, and waste-to-energy combustion) for each type of plastic and alternative
packaging is modeled based on national average statistics for packaging waste management
in the US and Canada.
Some plastic packaging is considered ‘not-substitutable’ and has not been included in this
analysis (e.g., aerosol can valve assemblies, blister packaging, medical device packaging).
For the plastic packaging products considered ‘not-substitutable’, there was no data
available from Freedonia to estimate the market share that these products have relative to
overall plastic packaging, so it is not possible to estimate the quantities or percentage of
total plastic packaging that is excluded. A recent European study on plastic packaging
substitution estimated that 2.1% of plastic packaging is non-substitutable.54
Table 2-2 and Table 2-3 present an overview of the investigated packaging categories, and
for each category: the functional unit of comparison for plastic versus alternative materials,
the total plastic resin weight currently utilized in the US and Canada, respectively (i.e.,
based on market report data for years 2007-2011), and the current market share of plastic
represented relative to competing packaging materials for that category. Note that for the
packaging categories, plastic currently makes up approximately 43 to 100 percent of the
market share by functional unit. The demand for shrink and stretch film packaging is
currently met 100 percent by plastic resins; thus, 100 percent of the current demand for
stretch and shrink films is modeled to be substituted by alternative packaging materials. By
volume, approximately 60 percent of beverages are sold in plastic containers; thus, 60
percent of current beverage volume is modeled to be contained in alternative material
packaging in the substitution model. Table 2-4 presents the details on the data year(s) and
types of plastic packaging included and excluded from each investigated category in the
analysis.
Where data sources have provided both historical and projected values, the most recent
actual data years have been selected (i.e., data year ranges from 2007-2010 with no
projected values incorporated). This section describes the alternatives for plastic packaging
products as well as the weight ratio of alternative materials to those plastic packaging
54 Pilz H, Brandt B, Fehringer R (2010). The Impact of Plastics on Life Cycle Energy Consumption and
Green-House Gas Emissions in Europe, Part 1: Effects of a Theoretical Substitution of Plastics,
Section 2.2.1, Prepared by Denkstatt GmbH for PlasticsEurope Association of Plastics Manufacturers
Association and Sustainable Energy Europe, Final Report June 2010.

Chapter 2. Substitution Model
CLIENTS\ACC\KC182695 04.18.18 4103.00.001
51
products. With this information, and the weight of resin in each market, the weight of
alternative materials can be calculated.
Table 2-2. Investigated Packaging Categories and Overview of US Plastic Packaging
Table 2-3. Investigated Packaging Categories and Overview of Canadian Plastic
Packaging
(million kg) (% of Total)
Volume Capacity for Non-Bulk & Bulk Rigid Packaging
Protective Performance for Protective Packaging
Volume Capacity for Converted & Bulk Packaging (except
strapping)
Protective Performance for Protective Packaging
Unitizing Performance for Flexible Bulk Strapping
Beverage
ContainersVolume Capacity 60% 3,095 21.5%
Carrier Bags Number of Units (adjusted for difference in capacity) 83% 1,297 9.00%
Stretch &
ShrinkSquare Footage adjusted for performance 100% 748 5.19%
Caps &
ClosuresNumber of Units 72% 779 5.41%
Total Weight Plastic
to be Replaced
4,264 29.6%
4,226 29.3%
Category:Functional Unit of Comparison
for Alternative Material Weight Required:
Market Share Plastic for the
Category
(Per Functional Unit)
Other Rigid 43%
Other Flexible 67%
(million kg) (% of Total)
Volume Capacity - Bottles & Jars, Tubs/Cups/Bowls;
Other Non-Bulk & Bulk
Protective Performance - Protective Packaging
Volume Capacity - Converted Flexible; Flexible Bulk
Packaging (except strapping)
Protective Performance - Protective Packaging
Unitizing Performance - Flexible Bulk Strapping
Beverage
ContainersVolume Capacity 60% 342 21.0%
Carrier Bags Number of Units (adjusted for difference in capacity) 83% 143 8.76%
Stretch &
ShrinkSquare Footage adjusted for performance 100% 83 5.06%
Caps &
ClosuresNumber of Units 53% 62 3.83%
Total Weight Plastic
to be Replaced
470 28.8%
532 32.6%Other Flexible 69%
Category:Functional Unit of Comparison for Alternative
Material Weight Required:
Market Share Plastic for the
Category
(Per Functional Unit)
Other Rigid 43%

Chapter 2. Substitution Model
CLIENTS\ACC\KC182695 04.18.18 4103.00.001
52
Table 2-4. Details on Contents of Plastic Packaging Categories
DATA YEAR PRIMARY PLASTIC PACKAGING PRODUCTS INCLUDED: PACKAGING PRODUCTS EXCLUDED:
Non-Bulk
US 2009;
Canadian
2011
Non-beverage bottles and jars; tubs, cups and bowls; pails; food trays; cans;
egg cartons; squeeze tubes; and others such as plastic boxes; food, household
cleaning chemicals, cosmetics and toiletries, pharmaceuticals, automotive
chemicals, industrial and institutional cleaning chemicals, and others such as
adhesives and agricultural chemicals
Beverage container packaging (e.g., bottles) -see Beverage Container category;
laminate-type squeeze tubes; foodservice packaging such as clamshells, pails,
and baskets; decorative tins, medical device packaging, blister packaging,
injection molded cosmetic packaging such as lipstick and compact cases;
compact disc cases; separately sold caps and closures; protective and bulk rigid
packaging; and home storage containers such as TUPPERWARE containers
Protective 2011
Protective packaging shapes and other rigid packaging providing cushioning,
blocking and bracing, insulating, and void-filling for the manufacturing and non-
manufacturing markets (e.g., insulated shipping containers and foamed
shipping protectors)
Flexible protective packaging such as shipping sacks or strapping (see flexible
protective packaging category); and insulated shipping packaging requiring
electricity or another power source to maintain a temperature-controlled
environment inside an insulated enclosure
Bulk 2010
Drums, pails, bulk boxes, material handling containers (MH Cs) and bulk boxes,
and rigid intermediate bulk containers (RIBCs) for chemical and
pharmaceutical, food, plastic, rubber, fiber, petroleum and lubricant,
agricultural and horticultural, durable, and hazardous waste storage and
handling markets
Pallets; corrugated boxes other than bulk and corrugated RIBCs; cans, bottles,
jars, and tubs used for packaging bulk size food or other consumer goods*
Converted
US 2010;
Canadian
2008
Single-ply or multiple plies of materials laminated together by an adhesive
system or coextruded to fabricate bags, pouches, and other pre-formed
packages or rollstock that are converted for food and non-food applications;
also, printed, coated, or otherwise converted overwraps
Beverage container packaging (e.g., pouches) -see Beverage Container
category; packaging formed by slitting alone, any uncoated single web
material that is neither preformed nor printed; wrappers which are
unconverted flexible materials such as shrink and stretch film, plain film, and
related products (see shrink & stretch wrap category); retail, grocery, and
novelty bags and sacks (see carrier/retail bags category); paperyard waste and
refuse sacks, trashbags; household and institutional plastic storage bags or
rolls of film; money bags; envelopes used for mailing; sausage casings; shrink
sleeve and other labels; lidding, foodservice disposable packaging such as
sandwich wraps; and secondary and tertiary packaging**
Protective 2011
Cushioning, void-filling, and lining packaging products such as protective
mailers, protective packaging fill, and dunnage bags for the manufacturing and
non-manufacturing markets.
Rigid protective packaging shapes such as foam shipping braces (see rigid
protective packaging category)
Bulk 2011
Shipping sacks, strapping, flexible intermediate bulk containers (FIBCs), and
bulk drum, bin and box liners and rolls for the food/beverage, chemical,
agricultural, and horticultural markets
Non-packaging applications such as money bags and sand bags; film wrap used
for bulk applications (see stretch & shrink film category)
* Data providers were unable to clarify if specific types of rigid bulk packaging excluded from the bulk category are included in other categories (e.g., bulk jars in bottles & jars).
Franklin Associates assumes that these items are captured in other categories.
** Secondary and tertiary packaging materials are those which are not in direct contact with food or other contained products; materials which do not function to contain, protect, and store products for future consumption but are used instead for unitizing and distribution products contained in primary packaging (e.g., crates, pallet wrap, strapping).
Unless otherwise noted in this table (e.g., pallets), secondary and tertiary packaging materials are included in the substitution model--in appropriate subcategories.
CATEGORY
OTHER
RIGID
OTHER
FLEXIBLE

Chapter 2. Substitution Model
CLIENTS\ACC\KC182695 04.18.18 4103.00.001
53
Table 2-4 (cont.). Details on Contents of Plastic Packaging Categories
DATA YEAR PRIMARY PLASTIC PACKAGING PRODUCTS INCLUDED: PACKAGING PRODUCTS EXCLUDED:
2007
Aluminum cans and bottles; steel cans; plastic bottles, pouches, and cans; glass
bottles; and paperboard containers e.g., gabletop and bag-in-box cartons,
aseptic boxes and composite cans, intended for disposal after use for the
following markets: carbonated soft drinks including flavored and soda waters;
beer and other malt beverages; still and sparkling bottled water; both frozen
and shelf-stable fruit beverages; other ready-to-drink (RTD) non-alcoholic
beverages; RTD tea; milk and eggnog including non-beverage use of fluid milk;
sports beverages; wine including wine-based coolers and hard ciders; distilled
spirits; and soy and other non-dairy milk
All non-liquid beverages including: dried coffee and tea; powdered and
condensed milk; powdered fruit drinks and sports beverages; also excluded:
vegetable and tomato drinks; infant formula; packaged milk shakes and liquid
nutritional supplements (see non-bulk rigid containers category); and all
secondary beverage container packaging** e.g., corrugated boxes and
paperboard beverage carriers; bulk containers not intended primarily for in-
home use; bottled water containers larger than 2.5 gallons are excluded
2009 Retail bags and sacks Large bags and sacks used for bulk shipments (see bulk flexible category)
2009
Standard threaded, pressure screw vacuum threaded, unthreaded, and
synthetic cork caps and closures utilized on containers intended for disposal
after use in beverage, food, pharmaceutical and other health-care product,
cosmetic and toiletry, household chemical, automotive chemical, and other
packaging markets
Non-substitutable caps and closures (i.e., dispensing and child-resistant
types); caps or closures that are an integral part of the container (e.g., aerosol
can valve assemblies); home canning and bottling closures; most glass
closures; caps and closures used on industrial bulk containers; flexible (e.g.,
aluminum foil, twist tie) closures; champagne overcaps and capsules; and caps
and closures employed in nonpackaging applications such as valve covers,
distributor caps, pen caps, food and other storage container lids, etc.
2010Wrap, stretch labels and sleeves, and hoods (e.g., pallet caps) used in product
packaging and storage and distribution marketsConverted or multi-layer films (see converted flexible category)
** Secondary and tertiary packaging materials are those which are not in direct contact with food or other contained products; materials which do not function to contain, protect, and store products for future consumption but are used instead for unitizing and distribution products contained in primary packaging (e.g., crates, pallet wrap, strapping).
Unless otherwise noted in this table (e.g., pallets), secondary and tertiary packaging materials are included in the substitution model--in appropriate subcategories.
STRETCH &
SHRINK FILM
BEVERAGE CONTAINERS
CARRIER/
RETAIL BAGS
CAPS &
CLOSURES
CATEGORY
Chapter 2. Substitution Model
CLIENTS\ACC\KC182695 04.18.18 4103.00.001
54
For each plastic packaging category, the current market share of plastic resins (in terms of
the functional unit for that category) determines the weight of resin to be replaced by
alternative materials in the substitution model. For example: ~1,105 million pounds of resin
were used in rigid non-bulk food bottles and jars in 2009; because the market data indicate
that ~47 percent of alternative materials volume market share for rigid non-bulk bottles
and jars is glass, 47 percent of the plastic resin weight (i.e., ~516 of 1,105 million pounds
of resin) used for the food bottles and jars is modeled to be replaced by glass bottles and
jars. A plastic packaging product has been selected to represent each packaging
subcategory. The weight of the representative plastic packaging product is then compared
to the weights of an alternative material package providing the same functional unit. For
each subcategory, the total weight of resin to be theoretically substituted by alternative
packaging materials is multiplied by a weight ratio determined by the relative weights of
the representative product for that subcategory (e.g., relative weight of an impact-resistant,
wide-mouth plastic food jar and a glass food jar of equivalent volume capacity). The
relative weights of the plastic versus alternative material products are derived from industry
contacts, publisher data sources, and actual measurements. The weight of replaced resin
multiplied by the substitute alternative material-to-plastic weight ratio provides the weight
of each alternative packaging material to substitute for the associated portion of plastic
resin in each subcategory.
The approach for estimating total pounds of alternative packaging materials is described
for each investigated packaging category in the following sections. The categories are
presented in descending order of plastic packaging weight, e.g., from highest to lowest
percent share of the total weight of current plastic packaging:
• Other rigid packaging (includes the subcategories non-bulk rigid packaging, rigid
protective packaging, and rigid bulk packaging)
• Other flexible packaging (includes the subcategories converted flexible packaging,
flexible protective packaging, and flexible bulk packaging)
• Beverage packaging
• Carrier bags
• Shrink and stretch film
• Caps and closures
At the end of each section, tables are presented summarizing the relative shares of
substitutable plastic packaging and alternative packaging currently used in the US and
Canada, respectively, as well as tables showing the amounts and types of alternative
packaging that would be used to substitute plastic packaging in the US and Canada.
The current market share tables at the end of each section summarize the current market
shares of plastics and competing packaging materials for each packaging category and their
respective subcategories. For transparency, vertical columns in these tables show the
market share that each category contributes to overall packaging as well as the market share
that each subcategory contributes to its parent category. Horizontal rows in this table also
show the market share of each material within each category and their respective
subcategories and product markets.

Chapter 2. Substitution Model
CLIENTS\ACC\KC182695 04.18.18 4103.00.001
55
In both the current market share and substitution tables, some alternatives materials column
headings cover a mix of several types of packaging. For example, the category “paper”
includes the total weight of corrugated board, coated and uncoated bleached and
unbleached kraft paper, coated paper cartons, laminated aseptic cartons, and molded fiber
used as substitutes for each packaging application. The category “aluminum” includes
aluminum cans, rigid containers, and foil.
Tables are presented in the following order at the end of each section:
• Current market share table, US
• Substitution table, US
• Current market share table, Canada
• Substitution table, Canada
2.3. OTHER RIGID PACKAGING MARKETS
2.3.1. Introduction
Aside from beverage bottles and caps and closures (modeled as separate categories), other
rigid packaging markets include non-bulk rigid packaging, protective rigid packaging, and
bulk rigid packaging. The main alternatives for these types of plastic rigid packaging are
glass, several types of paper products (i.e., kraft paper, paperboard, molded fiber, and
corrugated cardboard), steel, and aluminum.
Caps and closures for rigid packaging products are examined separately in the caps and
closures category and therefore are not included in this market category.
The alternative-to-plastic weight ratio estimated for each material is multiplied by the
amount of resin replaced by that alternative. This approach results in the weights of
alternative materials estimated to substitute for each plastic packaging category. The tables
with current market share and substitution amounts are presented at the very end of the
Other Rigid Packaging section, after the discussions of the rigid packaging subcategories.
2.3.2. Non-Bulk Rigid Packaging
Besides beverage containers (modeled as a separate category), non-bulk rigid packaging
includes: bottles and jars; tubs, cups, and bowls, and other non-bulk rigid
containers/packaging. Excluded from this category are: foodservice packaging, clamshells,
baskets, decorative tins, canning jars, home storage containers, medical device packaging,
pharmaceutical vials, blister packaging, injection molded cosmetic packaging such as
lipstick and compact cases, compact disc cases, bulk water and oil bottles, and food storage
items. The overall weights of materials used for bottles, jars, tubs, cups, bowls, and other
rigid non-bulk packaging in the US are compiled by cross-checking data from two
Chapter 2. Substitution Model
CLIENTS\ACC\KC182695 04.18.18 4103.00.001
56
Freedonia market reports.55,56 These Freedonia data also provided the relative US dollar
demand for individual types of product applications within the subcategories of non-bulk
rigid packaging. The plastic report indicates total weight, number of units, and relative
share of each resin used for plastic non-bulk containers; whereas, data for non-plastic non-
bulk containers are from the World Rigid study and are only available in monetary terms.
Average pounds of various rigid container materials per dollar are estimated using average
price per unit and weight per unit data available from the caps and closures Freedonia
reports. These averages are used to determine the overall weights of non-plastic materials
used in non-bulk rigid container markets. Franklin Associates selected this approach
because comparative raw material price indices would not have reflected the cost/value of
converting raw materials to packaging products. For each plastic and alternative packaging
commodity, price-per-unit data in the reports compiled by Freedonia (e.g., available for
caps and closures) reflect the relative cost/value of both raw material and converting
processes. This approach also minimizes potential inaccuracies that can be realized with
the use of multiple data sources (i.e., due variation in how data sources may define material
types or packaging categories).
Because this analysis presents results for rigid beverage containers in a separate beverage
containers category, the weights of rigid beverage containers and their associated material
shares (i.e., plastic resins, aluminum cans, glass, paperboard cartons, and steel) were
extracted from the compiled market share and weight data for non-bulk rigid containers.
Thus, bottles and jars are broken out into the non-beverage subcategories of food,
household chemical, cosmetic and toiletry, pharmaceutical, institutional and industrial
chemical, automotive chemical, and other bottle and jar applications. Other non-bulk
container/packaging applications include pails, trays, cans, egg cartons, and squeeze tubes.
The overall weights of materials used for non-bulk rigid packaging in Canada are also
provided from the Freedonia World Rigid report. However, because further granularity on
relative shares of non-bulk rigid packaging for individual subcategory applications were
not available for Canada, a US-to-Canada population scaling factor and US relative shares
were used to estimate and exclude Canadian demand for beverage packaging and as a proxy
to break out types and materials per subcategory.
The Freedonia data report the relative weights of resins used for plastic containers as PET,
HDPE, PP, PVC, LDPE, and other. Franklin Associates approximates ‘other’ resins with
an equivalent weight of PS. Depending on the packaging application, the PS is modeled as
solid PS (e.g., food bowls) or foamed PS (e.g., egg cartons). Also per the Freedonia data,
tubs, cups, and bowls are broken out by relative PP, PS, HDPE, and PET weights.57
Granularity on the current relative weights of individual resins and alternative materials
used within each of the other non-bulk rigid packaging subcategories were obtained by
55 Freedonia (2010). Plastic Containers: US Industry Study w/ Forecasts for 2014 & 2019, Study #2672
Prepared by The Freedonia Group, August 2010. 56 Freedonia (2012). World Rigid Packaging: US Industry Study w/ Forecasts for 2016 & 2021, Study
#2909 Prepared by The Freedonia Group, July 2012. 57 PLA and other resins are excluded as they are outside the defined scope of this study and contribute
less than one percent to overall tubs, cups, and bowls weight demand in the investigated data year
(2009).
Chapter 2. Substitution Model
CLIENTS\ACC\KC182695 04.18.18 4103.00.001
57
cross-checking qualitative data from more detailed Freedonia table outlines with
quantitative data from previous work performed by Franklin Associates.58 This check was
also performed for each resin to estimate the relative weight share and identity of materials
that would substitute for each plastic resin in each product application. Per these estimates,
non-bulk rigid containers and packaging are expected to be replaced by a mix of
paperboard, glass, steel and aluminum. For food and pharmaceutical bottles and jars, tubs,
cups, and bowls, paper substitute packaging is considered to be virgin; whereas, non-food
applications are substituted with paper having recycled content. The exception to this
generalization is for egg cartons and/or molded pulp trays as per previous modeling
experience, Franklin Associates assumes these packaging products to be comprised of old-
newspaper and other recovered paper-based materials. Recycled content and recovery rates
for paper packaging are described in Chapter 3.
To determine substitution weight factors for each type of non-bulk rigid plastic packaging,
the functional unit is volume of capacity of the package. Within each non-bulk rigid
packaging subcategory (i.e. for each of the 15 types/lines in the tables presented below), a
representative plastic packaging product was selected. The weights of the representative
plastic packages were determined from: 1) case study examples in a recent packaging
efficiency study,59 2) primary data from previous public and private LCAs performed by
Franklin Associates, and/or 3) publicly available specifications from packaging providers.
It is acknowledged that a distribution of sizes exists within each container application.
Though data on relative distribution of sizes for each of the examined product applications
were not available, a range of container/packaging sizes and average weight-per-capacity
factors were compiled for each material in each product application. These
container/packaging-weight-to-volume capacity ratios are used for each alternative
material and each subcategory to determine the cumulative weights of each alternative
material estimated to substitute for all currently demanded plastic in the non-bulk rigid
containers/packaging products market.
For non-bulk rigid packaging, there are three primary applications: bottles and jars; tubs,
cups, and bowls; and other packaging. For non-bulk rigid bottles and jars, applications
included: food; household chemicals; cosmetics and toiletries; pharmaceuticals; industrial
and institutional cleaning chemicals; automotive chemicals; and other. Representative
plastic products evaluated included wide-mouth jars; oval, tapered oval, slant, slant-
handled, cylinder, oblong, round, and pharmaceutical bottles; utility jugs; round tubs; open-
and closed-head pails; trays, cans, and bins; expanded foam cartons and trays; and squeeze
tubes. Non-bulk steel container substitutes include steel cans, bottles, tins, and pails; glass
containers substitutes include leak-proof and temperature resistant jars, oval bottles,
chemical bottles, and wide-mouth jars. Photosensitive-type glass jars were selected as
appropriate substitutes for plastic containers used in some household chemical (e.g.,
kitchen and bath cleaners, bleach), cosmetic and toiletry (e.g., skin care), pharmaceutical
liquid, and industrial and institutional chemical markets. Aluminum substitutes include
58 Franklin Associates (1990). Appendix C. Market Shares and Weight Ratios for Plastics & Alternative
Materials in Packaging and Disposable Consumer Goods Prepared for SPI. 59 ULS Report (2007). A Study of Packaging Efficiency as it Relates to Waste Prevention, Prepared by
the Editors of The ULS Report, February 2007.

Chapter 2. Substitution Model
CLIENTS\ACC\KC182695 04.18.18 4103.00.001
58
aluminum bottles, laminate foil, foil trays, and collapsible aluminum tubes. Paper
substitutes include gable-top cartons, aseptic-type rectangular cartons, old corrugated
cardboard (OCC) fiber molded shell containers, kraft sacks, and molded pulp trays. As an
example of how substitution ratios were determined, the following section describes the
approach for automotive chemical applications in non-bulk rigid bottle and jar applications.
Franklin Associates selected representative plastic bottles for two primary products in
automotive chemical non-bulk rigid bottle and jar applications: motor lubricant and
antifreeze/coolant, two primary automotive chemicals sold in plastic bottles. The
representative volume of these containers was determined by considering a typical
container type and size for each of the products in North America. For lubricant oil, a quart-
sized (20 ounces or 0.59 liter) tapered oval plastic bottle weighing ~ 0.14 pounds or 64
grams was considered to obtain a typical weight-to-volume ratio for this application; for
antifreeze/coolant, a gallon (128 ounces or 3.79 liter) sized slant-handled (i.e., F-style)
chemical plastic bottle weighing ~0.33 pounds or 148 grams was considered. In order for
steel to substitute for either of these plastic packaging applications, the relative weight-to-
volume ratio of a light-weight steel bottle (average ~0.021 pounds per ounce or 330 grams
per liter) was considered suitable. These relative weights were used to determine the
plastic-to-steel packaging weight ratio for each of these applications. Given its share of
current packaging demand for these applications, steel is considered to substitute for 59
percent of the plastic weight currently supplying packaging in these applications. No
equivalent glass bottles and jars were compared as the fragility of glass was considered to
be unsuitable for automotive chemical applications. Franklin Associates considers that the
remaining 41 percent of the plastic weight for these applications would be substituted by
fiber molded shell containers with laminate aluminum foil liners. The weight-to-volume
ratios of molded fiber shells and of other suitable fiber-based cartons60 were used to
determine the plastic-to-paper weight ratio for these applications. The weight-to-area ratio
for aluminum foil for laminates61 and estimates of the interior surface area dimensions of
each of the representative lubricant and antifreeze/coolant containers were used to
determine the aluminum-to-paper weight ratio that must accompany the paper packaging
substitution. The relative share of sales volume (i.e., sales volume ratio of lubricant-to-
antifreeze/coolant automotive chemicals), 96.3 to 3.7, was obtained based on publicly
available market statistics for automotive chemicals. This ratio is used to calculate weight
amounts of each alternative packaging material determined to substitute for plastic
packaging in order to obtain the overall amount of each alternative packaging material
modeled to substitute for plastic packaging in automotive chemical non-bulk rigid bottle
and jar applications.
2.3.3. Rigid Protective Packaging
Rigid protective packaging includes protective packaging shapes providing cushioning,
blocking and bracing, insulating, and void-filling for the manufacturing and non-
manufacturing markets. Protective packaging shapes include packaging products such as
insulated shipping containers, rigid loose-fill, and rigid foam products (e.g., molded, foam-
60 Per private LCA studies previously compiled by Franklin Associates, a Division of ERG. 61 Per private LCA studies previously compiled by Franklin Associates, a Division of ERG.
Chapter 2. Substitution Model
CLIENTS\ACC\KC182695 04.18.18 4103.00.001
59
in-place, rolled foam, and foamed loose-fill products). Insulated shipping packaging
requiring electricity or another power source to maintain temperature control is excluded
from this category. The overall weights of materials used for rigid protective packaging are
as provided by Freedonia market data.62 Freedonia data also provided the relative US dollar
demand for individual types of product applications within the rigid protective packaging
categories. As the average price per unit for each type of packaging product is not provided,
it is assumed that the relative market demand for each type correlates linearly with the
relative weight of each plastic package type (i.e., price per pound of the plastic package is
similar among rigid protective packaging applications). Because some of the Freedonia
data for protective packaging are presented as an aggregate for both rigid and flexible
plastic products, the flexible packaging weights are disaggregated and included in the
flexible protective packaging category. Also, because no overall or detailed data on
protective rigid packaging in Canada were available, a US-to-Canada population scaling
factor and US relative shares were used to estimate Canadian demand per subcategory.
Protective packaging shapes are EPS and kraft paperboard or molded pulp as indicated by
the reported Freedonia data. The material breakout for individual resins and non-plastic
materials was cross-checked with qualitative and quantitative data from previous work
performed by Franklin Associates.63 The compiled data is used to estimate the relative
weight share and identity of materials that would substitute for plastics in each product
application. The current market share of rigid protective packaging is 55.6 percent plastic
and 44.4 percent paper materials. Because paper-based packaging is the main competing
material in this category, rigid protective plastic packaging is expected to be replaced 100
percent by kraft paper packaging (e.g., molded fiber forms substituting for EPS forms).
Recycled content and recovery rates for paper-based packaging are described in Chapter 3.
To determine substitution weight factors for each type of rigid protective packaging, the
functional unit was protective performance of packaging product. Within each rigid
protective packaging subcategory, a representative plastic packaging product was selected.
The weights of the representative plastic packaging were determined from primary data
from previous LCAs performed by Franklin Associates and/or publicly available
specifications from packaging providers. For protective packaging shapes, the weight ratio
of foamed polystyrene to molded pulp required for egg cartons is used as a proxy for
protective performance of plastic to paper.64 This ratio is applied to the weight indicated
for the equivalent volume of paper fill to reflect not only comparative weights of equivalent
sizes of product but also protective performance of the plastic versus paper product. For
other rigid protective packaging, a similar approach was used.
Given equivalency in protective performance, the paper-to-plastic rigid weight ratio
determined for each subcategory is used to determine the overall weight of each type of
paper required to substitute for plastics in this product market.
62 Freedonia (2012). Protective Packaging: US Industry Study with Forecasts for 2016 & 2021, Study
#2839 Prepared by The Freedonia Group, January 2012. 63 Franklin Associates (1990). Appendix C. Market Shares and Weight Ratios for Plastics & Alternative
Materials in Packaging and Disposable Consumer Goods Prepared for SPI. 64 Actual weight ratio per measurements.

Chapter 2. Substitution Model
CLIENTS\ACC\KC182695 04.18.18 4103.00.001
60
As an example of how substitution ratios were determined, this section briefly describes
the approach for modeling substitution of rigid EPS foam inserts in rigid protective
packaging applications. Franklin Associates uses rigid EPS foam density, six pounds per
cubic foot or ~96 kilograms per cubic meter, to compare the weight of one cubic foot of
EPS foam insert for insulated shipping containers to the weight of one cubic foot of molded
fiber forms. The weight of the cubic foot of molded fiber forms is scaled up to reflect the
relative ratio of protective performance. As mentioned, the weight ratio of foamed
polystyrene to molded pulp required for egg cartons is used as a proxy for protective
performance of plastic to paper.65 The relative weights of a cubic foot of EPS and molded
foam (scaled to reflect relative protective performance) for insulated shipping containers
are used to determine the overall paper-to-plastic packaging substitution ratio for this
subcategory in protective rigid packaging.
2.3.4. Rigid Bulk Packaging
Rigid bulk packaging includes drums, pails, bulk boxes, material handling containers
(MHCs) and bulk boxes, and rigid intermediate bulk containers (RIBCs) for chemical and
pharmaceutical, food, plastic, rubber, fiber, petroleum and lubricant, agricultural and
horticultural, durable, and hazardous waste storage and handling markets. Not included in
this category are pallets and wood containers, corrugated and solid fiberboard boxes except
bulk and corrugated RIBCs. The overall weights of materials used for rigid bulk packaging
in are as reported by Freedonia market data.66 Freedonia data also provided the relative US
dollar demand for individual types of product applications within the rigid bulk packaging
subcategories. As the average price per unit for each type of packaging product is not
provided, it is assumed that the relative market demand for each type correlates linearly
with the relative weight of each package type (i.e., price per pound of plastic package is
similar among rigid bulk packaging applications). The overall weights of materials used
for rigid bulk packaging in Canada and further granularity on relative shares of rigid bulk
packaging per subcategory were not available for Canada. A US-to-Canada population
scaling factor and US relative shares were used to estimate weights of materials used within
each subcategory for Canadian demand.
Relative overall shares of plastic and each alternative material used in rigid bulk packaging
are as reported by Freedonia. Resin breakout for rigid bulk packaging was not provided by
the Freedonia data and was estimated by Franklin Associates to be split evenly between
HDPE and PP resins, based on publicly available specifications on bulk plastic drums,
pails, boxes, MHCs, and RIBCs. The material breakout for individual resins and non-
plastic materials was cross-checked with qualitative and quantitative data from previous
work performed by Franklin Associates.67 The compiled data are used to estimate the
relative weight share and identity of materials that would substitute for plastics in each
subcategory application. Rigid bulk packaging is expected to be replaced by a mix of steel,
65 Actual weight ratio per measurements. 66 Freedonia (2011). Rigid Bulk Packaging: US Industry Study with Forecasts for 2015 & 2020, Study
#2737 Prepared by The Freedonia Group, February 2011. 67 Franklin Associates (1990). Appendix C. Market Shares and Weight Ratios for Plastics & Alternative
Materials in Packaging and Disposable Consumer Goods Prepared for SPI.
Chapter 2. Substitution Model
CLIENTS\ACC\KC182695 04.18.18 4103.00.001
61
molded fiber, corrugated cardboard, and wood panels. All rigid bulk paper packaging
substitutes are assumed to have the average recycled content for paper packaging based on
recovery rates in the EPA MSW Characterization in 2010.68
To determine substitution weight factors within each type of rigid bulk packaging, the
functional unit was volume capacity. Within each rigid bulk packaging subcategory, a
representative plastic packaging product was selected. The weights of the representative
plastic packaging were determined from primary data from previous LCAs performed by
Franklin Associates and/or publicly available specifications from packaging providers. For
drums, a plastic drum suitable for hazardous material was compared to steel and molded
fiber drums (with liners) of equivalent volume. For pails, plastic pails were compared to
steel pails. For material handling containers and bulk boxes, plastic corrugated shipping
boxes and forkliftable bulk containers are compared to fiber corrugated shipping boxes and
steel shipping containers, respectively, of equivalent volume. For reusable plastic
containers substituted by other reusable containers, one plastic box is assumed to be
substituted by one alternative reusable container. For reusable plastic boxes substituted by
fiber corrugated boxes, a conservative lifetime trip rate of 10 is used for the reusable plastic
boxes, so that one plastic box is assumed to be substituted over its life cycle by 10
equivalent size corrugated boxes. In efficiently operated closed-loop reuse systems,
reusable bulk containers can make 50 or more lifetime trips.
Given equivalency in volume capacity, the alternative material-to-plastic rigid weight
ratios determined for each subcategory are used to determine the overall weight of each
type of alternative material required to substitute for plastics in this product market.
For bulk rigid packaging, there are four primary applications: drums; pails; material
handling and bulk boxes; and rigid intermediate bulk containers. As an example of how
substitution ratios were determined, the following section describes the approach for pail
applications in bulk rigid applications.
Franklin Associates selected a seven gallon (26.5 liter) plastic pail weighing 2.94 pounds
or 1.33 kilograms as a representative container for this application. The weight-to-volume
ratio of this ‘typical’ plastic container was compared to that of a five gallon (18.9 liter)
steel pail weighing 6.44 pounds or 2.92 kilograms. Steel is the only alternative packaging
material considered to substitute plastic in this application. The relative weight-to-volume
ratios for the representative plastic and steel pails are used to determine the overall
substitution ratio (2.19) for steel versus plastic. This ratio is used to determine the overall
weight of steel required to substitute for the weight of plastic resin currently used in pail-
type applications in bulk rigid packaging.
68 US Environmental Protection Agency. 2011. Municipal Solid Waste Generation, Recycling, and
Disposal in the United States Detailed Tables and Figures for 2010. Compiled by Franklin Associates,
A Division of ERG.
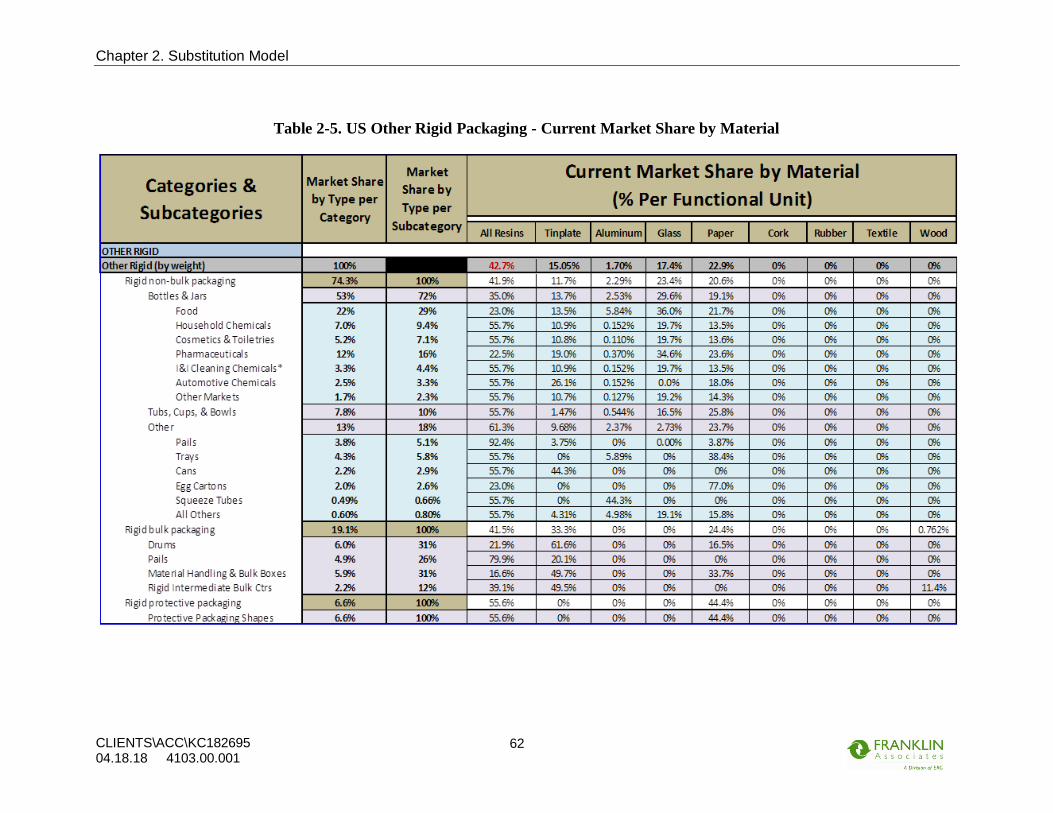
Chapter 2. Substitution Model
CLIENTS\ACC\KC182695 04.18.18 4103.00.001
62
Table 2-5. US Other Rigid Packaging - Current Market Share by Material

Chapter 2. Substitution Model
CLIENTS\ACC\KC182695 04.18.18 4103.00.001
63
Table 2-6. US Other Rigid Packaging - Substitution Weights by Material
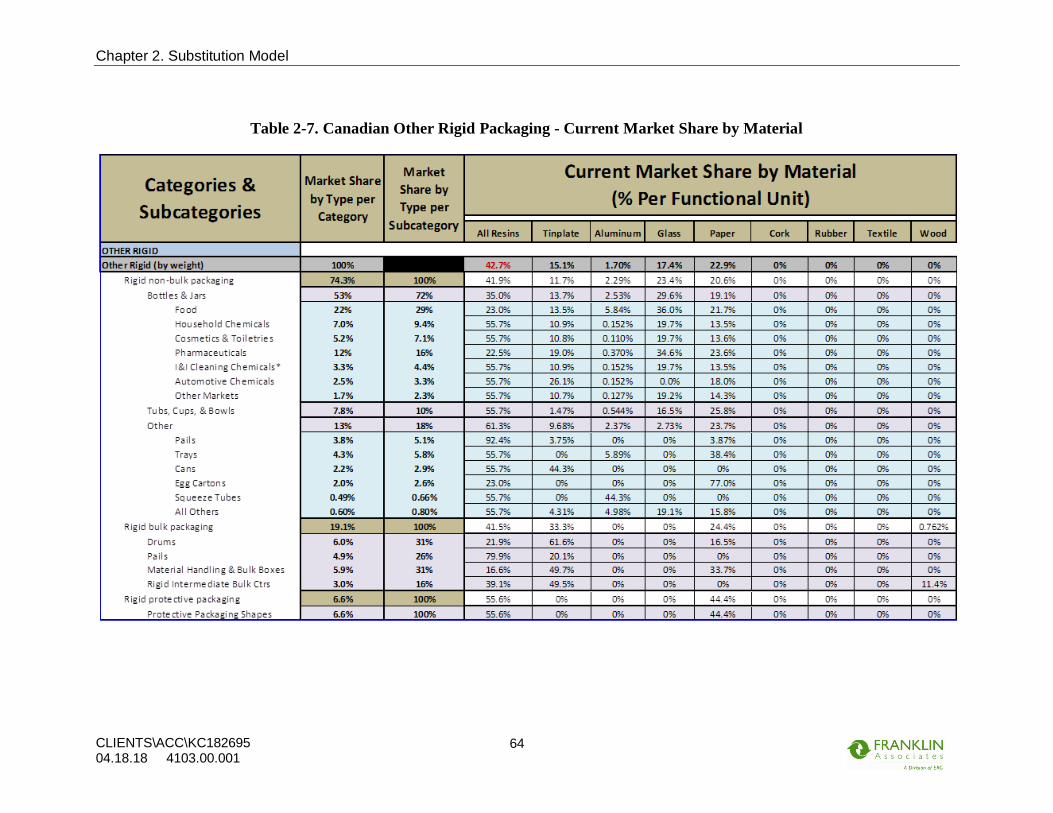
Chapter 2. Substitution Model
CLIENTS\ACC\KC182695 04.18.18 4103.00.001
64
Table 2-7. Canadian Other Rigid Packaging - Current Market Share by Material

Chapter 2. Substitution Model
CLIENTS\ACC\KC182695 04.18.18 4103.00.001
65
Table 2-8. Canadian Other Rigid Packaging - Substitution Weights by Material
Chapter 2. Substitution Model
CLIENTS\ACC\KC182695 04.18.18 4103.00.001
66
2.4. OTHER FLEXIBLE PACKAGING MARKETS
2.4.1. Introduction
Aside from retail bags and shrink/stretch films, which are modeled as separate categories,
other flexible packaging markets include converted flexible packaging, protective flexible
packaging, and bulk flexible packaging. The main alternatives for these types of plastic
flexible packaging are types of cellulose-based products (i.e., kraft paper, waxed paper,
cellophane), aluminum foil, and steel.
Though it is assumed that adhesive materials and heat sealing would be required for
alternative materials as it is for plastic converted films, adhesives and/or ancillary materials
are excluded from the analysis. This analysis focuses on the main packaging materials and
does not attempt to evaluate differences in amounts of ancillary materials required for
packaging of varying materials.
The alternative-to-plastic weight ratio for each alternative packaging type that replaces
plastic packaging is multiplied by the amount of resin replaced by that alternative. This
approach results in the weights of alternative materials estimated to substitute for each
plastic packaging category. The tables with current market share and substitution amounts
are presented at the very end of the Other Flexible Packaging section, after the discussions
of the flexible packaging subcategories.
2.4.2. Converted Flexible Packaging
Converted flexible packaging includes bags, pouches, and other layered plies and films for
food and non-food applications. Unconverted stretch and shrink or retail grocery bags and
bulk packaging are excluded from the converted flexible packaging category, as these types
of packaging are included in other categories. The overall weights of materials used for
food and non-food converted flexible packaging in the US are determined from Freedonia
market data.69 These Freedonia data also provided the relative US dollar demand for
individual types of product applications within the food and non-food categories. The total
weight of materials are reported for converted flexible packaging materials, but data for
relative shares of types used in food and non-food applications are only reported in the
monetary demand terms. As the average price per unit for each type of plastic packaging
product is not provided, it is assumed that the relative market demand for each type
correlates linearly with the relative weight of each package type (i.e., price per pound of
package is similar among converted flexible packaging types). Because the weight of all
pouches and preform packaging used for beverages are included in the beverage containers
category, these weights and their associated material shares (i.e., plastic film resins and
aluminum foil) were extracted from the market share and weight data provided by
Freedonia. Thus, food markets include non-beverage categories: meat and related products,
baked goods, snack food, grain mill products, produce, candy and confections, frozen
foods, dairy products, and other food products. Non-food applications include:
69 Freedonia (2011). Converted Rigid Packaging: US Industry Study w/ Forecasts for 2015 & 2020,
Study #2807 Prepared by The Freedonia Group, October 2011.

Chapter 2. Substitution Model
CLIENTS\ACC\KC182695 04.18.18 4103.00.001
67
pharmaceuticals, medical products, paper and textile products, agricultural and
horticultural products, chemicals, rack and counter packaging, and other nonfood products.
The overall weights of materials used for converted flexible packaging in Canada are also
provided from Freedonia market data.70 However, because further granularity on relative
shares of converted flexible packaging for individual food and non-food subcategories of
packaging were not available for Canada, a US-to-Canada population scaling factor and
US relative shares were used to estimate and exclude Canadian demand for beverage
packaging and as a proxy to break out types and materials per subcategory.
The Freedonia data only indicate ‘polyethylene’ mass totals for plastic film resins used in
converted flexible packaging. Franklin Associates uses data from the ACC 2012 Resin
Review71 to determine the relative share of HDPE, LDPE, and LLDPE resins used in
packaging films as a proxy for polyethylene resin shares in converted flexible packaging.
The Freedonia reports indicate weights of PVC, PVDC, and EVOH for converted flex
packaging products; however, Franklin Associates considers the life cycle requirements
for production of PVC as proxy for the total weight of PVC, PVDC, and EVOH resins.
The Freedonia data also indicate ‘other’ resin weights for converted flexible packaging; for
these materials, Franklin Associates considers the production of PET to be an appropriate
proxy for life cycle requirements. These proxy assumptions are not expected to
significantly affect the results, as the weights of ‘other’ resins together account for less than
five percent of total resin use for converted flexible packaging.
Granularity on the current relative weights of individual resins and alternative materials
used within each of the food and non-food product applications were obtained by cross-
checking qualitative data from more detailed Freedonia table shells with quantitative data
from previous work performed by Franklin Associates.72 This check was also performed
for each resin to estimate the relative weight share and identity of materials that would
substitute for each plastic resin in each product application. Per these estimates, plastic
converted flexible packaging is expected to be replaced by a mix of aluminum, paper, and
cellophane. For food applications, paper substitute packaging is considered to be virgin;
whereas, kraft or waxed paper alternatives with recycled content were considered to replace
non-food applications. The average recycled content for paper packaging based on
recovery rates in the EPA MSW Characterization in 2010 is assumed for all non-food paper
packaging substitutes.73
To determine substitution weight factors for each type of converted flexible plastic
packaging, the functional unit is volume (capacity) of the package. Within each converted
flexible packaging subcategory, a representative plastic packaging product was selected.
70 Freedonia (2009). World Converted Rigid Packaging: Industry Study w/ Forecasts for 2013 & 2018,
Study #2556 Prepared by The Freedonia Group, September 2009. 71 ACC (2012). The Resin Review: The Annual Statistical Report of the North American Plastics
Industry, American Chemistry Council, 2012 Edition. 72 Franklin Associates (1990). Appendix C. Market Shares and Weight Ratios for Plastics & Alternative
Materials in Packaging and Disposable Consumer Goods Prepared for SPI. 73 US Environmental Protection Agency. 2011. Municipal Solid Waste Generation, Recycling, and
Disposal in the United States Detailed Tables and Figures for 2010. Compiled by Franklin Associates,
A Division of ERG.

Chapter 2. Substitution Model
CLIENTS\ACC\KC182695 04.18.18 4103.00.001
68
The weights of the representative plastic packages were determined from: 1) case study
examples in a recent packaging efficiency study,74 2) primary data from previous LCAs
performed by Franklin Associates, and/or 3) publicly available specifications from
packaging providers. The surface area of plastic film required for each representative
package was estimated from the representative package’s dimensions and used as the basis
to determine weight of alternative materials required. It is acknowledged that there are
multi-layer converted flexible package products containing more than one type of material.
However, for simplicity, this analysis assumes that an equivalent surface area of the
alternative cellulose-based materials provide an equivalent volume capacity as that of the
converted plastic film. In other words, one layer of wax paper (e.g., butcher paper), kraft
paper (e.g., unbleached uncoated sack with high wet strength), or cellophane is assumed to
provide equivalent strength and/or protective properties for the volume of product
contained as the equivalent surface area of one layer of purely plastic converted flexible
film. The thickness (a.k.a., basis weight for paper materials) of the alternative material
layer is determined based on specifications indicated for each representative product in the
source data. The weight of the given surface area of each cellulose-based material layer
was then determined also from its basis weight. For the percent of currently demanded
plastic converted film expected to be replaced by a laminate containing aluminum, a
laminate aluminum foil gauge and equivalent surface area of aluminum foil are used to
determine the weight of aluminum contributing to substitution of plastic products. These
weights are used to determine the overall alternative-to-plastic material weight ratio for
each product application. Within each product application, the relative current market share
of alternative materials used in converted flexible packaging was considered to be the
representative of the materials that would substitute for these plastic packaging products.
In other words, the relative percent of paper and aluminum materials currently demanded
in converted flexible packaging markets, including use in composite material laminates
(e.g., of aluminum foil and paper), is applied to the individual subcategory weight
substitution ratios. For each alternative material, these weights are then summed to
determine the overall weight of alternative material that will substitute for the overall
weight of plastic currently demanded in the converted flexible packaging products market.
Representative plastic products included: cold cut, cookies, crackers, cereal, spinach,
candy, frozen fruit, and cheese pouches; individual pill and medical supply packages; film
wrap for copy paper; potting soil bags; clothing film bags, and converted film bag rolls. As
an example of how substitution ratios were determined, the following section describes the
approach for snack food applications in converted flexible applications.
Franklin Associates selected a nine ounce crackers package having approximately 3.25
square feet or 0.30 square meters area of converted plastic film. An average weight-to-area
ratio for converted plastic flexible films in food and non-food applications was obtained
by using densities for resin films weighted by the market share of each resin in converted
flexible films per publicly available and the Freedonia data, respectively. This average
ratio, 0.00487 pounds per square foot or 0.0238 kilograms per square meter, is applied to
the plastic film area for the representative snack food package to obtain the weight of the
plastic snack food package, 0.0158 pounds or 0.00719 kilograms. One layer of waxed paper
74 ULS Report (2007). A Study of Packaging Efficiency as it Relates to Waste Prevention, Prepared by
the Editors of The ULS Report, February 2007.
Chapter 2. Substitution Model
CLIENTS\ACC\KC182695 04.18.18 4103.00.001
69
(e.g., butcher paper) is considered to substitute 15.3 percent of the plastic snack food films
with a weight-to-area ratio of 0.0400 pounds per square foot or 0.200 kilograms per square
meter. One layer of fiber-based cellophane (e.g., of a one mil film thickness) is considered
to substitute 36.7 percent of the plastic snack food films with a weight-to-area ratio of
0.0076 pounds per square foot or 0.0369 kilograms per square meter. One layer of thin
aluminum foil (e.g., used in laminates) is considered to substitute 12.2 percent of the plastic
snack food films with a weight-to-area ratio of 0.0039 pounds per square foot or 0.0190
kilograms per square meter. One layer of natural kraft paper (e.g., used in standard paper
sacks) is considered to substitute 35.8 percent of the plastic snack food films with a weight-
to-area ratio of 0.0023 pounds per square foot or 0.0113 kilograms per square meter. These
values determine the substitution weight factors for plastics and alternative packaging
materials for snack food applications in the converted flexible film category.
2.4.3. Flexible Protective Packaging
Flexible protective packaging includes cushioning, void-filling, and lining packaging
products such as protective mailers, protective packaging void-fill, and dunnage bags for
the manufacturing and non-manufacturing markets. The overall weights of materials used
for flexible protective packaging are as provided by Freedonia market data.75 Freedonia
data also provided the relative US dollar demand for individual types of product
applications within the flexible protective packaging categories. As the average price per
unit for each type of packaging product is not provided, it is assumed that the relative
market demand for each type correlates linearly with the relative weight of each plastic
package type (i.e., price per pound of package is similar among flexible protective
packaging types). Because some of the data for protective packaging is presented as an
aggregate of flexible, rigid, and foamed plastics, the rigid and foam weights are
disaggregated, removed from the flexible packaging category and included in the rigid
protective packaging category. Also, because no overall or detailed data on flexible
protective packaging in Canada were available, a US-to-Canada population scaling factor
and US relative shares were used to estimate Canadian demand per subcategory.
Protective mailers include LDPE plastic with coextruded HDPE air retention barrier and/or
bubble packaging or paperboard with plastic adhesive strips; Franklin Associates assumes
a 40% paper, 50% LDPE, and 10% HDPE material mix for this product subcategory based
on publicly available product specifications and cross-checking with overall category
weights provided by the Freedonia data. Protective packaging fill includes bubble
packaging, air pillows, and paper fill used in void-filling applications. Per the ACC 2012
Resin Review, bubble packaging and air pillows are assumed to be 100% LDPE and
HDPE, respectively.76 Paper fill is assumed to be crumpled kraft paper with average
recycled content and the density assumed for these products per a previous study performed
75 Freedonia (2012). Protective Packaging: US Industry Study with Forecasts for 2016 & 2021, Study
#2839 Prepared by The Freedonia Group, January 2012. 76 ACC (2012). The Resin Review: The Annual Statistical Report of the North American Plastics
Industry, American Chemistry Council, 2012 Edition.
Chapter 2. Substitution Model
CLIENTS\ACC\KC182695 04.18.18 4103.00.001
70
by Franklin Associates.77 The category including dunnage bags and other flexible
protective packaging includes woven, laminated paper, paper lined with plastic, and vinyl
dunnage bags and other packaging used for shipping and securing cargo. This subcategory
is estimated to be 50% kraft paper, 24% PP, 24% PVC, and 2.0% HDPE or LDPE based
on publicly available product specifications.
The material breakout for individual resins and non-plastic materials was cross-checked
with qualitative and quantitative data from previous work performed by Franklin
Associates.78 The compiled data is used to estimate the relative weight share and identity
of materials that would substitute for plastics in each product application. Because current
market share is 55.6 percent plastic and 44.4 percent paper, all flexible protective plastic
packaging is expected to be replaced by kraft paper packaging: kraft mailers with shredded
newspaper padding for protective mailers, crumpled kraft paper for protective packaging
fill, and unpadded kraft shipping bags for dunnage bags and other converted flexible
packaging. Because the flexible protective paper packaging does not have direct contact
with food items, all paper packaging substitutes are assumed to have the average recycled
content for paper packaging based on recovery rates in the EPA MSW Characterization in
2010.79
To determine substitution weight factors for each type of flexible protective packaging, the
functional unit was protective performance of packaging product. Within each flexible
protective packaging subcategory, a representative plastic packaging product was selected.
The weights of the representative plastic packaging were determined from primary data
from previous LCAs performed by Franklin Associates and/or publicly available
specifications from packaging providers. For protective mailers, a representative size of
bubble-lined paper mailer was compared to an equivalent size of paper mailer padded with
shredded paper. In addition to the comparative weights obtained from previous studies and
industry reports, the protective performance of bubble-lined mailers relative to shredded-
paper-stuffed mailers was considered. The weight ratio of polystyrene to molded pulp
required for egg cartons is used as a proxy for flexible protective performance of plastic to
paper mailers.80 This ratio is applied to the weight indicated for the equivalent sized paper
mailer to reflect not only comparative weights of equivalent sizes of product but also
protective performance of the plastic versus paper product. For flexible protective
packaging fill, a similar approach was used for various types of plastic protective
packaging. For dunnage bags and other flexible protective packaging, an unpadded film
shipping bag is assumed to be substituted with an unpadded kraft shipping bag.
77 Franklin Associates (2004). Final Peer-Reviewed Appendix to Life Cycle Inventory of Packaging
Options for Shipment of Retail Mail-Order Soft Goods, Prepared for Oregon Department of
Environmental Quality (DEQ) and US EPA Environmentally Preferable Purchasing Program by
Franklin Associates, A Division of ERG, Prairie Village, KS, April 2004. Available at:
http://www.deq.state.or.us/lq/sw/packaging/lifecyclereport.htm. 78 Franklin Associates (1990). Appendix C. Market Shares and Weight Ratios for Plastics & Alternative
Materials in Packaging and Disposable Consumer Goods Prepared for SPI. 79 US Environmental Protection Agency. 2011. Municipal Solid Waste Generation, Recycling, and
Disposal in the United States Detailed Tables and Figures for 2010. Compiled by Franklin Associates,
A Division of ERG. 80 Actual weight ratio per measurements.
Chapter 2. Substitution Model
CLIENTS\ACC\KC182695 04.18.18 4103.00.001
71
Given equivalency in protective performance, the paper-to-plastic flexible weight ratio
determined for each subcategory is used to determine the overall weight of each type of
paper required to substitute for plastics in this product market. As an example of how
substitution ratios were determined, the following section describes the approach for
developing substitution weight factors in protective mailer applications in the protective
flexible packaging subcategory.
Franklin Associates selected a 10.5 by 16 inch mailer with an outer envelope comprised of
55 pound kraft paper with a 3/16 inch bubble lining as the representative product for
protective mailers. This mailer has approximately 2.33 square feet or 0.217 square meters
of protective flexible bubble lining. The weight of this mailer, 0.095 pounds or 0.043
kilograms per unit, was compared that of the same size and type of mailer containing 45
pound shredded paper padding instead of the plastic bubble lining, 0.300 pounds or 0.136
kilograms per unit. The difference between the weights of the mailers is attributed to the
difference in the weight of the bubble lining and shredded paper padding; Franklin
Associates makes the conservative assumption that this difference in weight also occurs
because the mailers must offer similar levels of protective performance. This difference is
used as a proxy for the plastic-to-paper substitution weight ratio and applied to the overall
amount of plastic resin to be replaced by paper in protective mailer applications of the
protective flexible packaging subcategory. Plastic used in protective flexible mailers is
modeled to be replaced with 100 percent paper-based materials.
2.4.4. Flexible Bulk Packaging
Flexible bulk packaging includes shipping sacks, strapping, flexible intermediate bulk
containers (FIBCs), and bulk liners and rolls for the food/beverage, chemical, agricultural,
and horticultural markets. Non-packaging applications such as money bags and sand bags
are not included. The overall weights of materials used for flexible bulk packaging are as
reported by Freedonia market data.81 Because all film wrap used for bulk applications is
included in the separate stretch and shrink wrap category, these weights (i.e., storage and
distribution type stretch and shrink film) and their associated resin material shares (i.e.,
LDPE, HDPE, and PVC) were disaggregated and excluded from the reported market share
and weight data for flexible bulk packaging. Freedonia data also provided the relative US
dollar demand for individual types of product applications within the flexible protective
packaging subcategories. As the average price per unit for each type of packaging product
is not provided, it is assumed that the relative market demand for each type correlates
linearly with the relative weight of each plastic package type (i.e., price per pound of
package is similar among flexible bulk packaging types). The overall weights of materials
used for flexible bulk packaging in Canada and further granularity on relative shares of
flexible bulk packaging per subcategory were not available for Canada. A US-to-Canada
population scaling factor and US relative shares were used to estimate weights of materials
used within each subcategory for Canadian demand.
81 Freedonia (2007). Flexible Bulk Packaging: US Industry Study with Forecasts for 2011 & 2016, Study
#2238 Prepared by The Freedonia Group, September 2007.

Chapter 2. Substitution Model
CLIENTS\ACC\KC182695 04.18.18 4103.00.001
72
Relative overall shares of plastic and each alternative material used in flexible bulk
packaging are as reported by Freedonia. Per these data: shipping sacks are PP, paper, or
textile materials; strapping,82 PP, or steel; drum, box, and bin liners are HDPE and LDPE;
and FIBCs are PP, PVC, and textile materials. The material breakout for individual resins
and non-plastic materials was cross-checked with qualitative and quantitative data from
previous work performed by Franklin Associates.83 The compiled data are used to estimate
the relative weight share and identity of materials that would substitute for plastics in each
subcategory application. Flexible bulk packaging is expected to be replaced by kraft paper
packaging, steel, and textile materials. All flexible bulk paper packaging substitutes are
assumed to have the average recycled content for paper packaging based on recovery rates
in the EPA MSW Characterization in 2010.84
To determine substitution weight factors within each type of flexible bulk packaging, the
functional unit was volume capacity. The exception to this approach is for flexible
strapping—in which case, the functional unit of comparison was unitizing performance.
Within each flexible bulk packaging subcategory, a representative plastic packaging
product was selected. The weights of the representative plastic packaging were determined
from primary data from previous LCAs performed by Franklin Associates and/or publicly
available specifications from packaging providers. For shipping sacks and bulk liners and
rolls, a representative plastic film bag was compared to a kraft paper shipping bag of
equivalent volume. For strapping, a representative plastic strapping length was compared
an equivalent length of steel strapping with a similar break or tensile strength.
Given equivalency in volume capacity, or unitizing performance in the case of strapping,
the alternative material-to-plastic flexible weight ratios determined for each subcategory
are used to determine the overall weight of each type of alternative material required to
substitute for plastics in this product market. As an example of how substitution ratios were
determined, the following section describes the approach for developing substitution
weight factors in strapping applications in the flexible bulk packaging subcategory.
Franklin Associates selected a flexible plastic strapping with a 5/8 inch width, 0.030 inch
thickness, and break strength of 1100 pounds as the representative product for plastic
strapping applications. Each roll weighs 21 pounds (~9.1 kilograms) and contains 1800
feet of strapping. Therefore, the representative plastic strapping product has 93.8 square
feet or 8.71 square meters of area (i.e., a weight-to-area ratio of 0.224 pounds per square
foot or 1.09 kilograms per square meter). Plastic used in strapping applications of bulk
flexible packaging is modeled to be replaced with 100 percent steel strapping. Steel
strapping of slightly higher break strength, 1150 pounds, is used to account for the higher
flexibility performance of plastic strapping. The steel strapping used to obtain a plastic-to-
82 Franklin Associates considers the production of PET to be an appropriate proxy for life cycle
requirements of all non-polypropylene (PP) strapping resins (less than five percent). 83 Franklin Associates (1990). Appendix C. Market Shares and Weight Ratios for Plastics & Alternative
Materials in Packaging and Disposable Consumer Goods Prepared for SPI. 84 US Environmental Protection Agency. 2011. Municipal Solid Waste Generation, Recycling, and
Disposal in the United States Detailed Tables and Figures for 2010. Compiled by Franklin Associates,
A Division of ERG.

Chapter 2. Substitution Model
CLIENTS\ACC\KC182695 04.18.18 4103.00.001
73
steel substitution weight ratio is standard grade stainless steel strapping of ½ inch width,
0.51 mil thickness, on rolls 2940 feet long. The example volume of steel and the steel gauge
are used to determine the weight-to-area ratio of steel strapping: 0.820 pounds per square
foot or 3.99 kilograms per square meter. Equivalent areas (and break strength) of plastic
and steel strapping are compared to obtain the plastic-to-steel substitution weight ratio,
3.65 for this product application in bulk flexible packaging.
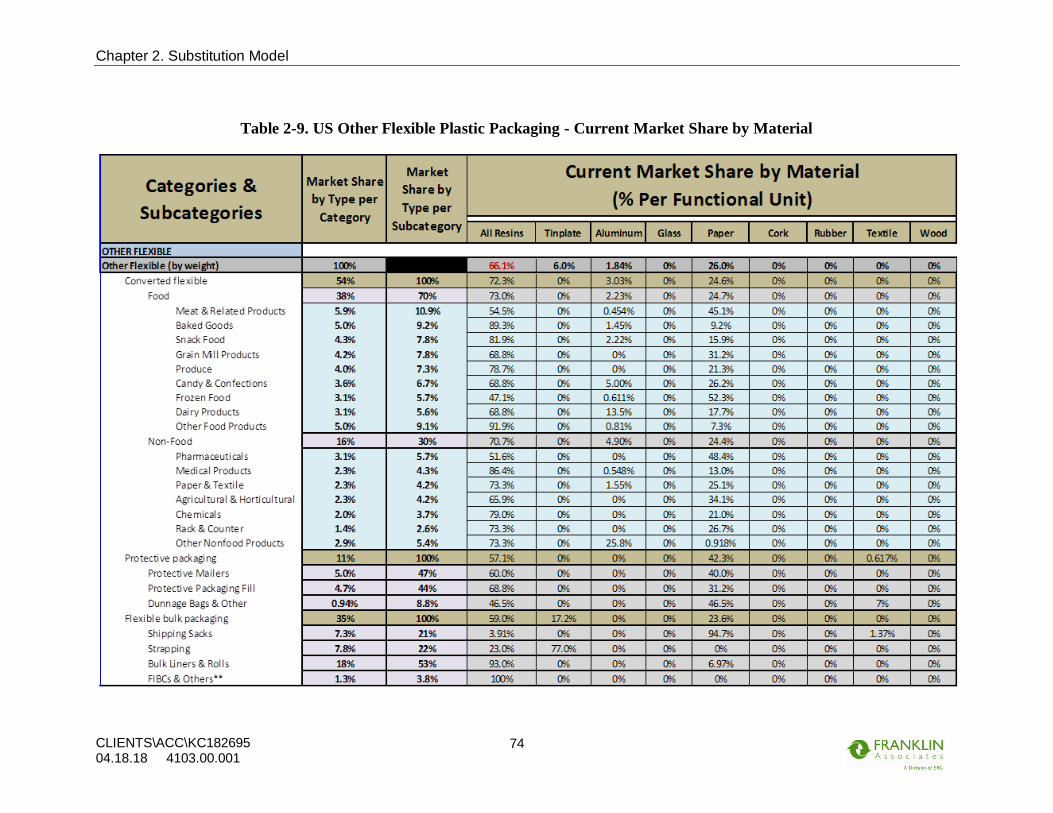
Chapter 2. Substitution Model
CLIENTS\ACC\KC182695 04.18.18 4103.00.001
74
Table 2-9. US Other Flexible Plastic Packaging - Current Market Share by Material
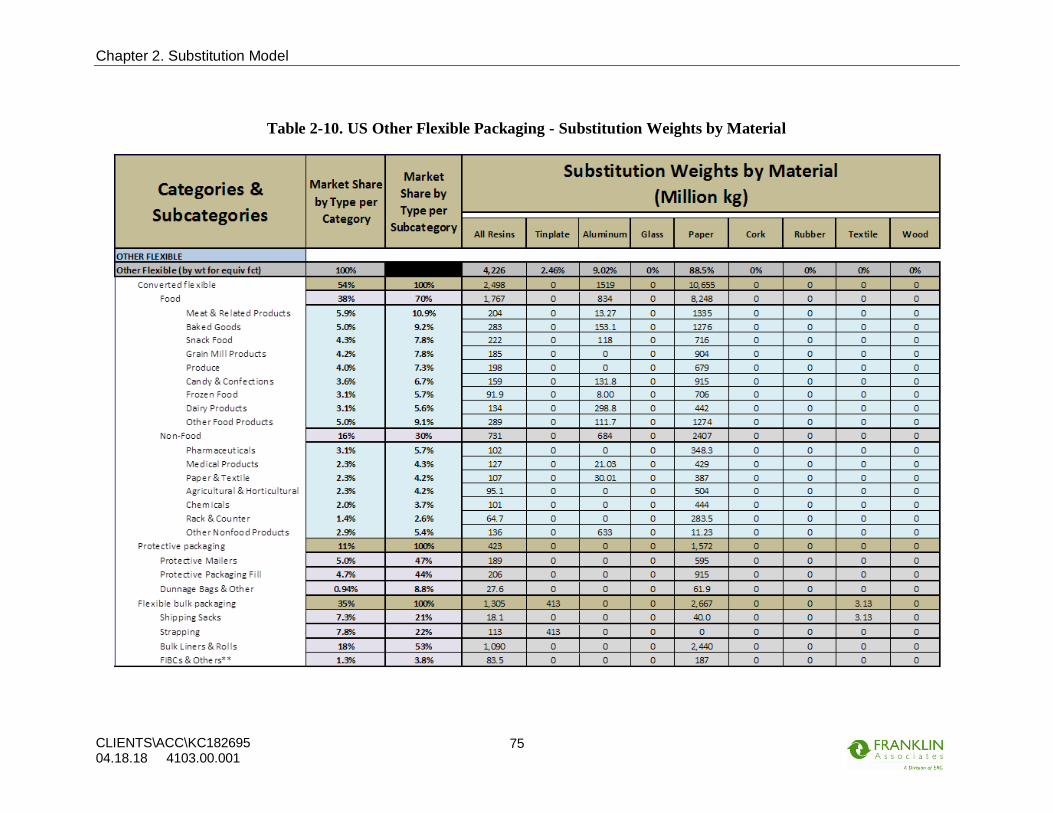
Chapter 2. Substitution Model
CLIENTS\ACC\KC182695 04.18.18 4103.00.001
75
Table 2-10. US Other Flexible Packaging - Substitution Weights by Material

Chapter 2. Substitution Model
CLIENTS\ACC\KC182695 04.18.18 4103.00.001
76
Table 2-11. Canadian Other Flexible Plastic Packaging - Current Market Share by Material

Chapter 2. Substitution Model
CLIENTS\ACC\KC182695 04.18.18 4103.00.001
77
Table 2-12. Canadian Other Flexible Packaging - Substitution Weights by Material

Chapter 2. Substitution Model
CLIENTS\ACC\KC182695 04.18.18 4103.00.001
78
2.5. BEVERAGE PACKAGING MARKETS
Data on the total number of plastic beverage containers by beverage category was obtained
from Freedonia tables.85 The total volume of each type of beverage sold packaged in plastic
was calculated based on the reported number of plastic containers sold and average volume
per plastic container. The size distribution of plastic and non-plastic containers for each
beverage category was obtained from Beverage Marketing Corporation data.86 The number
and types of alternative containers that would be used as substitute packaging for the
gallons of beverage currently packaged in plastic containers was based on the current mix
of alternative container materials and types, as well as some projections about additional
use of aseptic containers in some categories such as sports beverages.
The materials type(s) and size distribution of alternative containers required to package the
volume of beverage currently packaged in plastic varied by beverage category. In some
categories, there was only one major alternative to plastic containers (e.g., aluminum cans
for carbonated soft drinks, and cartons for milk). For both of those categories, glass
accounts for a very small share of the total volume of beverage currently sold. The category
of ready-to-drink fruit beverages (comprising chilled juices, chilled juice drinks, shelf-
stable juice, and shelf-stable juice drinks, in a range of single-serve and multi-serve sizes)
had the greatest number of types and sizes of substitute packaging options, including glass
bottles, steel cans, aluminum cans, coated gable-top cartons, and aseptic cartons.
For non-carbonated beverages, plastic container sizes up to 64 fluid ounces (oz) were
assumed to be replaceable by a single alternative material container. Since non-plastic
beverage containers larger than 64 oz are not commonly used, multiple alternative
containers were assumed to be required to substitute for individual plastic containers larger
than 64 oz (one half gallon). For example, two 64-oz gable-top milk cartons would
substitute for one 1-gallon plastic jug.
The category of sports drinks is currently almost exclusively packaged in plastic containers.
Based on information from representatives of a major beverage company, other types of
containers that could be used for sports drinks include glass bottles, aluminum cans, and
aseptic cartons. Most sports drinks are consumed away from home and are often taken to
sporting events in coolers filled with ice. Although some consumers will prefer clear (glass)
containers that allow them to view the contents, it is assumed that most consumers will
prefer containers that are light and non-breakable (cans and aseptic cartons); therefore, the
volume share of sports beverage packed in alternative containers was modeled as 40%
cans, 40% aseptic cartons, and 20% glass.
The substitution weight ratios take into account the difference in size, weight, and number
of alternative containers required to package the volume of beverage currently packaged
in plastic. In some cases, the substitute containers were the same size as the plastic
container, so the same number of substitute containers was required, and alternative
85 Freedonia (2008). Beverage Containers: US Industry Study with Forecasts for 2012 & 2017, Study
#2423 Prepared by The Freedonia Group, November 2008. 86 Beverage Marketing Corporation. Beverage Packaging in the U.S. 2005 Edition. November 2005.

Chapter 2. Substitution Model
CLIENTS\ACC\KC182695 04.18.18 4103.00.001
79
packaging weight ratios were based only on the difference in weight of the same-size
alternative containers. Where plastic container and substitute container volumes were
similar but not identical, substitute weights were calculated using the average grams of
container material per fluid ounce of beverage in the package.
In other cases, multiple units of alternative containers were required to substitute for large
plastic containers. For example, in the category of carbonated soft drinks, there are no
resealable multi-serving substitutes for 2-liter plastic bottles, so multiple 12-oz aluminum
cans were assumed to substitute for 2-liter plastic bottles. It takes 5.8 12-oz cans with an
average weight of 12.9 grams each to package the same amount of beverage that is
contained in a 2-liter bottle weighing 45.1 grams, so the substitute weight of aluminum
cans for 2 liters of carbonated soft drink is 1.66 times the weight of each 2-liter plastic
bottle.
These calculations were applied to each beverage category to determine the relative
weights of alternate materials required to packaging the volume of each type of beverage
currently packaged in plastic. As noted in the Introduction to the substitution modeling
discussion, substitution calculations are limited to replacement of the primary package
component(s). The scope of the study does not include evaluation of energy and
greenhouse gas differences associated with possible differences in filling processes for
plastic and substituted beverage containers, or consumer choices about refrigerating plastic
containers and substitute containers that do not require refrigeration as well as differences
between refrigeration between the US and Canadian beverage sector.

Chapter 2. Substitution Model
CLIENTS\ACC\KC182695 04.18.18 4103.00.001
80
Table 2-13. US Beverage Containers - Current Market Share by Material

Chapter 2. Substitution Model
CLIENTS\ACC\KC182695 04.18.18 4103.00.001
81
Table 2-14. US Beverage Containers - Substitution Weights by Material

Chapter 2. Substitution Model
CLIENTS\ACC\KC182695 04.18.18 4103.00.001
82
Table 2-15. Canadian Beverage Containers - Current Market Share by Material
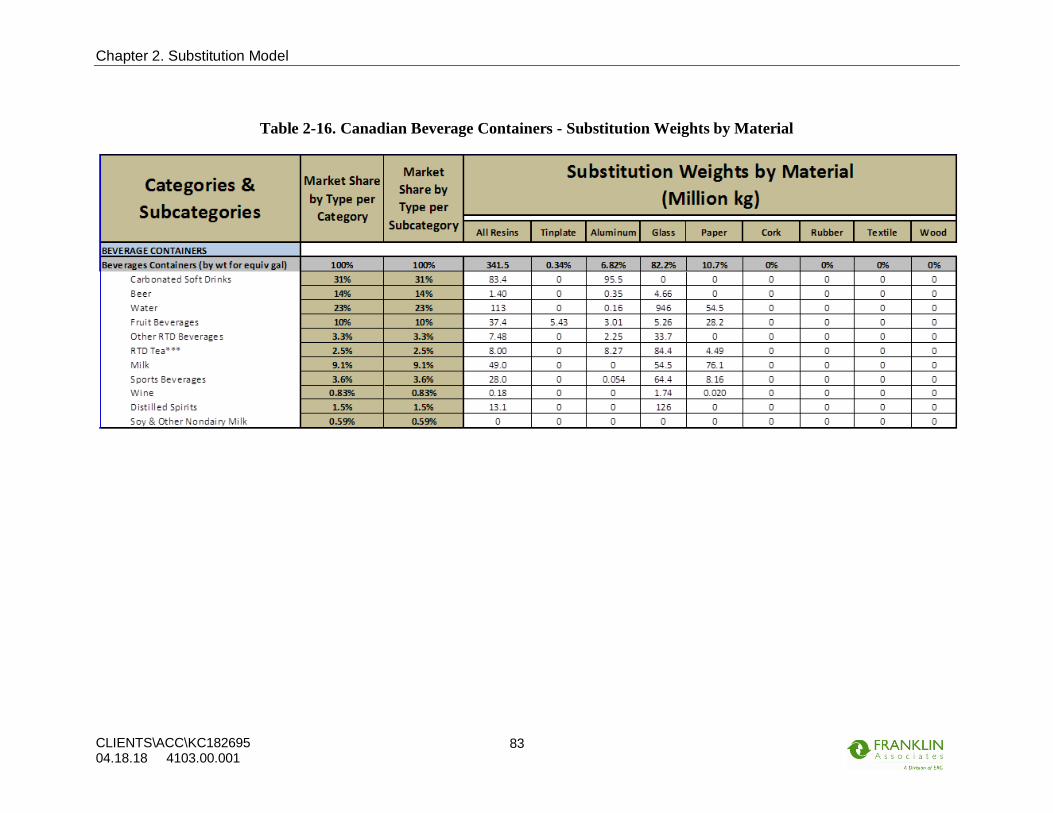
Chapter 2. Substitution Model
CLIENTS\ACC\KC182695 04.18.18 4103.00.001
83
Table 2-16. Canadian Beverage Containers - Substitution Weights by Material
Chapter 2. Substitution Model
CLIENTS\ACC\KC182695 04.18.18 4103.00.001
84
2.6. CARRIER BAGS PACKAGING MARKETS
Carrier bags include only bags and sacks provided by retailers (e.g., grocery, convenience,
department stores, etc.) or used by consumers at retailers (in the case of reusable bags) for
the consumer to use in transporting their purchased products. Large bags and sacks used
for bulk shipments are included in the flexible bulk packaging category. The overall
weights of one-way plastic and paper carrier bags are as reported by Freedonia market
data.87 These data consider only markets in which paper and plastic materials compete.
These Freedonia data also provided the relative number of one-way paper and plastic retail
bag and sack units. From the data, Franklin Associates determined the average weight of
one-way plastic retail bag and sacks per unit (0.014 pounds or 6.43 grams) and compared
this per unit data with other publicly available data to estimate that reusable bags can make
up a significant portion of total units of retails bags and sacks—nearly five percent.88
Because the use of reusable cotton and plastic retail bags has recently become significant,
overall weights for these materials are reflected in the current market share and substitution
model. As the overall weights of materials or granularity on relative share of resins used
for both one-way or reusable retail bags and sacks in Canada were not available, a US-to-
Canada population scaling factor and US relative shares were used to estimate weights of
materials used in Canadian demand.
In general, relative materials shares for each type of retail bag and sack material are
compiled from cross-checking the Freedonia data with other publicly available data. As
mentioned, the relative percentage of reusable bags is per the AECOM 2010 study. To
obtain granularity on the types, relative capacity, and weight-per-unit of reusable bags,
Franklin Associates uses data compiled for an LCA on carrier bags performed by Boustead
Consulting in 2006.89 Per the compiled data on both one-way and reusable bags and sacks,
Franklin Associates estimates that by units, about 80 percent are one-way plastic, 15
percent are one-way paper, 3.4 percent are reusable plastic, and the remainders are reusable
cotton. The plastic one-way retail bags and sacks are made of LDPE and HDPE, while the
plastic reusable types are made of LDPE and PP. The material breakout for individual
resins and non-plastic materials was cross-checked with qualitative and quantitative data
from the ACC 2012 Resins Review and previous work performed by Franklin Associates.90
The compiled data are used to estimate the relative weight share and identity of materials
that would substitute for plastic one-way and reusable bags and sacks in retail applications.
kraft paper bags are assumed to substitute for one-way plastic bags, while cotton bags are
assumed to substitute for reusable plastic bags. All paper retail bags and sacks are assumed
87 Freedonia (2010). Paper versus Plastic in Packaging: US Industry Study with Forecasts for 2014 &
2019, Study #2698 Prepared by The Freedonia Group, November 2010. 88 AECOM (2010). Table 5: Distribution of Bags at Checkout (Los Angeles), Project Report No. 18373
Economic Impact Analysis of Proposed Ban on Plastic Carryout Bags in Los Angeles County,
Prepared for Sapphos Environmental, Inc. in Pasadena California by AECOM Technical Services
(AECOM) November 3, 2010. 89 Boustead Consulting (2007). Life Cycle Assessment for Three Types of Grocery Bags – Recyclable
Plastic; Compostable, Biodegradable Plastic; and Recycled, Recyclable Paper, Prepared for the
Progressive Bag Alliance by Boustead Consulting & Associates Ltd. 90 Franklin Associates (1990). Appendix C. Market Shares and Weight Ratios for Plastics & Alternative
Materials in Packaging and Disposable Consumer Goods Prepared for SPI.
Chapter 2. Substitution Model
CLIENTS\ACC\KC182695 04.18.18 4103.00.001
85
to have the average recycled content for paper packaging based on recovery rates in the
EPA MSW Characterization in 2010.91 No information is available on the mix of retail
bags/sacks that are made from bleached versus unbleached paper. Grocery and retail bags
constitute over 40 percent of the category "packaging paper", which also includes multi-
wall shipping sacks and wrapping/converting paper. The most recent publicly available
data indicates that about 85 percent of packaging paper is unbleached and 15 percent is
bleached. This mix of bleached and unbleached paper is assumed for modeling the fiber
content of paper bags and sacks that would substitute plastic retail bags.
To determine substitution weight factors for each type of retail bag and sack, the functional
unit is number of bags (i.e., units) adjusted for differences in volume capacity. Franklin
Associates estimates that 80 percent of bag units are filled to capacity and this portion of
total bag units are adjusted for differences in capacity; the remaining 20 percent of units
are assumed to be filled to less than full capacity and so are compared on a one-to-one
basis. However, where a standard size plastic bag may be used to contain only one or two
items (i.e., not filled to capacity), a smaller paper bag is expected to be used for only one
or two items due to the expense and weight of the paper bags. The weights of paper sacks
and bags are adjusted to account for the higher volume capacity per unit per trip for paper
relative to plastic sacks and bags (i.e., average size of plastic bags hold a volume of goods
about 1.8 times less than the average sized paper bag).92 Though cotton reusable bags are
heavier than non-woven PP and heavy duty LDPE reusable bags, the cotton bags have a
higher volume capacity; ~1.09 times that of plastic reusable bags.93 While these durable
reusable plastic and non-plastic bags can replace many single-use carrier bags over their
lifetime, Franklin Associates does not attempt to distinguish between trip numbers for
reusable woven plastic versus cotton retail sacks and bags, so that one reusable plastic bag
is assumed to be substituted by one reusable cotton bag. Carrier bag substitution weights
are determined by compiling one-way paper-to-plastic bag or reusable cotton-to-plastic bag
weight ratios given the previously mentioned adjustments for differences in weight per unit
and volume capacity for each retail bag and sack type.
Given equivalency in units as adjusted for volume capacity per trip, the alternative
material-to-plastic retail bag and sack weight ratios determined for each type are used to
estimate the overall weight of each type of alternative material required to substitute for
plastics in this product market. Table 2-17 and Table 2-19 show that plastic bags currently
account for 83 percent of the total number of carrier/retail bags in use; however, because
plastic bags are lighter than functionally equivalent paper and textile bags, plastic bags
account for only 56 percent of the total weight of the carrier/retail bags currently used.
91 US Environmental Protection Agency. 2011. Municipal Solid Waste Generation, Recycling, and
Disposal in the United States Detailed Tables and Figures for 2010. Compiled by Franklin Associates,
A Division of ERG. 92 Capacity factor compiled by Franklin Associates per a previous LCI study on paper versus plastic
retail grocery bags. 93 Boustead Consulting (2007). Ibid.

Chapter 2. Substitution Model
CLIENTS\ACC\KC182695 04.18.18 4103.00.001
86
Table 2-17. US Carrier/Retail Bags - Current Market Share by Material
Table 2-18. US Carrier/Retail Bags - Substitution Weights by Material
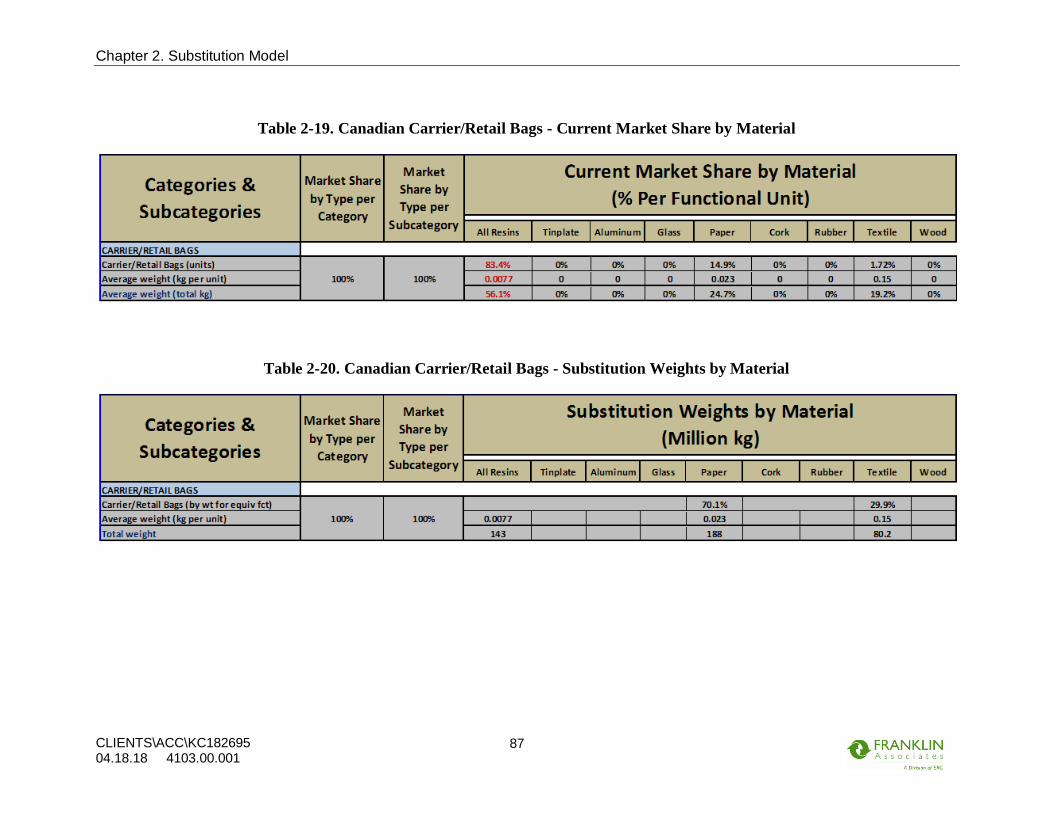
Chapter 2. Substitution Model
CLIENTS\ACC\KC182695 04.18.18 4103.00.001
87
Table 2-19. Canadian Carrier/Retail Bags - Current Market Share by Material
Table 2-20. Canadian Carrier/Retail Bags - Substitution Weights by Material

Chapter 2. Substitution Model
CLIENTS\ACC\KC182695 04.18.18 4103.00.001
88
2.7. CAPS AND CLOSURES MARKETS
The caps and closure packaging category includes all caps and closures utilized on
containers intended for disposal after use in beverage, food, pharmaceutical, cosmetic and
toiletry, household chemical, automotive chemical, and other packaging markets. The
overall weights of and number of units of caps and closures for each material type are as
reported by Freedonia market data.94 The Freedonia data are provided in terms of overall
weights of the plastic, steel and tin, aluminum, rubber, cork, and paperboard used in caps
and closures. The Freedonia data also provide the number of units of each type of material
used in the individual product applications and average weight per unit factors for plastic
and metal caps and closures. Per the Freedonia data, cork closures are only used in beverage
markets. Franklin Associates uses actual measurements of various types of beverage corks
cross-checked with publicly available data to determine an average weight per unit factor
for natural and synthetic corks closures.95 Per the Freedonia data, paperboard is only used
in caps and closures for food packaging applications (i.e., a very small weight of material
relative to other alternative caps and closures material). Franklin Associates assumes
paperboard use in caps and closures is for lidded paperboard closures on cylindrical
paperboard containers, as seals on container openings, or as paperboard lid liners inserted
into caps and closures of more rigid material. As there is little-to-no data available for size
distribution in these products, Franklin Associates applies a weight-per-unit factor that is
half of that provided in the Freedonia data for plastic caps and closures. This estimate is
cross-checked with publicly available specifications for paper closures and paper basis
weight calculations. Per the Freedonia data, rubber closures are used only in
pharmaceutical markets. Franklin Associates uses publicly available research to estimate
an average weight-per-unit factor for natural and synthetic rubber caps and closures.96
The Freedonia plastic data are also presented by relative market share and number of plastic
cap and closure units broken out by types: standard threaded, unthreaded, vacuum threaded,
pressurized threaded, dispensing and child-resistant. Examples of plastic dispensing caps
are for disc tops, spouts, bulbs for glass droppers, snap tops, sifter caps, ball rod caps,
push/pull caps, Yorker dispensing caps, and press or trigger type spray nozzles. Examples
of resin use in child-resistant caps and closures are for safe-lock ribbed caps and jigger
style squeeze and turn caps. Per research and a related European study97, Franklin
Associates considers that the dispensing and child-resistant type plastic caps and closures
are ‘unsubstitutable’. In other words, no alternative materials are considered to be capable
94 Freedonia (2010). Caps & Closures: US Industry Study with Forecasts for 2014 & 2019, Study #2688
Prepared by The Freedonia Group, October 2010. 95 PwC/Ecobilan (2008). Evaluation of the Environmental Impacts of Cork Stoppers versus Aluminum
and Plastic Closures: Analysis of the Life Cycle of Cork, Aluminum and Plastic Wine Closures, Report
prepared for Corticeira Amorim, SGPS, SA by PricewaterhouseCoopers/ECOBILAN, October 2008. 96 Landi S, Held HR (1965). Prevention of Chinosol Absorption by Rubber Stoppers Used to Seal Glass
Vials Containing Tuberculin PPD Mantoux Solutions, Bull. Wld Hlth Org. 33: 395-404. 97 Pilz H, Brandt B, Fehringer R (2010). The Impact of Plastics on Life Cycle Energy Consumption and
Green-House Gas Emissions in Europe, Part 1: Effects of a Theoretical Substitution of Plastics,
Prepared by Denkstatt GmbH for PlasticsEurope Association of Plastics Manufacturers Association
and Sustainable Energy Europe, Final Report June 2010.
Chapter 2. Substitution Model
CLIENTS\ACC\KC182695 04.18.18 4103.00.001
89
of providing the same functional service as dispensing or child-resistant caps and closures
made of plastic. The plastic weight and share of resins used (mostly PP and LDPE) in these
types of caps and closures are disaggregated from the provided Freedonia data and removed
from the model.
The overall weights of materials for caps and closures in Canada were also available from
Freedonia market tables.98 However, further granularity on the amounts of caps and
closures used in each product application or relative shares of resin in each product
application were not available for Canadian cap and closure demand. A US-to-Canada
population scaling factor, US relative shares by material, and relative percent shares of
resins used in US dispensing and child-resistant caps were used to estimate weights of
unsubstitutable plastics to remove and remaining weights of each material used in
Canadian demand for each product category application.
In general, relative materials shares for each cap and closure application were compiled by
cross-checking the Freedonia data and ACC Resin Review99 data with publicly available
specifications on cap and closure products and from previous public and private LCA work
performed by Franklin Associates. These sources are also consulted to obtain further
granularity on the relative shares of resins in each subcategory product application. For
beverage markets, Franklin Associates considers data for the plastic resins used in caps and
closures for: carbonated beverages, beer and malt beverages, bottle water, fruit beverages,
RTD beverages, RTD tea, milk, sports drinks, wine, distilled spirits, and soy and other
nondairy milk. Multiple data sources were also consulted for resins used in non-dispensing
and non-child-resistant type caps and closures for food markets (e.g., food bottle and jar
caps, condiment caps), pharmaceutical markets (e.g., threaded pill bottle tops), cosmetic
and toiletry markets (e.g., high moisture resistance caps), household cleaning and
automotive chemical markets (e.g., strong impact and chemical resistant), and other
markets (e.g., computer screen cleaner caps). Per the compiled data, Franklin Associates
estimates that by units, about 77 percent of caps and closures are plastic; of which, 46
percent are PP, 11 percent are LDPE, 10 percent are PS, six percent are HDPE, and less
than four percent are PVC or PET. For beverage caps, the overall resin share is about 60
percent PP, 14 percent LDPE, 13 percent PS, 8.0 percent HDPE, 2.3 percent PCV, and 2.3
percent PET. For food products, Franklin Associates assumes 75 percent PP, 20 percent
LDPE, 2.7 percent PS, and 2.5 percent HDPE. For pharmaceutical, cosmetic, and toiletry
applications, Franklin Associates estimates 60 percent PP, 20 percent LDPE, 10 percent
PVC, 9.0 percent HDPE, and one percent PS. Given the overall material breakout provided
by the Freedonia data (sans dispensing and child-resistant caps and closures), other caps
and closures are about 35 percent HDPE, 30 percent PP, 17 percent PET, ten percent PS,
five percent PVC, and three percent LDPE. The compiled data are used to estimate the
relative weight share and identity of materials that would substitute for each resin used in
caps and closures for various product applications. Steel, rubber, aluminum, cork, and
paperboard materials are expected to replace these plastic caps and closures. All paper cap
98 Freedonia (2011). World Caps & Closures: Industry Study with Forecasts for 2014 & 2019, Study
#2719 Prepared by The Freedonia Group, January 2011. 99 ACC (2012). The Resin Review: The Annual Statistical Report of the North American Plastics
Industry, American Chemistry Council, 2012 Edition.
Chapter 2. Substitution Model
CLIENTS\ACC\KC182695 04.18.18 4103.00.001
90
and closure substitute materials are assumed to have the average recycled content for paper
packaging per the EPA MSW Characterization in 2010 except for those in the food and
beverage subcategories (which are composed of virgin paper only).100
For cap and closure products, the functional unit of comparison is number of units (i.e.,
one unit of alternative materials substitutes for one plastic cap or closure). Plastic caps and
closures are used on both plastic containers and non-plastic containers. The substitution
model for plastic caps and closures described below is based on substituting the plastic
caps used for the current mix of plastic and non-plastic containers. The caps and closures
substitution model does not take into account the effect of substitutions for plastic
containers on which plastic caps are currently used. In other words, the substitution of caps
and closures is treated as an independent substitution analysis rather than a simultaneous
substitution analysis. Discussion of a simultaneous substitution analysis is provided at the
end of this section.
In the cap substitution model, the ratio of the average weight-per-unit factor for each
alternative material to the average weight-to-unit factor of the plastic cap and closure along
with the number of plastic units to be substituted are used to determine the weight of each
alternative material estimated to substitute for the currently demanded weight of plastic
resins. This approach is applied to each plastic resin for each cap and closure product
application.
Given a one-to-one assumption of equivalency in number of units101 and the average
weight-per-unit factors as compiled by Franklin Associates, the alternative material-to-
plastic cap and closure weight ratios determined for each type are used to estimate the
overall weight of each type of alternative material required to substitute for plastics in this
product market. As an example of how substitution ratios were determined, the following
section describes the approach for developing substitution weight factors in pharmaceutical
cap and closure applications.
Franklin Associates uses the material and market application breakout data (monetary and
physical units) as compiled from the Freedonia data to determine what fraction of total cap
and closure units are currently supplied by each packaging material in pharmaceutical cap
and closure applications. Per this data, of the total current market share of materials
alternative to plastic in pharmaceutical caps and closures are as follows: 87 percent rubber;
9.6 percent steel; 3.5 percent aluminum. Franklin Associates assumes that a material profile
similar to the current relative shares of alternative materials would replace plastic caps and
closures in the theoretical substitution model. The current relative percent shares of
alternative materials are in terms of cap and closure units and so applied to the total units
of plastic pharmaceutical caps and closures; in other words, of the ~6.99 billion units of
plastic pharmaceutical caps and closures, 87 percent, 9.6 percent, and 3.5 percent are
100 US Environmental Protection Agency. 2011. Municipal Solid Waste Generation, Recycling, and
Disposal in the United States Detailed Tables and Figures for 2010. Compiled by Franklin Associates,
A Division of ERG. 101 Aside from dispensing and child-resistant type plastic caps and closures which are considered to be
unsubstitutable.
Chapter 2. Substitution Model
CLIENTS\ACC\KC182695 04.18.18 4103.00.001
91
modeled to be replaced on a one-to-one unit basis with rubber, steel, and aluminum,
respectively. Franklin Associates then used the average weight-per-unit data indicated in
the Freedonia market report for plastic and metals along with data compiled by Franklin
Associates for average weight of rubber cap and closure units102 to determine the relative
weights of plastic versus alternative materials in the substitution scenario.
2.7.1. Simultaneous Substitution Analysis
In order to evaluate substitutions in plastic caps and closures simultaneously with
substitutions of plastic containers on which some of the plastic caps are currently used, a
multi-step process would be required. It would first be necessary to separate the amounts
and types of plastic caps used on plastic containers from the amounts and types of plastic
caps used on non-plastic containers. The available market data on caps and closures are not
provided at this level of detail. Next, the amounts and types of plastic containers that use
plastic caps would need to be identified within each packaging category. The simultaneous
analysis of plastic cap substitutions and plastic container substitutions would then need to
take into account the mix of container materials and configurations that are used to
substitute for the plastic containers that use plastic caps. Finally, assumptions would need
to be made about the types of non-plastic caps that would be used on the substitute
containers. Simultaneous substitution analysis for caps and closures was therefore not
conducted as it would involve complex projections with compounded uncertainties (first,
about the split of caps used on plastic versus non-plastic containers; second, assumptions
about what type of container replaces each type of plastic container that uses a plastic cap;
and third, assumptions about what type of non-plastic cap is used on the substitute
container). However, some general projections can be made regarding simultaneous
substitution:
• In cases where plastic containers are substituted with food or beverage cans made
of aluminum or steel, the closure for the metal container would be included as part
of the substitute container, so the plastic caps/closures on the current plastic
container would be substituted by 0 separate caps/closures for the substitute metal
container.
• Similarly, “minimal plastic” versions of gable-top and aseptic cartons might
involve removal of the plastic pour spout and cap and a return to using a fold-out
carton spout with no additional closure – which would also result in replacing the
plastic caps/closures on the current plastic container with no alternative cap/closure
on the substitute container.
• For cases where plastic containers are substituted with glass containers, metal
containers other than food/beverage cans, or rigid paperboard containers, the
substitute container would still require a cap. In most cases this would likely be a
metal cap, or in some cases, a fitted paperboard overcap (e.g., on paperboard
canisters), or a rubber cap or stopper for some beverages, pharmaceuticals, or
chemicals.
102 Landi S, Held HR (1965). Prevention of Chinosol Absorption by Rubber Stoppers Used to Seal Glass
Vials Containing Tuberculin PPD Mantoux Solutions, Bull. Wld Hlth Org. 33: 395-404.

Chapter 2. Substitution Model
CLIENTS\ACC\KC182695 04.18.18 4103.00.001
92
• Given relative share of metal bottles and jars to substitute for plastic beverage or
food bottles and jars, Franklin Associates can roughly estimate the potential effects
of a simultaneous substitution:
o A maximum of 59 percent of plastic beverage bottle volume and 7.6 percent
of plastic food bottles and jars may be modeled to be replaced with
aluminum cans which have embedded aluminum closures and tabs (i.e.,
roughly 59 and 7.6 percent of aluminum cap and closure units modeled to
substitute plastic cap and closure units for beverage and food bottle/jar
applications, respectively, might be overstated or double-counted in the
other categories);
o A maximum of 0.31 percent of plastic beverage bottle volume and 18
percent of plastic food bottles and jars may be modeled to be replaced with
steel cans which have embedded steel closures and/or tabs (i.e., roughly
0.31 and 18 percent of steel cap and closure units modeled to substitute
plastic cap and closure units for beverage and food bottle/jar applications,
respectively, might be overstated or double-counted in the other categories);
and
o A maximum of 17 percent of plastic beverage bottle volume and 28 percent
of plastic food bottles and jars are modeled to be replaced with paperboard
cartons which, in a theoretical substitution scenario where no plastic is used,
would no longer have plastic closures but would revert to an embedded
paperboard gable top-type closure (i.e., roughly 17 and 28 percent of
alternative material cap and closure units modeled to replace plastic units
for beverage and food bottle/jar applications, respectively, might be
overstated).
With simultaneous substitution of plastic beverage and food bottles and jars and plastic
caps and closures, the overall weight of aluminum and steel required to replace plastic caps
and closures decreases by 41 and 15 percent, respectively.

Chapter 2. Substitution Model
CLIENTS\ACC\KC182695 04.18.18 4103.00.001
93
Table 2-21. US Caps & Closures - Current Market Share by Material
Table 2-22. US Caps & Closures - Substitution Weights by Material

Chapter 2. Substitution Model
CLIENTS\ACC\KC182695 04.18.18 4103.00.001
94
Table 2-23. Canadian Caps & Closures - Current Market Share by Material
Table 2-24. Canadian Caps & Closures - Substitution Weights by Material
Chapter 2. Substitution Model
CLIENTS\ACC\KC182695 04.18.18 4103.00.001
95
2.8. SHRINK AND STRETCH FILM PACKAGING MARKETS
Shrink and stretch film packaging includes wrap, stretch labels and sleeves, and hoods
(e.g., pallet caps) used in product packaging and storage and distribution markets. The
product packaging market is disaggregated by food, beverage, paper and textile, consumer,
and other product applications; whereas, storage and distribution markets are for bulk
applications such as pallet wrap. The overall weights of materials used for shrink and
stretch packaging in the US are determined from Freedonia market data.103 These Freedonia
data also provided the relative US dollar demand for stretch and shrink wraps and film
within the product packaging and storage and distribution market categories. The total
weight of individual resins are reported for stretch and shrink packaging materials but data
for relative shares within the product packaging and storage and distribution market
categories are only reported in terms of monetary demand. As the average price per unit
for each type of stretch and shrink packaging product is not provided, it is assumed that the
relative market demand for each type correlates linearly with the relative weight of each
package type (i.e., price per pound of package is similar among stretch and shrink films
and wraps despite market served). The overall weights of materials used for stretch and
shrink film packaging in Canada are not available, so a US-to-Canada population scaling
factor and US relative shares were used as a proxy to break out types and materials per
subcategory and market application.
100 percent of stretch and shrink film demand is currently met with plastic materials. The
Freedonia data indicate that stretch and shrink films are LLDPE, LDPE, PVC, and other
resins. Franklin Associates assumes that ‘other’ resins are HDPE.
To determine substitution weight factors for each type of stretch or shrink film, the
functional unit is square footage of film adjusted for performance. Within each stretch or
shrink film packaging subcategory, a representative plastic film product was selected. The
weights of the representative plastic packages were determined from: 1) primary data from
previous LCAs performed by Franklin Associates, and/or 2) publicly available
specifications from packaging providers. The surface area of plastic film required for each
representative package was estimated from the representative package’s dimensions and
used, along with the performance specifications of the product application, as a basis to
determine weight of alternative materials required. In cases where plastic film was used to
unitize retail multi-packs of individual product (e.g., multi-packs of single-serve juice
drinks), the alternative was assumed to be a paper overwrap or paperboard sleeve, while in
cases where the plastic film was used to secure cases of product to pallets, the alternative
product was assumed to be steel strapping.
For plastic film applications substituted by paper and paperboard wraps, sleeves, or closed
boxes (e.g., a box replacing a tray with film overwrap), the thickness (a.k.a., basis weight)
for the alternative paper or paperboard layer is determined based on specifications
indicated for each representative product in the source data. The weight of the given surface
area of each alternative material layer was then determined based on its thickness. These
103 Freedonia (2011). Stretch & Shrink Film: US Industry Study w/ Forecasts for 2015 & 2020, Study
#2830 Prepared by The Freedonia Group, December 2011.

Chapter 2. Substitution Model
CLIENTS\ACC\KC182695 04.18.18 4103.00.001
96
weights are used to determine the overall paper-to-plastic material weight ratio for each
product application. For each alternative material, these weights are then summed to
determine the overall weight of alternative material that will substitute for the overall
weight of plastic currently demanded in the shrink and stretch film retail packaging market.
As an example of how substitution ratios were determined, the following section describes
the approach for developing substitution weight factors in stretch film storage and
distribution machine and manual pallet wrap applications.
Plastic stretch film products for storage and distribution applications are divided into ‘pallet
wrap’ and ‘bundling and other’ sub-applications; pallet wrap is split into sub-product
categories: machine wrap and hand wrap. Franklin Associates estimated stretch wrap
surface area required for a standard-size pallet (48 by 20 by 6 inches), loaded at to an
average height (5 feet), assuming a standard wrapping technique104 for plastic stretch film
securing an average pallet configuration with an average load weight of 1,440 pounds or
653.2 kilograms as the basis to which to compare alternative packaging material
requirements. Common pallet wrap film gauges for machine wrap are 50, 60, 70, and 80;
whereas, irregular loads may (i.e., manual wrapping) may require a thicker film such as
gauge 80, 100, or up to 120.105 Franklin Associates assumes a median value of these gauges,
65 (323 square feet per pound or 66.1 square meters per kilogram of plastic film) and 100
(208 square feet per pound or 42.7 square meters per kilogram of plastic film) for machine
and manual pallet wraps, respectively. Given the configurations of the standard
sized/loaded pallet and standard wrapping techniques (i.e., film surface area) and stretch
film gauge assumed for the machine and manual pallet stretch wraps, the weight of stretch
film is determined for each application. Franklin Associates assumes a six-to-four ratio of
machine-to-manual stretch film wrap in the pallet wrap submarket of storage and
distribution applications. Plastic used in pallet wrap applications for stretch film storage
and distribution is modeled to be replaced 100 percent with a combination of steel strapping
with fiber corrugated slip sheets required in 50 percent of cases to provide equivalent
product unitizing and protective performance. Steel strapping of break strength, 1,825
pounds, is used to account for the average pallet load weight of 1,440 pounds. The steel
strapping used to obtain a plastic-to-steel substitution weight ratio is standard grade
stainless steel strapping of ½ inch width, 0.51 mil thicknesses, on rolls 2940 feet long. The
example volume of steel, the steel gauge, and standard strapping techniques106 for pallets
are used to determine the steel-to-plastic weight ratios for stretch machine and manual
pallet wrap, ~17.8 and ~11.5, respectively. For corrugated slip sheets, Franklin Associates
assumes a requirement of two slip sheets of area equivalent to the pallet top-view per pallet;
slip sheets are corrugated containerboard with an average grammage of 375 (i.e., 0.077
pounds per square foot or 0.375 kilograms per square meter). The example surface area of
corrugated slip sheets and their grammage are used to determine the corrugated-to-plastic
104 FedEx (2012). Packaging Guidelines for Shipping Freight: FedEx Guidelines for Shipments Weighting
More Than 150 Lbs. Available at:
http://images.fedex.com/us/services/pdf/FreightPackagingGuidelines.pdf. 105 Shorr Packaging Corporation (2013). Pallet stretch wrap terms Available at:
http://www.shorr.com/pallet-stretch-wrap-terms. 106 FedEx (2012). Packaging Guidelines for Shipping Freight: FedEx Guidelines for Shipments Weighting
More Than 150 Lbs. Available at:
http://images.fedex.com/us/services/pdf/FreightPackagingGuidelines.pdf.

Chapter 2. Substitution Model
CLIENTS\ACC\KC182695 04.18.18 4103.00.001
97
weight ratios for stretch machine and manual pallet wrap, ~7.00 and ~4.52, respectively,
in 50 percent of plastic pallet wrap substitution cases.
Per the compiled estimates, shrink and stretch film packaging is expected to be replaced
by a mix of steel, corrugated cardboard, virgin kraft paper (for food applications), and kraft
paper with recycled content (for non-food applications). Recycled content and recovery
rates for substitute materials are described in Chapter 3.
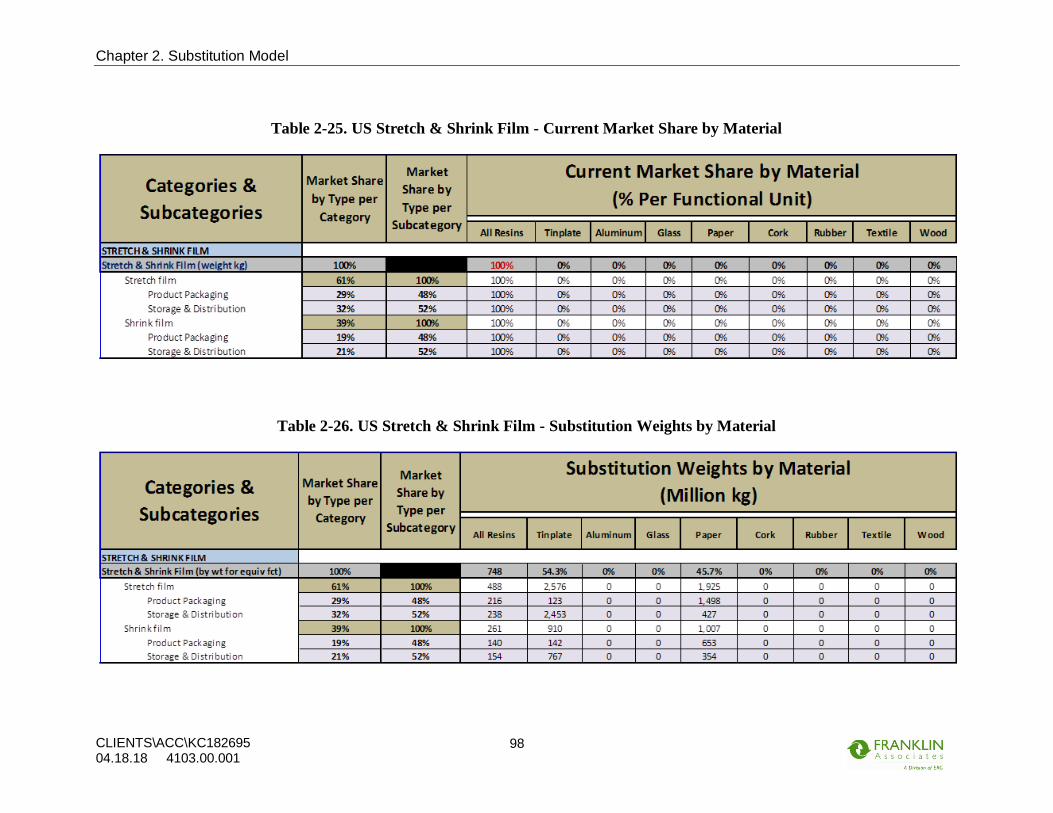
Chapter 2. Substitution Model
CLIENTS\ACC\KC182695 04.18.18 4103.00.001
98
Table 2-25. US Stretch & Shrink Film - Current Market Share by Material
Table 2-26. US Stretch & Shrink Film - Substitution Weights by Material
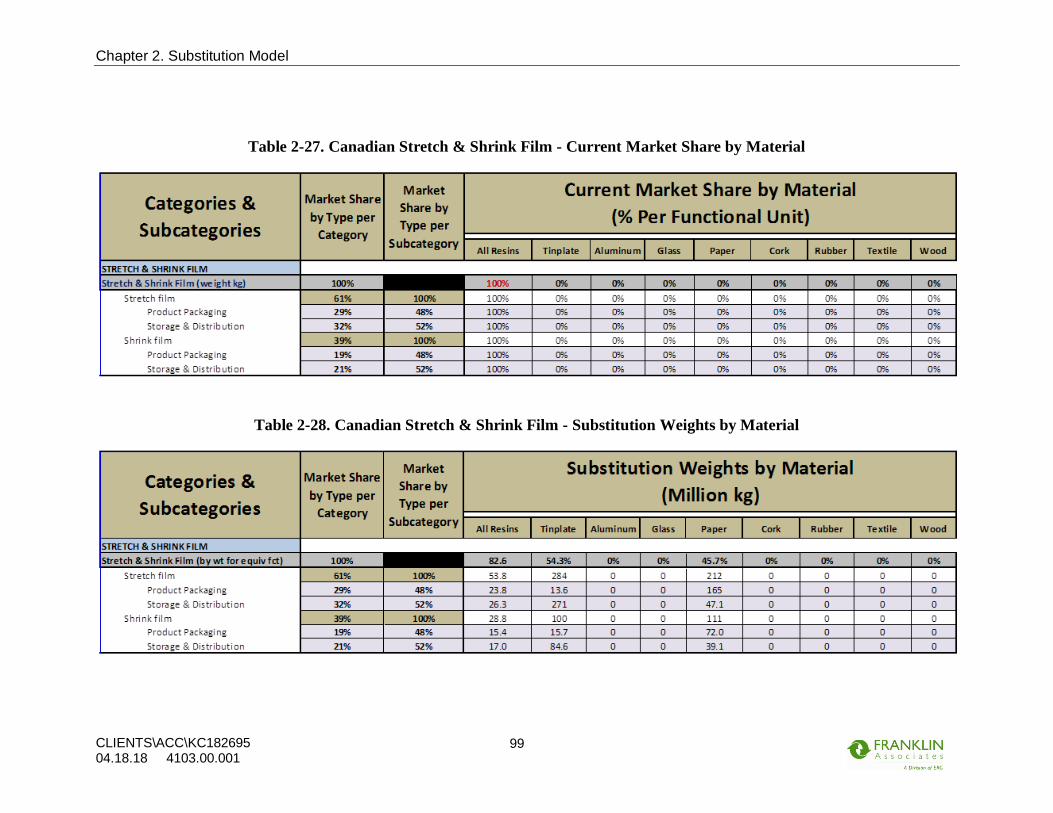
Chapter 2. Substitution Model
CLIENTS\ACC\KC182695 04.18.18 4103.00.001
99
Table 2-27. Canadian Stretch & Shrink Film - Current Market Share by Material
Table 2-28. Canadian Stretch & Shrink Film - Substitution Weights by Material
Chapter 3. Life Cycle Inventory
CLIENTS\ACC\KC182695 04.18.18 4103.00.001
100
CHAPTER 3. LIFE CYCLE INVENTORY
3.1. OVERVIEW
This life cycle inventory (LCI) quantifies the total energy requirements, energy sources,
and atmospheric pollutants from the life cycle of the material packaging systems
investigated in this analysis. The purpose of this chapter is to define the LCI model
construction and data sources for the investigated types of plastic and non-plastic
packaging. For each packaging type, the chapter describes the product system
specifications and a discussion of the life cycle models constructed by life cycle stage.
3.1.1. Methodology for Data Compilation/Verification
The accuracy of the study is directly related to the quality of input data. The data-gathering
process for each system considered the identity of materials and processes necessary to
manufacture, distribute, recycle, and dispose of the investigated packaging types. During
the data compilation phase, Franklin Associates had correspondence with ACC, CPIA, and
other industry experts to ensure that all aspects of the substitution model and assumptions
made in the selection of LCI data were clearly understood and consistent with the system
boundaries of this study.
Each unit process in the life cycle study is constructed independently of all other processes.
This allows objective review of individual data sets before their contribution to the overall
life cycle results has been determined. Also, because these data are reviewed individually,
assumptions are reviewed based on their relevance to the process rather than their effect on
the overall outcome of the study. LCI Data from credible published sources or licensable
databases are used wherever possible to maximize transparency and duplicatability. Data
sets from Franklin Associates’ North American industry average database were used for
processes and materials where reliable current published data were not available. This
database has been developed over a period of years through research for many LCI projects
encompassing a wide variety of products and materials. Another advantage of the database
is that it is continually updated. For each ongoing LCI project, verification and updating is
carried out for the portions of the database that are accessed by that project.
3.2. COMPARISON OF PACKAGING SYSTEM DISTRIBUTION SPECIFICATIONS
The boundaries account for transportation requirements between all life cycle stages.
Because of the very broad scope of packaging products covered by the project, some broad
simplifying assumptions have been made regarding transportation distances and modes for
shipping packaging from converters to fillers in both the US and Canada. These data were
compiled by Franklin Associates from existing public and private LCA studies and national
census data and are representative of average requirements for US and Canadian supply
chains for packaging materials, respectively. These specifications include: 1) average
distances from resource extraction and/or processing to materials fabrication and/or

Chapter 3. Life Cycle Inventory
CLIENTS\ACC\KC182695 04.18.18 4103.00.001
101
package converting facilities in the production and recycling phases, and 2) average
distances and packer truck densities for disposal management in the EOL phase. North
American Industry Classification System (NAICS) codes were used to estimate distances
for transport of finished packaging to fillers for each country based on the number of
manufacturing facilities for each type of packaging in each country. The compiled data
were used by Franklin Associates to calculate average transportation requirements for each
life cycle step in each geographic scope. Truck transport in North America is then modeled
as tonne-km of combination truck transport, fueled by fossil-derived diesel.
3.3. PLASTIC PACKAGING SYSTEMS
3.3.1. Production of Plastic Resins
Cradle-to-virgin conventional PET resin production is based on a life cycle inventory
Franklin Associates conducted for the Plastics Division of the American Chemistry
Council (2010).107 This data represents the most recent LCI data for plastics production in
North America. These data are publicly available through the US LCI database
(www.nrel.gov/lci) and include production of the investigated resins:
• Low-Density Polyethylene (LDPE)
• High-Density Polyethylene (HDPE)
• Polypropylene (PP)
• Polyvinyl Chloride (PVC)
• Polystyrene (PS)
• Expanded Polystyrene (EPS)
• Polyethylene Terephthalate (PET)
3.3.2. Plastic Converting Processes
This analysis uses plastic converting LCI data from Franklin Associates’ Private LCI
Database.
3.3.2.1. Film & Sheet Extrusion
Plastic film is made by the extrusion of resin followed by the pulling and cooling of film.
Plastics extrusion is a manufacturing process in which raw plastic material is melted and
formed into a continuous profile. In the extrusion of plastics, resin is gravity fed from a
top-mounted hopper into the barrel of the extruder. The material enters through the feed
throat and comes in contact with the screw. The rotating screw (turning at
approximately120 rpm) forces the resin into a heated barrel. The molten plastic leaves the
screw and travels through a screen that removes contaminants. The molten plastic is then
forced through an annular slit die, usually vertically, to form a thin walled tube. Air is
blown through a hole in the center of the die to blow up the tube. A high-speed air ring is
107 American Chemistry Council. 2010. Cradle-to-Gate LCI of Nine Plastic Resins and Two Polyurethane
Precursors. Franklin Associates, A Division of ERG.
Chapter 3. Life Cycle Inventory
CLIENTS\ACC\KC182695 04.18.18 4103.00.001
102
on top of the die and blows onto the hot film to cool it. The tube of film then continues
upwards, continually cooling, until it passes through nip rolls where the tube is flattened.
The edges of the tube are slit to produce two flat film sheets. The film is then wound onto
reels. Data for film extrusion are based on confidential industry data collected from 1992
through 2005 and APME data collected in the 1990s.108,109
3.3.2.2. Blow Molding
Hollow plastic parts are formed by a process called blow molding. Melted plastic is
extruded into a hollow tube (a parison) and captured by closing it into a cooled metal mold.
Low-pressure air (typically 25 to 150 psi) is blown into the parison, inflating it into the
shape of the desired container. Once the plastic has cooled, the mold can be opened and
the part ejected. Data for extrusion blow molding are based on confidential industry data
collected from 1992 through 2005 and APME data collected in the 1990s.110,111
3.3.2.3. Injection Stretch Blow Molding
The first step in the injection stretch blow molding (ISBM) process is production of a
preform using the injection mold process (see Injection Molding). The preform is made up
of a fully formed bottle/jar neck with a thick tube of polymer attached, which eventually
forms the body. The preform is heated above the glass transition temperature and stretched
mechanically with a core rod. First, low pressure air is introduced to blow a bubble. After
the stretch rod is fully extended, high-pressure air blows the expanded plastic bubble into
the shape of the blow mold. Injection stretch blow molding is commonly used to produce
polyethylene terephthalate (PET) beverage bottles, as the polymer is strengthened when
stretched, allowing it to keep its shape under pressures e.g., created by carbonated
beverages. ISBM data are based on confidential industry data collected from 1992 through
2005 and APME data collected in the 1990s.112,113
3.3.2.4. Thermoforming
Like injection molding, thermoforming is a principal fabrication technique for rapidly
creating large quantities of plastic articles. This technique is relatively simple and well
established. A sheet of extruded plastic is fed, usually on a roll or from an extruder, into a
heated chamber where the plastic is softened. The sheet is then clamped over a negative
mold while in a softened state and then cooled. A punch loosens the plastic forms and
eliminates sheet webbing that may be recycled back into the process. Thin-gauge sheet or
108 Franklin Associates, A Division of ERG. Data from industry sources collected from 1992 through
2005. 109 Boustead (1997). Eco-Profiles of the European Plastics Industry, Report 10: Polymer Conversion.
Association of Plastics Manufacturers in Europe (APME). 110 Franklin Associates, A Division of ERG. Ibid. 111 Boustead (1997). Ibid. 112 Franklin Associates, A Division of ERG. Data from industry sources collected from 1992 through
2005. 113 Boustead (1997). Eco-Profiles of the European Plastics Industry, Report 10: Polymer Conversion.
Association of Plastics Manufacturers in Europe (APME).
Chapter 3. Life Cycle Inventory
CLIENTS\ACC\KC182695 04.18.18 4103.00.001
103
film is used in thermoforming to produce disposable/recyclable food, medical and general
retail products such as containers, cups, lids, and trays. Thick-gauge sheet is used to
produce larger, usually more permanent, items such as plastic pallet, truck beds, and spas.
Thermoforming data are based on primary data that were compiled for the Rigid Plastics
Packaging Group (RPPG) in 2011 and are available through the US LCI Database.114
3.3.2.5. Injection Molding
Injection molding is one of the primary fabrication techniques for rapidly creating large
quantities of plastic articles ranging from disposable food containers to high precision
engineering components. For this manufacturing process, plastic is fed by a rotating screw
under high pressure into a mold that is the inverse shape of the desired product shape. The
melted plastic solidifies when it comes into contact with the cooled wall of the mold. The
mold opens and the finished part is ejected, completing the cycle. Injection molding data
are based on primary data that were compiled for the Rigid Plastics Packaging Group
(RPPG) in 2011 and are available through the US LCI Database.115
3.4. NON-PLASTIC PACKAGING SYSTEMS
3.4.1. Steel Packaging
3.4.1.1. Steel Production
This analysis uses steel data from Franklin Associates’ private LCI database. The basic raw
material for steel manufacture is iron ore. This material is usually found in flat-lying or
gently sloping beds not more than 20 feet thick. Open pit mining accounts for 90 percent
of the iron ore extracted at present, with the remainder being recovered from deep vertical
shaft mines. For production of virgin pig iron, iron-ore, coke, and fluxes are charged into
a blast furnace, where the iron ore is reduced. The reduced iron melts and runs down to the
bottom of the hearth. The flux combines with the impurities in the ore to produce a slag
which also melts and accumulates on top of the liquid iron in the hearth
Since the mid 1970s, the blast oxygen furnace (BOF) process has seen widespread use in
steel making. This process offers the advantage of using both virgin pig iron and scrap or
recycled steel as feedstock. In the oxygen steelmaking process, high-purity oxygen is
blown under pressure through, onto or over a bath containing hot metal, steel scrap and
fluxes to produce steel.116 Hot metal composition and temperature are the most important
variables that determine the percentage of scrap that can be charged to a heat. Typically,
most pneumatic furnaces (of which the BOF is an outgrowth) consume 20 to 35 percent of
114 RPPG (2011). Life Cycle Inventory of Plastic Fabrication Processes: Injection Molding and
Thermoforming, Prepared by Franklin Associates, A Division of ERG for the Rigid Plastic Packaging
Group (RPPG) of the American Chemistry Council (ACC), September, 2011. 115 RPPG (2011). Life Cycle Inventory of Plastic Fabrication Processes: Injection Molding and
Thermoforming, Prepared by Franklin Associates, A Division of ERG for the Rigid Plastic Packaging
Group (RPPG) of the American Chemistry Council (ACC), September, 2011. 116 US Steel (1985). The Making, Shaping and Treating of Steel, 10th Edition. United States Steel
Corporation. Published by the Association of Iron and Steel Engineers. Pittsburgh, PA. 1985.
Chapter 3. Life Cycle Inventory
CLIENTS\ACC\KC182695 04.18.18 4103.00.001
104
the total metallic charge as cold scrap.117 On average, about 28.5 percent of the total
metallic material charged to BOFs in North America is cold scrap.118 About 60 percent of
North American steel production is by the BOF route.
The primary sources of heat for oxygen steel making processes are from the hot metal
charged to the furnace and from the oxidation of carbon, silicon, manganese, phosphorus,
iron and other elements contained in the hot metal charge. Minimal quantities of natural
gas and coke oven gas are used to supply supplemental heat to the furnace and to preheat
ladles and casters. The following assumptions were made in analyzing available data for
the production of raw steel from the BOF route:
• Coke oven gas is used as a fuel at a rate of 1.23 kilograms of gas per 1,000
kilograms of raw steel. A density of 0.43 kilograms per cubic meter is assumed for
the gas;119
• Energy requirements and environmental emissions for heating and operating ladles
and casters are included with those for the BOF;
• Coproduct credit is given on a weight basis for the slag produced in the BOF. This
material is used as an input to sinter production and directly into the blast furnace
for its iron content. Because the coproduct credit is given on a weight basis, the
output from the BOF is increased to account for the input of BOF slag into sinter
production and the blast furnace.
• Carbon dioxide emissions from the oxidation of carbon in the pig iron are calculated
assuming the pig iron enters the BOF with a carbon content of about 4.5 percent120
and the raw steel leaving the BOF has a carbon content of about 0.75 percent. It is
also assumed that all of the carbon is oxidized to carbon dioxide.
While a blast furnace and BOF are used to produce raw steel from mainly virgin materials,
an EAF is used for making raw steel from process and recycled scrap. LCI data for
production of steel from an EAF are also from Franklin Associates’ private LCI database.
The EAF is capable of accepting a charge of nearly 100 percent scrap. The EAF model
reflects a charge to the electric furnace of virtually all scrap with small amounts of
limestone and lime added. These materials are melted by the conversion of electric energy
into heat. Current is brought to the furnace through large carbon electrodes, and the energy
is converted to heat in the furnace. Approximately, 40 percent of US steel production is by
the EAF route.
3.4.1.2. Steel Sheet Manufacture & Sheet Converting
This analysis uses steel sheet manufacturing data from Franklin Associates’ private LCI
database. After the raw steel leaves the BOF, it proceeds through a series of milling
processes before emerging as steel strip. A vacuum degassing process refines the steel from
117 US Steel (1985). Ibid. 118 Information conveyed through personal conversation with Bill Heenan, The Steel Recycling Institute.
Pittsburgh, Pennsylvania. May through August, 1994. 119 Loison, Roger (1989). Coke- Quality and Production, Buttersworth Books, London. 120 USBM (1984). Mineral Facts and Problems, Bureau of Mines, US Department of Interior.

Chapter 3. Life Cycle Inventory
CLIENTS\ACC\KC182695 04.18.18 4103.00.001
105
the furnace before it enters the casting step. Continuous casting is used almost exclusively
to produce slabs for flat rolled products from raw steel produced in the basic oxygen
process.121 The continuously cast slabs pass through the hot rolling mill and then the cold
rolling mill to produce sheet. The surface of the steel is cleaned by an acid treatment (using
hydrochloric acid) called pickling. Finally, the steel strip is coated with a layer of tin. The
tin provides a barrier to corrosion at a relatively low cost. For this data module, it is
assumed that 3 kilograms of tin are applied per 1,000 kilograms of steel, or 0.3 percent of
the weight of the finished steel.
Available data for steel milling operations indicated the use of coke oven gas to supply
energy for reheating the steel during hot milling. For this analysis, this heat is assumed to
be supplied by natural gas instead of coke oven gas.
Steel caps for containers are modeled based on Franklin Associates’ private LCI database
and are representative of steel production in a basic oxygen furnace (BOF). Cap production
also includes the processes of steel sheet manufacture and steel cap stamping.
Fabrication data for two-piece cans are adapted from ecoinvent steel forming processes to
the North American context by linking ecoinvent process and transportation energy
requirements to North American data sets for production and combustion of corresponding
process and transportation fuels.
3.4.2. Aluminum Packaging
3.4.2.1. Primary & Secondary Aluminum Production
This analysis uses aluminum data from Franklin Associates’ private LCI database adapted
from a 2013 LCA on semi-finished aluminum products conducted for the Aluminum
Association.122 Before it can be used in the manufacture of metallic aluminum, bauxite ore
must be refined to nearly pure aluminum oxide, usually called alumina. The Bayer process
is the preferred method for bauxite refining. Bauxite is crushed and dissolved in digesters
using strong caustic soda and lime solution. The undissolved residue, known as red mud,
is filtered out. Sodium aluminate remains in solution, where it is hydrolyzed and
precipitated as aluminum hydroxide, which is then calcined to alumina in a rotary kiln.
Smelting is the reduction of refined alumina to metallic aluminum by the electrolytic
separation of aluminum from its oxide. The process is carried out in a long series of
electrolytic cells carrying direct current. The alumina is dissolved in a molten bath of
cryolite (an electrolyte) and aluminum fluoride (which increases the conductivity of the
electrolyte). Molten aluminum is discharged from a smelter into the holding and ingot
casting facility. In this step, molten metal is typically combined with high quality, in-house
scrap and then cast into aluminum ingots.
121 Information conveyed through personal conversation with Bill Heenan, The Steel Recycling Institute.
Pittsburgh, Pennsylvania. May through August, 1994. 122 Aluminum Association. December 2013. The Environmental Footprint of Semi-Finished Aluminum
Products in North America, see:
http://www.aluminum.org/sites/default/files/LCA_Report_Aluminum_Association_12_13.pdf.
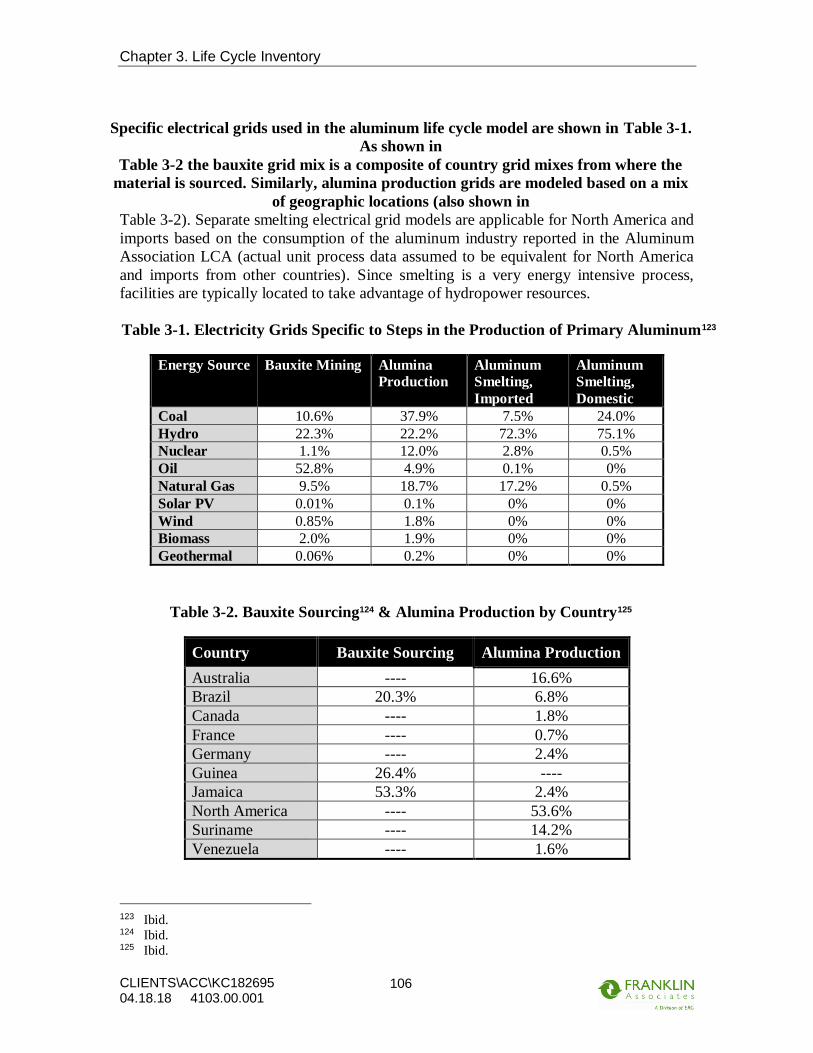
Chapter 3. Life Cycle Inventory
CLIENTS\ACC\KC182695 04.18.18 4103.00.001
106
Specific electrical grids used in the aluminum life cycle model are shown in Table 3-1.
As shown in
Table 3-2 the bauxite grid mix is a composite of country grid mixes from where the
material is sourced. Similarly, alumina production grids are modeled based on a mix
of geographic locations (also shown in
Table 3-2). Separate smelting electrical grid models are applicable for North America and
imports based on the consumption of the aluminum industry reported in the Aluminum
Association LCA (actual unit process data assumed to be equivalent for North America
and imports from other countries). Since smelting is a very energy intensive process,
facilities are typically located to take advantage of hydropower resources.
Table 3-1. Electricity Grids Specific to Steps in the Production of Primary Aluminum123
Energy Source Bauxite Mining Alumina
Production
Aluminum
Smelting,
Imported
Aluminum
Smelting,
Domestic
Coal 10.6% 37.9% 7.5% 24.0%
Hydro 22.3% 22.2% 72.3% 75.1%
Nuclear 1.1% 12.0% 2.8% 0.5%
Oil 52.8% 4.9% 0.1% 0%
Natural Gas 9.5% 18.7% 17.2% 0.5%
Solar PV 0.01% 0.1% 0% 0%
Wind 0.85% 1.8% 0% 0%
Biomass 2.0% 1.9% 0% 0%
Geothermal 0.06% 0.2% 0% 0%
Table 3-2. Bauxite Sourcing124 & Alumina Production by Country125
Country Bauxite Sourcing Alumina Production
Australia ---- 16.6%
Brazil 20.3% 6.8%
Canada ---- 1.8%
France ---- 0.7%
Germany ---- 2.4%
Guinea 26.4% ----
Jamaica 53.3% 2.4%
North America ---- 53.6%
Suriname ---- 14.2%
Venezuela ---- 1.6%
123 Ibid. 124 Ibid. 125 Ibid.

Chapter 3. Life Cycle Inventory
CLIENTS\ACC\KC182695 04.18.18 4103.00.001
107
Secondary aluminum production processes are modeled based on data from the 2010
aluminum can LCA report sponsored by the Aluminum Association. Processes include
scrap preparation (i.e. shredding, decoating) as well as remelting and secondary ingot
casting. There is a 4.6 percent loss of scrap material during the remelting and secondary
ingot casting process.
3.4.2.2. Aluminum Converting
Data for converting aluminum into can sheet and finished cans are derived from Franklin
Associates’ adaptation of process data in the Aluminum Association 2010 US LCA
update.126 The average aluminum can recycled content is 67.8% based on data from the
Aluminum Association 2010 LCA. Aluminum foil converting data is from a 2013
European study127, adapted to use North American data sets for modeling inputs.
3.4.3. Glass Packaging
This analysis uses glass data from Franklin Associates’ private LCI database based
information from the Glass Packaging Institute. Glass sand, the predominant raw material
for glass manufacture, is the source of almost all of the silicon dioxide present in the
finished glass. Silicon dioxide accounts for approximately 70 percent by weight of finished
glass. Glass sand is a high purity quartz sand with high silica content and typically less
than one percent of iron oxide, chromium compounds, and alumina, calcium, or
magnesium oxides.
Glass is manufactured by mixing glass sand, limestone, soda ash, feldspar, small amounts
of other minerals and “cullet”128 into a homogenous mixture, which is then fed to the
melting furnace. This is typically a natural gas-fired, continuous melting, regenerative
furnace. Fuel is conserved by using brick checkers to collect furnace exhaust gas heat, then
using the hot checkers to preheat the furnace combustion air. The melting furnace
contributes over 99 percent of the total air emissions from a glass plant, including
particulates, sulfur oxides, nitrogen oxides, volatile organic compounds, and carbon
monoxide. The molten glass is directed to forming machines where it is cut into sections
called gobs and shaped into containers. The container undergoes finishing, annealing,
inspection, and then preparation for shipment.
In-house cullet is melted in a glass furnace in a manner similar to the virgin inputs to a
conventional batch operation. It is widely recognized that cullet melts at a lower
temperature than virgin glass materials. Because the glass furnace accounts for a large
126 Aluminum Association. May 2010. Life Cycle Impact Assessment of Aluminum Beverage Cans, see:
http://www.aluminum.org/Content/ContentFolders/LCA/LCA_REPORT.pdf 127 European Aluminium Association. April 2013. Environmental Profile Report for the European
Aluminium Industry, see: https://european-aluminium.eu/media/1329/environmental-profile-report-
for-the-european-aluminium-industry.pdf 128 Cullet is imperfect articles of glass, trim, or other glass pieces that are melted and used in new glass
products.

Chapter 3. Life Cycle Inventory
CLIENTS\ACC\KC182695 04.18.18 4103.00.001
108
portion of the manufacturing energy for the container, any energy savings in the furnace
can significantly affect the total energy demand. Cullet generated in-house is returned to
the furnace. Although in-house scrap has been the major source of cullet for many plants,
mandatory deposit conditions and more active collection programs have increased the
amount of postconsumer cullet recovered (see Section 3.5.1. Plastic Recycling).
Postconsumer cullet must be recovered, sorted, and crushed before it is added to the virgin
material. The average glass containers in this study are made with 27 percent postconsumer
cullet. After adjustment for converting yield, the average container glass recycled content
in the US is modeled as 25 percent. 129,130
3.4.4. Paper, Paperboard, & Corrugated Packaging
3.4.4.1. Raw Pulp Material Inputs
Raw materials for production of paper, paperboard, and corrugated packaging include:
virgin pulpwood, either purchased or cut from forestry resources and delivered to pulp and
paper or containerboard mills; and recovered fiber from postconsumer fiber-based
packaging.131 Recovered fibers must be sorted, de-contaminated, and cleaned mechanically
before being processed.
The ratio of each type of forest product (i.e., soft- and hardwood logs, chips, and residues)
from forest regions that are used as virgin inputs at North American pulp and paper or
containerboard mills are estimates compiled by Franklin Associates from publicly
available statistics compiled by the American Forest & Paper Association (AF&PA) and
the US International Trade Commission (USITC).132,133 The LCI data for producing the
virgin material and hogfuel inputs to the pulp and paper and containerboard mills are
represented by updated forestry LCI data from CORRIM Phase I and Phase II reports.134,135
The updated CORRIM LCI data include seeding, cultivation, and harvesting of lumber
129 Owens-Illinois, Inc. 2011. Life Cycle Assessment of Glass, Aluminum, and PET Containers. 130 US EPA. The Quest for Less. EPA530-R-05-005 June 2005. 131 Note there is a distinction between virgin pulpwood, resources extracted from forestry operations, and
virgin woodpulp, pulp produced in a digester from virgin pulpwood. 132 AF&PA (2009). Table 17. Pulpwood Consumed in Wood Pulp Manufacture, Paper, Paperboard, &
Pulp, 2008 Statistical Summary. American Forest & Paper Association, Washington, DC, September 2009.
133 USITC (2002). Table 2. US Annual Wood-Pulping Capacity by Region, 2000, Industry & Trade
Summary, Wood Pulp and Waste Paper, Office of Industries, US International Trade Commission, Washington, DC. USITC Publication 3490, February 2002. Original Source of data quoted as: 2000
Lockwood-Post Directory, San Francisco, Miller Freeman, Inc. 1999. Pp. 37-152. 134 Bowyer J, Briggs D, Lippke B, Perez-Garcia J, Wilson J (2004). Life Cycle Environmental
Performance of Renewable Materials in Context of Residential Building Construction: Phase I
Research Report. Consortium for Research on Renewable Industrial Materials, CORRIM Inc. Seattle,
WA. Report modules accessed at: http://www.corrim.org/pubs/reports/2005/Phase1/index.asp. 135 Lippke B, Wilson J, Johnson L, Puettmann M (2009). Phase II Research Report. Life Cycle
Environmental Performance of Renewable Materials in the Context of Building Construction.
Consortium for Research on Renewable Industrial Materials, CORRIM Inc. Seattle, WA. Report
modules accessed at: http://www.corrim.org/pubs/index.asp.
Chapter 3. Life Cycle Inventory
CLIENTS\ACC\KC182695 04.18.18 4103.00.001
109
from four US forestry regions: the South East, the Pacific North West, the Inland North
West, and the North East-North Central areas.
Franklin Associates uses LCI data compiled for the Environmental Defense Fund (EDF)
‘Paper Calculator’ (now maintained by the Environmental Paper Network, EPN) to reflect
the composition of bleaching chemicals for pulp inputs. Elemental chlorine gas was banned
for use in pulp bleaching by the US Environmental Protection Agency (EPA) in the 1990s
Pulp and Paper Cluster Rules and the EDF data indicate that the average bleaching methods
used are elemental chlorine free (ECF) and use chlorine dioxide (D) and oxygen (O) as the
bleaching agents. These agents work in oxidation reactions that break apart the lignin
molecules that would otherwise lead to emissions such as dioxin and other chlorinated
organics, leaving only water-soluble organic compounds and/or chloride salts.
Wood energy of material resources (EMR) differentiates the energy of wood used as
material input to the paper, paperboard, and/or corrugated product (e.g., virgin pulpwood)
from the energy of wood that is expended (e.g., hogfuel used at production). The total
energy value of the wood input to the mills was calculated by multiplying the quantity of
wood inputs by its higher heating value (HHV). The HHV assumed in this analysis, based
on information from the US EPA, was 9,000,000 Btu per tonne or 10.5 MJ per kilogram
of greenwood assuming average moisture content of 50 percent.136 The portion of the wood
energy considered EMR was determined based on the amount of input wood fiber that ends
up in the output paper and paperboard; the remainder of the wood input is assumed to be
converted to process energy at the mill, e.g., through combustion of bark and other wood
wastes as well as combustion of black liquor containing lignin from the pulping process.
The CORRIM forestry LCI data used to model production of virgin fiber inputs for paper,
paperboard, and corrugate material indicate a carbon sequestration credit at the forest.
Franklin Associates’ has removed these credits for the modeling of the paper, paperboard,
and corrugated materials. Franklin Associates’ methodology for carbon balance of forestry
and agricultural products is to reflect carbon storage specific to the lifespan of the product
and carbon sequestration specific to the composition of the product incorporating the
biomass-derived materials. Carbon storage/sequestration in a product is considered only
when the carbon in the bio-component of the fiber-based product is not biodegradable
and/or is not re-emitted to the atmosphere within the 100-year assessment period. For
example, carbon storage is considered to occur in the production phase of corrugated
materials due to the average level of retention of recovered fiber in these products (i.e., the
technosphere). This storage is reflected by considering the carbon portion of recovered
fiber—46 percent—multiplied by the average amount of recovered fiber material that is
incorporated into the production of a fiber corrugated materials (i.e., average recycled
content of fiber corrugated liner and medium per the CPA LCI—41.8 percent). The
recovered fiber in corrugated materials is assigned a carbon dioxide storage credit
according to the carbon dioxide-to-carbon mass ratio—44 to 12—because it is retained in
the technosphere and not released in the assessment period (i.e., closed-loop recycled into
the fiber corrugated material system). In modeling corrugate materials, the portion of
136 AP-42 Emission Factors. External Combustion Sources. Section 1.6 - Wood Residues Combustion in
Boilers. Supplement G, 2001.

Chapter 3. Life Cycle Inventory
CLIENTS\ACC\KC182695 04.18.18 4103.00.001
110
carbon in fiber that leaves the corrugated product system and cascades to other fiber–based
product systems (e.g., paperboard) receives neither carbon dioxide credits nor burdens.
3.4.4.2. Paper & Paperboard Production
LCI data for the production of virgin and recycled paper and paperboard used in this model
was originally developed by Franklin Associates for the final version of the new Full Paper
Calculator Model submitted to Environmental Paper Network (EPN).137 Where applicable,
paper and/or paperboard coatings contain kaolin clay, titanium dioxide, and various binders
and extenders. According to the Carton Council138, polyethylene coatings are used on
refrigerated cartons for beverages such as milk and juice, with an average carton
composition of 20% polyethylene and 80% bleached paperboard. The average composition
of aseptic cartons, used for various beverages, soups, etc., is 74% paperboard, 4%
aluminum, and 22% polyethylene, also according to the Carton Council.
Carton converting data is based on primary data from Franklin Associates’ private LCI
Database. Carton converting processes include cutting the laminated and printed
boardstock into carton blanks and forming the bottom seal. The folded blanks are then
shipped to the filling location.
3.4.4.3. Corrugated Material Production
Foreground data for average North American corrugated materials are adapted from a gate-
to-gate peer-reviewed life cycle inventory of converted corrugated boxes conducted for the
Corrugated Packaging Alliance (CPA) in 2014.139 LCI data for containerboard liner and
medium are based on information gathered from 46 mills representing 78 percent of overall
US production in 2010. LCI data for box conversion are based on data from 173 converting
facilities representing nearly 30 percent of overall US production in 2010. The CPA study
indicates the presence of bleached pulp inputs to average corrugated materials. Franklin
Associates estimates that about ten percent of pulp inputs to the containerboard mill are
bleached pulp based on US exports of corrugated liner board in 2006.140
At the containerboard mills, the raw virgin and recovered materials are cooked in a digester
with pulping chemicals to produce wood pulp and liquor. The pulp is removed and refined
n a series of screening and washing steps for the containerboard machine, while the spent
liquor can be recycled as fuel for the digester. At the containerboard machine, the final
pulp slurry is spread out to drain and then fed through a series of drying rollers and refined
with the desired starch, chemical additives, and/or coatings/
137 Environmental Paper Network. Paper Calculator. (See: http://www.papercalculator.org/). 138 http://www.recyclecartons.com/why-juice-box-milk-carton-recycling-matter/#text-20 139 NCASI (2014). Life Cycle Assessment of U.S. Average Corrugated Product, Final Report. Prepared
for the Corrugated Packaging Alliance (CPA), a joint venture of the American Forest & Paper
Association (AF&PA), the Fibre Box Association (FBA), the Association of Independent Corrugated
Converters (AICC), and TAPPI. April 24, 2014. 140 United States International Trade Commission, US Domestic Exports Annual Data for 2006.

Chapter 3. Life Cycle Inventory
CLIENTS\ACC\KC182695 04.18.18 4103.00.001
111
The rolls of containerboard produced at the mill are shipped to converting plants, where
they are processed and converted into corrugated products. The containerboard medium is
heated and steam–treated to soften the material and then drawn between gear-like cylinders
to give it shape. Starch is applied and the flutes are glued to liners in layers. The corrugated
product is dried, cut, and converted to box sheet which is stacked on pallets for shipping.
3.4.4.4. Molded Pulp Production
Molded pulp packaging items are typically made from old newspaper (ONP) and/or fiber
from recovered corrugated material, i.e. old corrugated cardboard (OCC). These recovered
fiber materials are pulped, formed, and dried to produce containers, packaging shapes,
cartons, and trays.
3.4.5. Cork, Rubber, Textile, Wood, and Cellophane Packaging
3.4.5.1. Cork Production
Data for the production of raw cork is from the ecoinvent v.2.0 LCI database.141 Cork is
extracted from wild cork oak trees. It is primarily produced in the Mediterranean and in
Northern Africa. No chemical products are used for the cultivation or stripping, i.e.,
harvesting steps. For use in beverage container applications, cork planks must be seasoned
or boiled to remove organic solids and render the correct moisture content in the cork
material. Once the cork planks are seasoned, they may be punched with molding cylinders
and the resulting stoppers are washed in hydrogen peroxide and dried.142 Per the
incorporation of the ecoinvent data, cork production in this analysis includes the decadal,
manual harvesting of cork and motor-manual thinning and final cutting of the trees.
Transport for harvesting and thinning processes are also included. German and Portuguese
forestry processes are used as a proxy to represent European cork production.
3.4.5.2. Rubber Production
Data for the production of rubber in North America is based on the process of natural rubber
production from Franklin Associates’ Private LCI Database.
3.4.5.3. Textile Production
Data for the production of cotton in North America are based on cotton cultivation and
harvesting processes as available in the US LCI Database. The data reflects seed
production, tillage, fertilizer and pesticide application, crop residue management,
irrigation, and harvesting. The process is representative of cotton production in the US for
141 Ecoinvent Centre (2007). Ecoinvent data v.2.0 Final reports ecoinvent 2000. No. 1-15. Swiss Centre
for Life Cycle Inventories, Dubendorf, 2007, retrieved from: www.ecoinvent.ch. 142 PwC/Ecobilan (2008). Evaluation of the Environmental Impacts of Cork Stoppers versus Aluminum
and Plastic Closures: Analysis of the Life Cycle of Cork, Aluminium and Plastic Wine Closures,
Report Prepared for Corticeira Amorim, SGPS, SA by PricewaterhouseCoopers/ECOBILAN, October
2008.

Chapter 3. Life Cycle Inventory
CLIENTS\ACC\KC182695 04.18.18 4103.00.001
112
the data years 1998 to 2000. The impacts of producing a kilogram of seed are assumed
equivalent to producing a kilogram of lint.
Data for textile fabrication from cotton are adapted to the North American context from
the ecoinvent v.2.0 LCI Database. These processes reflect carding, spinning, and
mechanical cleaning of cotton yarn as well as the weaving of cotton yarn into textile.
3.4.5.4. Wood Production
The LCI data for producing the dried lumber used in plastic packaging substitutes are
represented by updated forestry LCI data from CORRIM Phase I and Phase II reports.143,144
The updated CORRIM LCI data include seeding, cultivation, and harvesting of lumber
from four US forestry regions: the South East, the Pacific North West, the Inland North
West, and the North East-North Central areas. Wood packaging material substitutes only
apply to rigid intermediate bulk containers (RIBCs) projected to be replaced by wooden
IBCs. Data for the conversion of dried lumber and particle board into wood pallets from
Franklin Associates’ Private LCI Database are used as a proxy for the production of
wooden shipping crates.
3.4.5.5. Cellophane Production
Cellophane is produced from bleached wood pulp using a viscose process. After the pulp
slurry ages in caustic bath to open the cellulose crystallites, carbon disulfide is added to
form a thick viscose liquid. The viscose is filtered, spread into sheets, and de-aerated using
vacuum. The cellophane film is formed when the viscose is pushed through blades placed
in a weak sulfuric acid bath. After removal from the bath, the film is cleaned, bleached,
softened, and dried. It is then coated with solvents for waterproofing and heat sealing and
cut to order. Data for the production of cellophane in North America is based on Franklin
Associates’ Private LCI Database.
3.5. RECYCLING & END-OF-LIFE WASTE MANAGEMENT
3.5.1. Plastic Recycling
3.5.1.1. Plastic Packaging Recovery Rates
Recovery rates for plastic packaging are based on national statistics for individual resins in
various types of packaging applications. For the US, recovery rates are based on recovery
143 Bowyer J, Briggs D, Lippke B, Perez-Garcia J, Wilson J (2004). Life Cycle Environmental
Performance of Renewable Materials in Context of Residential Building Construction: Phase I
Research Report. Consortium for Research on Renewable Industrial Materials, CORRIM Inc. Seattle,
WA. Report modules accessed at: http://www.corrim.org/pubs/reports/2005/Phase1/index.asp. 144 Lippke B, Wilson J, Johnson L, Puettmann M (2009). Phase II Research Report. Life Cycle
Environmental Performance of Renewable Materials in the Context of Building Construction.
Consortium for Research on Renewable Industrial Materials, CORRIM Inc. Seattle, WA. Report
modules accessed at: http://www.corrim.org/pubs/index.asp.

Chapter 3. Life Cycle Inventory
CLIENTS\ACC\KC182695 04.18.18 4103.00.001
113
and generation statistics for plastic municipal solid waste (MSW) in the US.145 For the
Canadian geographic scope, recovery rates are calculations based on various national
statistics or reflect US rates as proxies if Canadian data were unavailable. Tables with
recovery rates for plastic and substitute packaging in the US and Canada are presented at
the end of Section 3.5.1. Zeroes in the tables either mean that the recovery rate is zero or
that there is no recovery because there is no packaging of that type in that category to be
recovered. The life cycle models take into account the losses that occur during reprocessing
of the recovered material, so that recycling credits are given only for the net amount of
useful secondary material produced from the recovered material.
US Plastic Recovery Rates:
• Beverage Containers, Bottles and Jars: The MSW data indicates that recovery rates
specifically for HDPE, PP, and PET bottles/jars are 27.5, 8.33, and 29.2 percent,
respectively, and these rates are assumed for these resins in both beverage and non-
beverage packaging applications. As the bottle/jar category does not track any other
resins explicitly, Franklin Associates assumes recovery for any LDPE, PVC, and
PS beverage and non-beverage bottles and jars is negligible.
• Caps & Closures: The MSW table notes that PP caps and lids are recovered with
PET bottles/jars and included in that recovery estimate, so a 29.2 percent recovery
rate is applied to PP caps and closures used on PET bottles and jars. Franklin
Associates assumes the recovery rates indicated for HDPE, PP, and PS other plastic
packaging, 6.67, 1.80, and 5.88 percent, respectively, apply to these caps and
closures applications.
• Carrier Bags/Stretch & Shrink: The recovery rates indicated for LDPE and HDPE
bags/sacks/wraps, 17.6 and 4.35 percent, respectively, have been applied to both
carrier bags and stretch and shrink film product categories in this analysis.
• Other Rigid: Other plastic containers recovery rates are 19.3 and 8.33 percent, for
HDPE and PP respectively, and these rates are applied to these resins in all rigid
bulk container and non-bulk plastic tub, cup, and bowl applications with the
exception of PP tubs/cups/bowls with a rate of 5.25%, reflecting negligible
recovery rates for PP nondurable goods, plastic plates, and cups. The overall other
plastic packaging recovery rate of 16.4 percent is assumed for PET tubs/cups/bowls
as the MSW source data aggregates PET cups into this category. The MSW
recovery rates indicated for HDPE, PP, and PS/EPS other plastic packaging, 19.3,
8.33, and 5.88 percent, respectively, are assumed to apply to other non-bulk and
protective rigid packaging.
• Other Flexible: Recovery rates indicated for HDPE, PP, and PS other plastic
packaging, 6.67, 1.80, and 5.88 percent, respectively, apply to all other flexible
packaging (i.e., converted flexible packaging; protective flexible packaging; and
bulk flexible packaging). The recovery rate for PET strapping is assumed to be the
same as for PP strapping.
145 US EPA (2011). Table 7. Plastics in Products in MSW, 2010, Municipal Solid Waste Generation,
Recycling, and Disposal in the United States Detailed Tables and Figures for 2010. Compiled by
Franklin Associates, A Division of ERG.
Chapter 3. Life Cycle Inventory
CLIENTS\ACC\KC182695 04.18.18 4103.00.001
114
Canadian Plastic Recovery Rates:
• Beverage Containers, Bottles and Jars: The recovery rates applied — 25.7 and 58
percent for HDPE and PET beverage containers, respectively, and 21.7, 18.3, and
39.1 percent for HDPE, PP, and PET non-beverage bottles and jars, respectively,
with a higher PET recovery rate, 62 percent, for beer and soft drinks and a higher
HDPE recovery rate, 52.8 percent, for milk jugs — are calculated from total
recovered weight as a percent of total weight generated as reported by Canadian
provinces in EPIC 2004 and CM Consulting.146,147
• Caps & Closures: The recovery rates applied, 6.67, 1.80, and 5.88, percent for
HDPE, PP, and PS, respectively, are proxies from the US EPA MSW 2010 data;
for PET caps, the recovery rate is assumed to be equivalent to that calculated for
PET beverage containers, 62.0 percent, as these caps are commonly recovered with
their containers.
• Stretch & Shrink: The rates indicated for LDPE and HDPE bags/sacks/wraps, 17.6
and 4.35 percent, respectively, in the US EPA MSW 2010 data are used as proxies
for Canadian recovery of films in this analysis.
• Carrier Bags: The average of the recovery rates reported by CPIA for polyethylene
carrier bags in four provinces was 43.5 percent.148
• Other Rigid: Other plastic containers recovery rates, 19.3 and 8.33 percent, for
HDPE and PP respectively, from the US EPA MSW 2010 data are used as proxies
for recovery of the following packaging types in Canada: rigid bulk container and
non-bulk plastic bottle, jar, cup, and bowl applications. The overall other plastic
packaging recovery rate of 16.4 is assumed for PET tubs/cups/bowls as the US EPA
MSW 2010 source data aggregates PET cups into this category. The recovery rates
indicated for HDPE, PP, and PS/EPS other plastic packaging, 19.3, 8.33, and 5.88
percent, respectively, also in the US EPA MSW 2010 data, are used as proxies for
recovery of the following packaging types in Canada: other non-bulk and protective
rigid packaging.
• Other Flexible: Recovery rates indicated for HDPE, PP, and PS other plastic
packaging, 6.67, 1.80, and 5.88 percent, respectively, from US EPA MSW 2010
are used as proxies for recovery of the following plastic product applications in
Canada: converted flexible packaging; protective flexible packaging; and bulk
flexible packaging.
3.5.1.2. Plastic Packaging Recycling LCI
146 EPIC (2004). An Overview of Plastic Bottle Recycling in Canada, Prepared for Environment and
Plastics Industry Council (EPIC) by CM Consulting, Updated in 2004. 147 CM Consulting (2012). Who Pays What™: An Analysis of Beverage Container Collection and Costs
in Canada, Prepared by CM Consulting, August 2012. 148 Information on plastic bag recovery rates in Alberta, British Columbia, Nova Scotia, and Prince
Edward Island. Accessed at http://www.plastics.ca/Recycling/PlasticBags/ReuseRecycling/index.php
Chapter 3. Life Cycle Inventory
CLIENTS\ACC\KC182695 04.18.18 4103.00.001
115
Data for the recycling of plastic resins in North America are based on data compiled by
Franklin Associates and available through the US LCI Database.149 The steps for
production of postconsumer recycled resin are divided into three main stages: 1) Recovery:
Collection of postconsumer plastic; 2) Sorting and Separation: Sorting of plastics from
other co-collected recovered materials (such as paper, steel, and aluminum), and separating
mixed plastics into individual resins; and 3) Reclaimer Operations: Processing of the resin
by a reclaimer to convert the received material into clean resin ready to be converted into
a product.
Postconsumer products that are recovered for recycling are primarily packaging products,
including soft drink and milk bottles, other bottles and containers, and other packaging.
Collection of these materials occurs through residential curbside or drop-off programs,
deposit redemption systems, and commercial collection programs. Once the postconsumer
plastics have been collected, they must be separated from other co-collected materials and
plastics. Although some recovered plastic is separated by curbside sorting and the use of
separate bins at drop-off recycling centers, sorting and separation of plastics most
commonly takes place at material recovery facilities (MRFs). Sorting operations at MRFs
range from manual sorting of items on a conveyor to highly automated systems using
magnets, air classifiers, optical sorters, and other technologies to sort and separate mixed
incoming materials. Postconsumer plastics may be separated and baled as mixed plastics,
or the facility may have the capability to further sort down to individual resin bales.
Sorted post-consumer plastic is received at manufacturing facilities (e.g., as individual
resin bales) and must be disassembled and sorted to remove foreign material. A typical
processing sequence includes debaling, grinding, washing, drying, extruding and
pelletizing. All reclaimed flake is washed as part of the reclaimer processing operations.
Material may be washed before grinding, after grinding, or both. Though reclaimers may
use small amounts of various chemicals in the washing process, the amounts are assumed
equivalent to less than one percent of the weight of the material washed for this analysis.
Clean postconsumer resin is sold in pellet form or as resin flake.
3.5.2. Alternative Packaging Recycling
3.5.2.1. Steel Recovery Rates
The recovery rate for steel cans in the US is 67.0 percent as indicated in the US EPA 2010
MSW tables.150 Franklin Associates assumes this rate applies to all steel use in beverage
containers, non-beverage steel bottles and jars, and because they are ferro-magnetic, to
steel lids, caps, and closures as well. Per the US EPA MSW data, other steel packaging has
149 ACC/APR/NAPCOR/PETRA (2011). Life Cycle Inventory of 100% Postconsumer HDPE and PET
Recycled Resin from Postconsumer Containers and Packaging, Report prepared by Franklin
Associates, A Division of ERG for the Plastics Division of the American Chemistry Council (ACC),
the Association of Postconsumer Plastic Recyclers (APR), the National Association for PET Container
Resources (NAPCOR), and the PET Resin Association (PETRA), January 2011. 150 US EPA (2011). Table 7. Plastics in Products in MSW, 2010, Municipal Solid Waste Generation,
Recycling, and Disposal in the United States Detailed Tables and Figures for 2010. Compiled by
Franklin Associates, A Division of ERG.

Chapter 3. Life Cycle Inventory
CLIENTS\ACC\KC182695 04.18.18 4103.00.001
116
a 79.5 percent recovery rate. This rate is assumed to apply to all other steel packaging
including use of steel in bulk flexible strapping, rigid tubs/cups/bowls, other non-bulk rigid
packaging, and rigid bulk packaging.
The Canadian Steel Producers Association (CSPA) indicates that the recovery rate for steel
cans “stands in excess of 60 percent” in 2010.151 Also, the Steel Recycling Institute (SRI)
indicates that the recovery rate for steel cans is 67.1 percent for North America.152 As in
the US geographic scope, Franklin Associates applies a rate of 67.1 percent to recovery of
steel beverage containers, non-beverage steel bottles and jars, and to steel lids, caps, and
closures in Canada. Per cross-checking SRI with the US EPA MSW data, other steel
packaging has a 79.5 percent recovery rate.153 This rate is assumed to apply to all other
steel packaging including use of steel in bulk flexible strapping, rigid tubs/cups/bowls,
other non-bulk rigid packaging, and rigid bulk packaging in Canada.
3.5.2.2. Steel Packaging Recycling LCI
Data for steel recycling in North America are based on processes from Franklin Associates’
private LCI database. The recycling of metallic scrap as feed for steel furnaces has long
been an economically viable means of utilizing ferrous waste materials. In fact, one-half
of the metallic input to steel furnaces is in the form of scrap. Much of the scrap recovered
is generated within the mills themselves; thus, the energy requirements and emissions
associated with their recovery are included with normal iron and steel mill operations.
However, substantial quantities of scrap are transported to iron and steel mills from
external sources (including other mills at different sites).
In general, most metallic scrap undergoes similar processing prior to consumption. It is
usually manually or semi-manually handled to remove valuables (e.g., tin plating, copper
wire, chrome, etc.), and some contaminants (e.g., chemical impurities, organic materials).
Subsequent processing includes flattening, shredding, magnetic separation, and all
necessary transportation steps, including transport from the flattener to the shredder and
the transport of steel scrap from the shredder to the furnace.
An EAF may accept scrap not of a quality suitable for the BOF. Thus, packaging steel
scrap is modeled to be processed at an EAF furnace. The resulting secondary steel displaces
demand for the BOF steel processing.
The system expansion credit for the recycled steel can and bulk packaging materials such
as drums and strapping are based on the difference between the postconsumer recycled
content of the steel packaging and the postconsumer recycling rate. The postconsumer
content of the BOF steel used to make the steel packaging is approximately 35 percent;
79.5, and 67.0 percent of the bulk steel packaging (e.g., strapping, drums) and steel cans,
151 CSPA (2013). Steel Facts, Recycling, Canadian Steel Producers Association. Available at:
http://canadiansteel.ca/steel-facts/#recycling. 152 SRI (2013). Steel Can and Overall Steel Recycling Rate, Steel Recycling Institute, a unit of the
American Iron and Steel Institute (AISI). Available at: http://www.recycle-steel.org/. 153 SRI (2013). Ibid.
Chapter 3. Life Cycle Inventory
CLIENTS\ACC\KC182695 04.18.18 4103.00.001
117
respectively, are recycled at end of life. Since the amount of recycled steel produced from
the steel packaging is greater than the amount of recycled steel used to make either bulk
packaging or steel cans, the steel packaging systems are both net producer of recycled steel.
The steel packaging recovery which is in excess of the recycled content of the steel
packaging is assumed to be processed in an EAF furnace and is given credit for displacing
the corresponding amount of BOF steel production.
3.5.2.3. Aluminum Recovery Rates
The recovery rate for aluminum beer and soft drink cans in the US, not including import
of used beverage containers (UBCs), is 49.6 percent as indicated in the US EPA 2010 MSW
tables.154 This recovery rate is applied to aluminum beverage cans and non-beverage
aluminum bottles and jars. This rate is lower than the 58.1 or 65.1 percent indicated for the
2010 and 2011 data years, respectively, by Aluminum Association, the Can Manufacturers
Institute (CMI), and the Institute of Scrap Recycling Industries (ISRI); however, the higher
rates do include the import of UBCs from Mexico, Canada, and other countries. Per the US
EPA MSW data, the overall aluminum packaging recovery rate is 19.9 percent. This rate
is applied to other rigid non-bulk aluminum packaging, including use of aluminum in rigid
tubs/cups/bowls; however, aluminum foil and aluminum materials used in caps and
closures are assumed to have a zero recovery rate in the substitution model.
Recovery rates applied to aluminum containers, bottles, and jars in Canada are as calculated
from a case study of container recovery in the Canadian provinces. Franklin Associates
weights the recovery rates reported for each province by the province population to obtain
a Canadian overall high (for beer and soft drink cans) and low beverage can recovery rate
of 75.0 and 73.0 percent, respectively.155 For the remaining aluminum packaging
categories, the same recovery rates are used for Canada as for corresponding packaging
types in the US.
3.5.2.4. Aluminum Packaging Recycling LCI
Aluminum recycling processes in North America are based on data from the Aluminum
Association 2010 LCA on aluminum cans. This data source indicates an average aluminum
can recycled content of 67.8 percent. Because the average US recovery rate for aluminum
cans is lower than the average recycled content of the cans, US aluminum can recovery
does not supply enough secondary aluminum to sustain its recycled content, so there is no
net system expansion credit. Instead, the can system is assigned burdens for the amount of
virgin material required to make up the excess share of the secondary aluminum supply
that is used for can production. In Canada, however, the recovery rates for aluminum cans
are higher than the average recycled content, so the excess amount of Canadian aluminum
cans recovered receives some credit for displacing virgin aluminum. All aluminum foil
154 US EPA (2011). Table 6. Metal Products in MSW, 2010, Municipal Solid Waste Generation,
Recycling, and Disposal in the United States Detailed Tables and Figures for 2010. Compiled by
Franklin Associates, A Division of ERG. 155 CM Consulting (2012). Who Pays What™: An Analysis of Beverage Container Collection and Costs
in Canada, Prepared by CM Consulting, August 2012.
Chapter 3. Life Cycle Inventory
CLIENTS\ACC\KC182695 04.18.18 4103.00.001
118
materials are modeled as virgin products disposed after use, and receive no system
expansion credits or penalties.
3.5.2.5. Glass Recovery Rates
The recovery rate for glass beer and soft drink containers in the US is 41.4 percent as
indicated in the US EPA 2010 MSW tables.156 However, the data indicate different
recovery rates for glass wine and liquor containers and glass other bottles and jars in the
US, 24.7 and 18.1 percent, respectively.157 Franklin Associates applies the rate for glass
other bottles and jars to both beverage and non-beverage glass containers other than those
explicitly indicated for beer, soft drinks, wine, and liquor.
Recovery rates applied to glass bottles and jars in Canada are as calculated from a case
study of container recovery in the Canadian provinces. Franklin Associates weights the
recovery rates reported for each province by the province population to obtain a Canadian
overall high (for beer, soft drink, wine, and liquor containers) and low glass beverage
container recovery rate of 83.0 and 80.0 percent, respectively.158 The lower recovery rate
is also applied to non-beverage glass containers.
3.5.2.6. Glass Containers Recycling LCI
Glass recycling processes in North America are based on data from Franklin Associates’
private LCI database. Postconsumer glass containers are typically recovered in municipal
recycling programs. Consumers leave used containers either at drop-off sites or at the curb
for curbside pickup. Postconsumer glass is typically sorted by color and then crushed into
“cullet”159 in order to densify it for more economical transportation to glass plants.
Theoretically, a glass plant can produce new containers entirely from cullet; however, no
plants currently operate at this level. Postconsumer cullet must be recovered, sorted, and
crushed before it is added to the virgin material. Substantial amounts of postconsumer
cullet can be used if it meets the standards for purity and color. Although cullet
specifications vary by company, the industry uses the ASTM standards as a basis. The
ASTM requirements do allow some color mixing; however, glass plants typically request
color separation of incoming cullet. This allows the glass plant to control the level of color
mixing. Many glass plants are now investing in expensive front-end beneficiation systems
which remove contaminants from postconsumer containers and provide the plant with
furnace-ready cullet. As more glass plants incorporate this capability, processing problems
for recyclers of glass will be slightly alleviated, and an increase in material processing may
be observed.
156 US EPA (2011). Table 5. Glass Products in MSW, 2010, Municipal Solid Waste Generation,
Recycling, and Disposal in the United States Detailed Tables and Figures for 2010. Compiled by
Franklin Associates, A Division of ERG. 157 US EPA (2011). Ibid. 158 CM Consulting (2012). Who Pays What™: An Analysis of Beverage Container Collection and Costs
in Canada, Prepared by CM Consulting, August 2012. 159 Cullet is imperfect articles of glass, trim, or other glass pieces that are melted and used in new glass
products.

Chapter 3. Life Cycle Inventory
CLIENTS\ACC\KC182695 04.18.18 4103.00.001
119
Cullet is added to a glass furnace along with the virgin inputs to a conventional batch
operation. The composition of glass varies by type. For instance, container glass (used for
food and beverage containers) has a different composition from plate or flat window glass.
Therefore, only compatible cullet may be used in a furnace. Typical losses from the
recovery system are 10 percent of the material recovered. The average glass containers in
this study are made with inputs of 27 percent postconsumer cullet and an average recycled
content of 25 percent.
All Canadian glass containers have a recovery rate that exceeds the average glass container
recycled content and thus receives credit for virgin glass displacement. In the US, the
recovery rate for beer and soft drink bottles is higher than the 25 percent recycled content
and receives virgin displacement credit, while glass wine and liquor bottles have a recovery
rate that is essentially equivalent to their recycled content (no credit or penalty), and other
glass containers have a recovery rate that is lower than the amount needed to sustain their
recycled content and thus are assigned some virgin material burdens to make up the deficit.
3.5.2.7. Paper & Paperboard Recovery Rates
The US MSW recovery rate for the category paper containers and packaging excluding
corrugated boxes includes gable top cartons, folding cartons, bags, sacks, and other
paperboard packaging; this rate in the US is 25.0 percent as indicated in the US EPA 2010
MSW tables.160 However, the rate assumed for aseptic cartons, 6.5 percent recovery, is per
previous public and private LCA case studies performed by Franklin Associates. Franklin
Associates applies the MSW rate of 25 percent to all paper packaging categories except
beverage cartons, flexible food packaging, and non-bulk rigid bottles and jars; for these
categories, the aseptic carton recovery rate is applied.
Recovery rates applied to paper and paperboard packaging in Canada are calculated from
a case study of container recovery in the Canadian provinces. Franklin Associates weighted
the recovery rates reported for each province by the province population to obtain Canadian
overall high and low paperboard beverage container recovery rate of 42.3 and 30.7 percent,
respectively.161 The higher recovery rate is applied to paperboard-based containers for
wine, while the lower recovery rate is applied to paperboard-based containers for other
non-carbonated and non-alcoholic beverages as well as converted flexible paper-based
packaging and paper substitutes for non-beverage bottles and jars. The overall paper
packaging recovery rate indicated by the Paper Recycling Association (PRA) for Canada
is 49.1 percent, and this rate is applied to flexible protective packaging, bulk flexible
shipping sacks, liners, and rolls.162
160 US EPA (2011). Table 4. Paper and Paperboard Products in MSW, 2010, Municipal Solid Waste
Generation, Recycling, and Disposal in the United States Detailed Tables and Figures for 2010.
Compiled by Franklin Associates, A Division of ERG. 161 CM Consulting (2012). Who Pays What™: An Analysis of Beverage Container Collection and Costs
in Canada, Prepared by CM Consulting, August 2012. 162 PRA (2006). Paper Recycling Association: Overview of the Recycling Industry, Updated September
18, 2007. Available at: http://www.pppc.org/en/2_0/2_4.html.

Chapter 3. Life Cycle Inventory
CLIENTS\ACC\KC182695 04.18.18 4103.00.001
120
3.5.2.8. Paper & Paperboard Recycling LCI
Processes for collection and re-pulping postconsumer paper and paperboard in North
America are based on data from Franklin Associates’ private LCI database. Recovered
fibers must be sorted, de-contaminated, and cleaned mechanically before being processed.
As a default, average paperboard is modeled to be 50 percent virgin fiber and 50 percent
recycled fiber based on Franklin Associates’ experience with paperboard recycled content
in LCA case studies.
Coated or laminated paperboard carton packaging is repulped in a hydropulping process,
in which the coating materials are separated from the paper fiber. For recycling of
paperboard cartons, it was assumed that 85% of the fiber content was recovered. The
recovered fiber was credited with displacing an equivalent quantity of virgin bleached pulp.
The recovered coatings were assumed to be burned for energy recovery, and a credit was
given for displacing the amount of boiler fuel that would provide the equivalent energy
value.
3.5.2.9. Corrugated Packaging Recovery Rates
The recovery rate for corrugated boxes in the US is 85.0 percent as indicated in the US
EPA 2010 MSW tables.163 Franklin Associates applies the MSW rate to all corrugated
packaging modeled to substitute for plastic packaging in the US (i.e., bulk boxes).
Recovery rates applied to corrugated boxes in Canada are 82.0 percent per the Paper &
Paperboard Packaging Environmental Council (PPEC).164
3.5.2.10. Corrugated Packaging Recycling LCI
Collection and sorting of corrugate materials in North America are based on data from
Franklin Associates Private LCI Database; whereas, re-processing recovered fiber in North
America is based on the CPA 2010 LCA for containerboard mills in the US. Franklin
Associates accounts for the burdens associated with the collection and processing of
postconsumer corrugated material. Energy requirements for the collection of old
corrugated cardboard (OCC) in the US are from Franklin Associates’ private database.
Recovered fibers must be sorted, de-contaminated, and cleaned mechanically before being
processed, and these requirements are reflected in the data for production of corrugated
liner and medium.
163 US EPA (2011). Table 4. Paper and Paperboard Products in MSW, 2010, Municipal Solid Waste
Generation, Recycling, and Disposal in the United States Detailed Tables and Figures for 2010.
Compiled by Franklin Associates, A Division of ERG. 164 PPEC (2011). Paper Recycling Rates, PPEC Factsheet 21-2011, Paper & Paperboard Packaging
Environmental Council (PPEC). Available at: http://www.ppec-
paper.com/pdfFiles/factsheets/factsheet21-2011.pdf.

Chapter 3. Life Cycle Inventory
CLIENTS\ACC\KC182695 04.18.18 4103.00.001
121
According to the CPA report, the average postconsumer content of North American
corrugated containers is 41.8 percent. The corrugated recovery rate in both US and Canada
is higher than the recycled content, so corrugated packaging systems receive material
displacement credit. However, the end use paper grades that utilize open-loop recycled
corrugated are composed of about half virgin and half secondary fiber, so virgin fiber
displacement credit is only assigned to the amount of excess recycled corrugated that
displaces virgin fiber.
3.5.2.11. Cork, Rubber, & Textile Recovery Rates & Recycling LCI
The recovery rate for non-durable rubber and leather goods is 15 percent of generation in
the US as indicated in the US EPA 2010 MSW tables.165 Recycling rates for cork and
natural rubber are assumed to be negligible as in a recent LCA case study on beverage
container closures.166 There is also assumed to be negligible recycling of textile materials
modeled to substitute for plastic packaging. Because use of these materials as substitutes
for plastic packaging is very low, assumptions about recycling of these materials will not
significantly affect overall results.
165 US EPA (2011). Table 8. Rubber and Leather Products in MSW, 2010, Municipal Solid Waste
Generation, Recycling, and Disposal in the United States Detailed Tables and Figures for 2010.
Compiled by Franklin Associates, A Division of ERG. 166 PwC/Ecobilan (2008). Evaluation of the Environmental Impacts of Cork Stoppers versus Aluminum
and Plastic Closures: Analysis of the Life Cycle of Cork, Aluminum and Plastic Wine Closures, Report
Prepared for Corticeira Amorim, SGPS, SA by PricewaterhouseCoopers/ECOBILAN, October 2008.
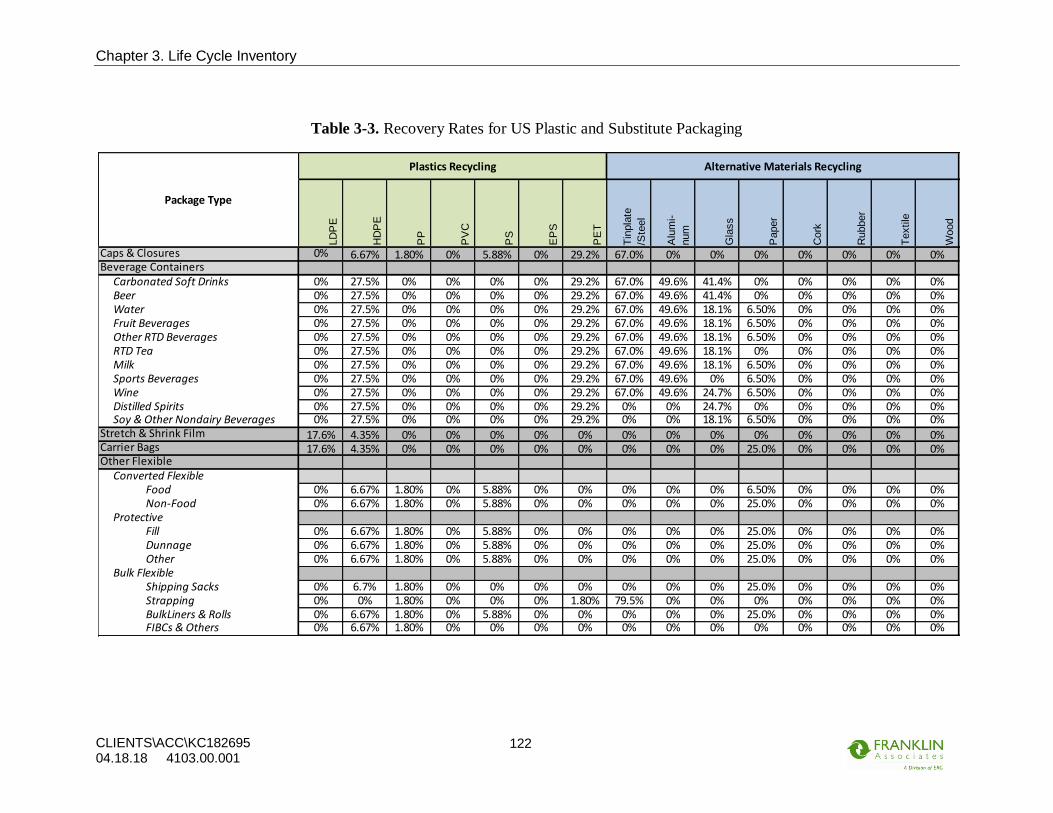
Chapter 3. Life Cycle Inventory
CLIENTS\ACC\KC182695 04.18.18 4103.00.001
122
Table 3-3. Recovery Rates for US Plastic and Substitute Packaging
LD
PE
HD
PE
PP
PV
C
PS
EP
S
PE
T
Tin
pla
te
/Ste
el
Alu
mi-
num
Gla
ss
Paper
Cork
Rubber
Textile
Wood
Caps & Closures 0% 6.67% 1.80% 0% 5.88% 0% 29.2% 67.0% 0% 0% 0% 0% 0% 0% 0%Beverage Containers
Carbonated Soft Drinks 0% 27.5% 0% 0% 0% 0% 29.2% 67.0% 49.6% 41.4% 0% 0% 0% 0% 0%Beer 0% 27.5% 0% 0% 0% 0% 29.2% 67.0% 49.6% 41.4% 0% 0% 0% 0% 0%Water 0% 27.5% 0% 0% 0% 0% 29.2% 67.0% 49.6% 18.1% 6.50% 0% 0% 0% 0%Fruit Beverages 0% 27.5% 0% 0% 0% 0% 29.2% 67.0% 49.6% 18.1% 6.50% 0% 0% 0% 0%Other RTD Beverages 0% 27.5% 0% 0% 0% 0% 29.2% 67.0% 49.6% 18.1% 6.50% 0% 0% 0% 0%RTD Tea 0% 27.5% 0% 0% 0% 0% 29.2% 67.0% 49.6% 18.1% 0% 0% 0% 0% 0%Milk 0% 27.5% 0% 0% 0% 0% 29.2% 67.0% 49.6% 18.1% 6.50% 0% 0% 0% 0%Sports Beverages 0% 27.5% 0% 0% 0% 0% 29.2% 67.0% 49.6% 0% 6.50% 0% 0% 0% 0%Wine 0% 27.5% 0% 0% 0% 0% 29.2% 67.0% 49.6% 24.7% 6.50% 0% 0% 0% 0%Distilled Spirits 0% 27.5% 0% 0% 0% 0% 29.2% 0% 0% 24.7% 0% 0% 0% 0% 0%Soy & Other Nondairy Beverages 0% 27.5% 0% 0% 0% 0% 29.2% 0% 0% 18.1% 6.50% 0% 0% 0% 0%
Stretch & Shrink Film 17.6% 4.35% 0% 0% 0% 0% 0% 0% 0% 0% 0% 0% 0% 0% 0%Carrier Bags 17.6% 4.35% 0% 0% 0% 0% 0% 0% 0% 0% 25.0% 0% 0% 0% 0%Other Flexible
Converted FlexibleFood 0% 6.67% 1.80% 0% 5.88% 0% 0% 0% 0% 0% 6.50% 0% 0% 0% 0%Non-Food 0% 6.67% 1.80% 0% 5.88% 0% 0% 0% 0% 0% 25.0% 0% 0% 0% 0%
Protective Fill 0% 6.67% 1.80% 0% 5.88% 0% 0% 0% 0% 0% 25.0% 0% 0% 0% 0%Dunnage 0% 6.67% 1.80% 0% 5.88% 0% 0% 0% 0% 0% 25.0% 0% 0% 0% 0%Other 0% 6.67% 1.80% 0% 5.88% 0% 0% 0% 0% 0% 25.0% 0% 0% 0% 0%
Bulk FlexibleShipping Sacks 0% 6.7% 1.80% 0% 0% 0% 0% 0% 0% 0% 25.0% 0% 0% 0% 0%Strapping 0% 0% 1.80% 0% 0% 0% 1.80% 79.5% 0% 0% 0% 0% 0% 0% 0%BulkLiners & Rolls 0% 6.67% 1.80% 0% 5.88% 0% 0% 0% 0% 0% 25.0% 0% 0% 0% 0%FIBCs & Others 0% 6.67% 1.80% 0% 0% 0% 0% 0% 0% 0% 0% 0% 0% 0% 0%
Package Type
Plastics Recycling Alternative Materials Recycling
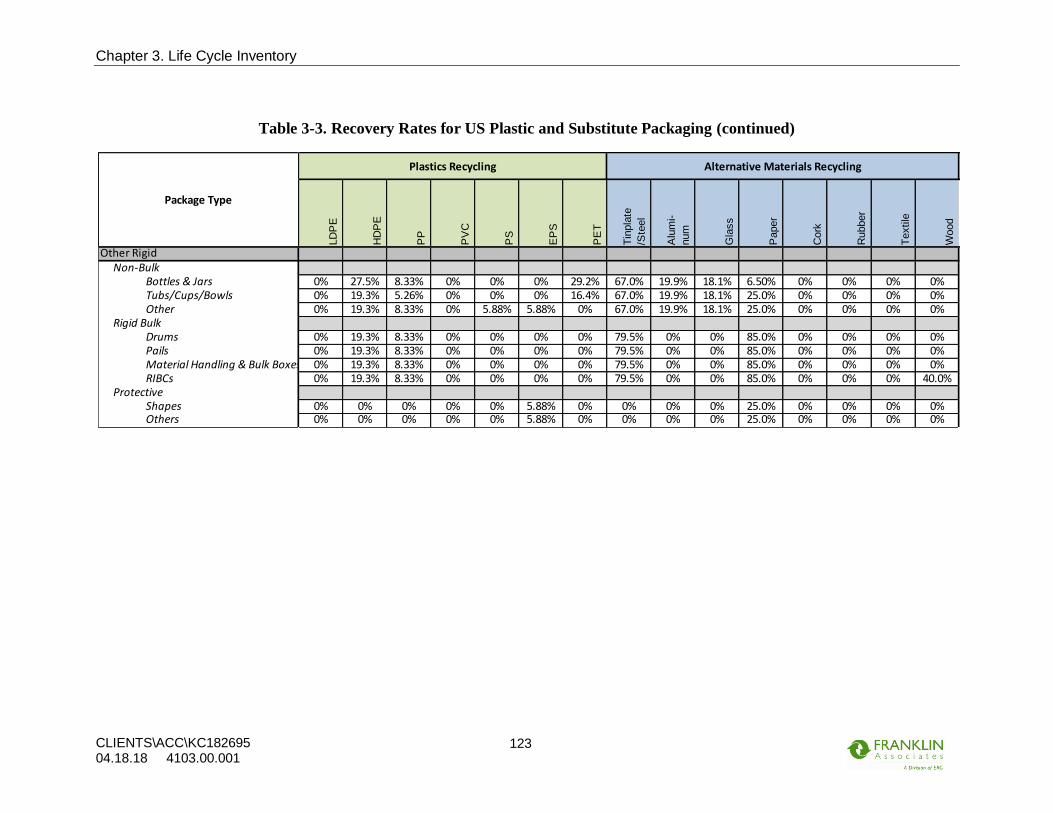
Chapter 3. Life Cycle Inventory
CLIENTS\ACC\KC182695 04.18.18 4103.00.001
123
Table 3-3. Recovery Rates for US Plastic and Substitute Packaging (continued)
LD
PE
HD
PE
PP
PV
C
PS
EP
S
PE
T
Tin
pla
te
/Ste
el
Alu
mi-
num
Gla
ss
Paper
Cork
Rubber
Textile
Wood
Other RigidNon-Bulk
Bottles & Jars 0% 27.5% 8.33% 0% 0% 0% 29.2% 67.0% 19.9% 18.1% 6.50% 0% 0% 0% 0%Tubs/Cups/Bowls 0% 19.3% 5.26% 0% 0% 0% 16.4% 67.0% 19.9% 18.1% 25.0% 0% 0% 0% 0%Other 0% 19.3% 8.33% 0% 5.88% 5.88% 0% 67.0% 19.9% 18.1% 25.0% 0% 0% 0% 0%
Rigid BulkDrums 0% 19.3% 8.33% 0% 0% 0% 0% 79.5% 0% 0% 85.0% 0% 0% 0% 0%Pails 0% 19.3% 8.33% 0% 0% 0% 0% 79.5% 0% 0% 85.0% 0% 0% 0% 0%Material Handling & Bulk Boxes 0% 19.3% 8.33% 0% 0% 0% 0% 79.5% 0% 0% 85.0% 0% 0% 0% 0%RIBCs 0% 19.3% 8.33% 0% 0% 0% 0% 79.5% 0% 0% 85.0% 0% 0% 0% 40.0%
Protective Shapes 0% 0% 0% 0% 0% 5.88% 0% 0% 0% 0% 25.0% 0% 0% 0% 0%Others 0% 0% 0% 0% 0% 5.88% 0% 0% 0% 0% 25.0% 0% 0% 0% 0%
Package Type
Plastics Recycling Alternative Materials Recycling
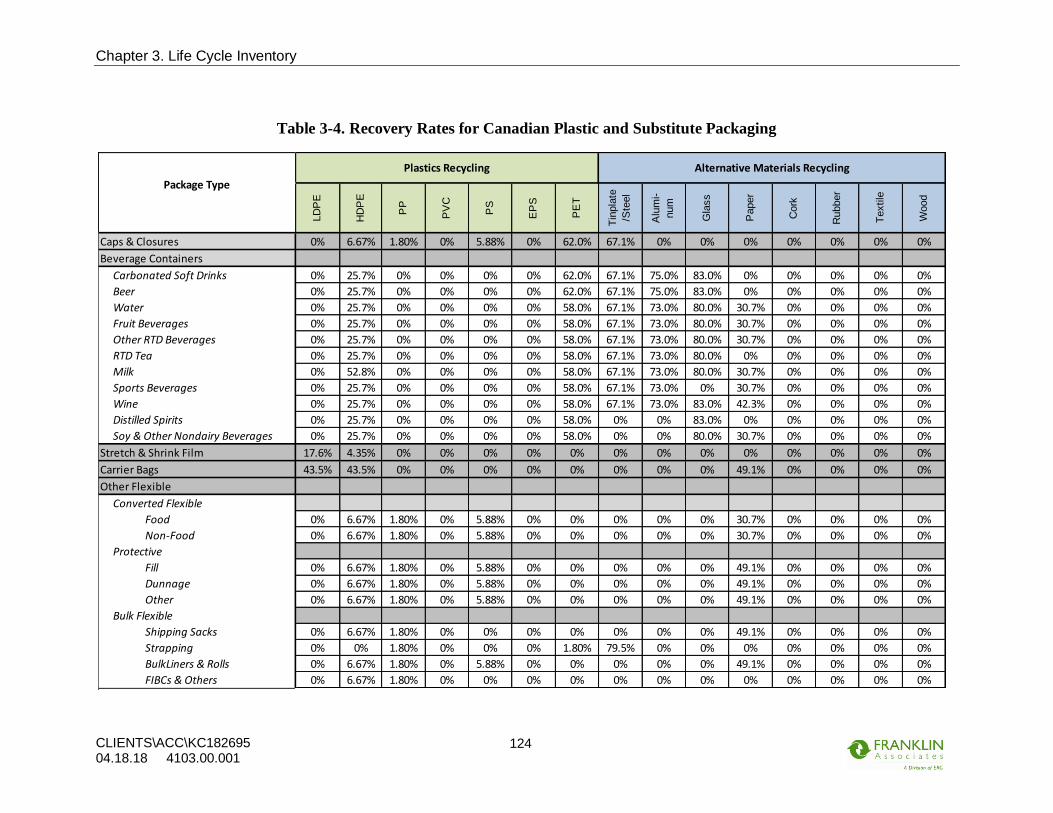
Chapter 3. Life Cycle Inventory
CLIENTS\ACC\KC182695 04.18.18 4103.00.001
124
Table 3-4. Recovery Rates for Canadian Plastic and Substitute Packaging
LD
PE
HD
PE
PP
PV
C
PS
EP
S
PE
T
Tin
pla
te
/Ste
el
Alu
mi-
num
Gla
ss
Paper
Cork
Rubber
Textile
Wood
Caps & Closures 0% 6.67% 1.80% 0% 5.88% 0% 62.0% 67.1% 0% 0% 0% 0% 0% 0% 0%
Beverage Containers
Carbonated Soft Drinks 0% 25.7% 0% 0% 0% 0% 62.0% 67.1% 75.0% 83.0% 0% 0% 0% 0% 0%
Beer 0% 25.7% 0% 0% 0% 0% 62.0% 67.1% 75.0% 83.0% 0% 0% 0% 0% 0%
Water 0% 25.7% 0% 0% 0% 0% 58.0% 67.1% 73.0% 80.0% 30.7% 0% 0% 0% 0%
Fruit Beverages 0% 25.7% 0% 0% 0% 0% 58.0% 67.1% 73.0% 80.0% 30.7% 0% 0% 0% 0%
Other RTD Beverages 0% 25.7% 0% 0% 0% 0% 58.0% 67.1% 73.0% 80.0% 30.7% 0% 0% 0% 0%
RTD Tea 0% 25.7% 0% 0% 0% 0% 58.0% 67.1% 73.0% 80.0% 0% 0% 0% 0% 0%
Milk 0% 52.8% 0% 0% 0% 0% 58.0% 67.1% 73.0% 80.0% 30.7% 0% 0% 0% 0%
Sports Beverages 0% 25.7% 0% 0% 0% 0% 58.0% 67.1% 73.0% 0% 30.7% 0% 0% 0% 0%
Wine 0% 25.7% 0% 0% 0% 0% 58.0% 67.1% 73.0% 83.0% 42.3% 0% 0% 0% 0%
Distilled Spirits 0% 25.7% 0% 0% 0% 0% 58.0% 0% 0% 83.0% 0% 0% 0% 0% 0%
Soy & Other Nondairy Beverages 0% 25.7% 0% 0% 0% 0% 58.0% 0% 0% 80.0% 30.7% 0% 0% 0% 0%
Stretch & Shrink Film 17.6% 4.35% 0% 0% 0% 0% 0% 0% 0% 0% 0% 0% 0% 0% 0%
Carrier Bags 43.5% 43.5% 0% 0% 0% 0% 0% 0% 0% 0% 49.1% 0% 0% 0% 0%
Other Flexible
Converted Flexible
Food 0% 6.67% 1.80% 0% 5.88% 0% 0% 0% 0% 0% 30.7% 0% 0% 0% 0%
Non-Food 0% 6.67% 1.80% 0% 5.88% 0% 0% 0% 0% 0% 30.7% 0% 0% 0% 0%
Protective
Fill 0% 6.67% 1.80% 0% 5.88% 0% 0% 0% 0% 0% 49.1% 0% 0% 0% 0%
Dunnage 0% 6.67% 1.80% 0% 5.88% 0% 0% 0% 0% 0% 49.1% 0% 0% 0% 0%
Other 0% 6.67% 1.80% 0% 5.88% 0% 0% 0% 0% 0% 49.1% 0% 0% 0% 0%
Bulk Flexible
Shipping Sacks 0% 6.67% 1.80% 0% 0% 0% 0% 0% 0% 0% 49.1% 0% 0% 0% 0%
Strapping 0% 0% 1.80% 0% 0% 0% 1.80% 79.5% 0% 0% 0% 0% 0% 0% 0%
BulkLiners & Rolls 0% 6.67% 1.80% 0% 5.88% 0% 0% 0% 0% 0% 49.1% 0% 0% 0% 0%
FIBCs & Others 0% 6.67% 1.80% 0% 0% 0% 0% 0% 0% 0% 0% 0% 0% 0% 0%
Package Type
Plastics Recycling Alternative Materials Recycling

Chapter 3. Life Cycle Inventory
CLIENTS\ACC\KC182695 04.18.18 4103.00.001
125
Table 3-4. Recovery Rates for Canadian Plastic and Substitute Packaging (continued)
LD
PE
HD
PE
PP
PV
C
PS
EP
S
PE
T
Tin
pla
te
/Ste
el
Alu
mi-
num
Gla
ss
Paper
Cork
Rubber
Textile
Wood
Other Rigid
Non-Bulk
Bottles & Jars 0% 21.7% 18.3% 0% 0% 0% 39.1% 67.1% 19.9% 80.0% 30.7% 0% 0% 0% 0%
Tubs/Cups/Bowls 0% 19.3% 5.26% 0% 0% 0% 16.4% 67.0% 19.9% 80.0% 49.1% 0% 0% 0% 0%
Other 0% 19.3% 18.3% 0% 5.88% 5.88% 0% 67.0% 19.9% 80.0% 49.1% 0% 0% 0% 0%
Rigid Bulk
Drums 0% 19.3% 8.33% 0% 0% 0% 0% 79.5% 0% 0% 82.0% 0% 0% 0% 0%
Pails 0% 19.3% 8.33% 0% 0% 0% 0% 79.5% 0% 0% 82.0% 0% 0% 0% 0%
Material Handling & Bulk Boxes 0% 19.3% 8.33% 0% 0% 0% 0% 79.5% 0% 0% 82.0% 0% 0% 0% 0%
RIBCs 0% 19.3% 8.33% 0% 0% 0% 0% 79.5% 0% 0% 82.0% 0% 0% 0% 40.0%
Protective
Shapes 0% 0% 0% 0% 0% 5.88% 0% 0% 0% 0% 49.1% 0% 0% 0% 0%
Others 0% 0% 0% 0% 0% 5.88% 0% 0% 0% 0% 49.1% 0% 0% 0% 0%
Package Type
Plastics Recycling Alternative Materials Recycling

Chapter 3. Life Cycle Inventory
CLIENTS\ACC\KC182695 04.18.18 4103.00.001
126
3.5.3. Disposal
This analysis uses disposal process data from Franklin Associates’ private LCI database.
In this portion of the study, estimates of the end results of landfilling and waste-to-energy
(WTE) combustion are limited to global warming potential (GWP) effects, electricity
credits, and requirements for transporting waste to a landfill and operating landfill
equipment.
In the US, municipal solid waste (MSW) that is not recovered for recycling or composting
is managed 82 percent by weight to landfill (LF) and 18 percent by weight to waste-to-
energy (WTE) incineration.167 In Canada, 95 percent by weight of disposed weight goes to
LF, three percent to WTE, and the remaining two percent to incineration without energy
recovery.168 In both the US and Canadian geographic scope, the composition of landfill gas
as generated is approximately 50 percent by volume methane and 50 percent by volume
CO2. Currently in the US, about 71.2 percent of methane generated from solid waste LFs
is converted to CO2 before it is released to the environment: 10.6 percent is flared, 56.8
percent is burned with energy recovery, and about 3.8 percent is oxidized as it travels
through the landfill cover.169 In Canada, about 44.3 percent of methane generated from
solid waste LFs is converted to CO2: 18.9 percent is flared, 19.2 percent is burned with
energy recovery, and about 6.2 percent is oxidized as it travels through the landfill cover.170
Table 3-5. National Waste Management Statistics
US Canada
Landfilled 82% 95%
Waste-to-Energy Incineration (with energy recovery) 18% 3%
Incineration without energy recovery 0% 2%
Landfill methane captured and used for energy recovery 56.8% 19.2%
Landfill methane captured and flared 10.6% 18.9%
Landfill methane oxidized through landfill cover 3.8% 6.2%
Landfill methane that escapes into the atmosphere 28.8% 55.7%
167 US EPA (2012) Municipal Solid Waste Facts and Figures 2011.Accessible at
http://www.epa.gov/msw/msw99.htm. 168 Statistics Canada (2012). Human Activity and the Environment: Waste Management in Canada, 2012
– Updated, Statistique Canada, Catalogue no. 16-201-X, Ministry of Industry, September 2012. 169 US Environmental Protection Agency. Inventory of U.S. Greenhouse Gas Emissions and Sinks: 1990-
2015. Landfill gas management for 2014 from Table 7-3 CH4 Emissions from Landfills (MMT CO2
eq). 170 Environment and Climate Change Canada. National Inventory Report 1990-2015: Greenhouse Gas
Sources and Sinks in Canada. Canada’s Submission to the United Nations Framework Convention on
Climate Change. Part 2. Landfill gas management for 2014 from Table A3-69 Estimated MSW CH4
Generated, Captured, Flared, and Emitted for 1990-2015. Adjusted by Franklin Associates to use same
landfill oxidation assumption as US Greenhouse Gas Inventory (ten percent of the CH4 generated that
is not recovered is assumed to oxidize to CO2 as it passes through the landfill cover).

Chapter 3. Life Cycle Inventory
CLIENTS\ACC\KC182695 04.18.18 4103.00.001
127
Biomass CO2 released from decomposition of biomass-derived materials or from oxidation
of biomass-derived methane to CO2 is considered carbon neutral, as the CO2 released
represents a return to the environment of the carbon taken up as CO2 during the plant’s
growth cycle and does not result in a net increase in atmospheric CO2. Thus, biomass-
derived CO2 is not included in the GHG results shown in this analysis except to account
for carbon storage due to landfilling of carbon-based materials. Methane releases to the
environment from anaerobic decomposition of biomass are not considered carbon neutral,
however, since these releases resulting from human intervention have a higher GWP than
the CO2 taken up or released during the natural carbon cycle. Landfill decomposition
modeling and biogenic CO2 storage credits are described in detail in the Waste
Management section of Chapter 1. That section also provides a detailed description of
modeling for disposal by combustion and WTE combustion.
In the modeling of landfilling and WTE processes, GWP contributions from WTE
combustion of postconsumer packaging and from fugitive emissions of landfill methane
from anaerobic decomposition of biomass-derived materials are included. Credits for grid
electricity displaced by the generation of electricity from WTE combustion of
postconsumer packaging and from WTE combustion of methane recovered from
decomposition of landfilled biomass-derived materials are also included. Some carbon is
also sequestered in the biomass-derived materials that do not decompose. The US EPA
greenhouse gas accounting methodology does not assign a carbon sequestration credit to
landfilling of fossil-derived materials because this is considered a transfer between carbon
stocks (from oil deposit to landfill) with no net change in the overall amount of carbon
stored.171 The net end-of-life GWP for the landfilled materials is calculated by summing
the individual impacts and credits.
171 US EPA. Solid Waste Management and Greenhouse Gases: A Life-Cycle Assessment of Emissions
and Sinks. Third Edition. September 2006. Section 1.3, subsection Carbon Stocks, Carbon Storage,
and Carbon Sequestration. Page 6.

Chapter 4. Results for Packaging Systems
CLIENTS\ACC\KC182695 04.18.18 4103.00.001
128
CHAPTER 4. RESULTS FOR PACKAGING SYSTEMS
4.1. INTRODUCTION
This chapter presents results for the life cycle of plastic and substitute packaging in the US
and Canada. The following results categories are evaluated:
Life Cycle Inventory Indicators
• Energy demand (cumulative energy demand and expended energy)
• Water consumption
• Solid waste (by weight and by volume)
Life Cycle Impact Assessment Indicators
• Global warming potential
• Acidification potential
• Eutrophication potential
• Smog formation potential
• Ozone depletion potential
4.2. COMPARATIVE WEIGHTS
For US packaging, Table 4-1 shows that the combined weight of alternative packaging that
would be needed to substitute US plastic packaging is about 4.5 times as high as the weight
of the plastic packaging replaced. The ratio is similar for Canada, as shown in Table 4-2.
The weight ratio of substitutes to plastic varies considerably across packaging categories.
The lowest ratio is seen for caps and closures, where plastic caps and closures are
comparable in weight to substitutes. The highest weight ratio is seen for stretch and shrink
film, where lightweight plastic film is primarily replaced by paper and steel strapping, both
with higher weight per unit area compared to film.
Table 4-1. Weights of US Plastic and Substitute Packaging
Plastic
Packaging Substitutes Ratio
Caps & Closures 779 769 1.0
Beverage Containers 3,095 14,568 4.7
Stretch & Shrink 748 6,418 8.6
Carrier Bags 1,297 2,436 1.9
Other Flexible 4,188 16,830 4.0
Other Rigid 4,264 23,079 5.4
Total 14,373 64,100 4.5
Weight
(million kg)

Chapter 4. Results for Packaging Systems
CLIENTS\ACC\KC182695 04.18.18 4103.00.001
129
Table 4-2. Weights of Canadian Plastic and Substitute Packaging
For each environmental indicator, the weights of the plastic and substitute packaging in
each category are multiplied by the indicator results per kg of each type of packaging from
the LCA model to arrive at the indicator results for each category. The table below provides
an example of the calculation of total energy demand results for US carrier bags for the
maximum decomposition scenario. From Table 2-18, the weight of plastic carrier bags in
the US is 1,297 million kg. The same table shows that this weight of plastic bags would be
substituted by 1,709 million kg of paper bags and 727 million kg of textile bags. The life
cycle energy demand per kilogram for each type of plastic and substitute packaging, based
on average US recycled content, recycling rates, and percentages of landfill and WTE
disposal for each type of packaging in the US, come from the life cycle models described
in Chapter 3. The total kg of each type of packaging is multiplied by the life cycle energy
impacts per kg of that packaging type to calculate the total energy impacts for the quantities
of plastic and alternative packaging shown in the results tables and figures in this chapter.
Table 4-3. Example Calculation of Life Cycle Energy Results for US Carrier Bags
Plastic
Packaging Substitutes Ratio
Caps & Closures 62 48 0.8
Beverage Containers 341 1,603 4.7
Stretch & Shrink 83 708 8.6
Carrier Bags 143 269 1.9
Other Flexible 532 1,954 3.7
Other Rigid 470 2,546 5.4
Total 1,633 7,128 4.4
Weight
(million kg)
Life Cycle MJ/kg
(avg US recycled
Million kg content &
(Table 2-18) recycling rate) Billion MJ
Plastic bags 1,297 85.4 111
Paper bags 1,709 38.6 65.9
Textile bags 727 219 159
225
Savings for US plastic bags compared to substitutes: 114

Chapter 4. Results for Packaging Systems
CLIENTS\ACC\KC182695 04.18.18 4103.00.001
130
4.3. OVERVIEW OF RESULTS
Figure 4-1 and Figure 4-2 show normalized total results graphically for all results
categories evaluated. For each results indicator, the values are displayed on a percentage
basis relative to the system that has the maximum value for that indicator. Figure 4-1 shows
normalized results for US packaging, while Figure 4-2 shows normalized results for LCI
and LCIA indicators for Canadian packaging.
As described in Chapter 1, two decomposition scenarios are analyzed for substitute
packaging. The “no decomposition” scenario includes biogenic CO2 sequestration credit
for all the biogenic carbon in landfilled packaging (i.e., no decomposition over time of any
landfilled biomass-derived packaging), while the “maximum decomposition” scenario is
based on maximum decomposition of uncoated paper and paperboard packaging that is
disposed in landfills. For coated/laminated paper and paperboard products, the barrier
layers are assumed to minimize any decomposition of the fiber content; therefore, to use a
conservative approach, no decomposition of the fiber content of coated/laminated paper-
based packaging is modeled in either decomposition scenario.
The figures show that plastic packaging has lower impacts than substitute packaging for
all impacts evaluated for both the US and Canadian scenarios. This is largely due to the
light weight of plastic packaging. Although the impacts per kg of plastic packaging may in
some cases be higher than impacts per kg of substitute packaging, significantly more kg of
substitute packaging are required to perform the same function, as shown in Table 4-1 and
Table 4-2. The only category where plastic packaging weighs the same or slightly more
than substitute packaging is in the category of caps and closures, which accounts for only
4-5% of the total weight of plastic packaging for the US and Canada.

Chapter 4. Results for Packaging Systems
CLIENTS\ACC\KC182695 04.18.18 4103.00.001
131
Figure 4-1. Normalized US Results for Plastic Packaging and Substitutes

Chapter 4. Results for Packaging Systems
CLIENTS\ACC\KC182695 04.18.18 4103.00.001
132
Figure 4-2. Normalized Canadian Results for Plastic Packaging and Substitutes

Chapter 4. Results for Packaging Systems
CLIENTS\ACC\KC182695 04.18.18 4103.00.001
133
The figures also show that results for the maximum decomposition scenario for substitute
packaging (blue bars in figures) are generally equivalent to or somewhat lower than results
for the no decomposition scenario (orange bars). Maximum decomposition means more
landfill gas is generated, and the results include credits for the share of methane that is
captured and used for energy recovery, displacing grid electricity impacts. GWP is the only
category where the no decomposition results are significantly lower than the maximum
decomposition results, due to credits for biogenic carbon storage in landfilled biomass-
derived packaging that does not decompose.
The introductory table and figures are provided to give a general overview of comparative
results for plastic and alternative packaging. The remainder of this chapter discusses each
results category in more detail. There are several overarching factors that affect results
across all categories:
• Factors influencing differences in results for plastics and alternative
packaging types
o Less weight of plastic packaging to perform same function
o Higher embodied energy for plastics compared to substitute materials
o Lower water consumption per kg for plastic materials compared to
alternatives
o No decomposition (and therefore, no associated methane releases) for
landfilled plastics
o Carbon sequestration credits for landfilled material is only assigned to
biomass-based carbon content (e.g., in paper, paperboard, wood) and not to
fossil fuel-derived carbon content in plastic packaging
o Higher embodied energy/kg for plastics, so higher energy credits for
plastics disposed via waste-to-energy combustion.
• Factors influencing differences in results for US and Canada
o Less packaging used (lower population) in Canada
o Canadian electricity is less fossil fuel intensive (lower energy, emissions,
and fuel-related solid waste) but more hydropower dependent (higher
evaporative losses of water)
o Higher recycling rates for Canada, so a smaller share of packaging is sent
to landfill
o For packaging that is not recycled, there is more landfilling, less landfill gas
recovery, and less waste-to-energy combustion of solid waste in Canada
▪ More landfilling means more carbon sequestration credit for
disposed biomass-derived materials that don’t decompose, but more
methane emissions for biomass-derived materials that do
decompose
▪ Less energy recovery credits for all materials, since less waste-to-
energy disposal of unrecycled waste

Chapter 4. Results for Packaging Systems
CLIENTS\ACC\KC182695 04.18.18 4103.00.001
134
4.4. ENERGY RESULTS
Energy results are presented for cumulative energy demand as well as expended energy, to
distinguish between energy resources that are expended by combustion of process and
transportation fuels, and feedstock energy that is embodied in the product, which is still
potentially available for recovery.
4.4.1. Cumulative Energy Demand
Cumulative Energy Demand (CED) includes expended process energy and transportation
energy as well as energy of material resource (EMR, or feedstock energy) embodied in the
packaging material. US results are shown in Table 4-4 and Figure 4-3, and Canadian results
are shown in Table 4-5 and Figure 4-4. The tables show that CED for substitutes is over
90% higher than plastic packaging for both regions. The choice of decomposition scenario
does not have much effect on the total energy results.
The CED ratios vary considerably for different packaging categories, depending not only
on the relative masses of the plastic and substitute packaging but also on the CED for the
mix of material types used in each packaging category. For example, US beverage
packaging has a high substitutes-to-plastic weight ratio (4.7 in Table 4-1) but a smaller
substitutes-to-plastic CED ratio (1.6 in Table 4-4). Substitution of glass bottles for a share
of plastic bottles drives up the weight ratio, but since CED per kg of glass bottle is lower
than CED per kg of plastic bottle, the CED difference is not as high as the weight ratio.
To provide some perspective on the magnitude of the energy savings for plastic packaging
compared to substitutes, equivalencies are shown at the bottom of the tables. US CED
savings of over 1,000 billion MJ is equivalent to the energy saved by taking 18 million
passenger vehicles off the road for a year, or the energy content of over 1 million tanker
trucks of gasoline.172 The Canadian CED savings of over 120 billion MJ is equivalent to
the energy saved by taking 1.8 million passenger vehicles off the road for a year, or the
energy content of over 100,000 tanker trucks of gasoline.
172 Equivalencies are based on the US EPA’s Greenhouse Gas Equivalencies calculator at
https://www.epa.gov/energy/greenhouse-gas-equivalencies-calculator.
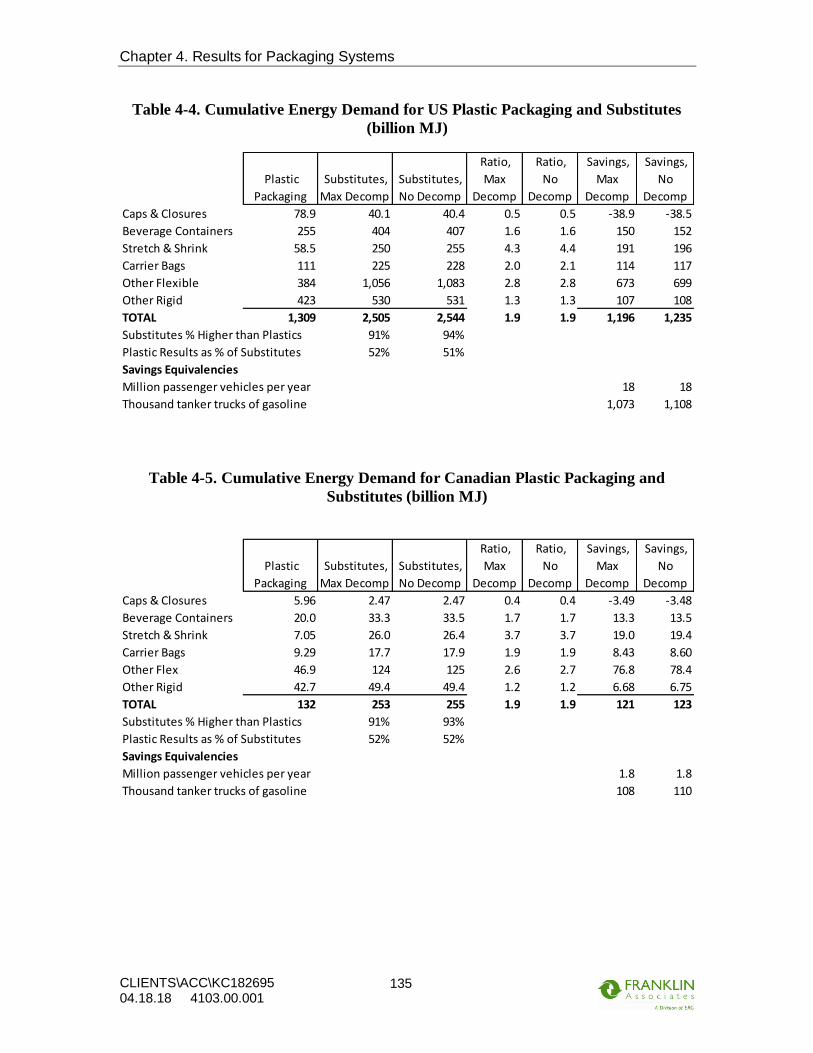
Chapter 4. Results for Packaging Systems
CLIENTS\ACC\KC182695 04.18.18 4103.00.001
135
Table 4-4. Cumulative Energy Demand for US Plastic Packaging and Substitutes
(billion MJ)
Table 4-5. Cumulative Energy Demand for Canadian Plastic Packaging and
Substitutes (billion MJ)
Plastic
Packaging
Substitutes,
Max Decomp
Substitutes,
No Decomp
Ratio,
Max
Decomp
Ratio,
No
Decomp
Savings,
Max
Decomp
Savings,
No
Decomp
Caps & Closures 78.9 40.1 40.4 0.5 0.5 -38.9 -38.5
Beverage Containers 255 404 407 1.6 1.6 150 152
Stretch & Shrink 58.5 250 255 4.3 4.4 191 196
Carrier Bags 111 225 228 2.0 2.1 114 117
Other Flexible 384 1,056 1,083 2.8 2.8 673 699
Other Rigid 423 530 531 1.3 1.3 107 108
TOTAL 1,309 2,505 2,544 1.9 1.9 1,196 1,235
Substitutes % Higher than Plastics 91% 94%
Plastic Results as % of Substitutes 52% 51%
Savings Equivalencies
Million passenger vehicles per year 18 18
Thousand tanker trucks of gasoline 1,073 1,108
Plastic
Packaging
Substitutes,
Max Decomp
Substitutes,
No Decomp
Ratio,
Max
Decomp
Ratio,
No
Decomp
Savings,
Max
Decomp
Savings,
No
Decomp
Caps & Closures 5.96 2.47 2.47 0.4 0.4 -3.49 -3.48
Beverage Containers 20.0 33.3 33.5 1.7 1.7 13.3 13.5
Stretch & Shrink 7.05 26.0 26.4 3.7 3.7 19.0 19.4
Carrier Bags 9.29 17.7 17.9 1.9 1.9 8.43 8.60
Other Flex 46.9 124 125 2.6 2.7 76.8 78.4
Other Rigid 42.7 49.4 49.4 1.2 1.2 6.68 6.75
TOTAL 132 253 255 1.9 1.9 121 123
Substitutes % Higher than Plastics 91% 93%
Plastic Results as % of Substitutes 52% 52%
Savings Equivalencies
Million passenger vehicles per year 1.8 1.8
Thousand tanker trucks of gasoline 108 110

Chapter 4. Results for Packaging Systems
CLIENTS\ACC\KC182695 04.18.18 4103.00.001
136
Figure 4-3. Cumulative Energy Demand by Category for US Plastic Packaging and
Substitutes (billion MJ)
Figure 4-4. Cumulative Energy Demand by Category for Canadian Plastic
Packaging and Substitutes (billion MJ)
4.4.2. Expended Energy
Table 4-6 and Table 4-7 show results for expended energy (CED minus the energy
embodied in the packaging material). This distinction is particularly relevant for plastics,
because embodied EMR is still potentially available for future use (e.g., via material
recycling or material combustion with energy recovery), as opposed to the expended
energy. Because plastics use fossil fuels as material feedstocks, a high percentage of CED
for plastic packaging is EMR. Of the non-plastic substitute packaging, paper packaging is
the only type that has significant feedstock energy. Table 4-6 and Table 4-7 show that the

Chapter 4. Results for Packaging Systems
CLIENTS\ACC\KC182695 04.18.18 4103.00.001
137
overall life cycle expended (unrecoverable) energy for substitutes is about 3 times as high
as the expended energy for plastic packaging, although the ratio varies considerably by
packaging category, based on the mix of substitute materials in each packaging category.
Savings equivalencies for plastic packaging compared to substitutes are shown at the
bottom of each table. US expended energy savings of over 1,300 billion MJ is equivalent
to the energy consumed by 20 million passenger vehicles in a year, or the energy content
of 1.2 million tanker trucks of gasoline. The Canadian expended energy savings of over
140 billion MJ is equivalent to the energy consumed by about 2.1 million passenger
vehicles in a year, or the energy content of about 130,000 tanker trucks of gasoline.
Figure 4-5 and Figure 4-6 show the comparisons of expended energy for individual
categories of plastic and substitute packaging for the US and Canada, respectively. Figure
4-7 and Figure 4-8 show expended energy as a percent of total energy for plastics and
substitutes in individual packaging categories.
Table 4-6. Expended Energy for US Plastic Packaging and Substitutes (billion MJ)
Plastic
Packaging
Substitutes,
Max Decomp
Substitutes,
No Decomp
Ratio,
Max
Decomp
Ratio,
No
Decomp
Savings,
Max
Decomp
Savings,
No
Decomp
Caps & Closures 39.4 38.9 39.3 1.0 1.0 -0.54 -0.18
Beverage Containers 159 377 380 2.4 2.4 218 221
Stretch & Shrink 27.6 195 200 7.1 7.2 167 172
Carrier Bags 46.9 197 200 4.2 4.3 150 153
Other Flexible 178 771 798 4.3 4.5 593 619
Other Rigid 241 509 510 2.1 2.1 268 269
TOTAL 693 2,088 2,127 3.0 3.1 1,396 1,435
Substitutes % Higher than Plastics 202% 207%
Plastic Results as % of Substitutes 33% 33%
Savings Equivalencies
Million passenger vehicles per year 20 21
Thousand tanker trucks of gasoline 1,252 1,287

Chapter 4. Results for Packaging Systems
CLIENTS\ACC\KC182695 04.18.18 4103.00.001
138
Table 4-7. Expended Energy for Canadian Plastic Packaging and Substitutes
(billion MJ)
Figure 4-5. Expended Energy by Category for US Plastic Packaging and Substitutes
(billion MJ)
Plastic
Packaging
Substitutes,
Max Decomp
Substitutes,
No Decomp
Ratio,
Max
Decomp
Ratio,
No
Decomp
Savings,
Max
Decomp
Savings,
No
Decomp
Caps & Closures 2.78 2.43 2.43 0.9 0.9 -0.35 -0.35
Beverage Containers 13.2 31.0 31.2 2.4 2.4 17.9 18.0
Stretch & Shrink 3.11 19.8 20.2 6.4 6.5 16.7 17.1
Carrier Bags 4.12 15.6 15.8 3.8 3.8 11.5 11.7
Other Flex 20.9 93.5 95.1 4.5 4.6 72.6 74.2
Other Rigid 22.8 47.2 47.3 2.1 2.1 24.4 24.5
TOTAL 66.9 210 212 3.1 3.2 143 145
Substitutes % Higher than Plastics 213% 217%
Plastic Results as % of Substitutes 32% 32%
Savings Equivalencies
Million passenger vehicles per year 2.1 2.1
Thousand tanker trucks of gasoline 128 130
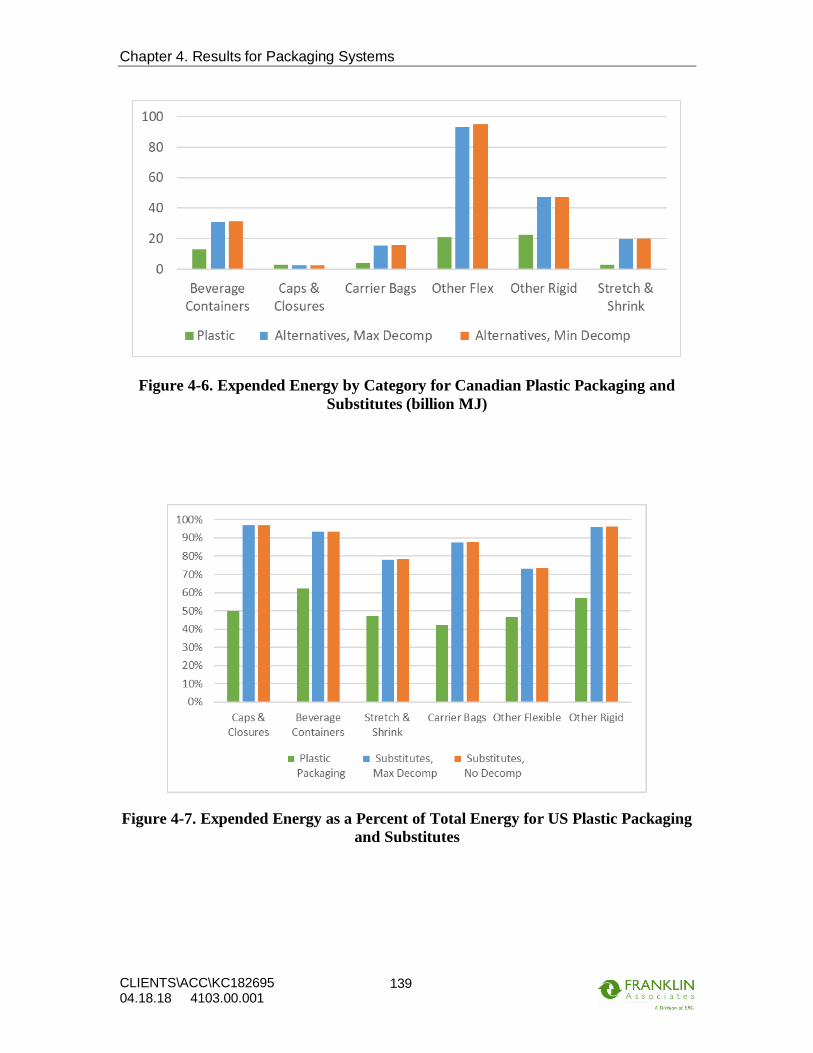
Chapter 4. Results for Packaging Systems
CLIENTS\ACC\KC182695 04.18.18 4103.00.001
139
Figure 4-6. Expended Energy by Category for Canadian Plastic Packaging and
Substitutes (billion MJ)
Figure 4-7. Expended Energy as a Percent of Total Energy for US Plastic Packaging
and Substitutes

Chapter 4. Results for Packaging Systems
CLIENTS\ACC\KC182695 04.18.18 4103.00.001
140
Figure 4-8. Expended Energy as a Percent of Total Energy for Canadian Plastic
Packaging and Substitutes
4.5. WATER CONSUMPTION RESULTS
Consumptive use of water includes freshwater that is withdrawn from a water source or
watershed and not returned to that source. Consumptive water use includes water consumed
in chemical reactions, water that is incorporated into a product or waste stream, water that
becomes evaporative loss, and water that is discharged to a different watershed or water
body than the one from which it was withdrawn. Water consumption results shown for
each life cycle stage include process water consumption as well as water consumption
associated with production of the electricity and fuels used in that stage.
Production of plastic resins and plastic converting processes consume less water per kg
than production of substitute packaging such as paper and paperboard, textiles, metals, and
glass, leading to significant water consumption savings for plastic packaging. Savings are
most notable in the category of carrier bags, where plastic bags would be substituted by
paper and textile bags.
Overall, the substitutes that would replace US plastic packaging would consume almost 6
times as much water, and Canadian substitutes would consume almost 4 times as much
water. The ratio is somewhat lower for Canada due to the influence of a more water-
intensive electricity grid, which affects results for both plastics and substitutes. The savings
in water consumption expressed as the equivalent number of Olympic swimming pools are
460,000 Olympic pools for US plastic packaging and about 55,000 Olympic pools for
Canadian packaging.173
173 Based on Olympic pool dimensions of 50 meters long, 25 meters wide, and 2 meters deep.

Chapter 4. Results for Packaging Systems
CLIENTS\ACC\KC182695 04.18.18 4103.00.001
141
Table 4-8. Water Consumption for US Plastic Packaging and Substitutes
(thousand cubic meters)
Table 4-9. Water Consumption for Canadian Plastic Packaging and Substitutes
(thousand cubic meters)
Plastic
Packaging
Substitutes,
Max Decomp
Substitutes,
No Decomp
Ratio,
Max
Decomp
Ratio,
No
Decomp
Savings,
Max
Decomp
Savings,
No
Decomp
Caps & Closures 13,684 7,348 7,485 0.5 0.5 -6,336 -6199
Beverage Containers 55,936 101,675 102,768 1.8 1.8 45,739 46,832
Stretch & Shrink 8,898 69,112 70,983 7.8 8.0 60,214 62,085
Carrier Bags 15,412 717,932 719,051 46.6 46.7 702,519 703,639
Other Flexible 56,342 187,641 197,832 3.3 3.5 131,299 141,490
Other Rigid 82,572 255,247 255,696 3.1 3.1 172,675 173,124
TOTAL 232,845 1,338,955 1,353,815 5.8 5.8 1,106,110 1,120,971
Substitutes % Higher than Plastics 475% 481%
Plastic Results as % of Substitutes 17% 17%
Savings Equivalency
Thousands of Olympic swimming pools 461 467
Plastic
Packaging
Substitutes,
Max Decomp
Substitutes,
No Decomp
Ratio,
Max
Decomp
Ratio,
No
Decomp
Savings,
Max
Decomp
Savings,
No
Decomp
Caps & Closures 1,910 775 781 0.4 0.4 -1,135 -1,129
Beverage Containers 11,675 14,651 14,905 1.3 1.3 2,976 3,230
Stretch & Shrink 1,695 10,833 11,359 6.4 6.7 9,138 9,664
Carrier Bags 2,694 87,313 87,533 32.4 32.5 84,619 84,839
Other Flex 11,958 25,990 28,096 2.2 2.3 14,033 16,139
Other Rigid 16,547 36,876 36,959 2.2 2.2 20,329 20,412
TOTAL 46,479 176,440 179,634 3.8 3.9 129,961 133,155
Substitutes % Higher than Plastics 280% 286%
Plastic Results as % of Substitutes 26% 26%
Savings Equivalency
Thousands of Olympic swimming pools 54 55

Chapter 4. Results for Packaging Systems
CLIENTS\ACC\KC182695 04.18.18 4103.00.001
142
Figure 4-9. Water Consumption by Category for US Plastic Packaging and
Substitutes (thousand cubic meters)
Figure 4-10. Water Consumption for Canadian Plastic Packaging and Substitutes
(thousand cubic meters)
4.6. SOLID WASTE RESULTS
4.6.1. Weight of Solid Waste
Solid waste includes sludges and residues from chemical reactions and material processing
steps, wastes associated with production and combustion of fuels (e.g., refinery wastes,
coal combustion ash from power generation), and postconsumer packaging that is disposed
rather than recycled.
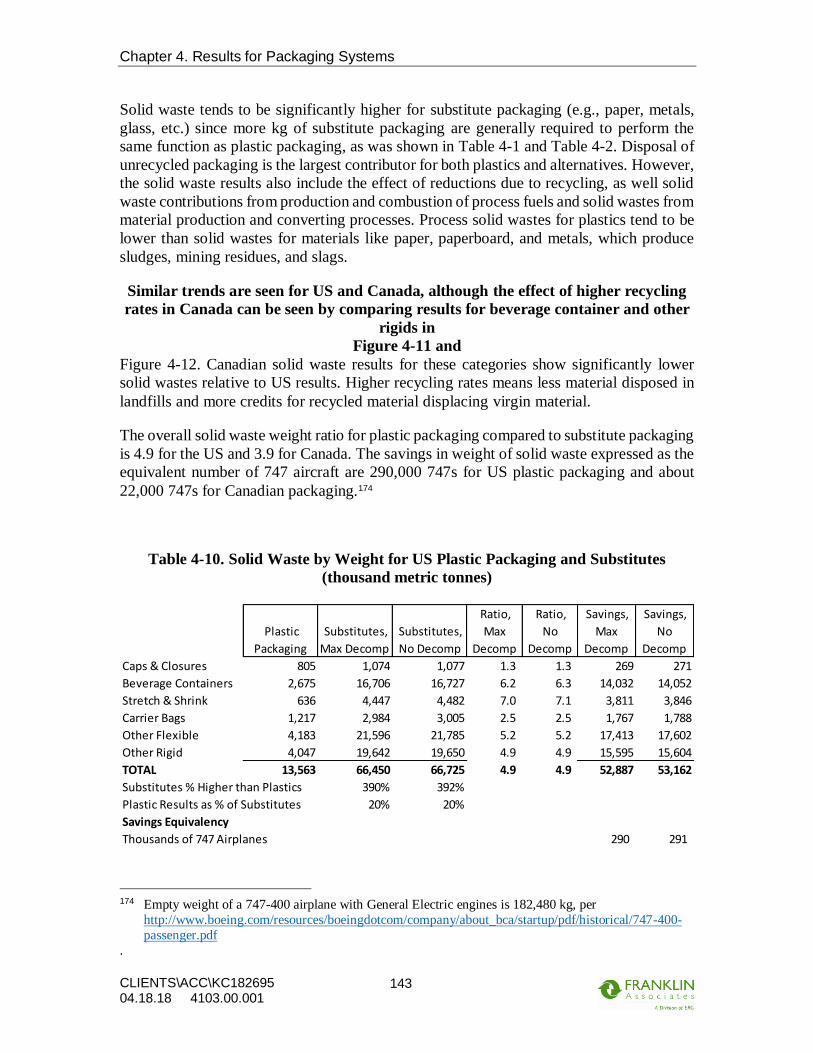
Chapter 4. Results for Packaging Systems
CLIENTS\ACC\KC182695 04.18.18 4103.00.001
143
Solid waste tends to be significantly higher for substitute packaging (e.g., paper, metals,
glass, etc.) since more kg of substitute packaging are generally required to perform the
same function as plastic packaging, as was shown in Table 4-1 and Table 4-2. Disposal of
unrecycled packaging is the largest contributor for both plastics and alternatives. However,
the solid waste results also include the effect of reductions due to recycling, as well solid
waste contributions from production and combustion of process fuels and solid wastes from
material production and converting processes. Process solid wastes for plastics tend to be
lower than solid wastes for materials like paper, paperboard, and metals, which produce
sludges, mining residues, and slags.
Similar trends are seen for US and Canada, although the effect of higher recycling
rates in Canada can be seen by comparing results for beverage container and other
rigids in
Figure 4-11 and
Figure 4-12. Canadian solid waste results for these categories show significantly lower
solid wastes relative to US results. Higher recycling rates means less material disposed in
landfills and more credits for recycled material displacing virgin material.
The overall solid waste weight ratio for plastic packaging compared to substitute packaging
is 4.9 for the US and 3.9 for Canada. The savings in weight of solid waste expressed as the
equivalent number of 747 aircraft are 290,000 747s for US plastic packaging and about
22,000 747s for Canadian packaging.174
Table 4-10. Solid Waste by Weight for US Plastic Packaging and Substitutes
(thousand metric tonnes)
174 Empty weight of a 747-400 airplane with General Electric engines is 182,480 kg, per
http://www.boeing.com/resources/boeingdotcom/company/about_bca/startup/pdf/historical/747-400-
passenger.pdf
.
Plastic
Packaging
Substitutes,
Max Decomp
Substitutes,
No Decomp
Ratio,
Max
Decomp
Ratio,
No
Decomp
Savings,
Max
Decomp
Savings,
No
Decomp
Caps & Closures 805 1,074 1,077 1.3 1.3 269 271
Beverage Containers 2,675 16,706 16,727 6.2 6.3 14,032 14,052
Stretch & Shrink 636 4,447 4,482 7.0 7.1 3,811 3,846
Carrier Bags 1,217 2,984 3,005 2.5 2.5 1,767 1,788
Other Flexible 4,183 21,596 21,785 5.2 5.2 17,413 17,602
Other Rigid 4,047 19,642 19,650 4.9 4.9 15,595 15,604
TOTAL 13,563 66,450 66,725 4.9 4.9 52,887 53,162
Substitutes % Higher than Plastics 390% 392%
Plastic Results as % of Substitutes 20% 20%
Savings Equivalency
Thousands of 747 Airplanes 290 291
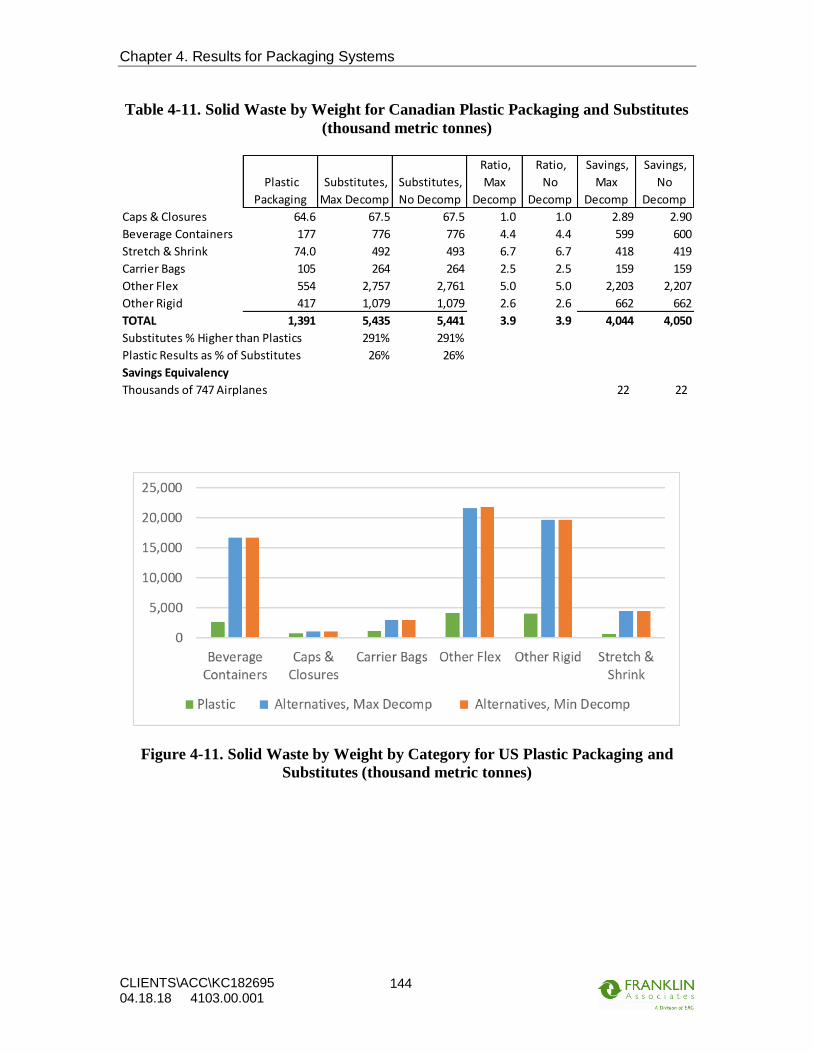
Chapter 4. Results for Packaging Systems
CLIENTS\ACC\KC182695 04.18.18 4103.00.001
144
Table 4-11. Solid Waste by Weight for Canadian Plastic Packaging and Substitutes
(thousand metric tonnes)
Figure 4-11. Solid Waste by Weight by Category for US Plastic Packaging and
Substitutes (thousand metric tonnes)
Plastic
Packaging
Substitutes,
Max Decomp
Substitutes,
No Decomp
Ratio,
Max
Decomp
Ratio,
No
Decomp
Savings,
Max
Decomp
Savings,
No
Decomp
Caps & Closures 64.6 67.5 67.5 1.0 1.0 2.89 2.90
Beverage Containers 177 776 776 4.4 4.4 599 600
Stretch & Shrink 74.0 492 493 6.7 6.7 418 419
Carrier Bags 105 264 264 2.5 2.5 159 159
Other Flex 554 2,757 2,761 5.0 5.0 2,203 2,207
Other Rigid 417 1,079 1,079 2.6 2.6 662 662
TOTAL 1,391 5,435 5,441 3.9 3.9 4,044 4,050
Substitutes % Higher than Plastics 291% 291%
Plastic Results as % of Substitutes 26% 26%
Savings Equivalency
Thousands of 747 Airplanes 22 22

Chapter 4. Results for Packaging Systems
CLIENTS\ACC\KC182695 04.18.18 4103.00.001
145
Figure 4-12. Solid Waste by Weight by Category for Canadian Plastic Packaging
and Substitutes (thousand metric tonnes)
4.6.2. Volume of Solid Waste
Weights of solid waste are converted to volume using landfill density factors for
corresponding products and materials derived from landfill samples and compaction tests.
Industrial wastes from raw material production processes and fuel-related wastes are
generally higher in density than postconsumer packaging, so the relative solid waste
contributions for process and fuel-related wastes are smaller on a volume basis than on a
weight basis. For postconsumer packaging solid waste, plastic rigids (in categories such as
beverage containers, caps and closures, and other rigid packaging) show less savings in
solid waste volume compared to solid waste weight. This is due to the lower landfill density
of rigid plastics, particularly where plastic is substituted with paper, which compacts more
densely in a landfill. As shown in Table 4-12 and Table 4-13, the overall solid waste weight
ratio for plastic packaging compared to substitute packaging is 4.9 for the US and 3.9 for
Canada. The weight of solid waste is expressed in terms of the volume of a well-known
landmark, the US Capitol Rotunda. The volume of solid waste savings for the US equates
to the volume to fill the Capitol Rotunda approximately 1,500 times, and the savings for
Canadian packaging is the equivalent to over 100 Capitol Rotunda volumes.175
175 The volume of the US Capitol Rotunda is 1.3 million cubic feet, per https://www.aoc.gov/facts/capitol-
hill#CP_JUMP_8210.

Chapter 4. Results for Packaging Systems
CLIENTS\ACC\KC182695 04.18.18 4103.00.001
146
Table 4-12. Solid Waste by Volume for US Plastic Packaging and Substitutes
(million cubic meters)
Table 4-13. Solid Waste by Volume for Canadian Plastic Packaging and Substitutes
(million cubic meters)
Plastic
Packaging
Substitutes,
Max Decomp
Substitutes,
No Decomp
Ratio,
Max
Decomp
Ratio,
No
Decomp
Savings,
Max
Decomp
Savings,
No
Decomp
Caps & Closures 2.04 1.38 1.38 0.7 0.7 -0.66 -0.66
Beverage Containers 9.63 21.9 22.0 2.3 2.3 12.3 12.3
Stretch & Shrink 1.42 7.21 7.25 5.1 5.1 5.78 5.82
Carrier Bags 2.13 4.57 4.60 2.2 2.2 2.44 2.47
Other Flexible 8.83 34.9 35.1 4.0 4.0 26.1 26.3
Other Rigid 15.8 25.0 25.0 1.6 1.6 9.14 9.15
TOTAL 39.9 95.0 95.3 2.4 2.4 55.1 55.4
Substitutes % Higher than Plastics 138% 139%
Plastic Results as % of Substitutes 42% 42%
Savings Equivalency
U.S. Capitol Rotundas 1,496 1,505
Plastic
Packaging
Substitutes,
Max Decomp
Substitutes,
No Decomp
Ratio,
Max
Decomp
Ratio,
No
Decomp
Savings,
Max
Decomp
Savings,
No
Decomp
Caps & Closures 0.18 0.086 0.086 0.5 0.5 -0.097 -0.097
Beverage Containers 0.71 1.08 1.08 1.5 1.5 0.37 0.37
Stretch & Shrink 0.18 0.83 0.83 4.7 4.7 0.65 0.65
Carrier Bags 0.25 0.44 0.44 1.8 1.8 0.19 0.19
Other Flex 1.33 4.42 4.42 3.3 3.3 3.08 3.09
Other Rigid 1.88 1.41 1.41 0.7 0.7 -0.47 -0.47
TOTAL 4.53 8.26 8.27 1.8 1.8 3.73 3.74
Substitutes % Higher than Plastics 82% 83%
Plastic Results as % of Substitutes 55% 55%
Savings Equivalency
U.S. Capitol Rotundas 101 102
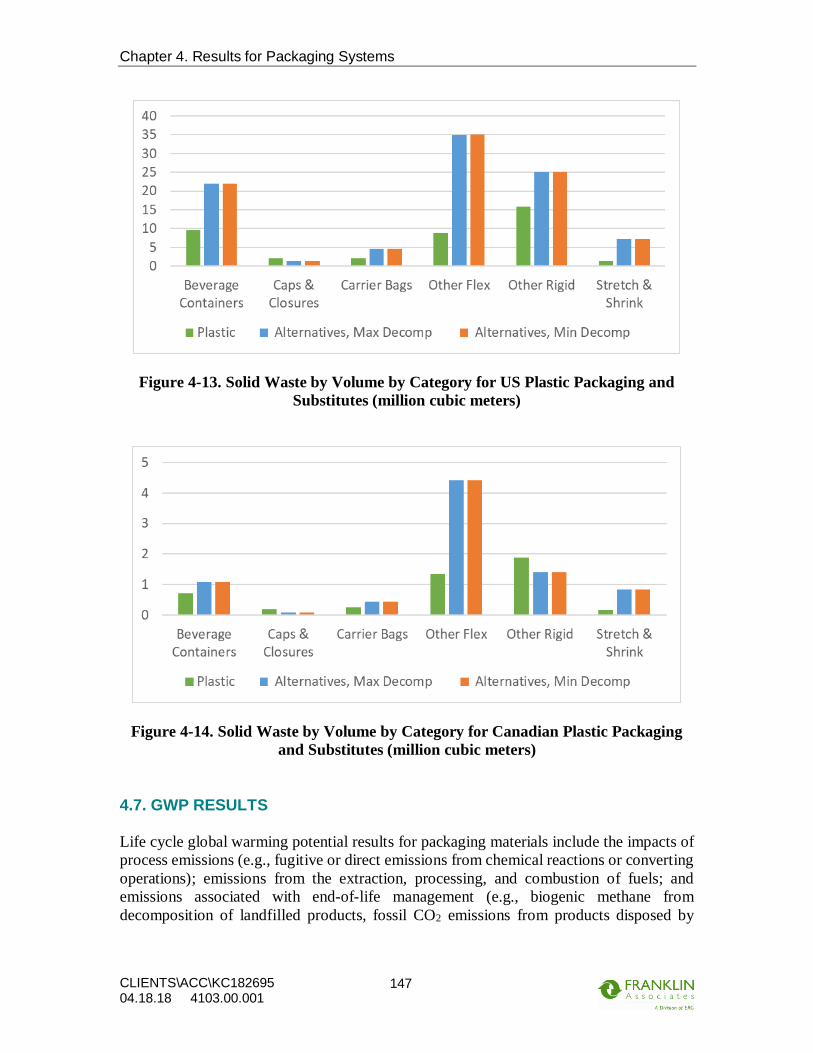
Chapter 4. Results for Packaging Systems
CLIENTS\ACC\KC182695 04.18.18 4103.00.001
147
Figure 4-13. Solid Waste by Volume by Category for US Plastic Packaging and
Substitutes (million cubic meters)
Figure 4-14. Solid Waste by Volume by Category for Canadian Plastic Packaging
and Substitutes (million cubic meters)
4.7. GWP RESULTS
Life cycle global warming potential results for packaging materials include the impacts of
process emissions (e.g., fugitive or direct emissions from chemical reactions or converting
operations); emissions from the extraction, processing, and combustion of fuels; and
emissions associated with end-of-life management (e.g., biogenic methane from
decomposition of landfilled products, fossil CO2 emissions from products disposed by
Chapter 4. Results for Packaging Systems
CLIENTS\ACC\KC182695 04.18.18 4103.00.001
148
combustion, and emission credits for grid electricity displaced by energy recovered from
waste-to-energy combustion of materials or landfill gas).
As described in Chapter 1, two decomposition scenarios are analyzed for substitute
packaging. The “no decomposition” scenario includes biogenic CO2 sequestration credit
for all the biogenic carbon in landfilled packaging (i.e., no decomposition over time of any
landfilled biomass-derived packaging), while the “maximum decomposition” scenario is
based on maximum decomposition of uncoated paper and paperboard packaging that is
disposed in landfills. For coated/laminated paper and paperboard products, the barrier
layers are assumed to minimize any decomposition of the fiber content; therefore, to use a
conservative approach, no decomposition of the fiber content of coated/laminated paper-
based packaging is modeled in either decomposition scenario.
Table 4-14 and Table 4-15 show life cycle global warming potential results for plastics and
alternatives in the US and Canada, respectively. The results are also presented graphically
in Figure 4-15 and Figure 4-16. For the entire packaging sector, life cycle GWP results for
US substitutes are 1.7 times higher than plastic packaging under the no decomposition
scenario (with biomass carbon storage credits for landfilled paper, paperboard, and wood
packaging) and 2.2 times higher than plastic packaging for the maximum decomposition
scenario. For Canada, substitute packaging GWP is 1.9 times greater than plastic packaging
for the no decomposition scenario and 3 times greater for the maximum decomposition
scenario. The Canadian ratio for the maximum decomposition scenario is higher than for
the US because less landfill gas is captured and utilized in Canada, so net landfill methane
emissions are higher.
The total life cycle GWP savings for use of plastic packaging compared to substitutes can
be visualized using factors from the US EPA Greenhouse Gas Equivalencies Calculator.
US GWP savings of 39.5 million metric tonnes of CO2 eq for the conservative no
decomposition scenario for substitutes is equivalent to the GHG emissions saved by taking
8.5 million passenger vehicles off the road for a year, or the annual GHG emissions from
the combustion of the gasoline in 523,000 tanker trucks. US savings for the maximum
decomposition scenario are substantially higher, 67 million metric tonnes CO2 eq,
equivalent to 14 million passenger vehicles and almost 890,000 tanker trucks of gasoline.
The Canadian GWP savings of 3.6 million metric tonnes CO2 eq for the no decomposition
scenario is equivalent to the emissions from 800,000 passenger vehicles or 48,000 tanker
trucks of gasoline, while savings for the maximum decomposition scenario are over twice
as high at 8.7 million metric tonnes CO2 eq, equivalent to almost 2 million passenger
vehicles or 115,000 tanker trucks of gasoline.

Chapter 4. Results for Packaging Systems
CLIENTS\ACC\KC182695 04.18.18 4103.00.001
149
Table 4-14. GWP Results for US Plastic and Substitute Packaging (million metric
tonnes CO2 eq)
Table 4-15. GWP Results for Canadian Plastic and Substitute Packaging (million
metric tonnes CO2 eq)
Plastic
Packaging
Substitutes,
Max Decomp
Substitutes,
No Decomp
Ratio,
Max
Decomp
Ratio,
No
Decomp
Savings,
Max Decomp
Savings,
No
Decomp
Caps & Closures 3.11 2.44 2.09 0.8 0.7 -0.67 -1.01
Beverage Containers 13.4 21.8 20.7 1.6 1.5 8.40 7.31
Stretch & Shrink 2.50 11.8 9.30 4.7 3.7 9.31 6.79
Carrier Bags 4.19 10.9 8.11 2.6 1.9 6.75 3.93
Other Flexible 15.1 40.4 20.2 2.7 1.3 25.3 5.10
Other Rigid 19.4 37.4 36.8 1.9 1.9 18.0 17.4
TOTAL 57.6 125 97.1 2.2 1.7 67.1 39.5
Substitutes % Higher than Plastics 117% 69%
Plastic Results as % of Substitutes 46% 59%
Savings Equivalencies
Million passenger vehicles per year 14 8.5
Thousand tanker trucks of gasoline 889 523
Plastic
Packaging
Substitutes,
Max Decomp
Substitutes,
No Decomp
Ratio,
Max
Decomp
Ratio,
No
Decomp
Savings,
Max Decomp
Savings,
No
Decomp
Caps & Closures 0.16 0.15 0.13 0.9 0.8 -0.0087 -0.036
Beverage Containers 0.85 1.74 1.62 2.0 1.9 0.89 0.77
Stretch & Shrink 0.21 1.10 0.69 5.3 3.4 0.89 0.49
Carrier Bags 0.31 0.63 0.15 2.1 0.5 0.33 -0.16
Other Flex 1.37 6.15 2.29 4.5 1.7 4.78 0.92
Other Rigid 1.40 3.18 3.07 2.3 2.2 1.79 1.68
TOTAL 4.29 13.0 7.94 3.0 1.9 8.66 3.65
Substitutes % Higher than Plastics 202% 85%
Plastic Results as % of Substitutes 33% 54%
Savings Equivalencies
Million passenger vehicles per year 1.9 0.8
Thousand tanker trucks of gasoline 115 48
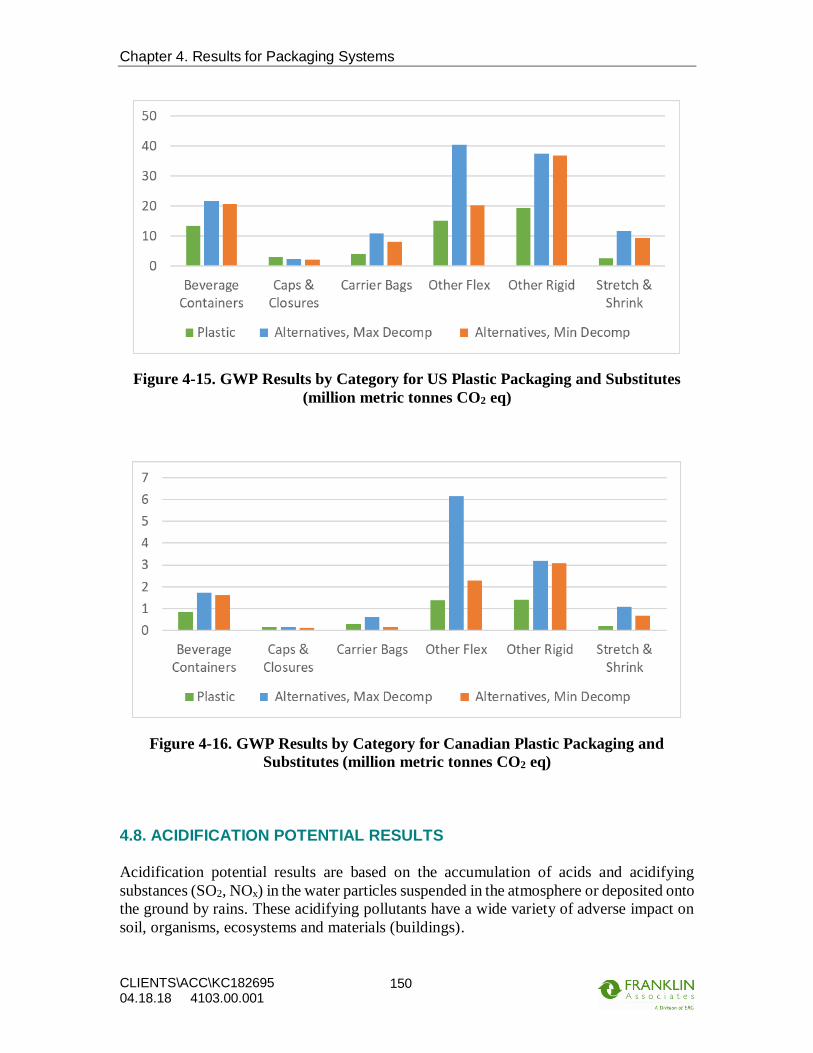
Chapter 4. Results for Packaging Systems
CLIENTS\ACC\KC182695 04.18.18 4103.00.001
150
Figure 4-15. GWP Results by Category for US Plastic Packaging and Substitutes
(million metric tonnes CO2 eq)
Figure 4-16. GWP Results by Category for Canadian Plastic Packaging and
Substitutes (million metric tonnes CO2 eq)
4.8. ACIDIFICATION POTENTIAL RESULTS
Acidification potential results are based on the accumulation of acids and acidifying
substances (SO2, NOx) in the water particles suspended in the atmosphere or deposited onto
the ground by rains. These acidifying pollutants have a wide variety of adverse impact on
soil, organisms, ecosystems and materials (buildings).
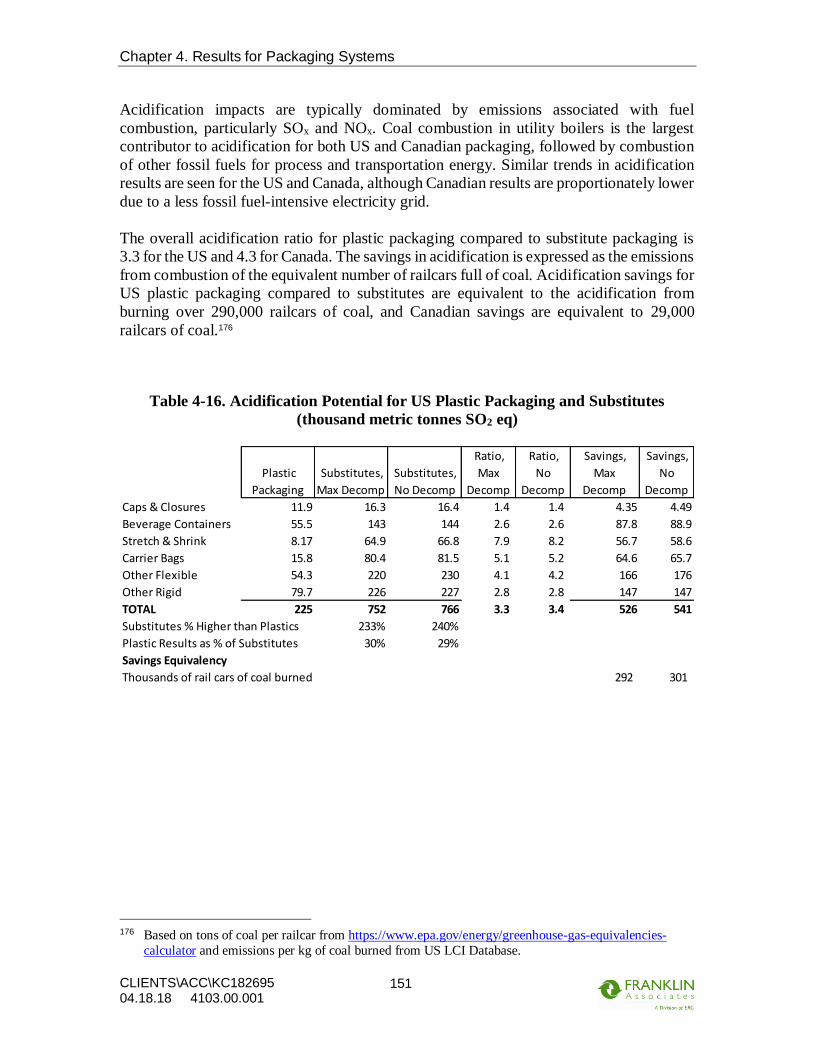
Chapter 4. Results for Packaging Systems
CLIENTS\ACC\KC182695 04.18.18 4103.00.001
151
Acidification impacts are typically dominated by emissions associated with fuel
combustion, particularly SOx and NOx. Coal combustion in utility boilers is the largest
contributor to acidification for both US and Canadian packaging, followed by combustion
of other fossil fuels for process and transportation energy. Similar trends in acidification
results are seen for the US and Canada, although Canadian results are proportionately lower
due to a less fossil fuel-intensive electricity grid.
The overall acidification ratio for plastic packaging compared to substitute packaging is
3.3 for the US and 4.3 for Canada. The savings in acidification is expressed as the emissions
from combustion of the equivalent number of railcars full of coal. Acidification savings for
US plastic packaging compared to substitutes are equivalent to the acidification from
burning over 290,000 railcars of coal, and Canadian savings are equivalent to 29,000
railcars of coal.176
Table 4-16. Acidification Potential for US Plastic Packaging and Substitutes
(thousand metric tonnes SO2 eq)
176 Based on tons of coal per railcar from https://www.epa.gov/energy/greenhouse-gas-equivalencies-
calculator and emissions per kg of coal burned from US LCI Database.
Plastic
Packaging
Substitutes,
Max Decomp
Substitutes,
No Decomp
Ratio,
Max
Decomp
Ratio,
No
Decomp
Savings,
Max
Decomp
Savings,
No
Decomp
Caps & Closures 11.9 16.3 16.4 1.4 1.4 4.35 4.49
Beverage Containers 55.5 143 144 2.6 2.6 87.8 88.9
Stretch & Shrink 8.17 64.9 66.8 7.9 8.2 56.7 58.6
Carrier Bags 15.8 80.4 81.5 5.1 5.2 64.6 65.7
Other Flexible 54.3 220 230 4.1 4.2 166 176
Other Rigid 79.7 226 227 2.8 2.8 147 147
TOTAL 225 752 766 3.3 3.4 526 541
Substitutes % Higher than Plastics 233% 240%
Plastic Results as % of Substitutes 30% 29%
Savings Equivalency
Thousands of rail cars of coal burned 292 301

Chapter 4. Results for Packaging Systems
CLIENTS\ACC\KC182695 04.18.18 4103.00.001
152
Table 4-17. Acidification Potential for Canadian Plastic Packaging and Substitutes
(thousand metric tonnes SO2 eq)
Figure 4-17. Acidification Potential by Category for US Plastic Packaging and
Substitutes (thousand metric tonnes SO2 eq)
Plastic
Packaging
Substitutes,
Max Decomp
Substitutes,
No Decomp
Ratio,
Max
Decomp
Ratio,
No
Decomp
Savings,
Max
Decomp
Savings,
No
Decomp
Caps & Closures 0.58 0.96 0.96 1.7 1.7 0.38 0.38
Beverage Containers 3.06 10.9 10.9 3.6 3.6 7.82 7.85
Stretch & Shrink 0.70 5.59 5.66 8.0 8.1 4.89 4.96
Carrier Bags 1.20 4.35 4.37 3.6 3.7 3.15 3.18
Other Flex 4.88 26.8 27.1 5.5 5.5 21.9 22.2
Other Rigid 5.20 19.3 19.3 3.7 3.7 14.1 14.1
TOTAL 15.6 67.9 68.3 4.3 4.4 52.3 52.7
Substitutes % Higher than Plastics 335% 338%
Plastic Results as % of Substitutes 23% 23%
Savings Equivalency
Thousands of rail cars of coal burned 29 29
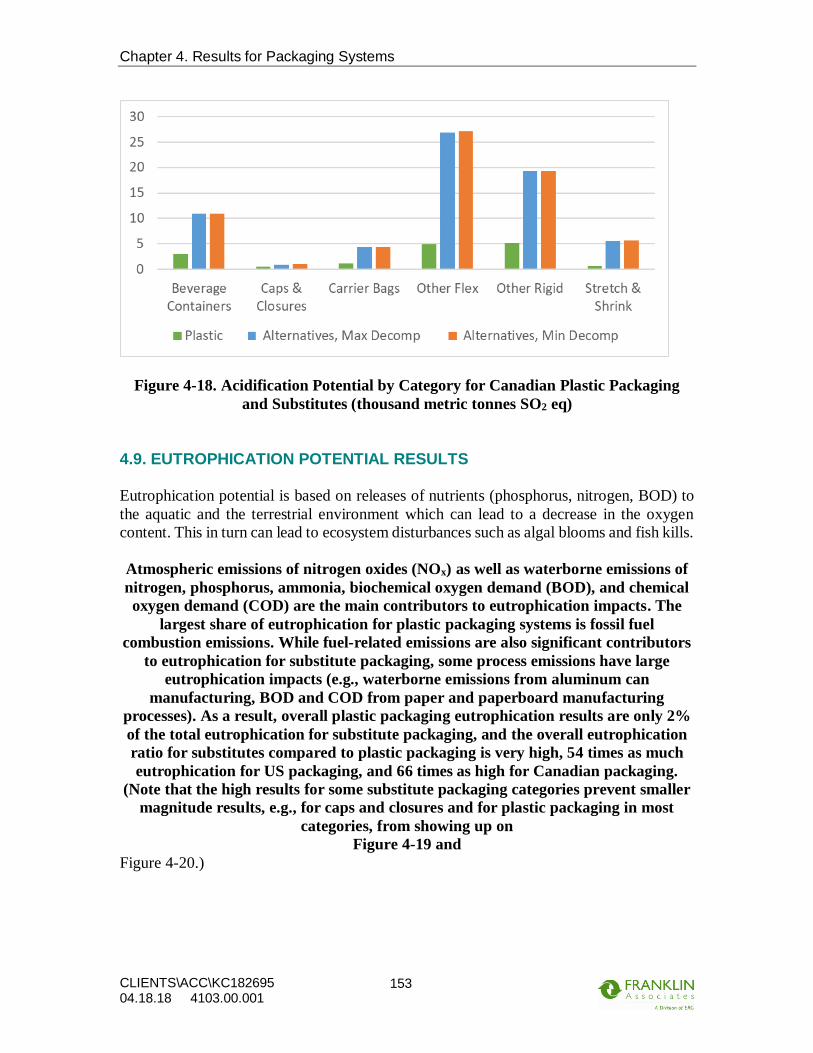
Chapter 4. Results for Packaging Systems
CLIENTS\ACC\KC182695 04.18.18 4103.00.001
153
Figure 4-18. Acidification Potential by Category for Canadian Plastic Packaging
and Substitutes (thousand metric tonnes SO2 eq)
4.9. EUTROPHICATION POTENTIAL RESULTS
Eutrophication potential is based on releases of nutrients (phosphorus, nitrogen, BOD) to
the aquatic and the terrestrial environment which can lead to a decrease in the oxygen
content. This in turn can lead to ecosystem disturbances such as algal blooms and fish kills.
Atmospheric emissions of nitrogen oxides (NOx) as well as waterborne emissions of
nitrogen, phosphorus, ammonia, biochemical oxygen demand (BOD), and chemical
oxygen demand (COD) are the main contributors to eutrophication impacts. The
largest share of eutrophication for plastic packaging systems is fossil fuel
combustion emissions. While fuel-related emissions are also significant contributors
to eutrophication for substitute packaging, some process emissions have large
eutrophication impacts (e.g., waterborne emissions from aluminum can
manufacturing, BOD and COD from paper and paperboard manufacturing
processes). As a result, overall plastic packaging eutrophication results are only 2%
of the total eutrophication for substitute packaging, and the overall eutrophication
ratio for substitutes compared to plastic packaging is very high, 54 times as much
eutrophication for US packaging, and 66 times as high for Canadian packaging.
(Note that the high results for some substitute packaging categories prevent smaller
magnitude results, e.g., for caps and closures and for plastic packaging in most
categories, from showing up on
Figure 4-19 and
Figure 4-20.)

Chapter 4. Results for Packaging Systems
CLIENTS\ACC\KC182695 04.18.18 4103.00.001
154
Table 4-18. Eutrophication Potential for US Plastic Packaging and Substitutes
(thousand metric tonnes N eq)
Table 4-19. Eutrophication Potential for Canadian Plastic Packaging and
Substitutes (thousand metric tonnes N eq)
Plastic
Packaging
Substitutes,
Max Decomp
Substitutes,
No Decomp
Ratio,
Max
Decomp
Ratio,
No
Decomp
Savings,
Max
Decomp
Savings,
No
Decomp
Caps & Closures 0.30 0.35 0.36 1.2 1.2 0.053 0.055
Beverage Containers 1.86 278 278 149 149 276 276
Stretch & Shrink 0.24 4.28 4.31 18 18 4.04 4.07
Carrier Bags 0.41 10.9 10.9 27 27 10.5 10.5
Other Flexible 1.57 14.6 14.8 9.3 9.4 13.0 13.2
Other Rigid 2.09 38.9 38.9 19 19 36.8 36.8
TOTAL 6.47 347 347 54 54 340 341
Substitutes % Higher than Plastics 5263% 5266%
Plastic Results as % of Substitutes 2% 2%
Plastic
Packaging
Substitutes,
Max Decomp
Substitutes,
No Decomp
Ratio,
Max
Decomp
Ratio,
No
Decomp
Savings,
Max
Decomp
Savings,
No
Decomp
Caps & Closures 0.018 0.020 0.020 1.1 1.1 0.0012 0.0012
Beverage Containers 0.16 30.5 30.5 196 196 30.4 30.4
Stretch & Shrink 0.024 0.45 0.45 19 19 0.43 0.43
Carrier Bags 0.036 1.11 1.11 31 31 1.07 1.08
Other Flex 0.17 1.71 1.71 10 10 1.54 1.54
Other Rigid 0.18 4.19 4.19 24 24 4.01 4.01
TOTAL 0.58 38.0 38.0 66 66 37.4 37.4
Substitutes % Higher than Plastics 6463% 6465%
Plastic Results as % of Substitutes 2% 2%

Chapter 4. Results for Packaging Systems
CLIENTS\ACC\KC182695 04.18.18 4103.00.001
155
Figure 4-19. Eutrophication Potential by Category for US Plastic Packaging and
Substitutes (thousand metric tonnes N eq)
Figure 4-20. Eutrophication Potential by Category for Canadian Plastic Packaging
and Substitutes (thousand metric tonnes N eq)
4.10. SMOG FORMATION POTENTIAL
Smog formation potential reflects the photochemical creation of reactive substances
(mainly ozone) in the lower atmosphere which affect human health and ecosystems. This
ground-level ozone is formed in the atmosphere by nitrogen oxides (NOx) and volatile
organic compounds (VOCs) in the presence of sunlight.
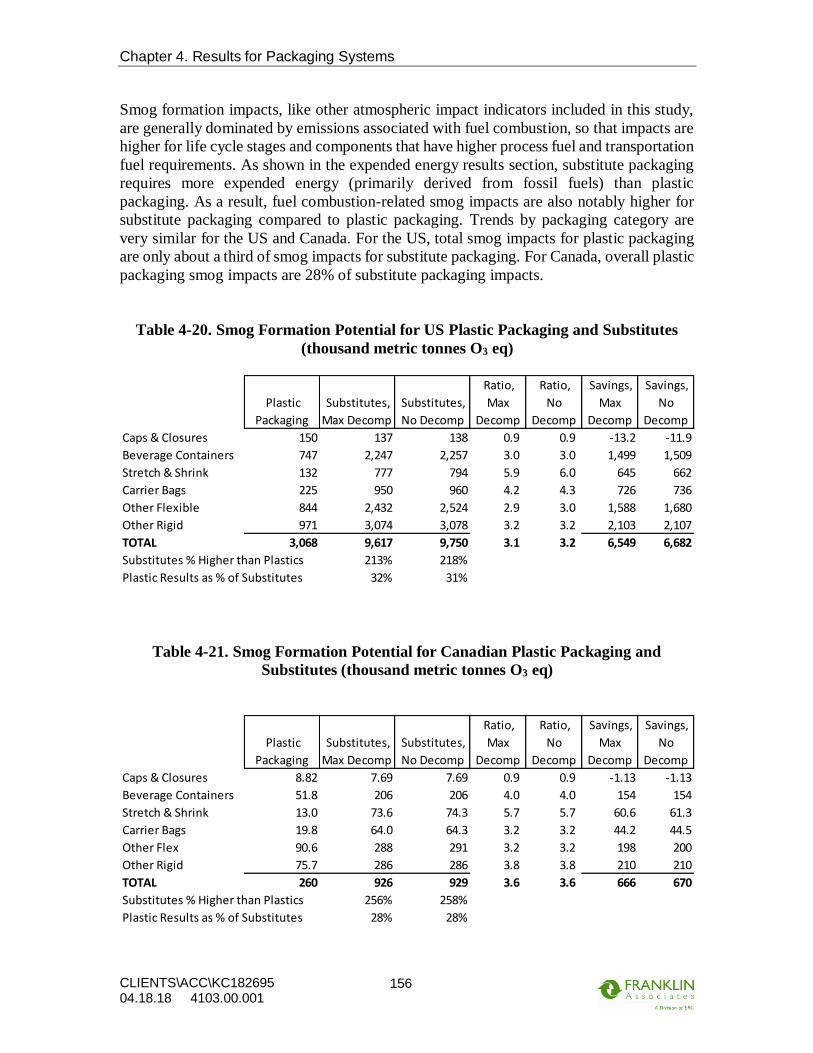
Chapter 4. Results for Packaging Systems
CLIENTS\ACC\KC182695 04.18.18 4103.00.001
156
Smog formation impacts, like other atmospheric impact indicators included in this study,
are generally dominated by emissions associated with fuel combustion, so that impacts are
higher for life cycle stages and components that have higher process fuel and transportation
fuel requirements. As shown in the expended energy results section, substitute packaging
requires more expended energy (primarily derived from fossil fuels) than plastic
packaging. As a result, fuel combustion-related smog impacts are also notably higher for
substitute packaging compared to plastic packaging. Trends by packaging category are
very similar for the US and Canada. For the US, total smog impacts for plastic packaging
are only about a third of smog impacts for substitute packaging. For Canada, overall plastic
packaging smog impacts are 28% of substitute packaging impacts.
Table 4-20. Smog Formation Potential for US Plastic Packaging and Substitutes
(thousand metric tonnes O3 eq)
Table 4-21. Smog Formation Potential for Canadian Plastic Packaging and
Substitutes (thousand metric tonnes O3 eq)
Plastic
Packaging
Substitutes,
Max Decomp
Substitutes,
No Decomp
Ratio,
Max
Decomp
Ratio,
No
Decomp
Savings,
Max
Decomp
Savings,
No
Decomp
Caps & Closures 150 137 138 0.9 0.9 -13.2 -11.9
Beverage Containers 747 2,247 2,257 3.0 3.0 1,499 1,509
Stretch & Shrink 132 777 794 5.9 6.0 645 662
Carrier Bags 225 950 960 4.2 4.3 726 736
Other Flexible 844 2,432 2,524 2.9 3.0 1,588 1,680
Other Rigid 971 3,074 3,078 3.2 3.2 2,103 2,107
TOTAL 3,068 9,617 9,750 3.1 3.2 6,549 6,682
Substitutes % Higher than Plastics 213% 218%
Plastic Results as % of Substitutes 32% 31%
Plastic
Packaging
Substitutes,
Max Decomp
Substitutes,
No Decomp
Ratio,
Max
Decomp
Ratio,
No
Decomp
Savings,
Max
Decomp
Savings,
No
Decomp
Caps & Closures 8.82 7.69 7.69 0.9 0.9 -1.13 -1.13
Beverage Containers 51.8 206 206 4.0 4.0 154 154
Stretch & Shrink 13.0 73.6 74.3 5.7 5.7 60.6 61.3
Carrier Bags 19.8 64.0 64.3 3.2 3.2 44.2 44.5
Other Flex 90.6 288 291 3.2 3.2 198 200
Other Rigid 75.7 286 286 3.8 3.8 210 210
TOTAL 260 926 929 3.6 3.6 666 670
Substitutes % Higher than Plastics 256% 258%
Plastic Results as % of Substitutes 28% 28%
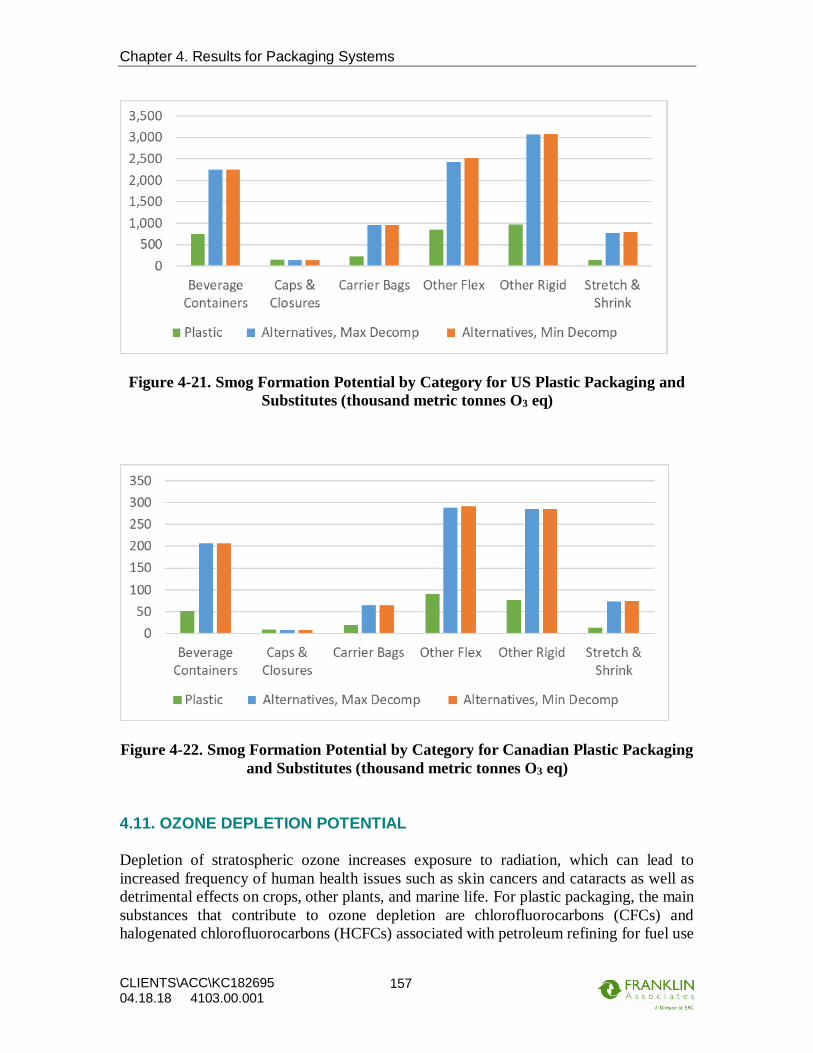
Chapter 4. Results for Packaging Systems
CLIENTS\ACC\KC182695 04.18.18 4103.00.001
157
Figure 4-21. Smog Formation Potential by Category for US Plastic Packaging and
Substitutes (thousand metric tonnes O3 eq)
Figure 4-22. Smog Formation Potential by Category for Canadian Plastic Packaging
and Substitutes (thousand metric tonnes O3 eq)
4.11. OZONE DEPLETION POTENTIAL
Depletion of stratospheric ozone increases exposure to radiation, which can lead to
increased frequency of human health issues such as skin cancers and cataracts as well as
detrimental effects on crops, other plants, and marine life. For plastic packaging, the main
substances that contribute to ozone depletion are chlorofluorocarbons (CFCs) and
halogenated chlorofluorocarbons (HCFCs) associated with petroleum refining for fuel use

Chapter 4. Results for Packaging Systems
CLIENTS\ACC\KC182695 04.18.18 4103.00.001
158
and for use as feedstock material for plastic resins. Ozone depleting emissions from
petroleum refining also drive the impacts associated with transportation energy use. For
paper and paperboard packaging, emissions released from combustion of wood fuel in
boilers at paper mills also make significant contribution to ozone depletion results.
Table 4-22 and Table 4-23 show that ozone depletion results are not significantly affected
by decomposition assumptions for substitute packaging. Trends in ozone depletion results
are very similar for the US and Canada, as shown in
Figure 4-23 and
Figure 4-24.
Table 4-22. Ozone Depletion Potential for US Plastic Packaging and Substitutes
(metric tonnes CFC-11 eq)
Table 4-23. Ozone Depletion Potential for Canadian Plastic Packaging and
Substitutes (metric tonnes CFC-11 eq)
Plastic
Packaging
Substitutes,
Max Decomp
Substitutes,
No Decomp
Ratio,
Max
Decomp
Ratio,
No
Decomp
Savings,
Max
Decomp
Savings,
No
Decomp
Caps & Closures 0.024 0.0071 0.0071 0.3 0.3 -0.017 -0.017
Beverage Containers 0.055 0.36 0.36 6.6 6.6 0.31 0.31
Stretch & Shrink 0.041 0.14 0.14 3.4 3.4 0.097 0.097
Carrier Bags 0.024 0.17 0.17 7.4 7.4 0.15 0.15
Other Flexible 0.18 0.77 0.77 4.2 4.2 0.58 0.58
Other Rigid 0.083 0.11 0.11 1.4 1.4 0.032 0.032
TOTAL 0.41 1.56 1.56 3.8 3.8 1.15 1.15
Substitutes % Higher than Plastics 282% 282%
Plastic Results as % of Substitutes 26% 26%
Plastic
Packaging
Substitutes,
Max Decomp
Substitutes,
No Decomp
Ratio,
Max
Decomp
Ratio,
No
Decomp
Savings,
Max
Decomp
Savings,
No
Decomp
Caps & Closures 0.0019 4.0E-04 4.0E-04 0.2 0.2 -0.0015 -0.0015
Beverage Containers 0.0047 0.035 0.035 7.5 7.5 0.031 0.031
Stretch & Shrink 0.0051 0.016 0.016 3.1 3.1 0.011 0.011
Carrier Bags 0.0020 0.018 0.018 8.8 8.8 0.016 0.016
Other Flex 0.024 0.092 0.092 3.9 3.9 0.069 0.069
Other Rigid 0.0090 0.0098 0.0098 1.1 1.1 8.1E-04 8.1E-04
TOTAL 0.046 0.17 0.17 3.7 3.7 0.13 0.13
Substitutes % Higher than Plastics 270% 271%
Plastic Results as % of Substitutes 27% 27%
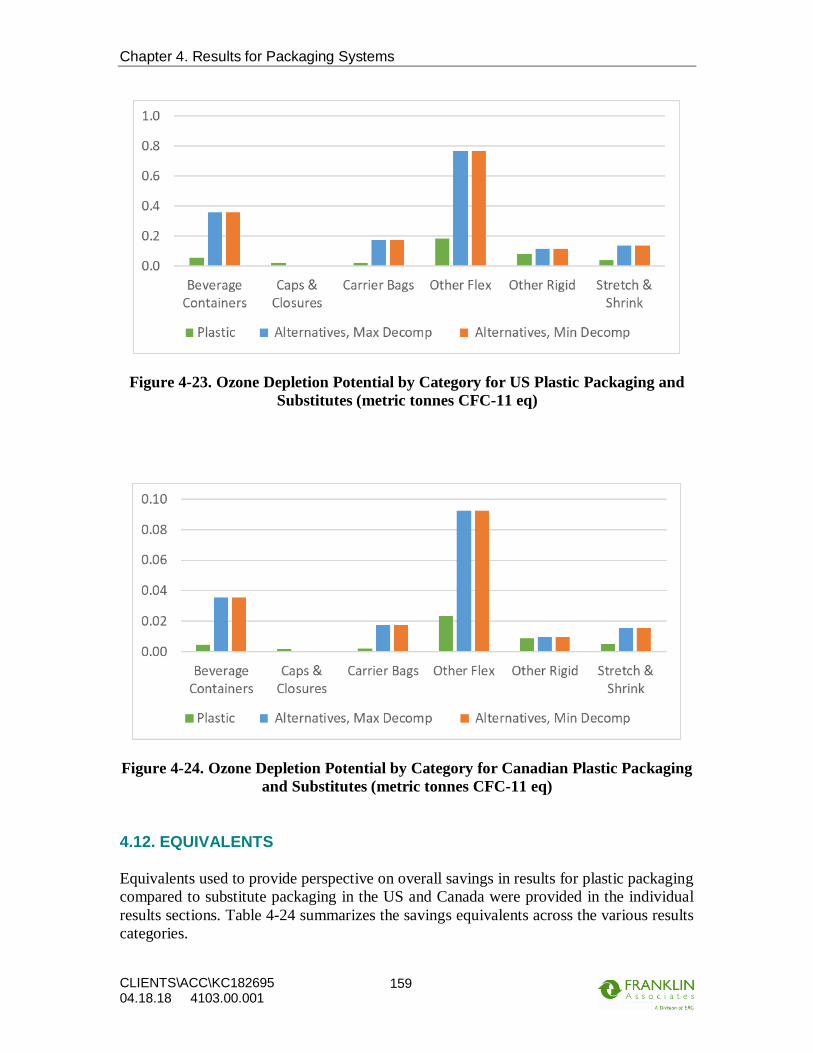
Chapter 4. Results for Packaging Systems
CLIENTS\ACC\KC182695 04.18.18 4103.00.001
159
Figure 4-23. Ozone Depletion Potential by Category for US Plastic Packaging and
Substitutes (metric tonnes CFC-11 eq)
Figure 4-24. Ozone Depletion Potential by Category for Canadian Plastic Packaging
and Substitutes (metric tonnes CFC-11 eq)
4.12. EQUIVALENTS
Equivalents used to provide perspective on overall savings in results for plastic packaging
compared to substitute packaging in the US and Canada were provided in the individual
results sections. Table 4-24 summarizes the savings equivalents across the various results
categories.

Chapter 4. Results for Packaging Systems
CLIENTS\ACC\KC182695 04.18.18 4103.00.001
160
Table 4-24. Savings Equivalents for Plastic Packaging Compared to Substitutes
4.13. SUMMARY
The results of this substitution analysis provide a snapshot of the environmental impacts of
the current overall mix of plastic packaging in several categories, and the environmental
impacts of the overall mix of alternative types of packaging that might be used as
substitutes. Results are presented for broad categories of packaging and do not make
comparative assertions as defined by ISO 14040 regarding individual competing plastic
and alternative packages. The analysis is intended to provide information regarding the
overall potential impacts of a theoretical plastic packaging substitution scenario and is not
intended to be used as the basis for comparative environmental claims or purchasing
decisions regarding specific packaging products.
Plastic packaging has many properties that are vitally important for packaging applications,
including light weight, flexibility, durability, cushioning, and barrier properties, to name a
few. This substitution analysis demonstrates that plastic packaging is also an efficient
choice in terms of environmental impacts.
For the six packaging categories analyzed – caps and closures, beverage containers, stretch
and shrink film, carrier bags, other rigid packaging, and other flexible packaging –14.4
million metric tonnes of plastic packaging were used in the US in 2010. If other types of
packaging were used to substitute US plastic packaging, more than 64 million metric
tonnes of packaging would be required. The substitute packaging would result in
significantly higher impacts for all results categories evaluated: total energy demand,
expended energy, water consumption, solid waste by weight and by volume, global
warming potential, acidification, eutrophication, smog formation, and ozone depletion, as
shown previously in Figure 4-1.
Canadian plastic packaging use was approximately 1.6 million metric tonnes in the same
time frame. To provide the same service as this amount of plastic packaging, more than 7.1
million metric tonnes of other packaging materials would be needed. As was shown in
Figure 4-2, plastic packaging in Canada has notably lower results than substitute packaging
for all 10 results categories evaluated.
Results Category Equivalence FactorMillion passenger vehicles per year 18 18 1.8 1.8
Thousand tanker trucks of gasoline 1,073 1,108 108 110
Million passenger vehicles per year 14 8.5 1.9 0.8
Thousand tanker trucks of gasoline 889 523 115 48
Water Consumption Thousand Olympic swimming pools 461 467 54 55
Solid Waste by Weight Thousand 747 airplanes 290 291 22 22
Solid Waste by Volume U.S. Capitol Rotundas 1,496 1,505 101 102 Acidification Thousand railcars of coal 292 301 29 29
Total Energy
Global Warming
Potential
US Savings Canadian Savings
Plastics
compared to
Substitutes
with Max
Decomp
Plastics
compared to
Substitutes
with No
Decomp
Plastics
compared to
Substitutes
with Max
Decomp
Plastics
compared to
Substitutes
with No
Decomp
Recommended


![Innovations in Plastic Food Packaging T - Design · • 73 g by Claire oelsc Sand [PACKAGING] Innovations in Plastic Food Packaging T he machinery and materials for producing plastic](https://img.pdfslide.us/doc/110x75/5b82763a7f8b9a32738e9f3d/innovations-in-plastic-food-packaging-t-73-g-by-claire-oelsc-sand-packaging.jpg)