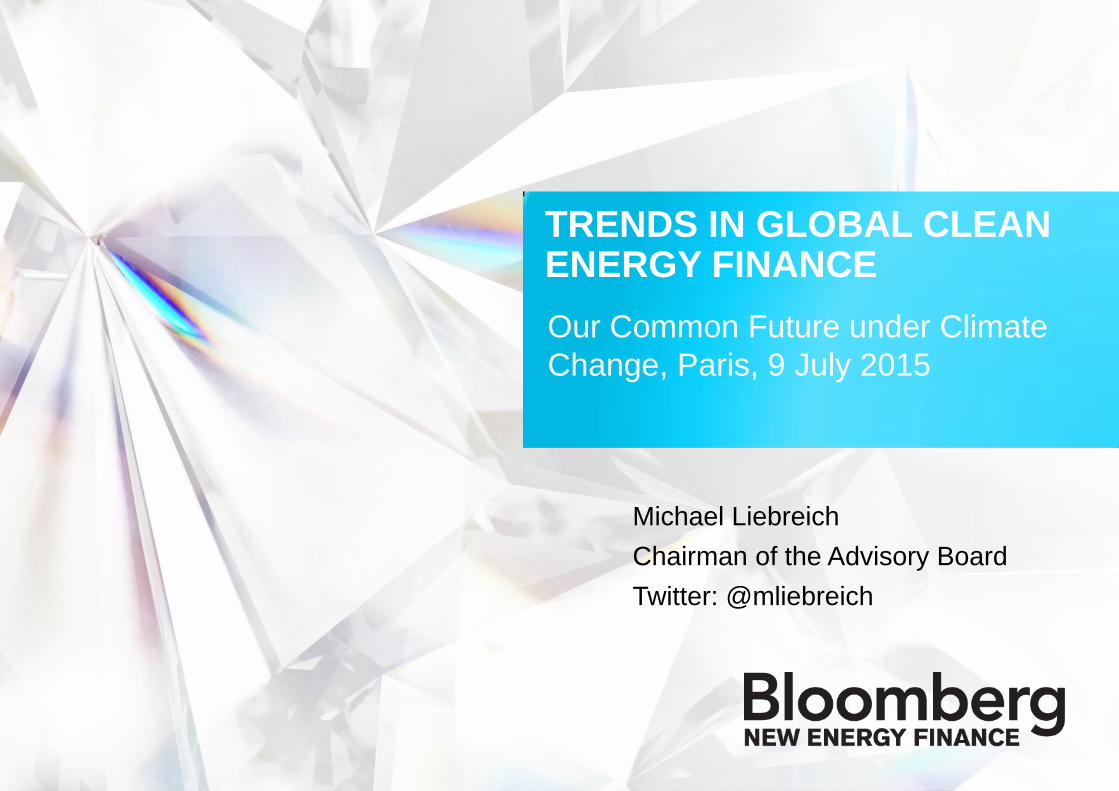
TRENDS IN GLOBAL CLEAN ENERGY FINANCE
Michael Liebreich
Chairman of the Advisory Board
Twitter: @mliebreich
Our Common Future under Climate
Change, Paris, 9 July 2015
1 Michael Liebreich Our Common Future under Climate Change, Paris, 9 July 2015 @MLiebreich
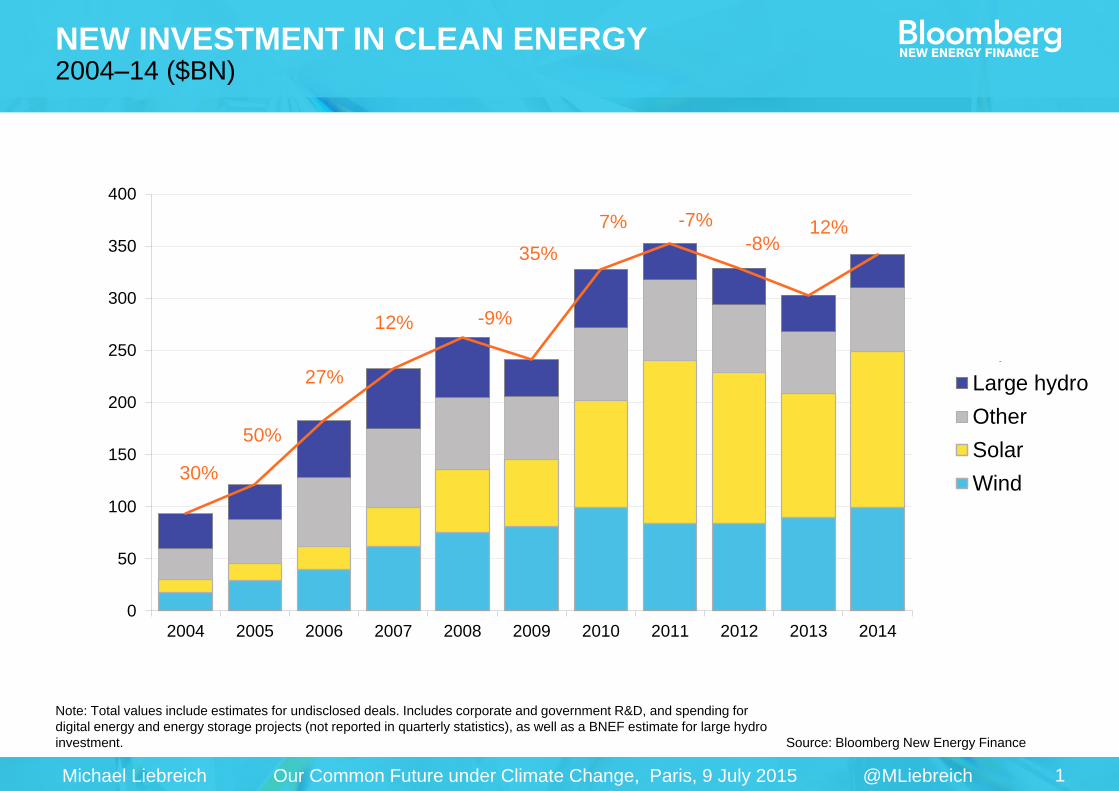
Note: Total values include estimates for undisclosed deals. Includes corporate and government R&D, and spending for
digital energy and energy storage projects (not reported in quarterly statistics), as well as a BNEF estimate for large hydro
investment. Source: Bloomberg New Energy Finance
NEW INVESTMENT IN CLEAN ENERGY 2004–14 ($BN)
0
50
100
150
200
250
300
350
400
2004 2005 2006 2007 2008 2009 2010 2011 2012 2013 2014
30%
50%
27%
12% -9%
35%
7% -7%
-8%12%
0
100
200
300
400
500
600
2004 2005 2006 2007 2008 2009 2010 2011 2012 2013 20142015 Q1
Expected
Large hydro
Other
Solar
Wind

2 Michael Liebreich Our Common Future under Climate Change, Paris, 9 July 2015 @MLiebreich
TOTAL INVESTMENTS PER TECHNOLOGY, 2015-40 (US$ REAL)
Source: Bloomberg New Energy Finance
RENEWABLES TAKE
65% OF THE $12.2
TRILLION POWER
INVESTMENT TO 2040

3 Michael Liebreich Our Common Future under Climate Change, Paris, 9 July 2015 @MLiebreich
Emissions must be cut 40-70% by mid-century
and phased out entirely by 2100
G7 JUNE 2015 – SCHLOSS ELMAU
Picture: Wikimedia

4 Michael Liebreich Our Common Future under Climate Change, Paris, 9 July 2015 @MLiebreich
There is an urgent need to
develop sources of
renewable energy.
LAUDATO SI – DEMAND SIDE
Pope Francis
Picture: Wikimedia

5 Michael Liebreich Our Common Future under Climate Change, Paris, 9 July 2015 @MLiebreich
Source: The Economist
THE ECONOMIST COVER, “SHEIKHS VERSUS SHALE” DECEMBER 2014

6 Michael Liebreich Our Common Future under Climate Change, Paris, 9 July 2015 @MLiebreich
Note: Prices are in real (2014) USD Source: Bloomberg New Energy Finance, Maycock
SOLAR PV EXPERIENCE CURVE (US$/W)
1988
1976
1998
2004
2014
2008
0,1
1
10
100
1 10 100 1 000 10 000 100 000 1 000 000 10 000 000
Cumulative production (MW)
SOLAR PV MODULE
COSTS HAVE FALLEN
99% SINCE 1976
80% SINCE 2008

7 Michael Liebreich Our Common Future under Climate Change, Paris, 9 July 2015 @MLiebreich
Source: Bloomberg New Energy Finance
6-CENT SOLAR – THE NEW NORMAL?
Name:
Team:
Event:
Date:
Record:
Usain Bolt
Jamaica
100m
August 2008
9.58 seconds
Name:
Team:
Event:
Date:
Record:
Paddy Padmanathan
ACWA Power
Solar PV
January 2015
US$5.84c

8 Michael Liebreich Our Common Future under Climate Change, Paris, 9 July 2015 @MLiebreich
NEW INVESTMENT IN CLEAN ENERGY 2004-2014 ($BN)
Note: Does not include carbon capture and storage
0.6 0.8 1.2 2.5 2.6 1.7 4.5 3.2 10.9 9.513.6
04 05 06 07 08 09 10 11 12 13 14
Middle East & Africa
27.738.1
51.872.6
87.5 89.0
119.2129.1
98.3
66.0 66.5
04 05 06 07 08 09 10 11 12 13 14
Europe
18.425.330.940.9
52.365.0
78.798.3
113.2126.5
154.3
04 05 06 07 08 09 10 11 12 13 14
Asia & Oceania
11.819.037.345.546.839.5
55.372.6
59.055.460.8
04 05 06 07 08 09 10 11 12 13 14
North America & Caribbean
1.5 4.5 6.9 13.1 15.8 10.7 13.8 13.4 12.5 10.2 14.6
04 05 06 07 08 09 10 11 12 13 14
Central & South America
Source: Bloomberg New Energy Finance
9 Michael Liebreich Our Common Future under Climate Change, Paris, 9 July 2015 @MLiebreich
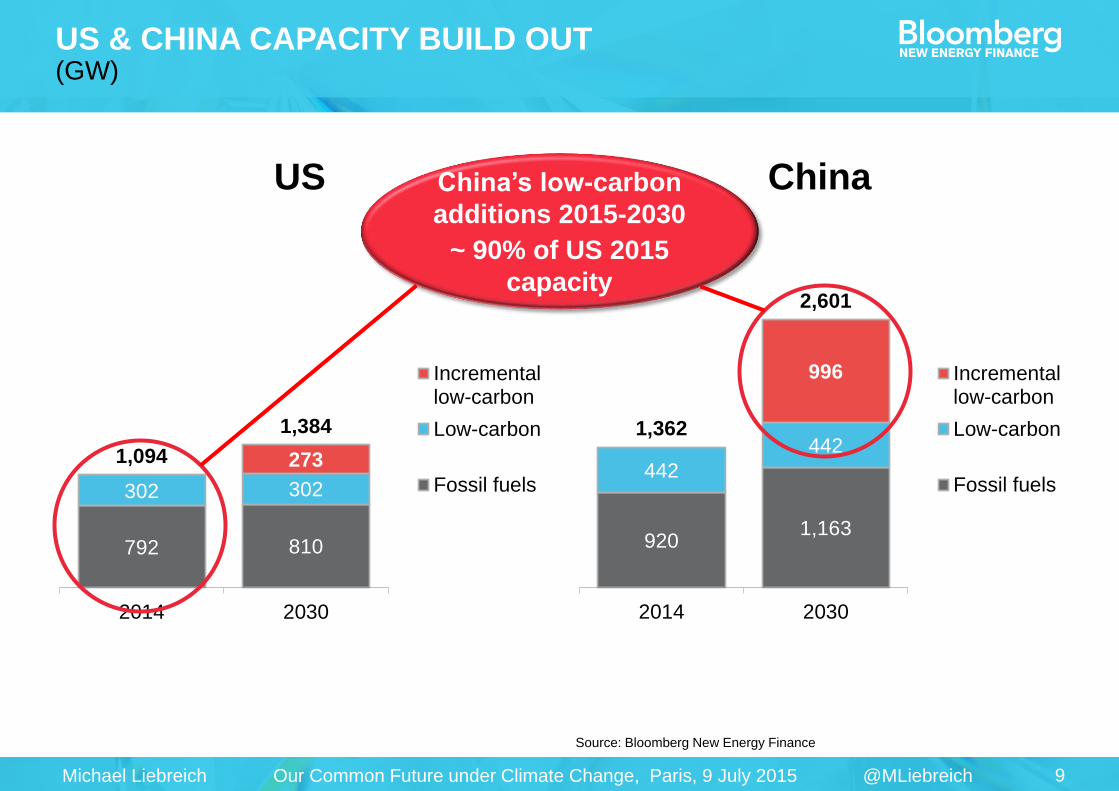
US & CHINA CAPACITY BUILD OUT (GW)
Source: Bloomberg New Energy Finance
US China
9201,163
442
442
996
1,362
2,601
2014 2030
Incrementallow-carbon
Low-carbon
Fossil fuels
792 810
302 302
2731,094
1,384
2014 2030
Incrementallow-carbon
Low-carbon
Fossil fuels
China’s low-carbon
additions 2015-2030
~ 90% of US 2015
capacity

10 Michael Liebreich Our Common Future under Climate Change, Paris, 9 July 2015 @MLiebreich
RENEWABLES IN INDIA, 2006–22 (GW)
0
50
100
150
200
250
Upto2006
2008 2010 2012 2014 2016 2018 2020 2022
Solar 0.6GW/year
Wind 2.0GW/year

11 Michael Liebreich Our Common Future under Climate Change, Paris, 9 July 2015 @MLiebreich
Source: Bloomberg New Energy Finance
RENEWABLES IN INDIA, 2006–22 (GW)
0
50
100
150
200
250
Upto2006
2008 2010 2012 2014 2016 2018 2020 2022
Solar 0.6GW/year
Wind 2.0GW/year
Solar 6 GW/year
Wind 3 GW/year

12 Michael Liebreich Our Common Future under Climate Change, Paris, 9 July 2015 @MLiebreich
Source: Bloomberg New Energy Finance
RENEWABLES IN INDIA, 2006–22 (GW)
0
50
100
150
200
250
Upto2006
2008 2010 2012 2014 2016 2018 2020 2022
Solar 0.6GW/year
Wind 2.0GW/year
Solar 6 GW/year
Wind 3 GW/year
X
Modi target:
Solar 12 GW/year
Wind 8 GW/year

13 Michael Liebreich Our Common Future under Climate Change, Paris, 9 July 2015 @MLiebreich
RENEWABLES GENERATION CUMULATIVE CAPACITY 2020 – 2040
0GW
1,000GW
2,000GW
3,000GW
4,000GW
5,000GW
6,000GW
7,000GW
8,000GW
2020 2030 2040
IEA 450
IEA Current Policies
IEA New Policies
World EnergyCouncil Symphony
World EnergyCouncil Jazz
BNEF
Source: Bloomberg New Energy Finance, World Energy Council, IEA
RENEWABLE CAPACITY
UNDER NEO WILL BE 50%
HIGHER IN 2040 THAN IEA
NEW POLICIES SCENARIO

14 Michael Liebreich Our Common Future under Climate Change, Paris, 9 July 2015 @MLiebreich
MAJOR GLOBAL SHALE FIELDS
Source: EIA Assessment of World Shale Gas Resources, April
2011 Note: Technically recoverable shale gas resources shown
Canada
Brazil
Poland Norway
China
Australia
South Africa 200 trillion
cubic feet
USA
Mexico
Libya
Algeria
Argentina
UK

15 Michael Liebreich Our Common Future under Climate Change, Paris, 9 July 2015 @MLiebreich
Note: For the underlying data to this chart, go to BI LNGGG<GO> Source: Bloomberg New Energy Finance
LNG EXPORT CAPACITY BY COUNTRY/REGION (MMTPA)
0
100
200
300
400
500
600
700
800
200
8
200
9
201
0
201
1
201
2
201
3
201
4
201
5
201
6
201
7
201
8
201
9
202
0
Other
North America
Russia
East Africa
West Africa
Australia
Other
North America
Russia
West Africa
North Africa
Indonesia
Malaysia
Australia
Qatar
Demand
Pre
-FID
O
pe
rati
on
al,
un
de
r c
on
str
uc
tio
no
r p
os
t-F
ID

16 Michael Liebreich Our Common Future under Climate Change, Paris, 9 July 2015 @MLiebreich
0
2
4
6
8
10
12
14
16
18
20
2004 2005 2006 2007 2008 2009 2010 2011 2012 2013 2014 2015
Note: Japan-Korea Marker is based on broker assessments of the spot price of un-contracted LNG cargoes delivered into
the Northeast Asia market.
Source: Bloomberg New Energy Finance,
ICAP, Platts
OIL AND GAS PRICES: HENRY HUB, NBP, BAFA, AND NE LNG, 2004–15 (US$/MMBTU)
0
2
4
6
8
10
12
14
16
18
20
NBP (UK)
Henry Hub (US)
BAFA (Germanyborder price forRussian gas)
North East Asia LNG
~ $5 spread to
Henry Hub?
17 Michael Liebreich Our Common Future under Climate Change, Paris, 9 July 2015 @MLiebreich
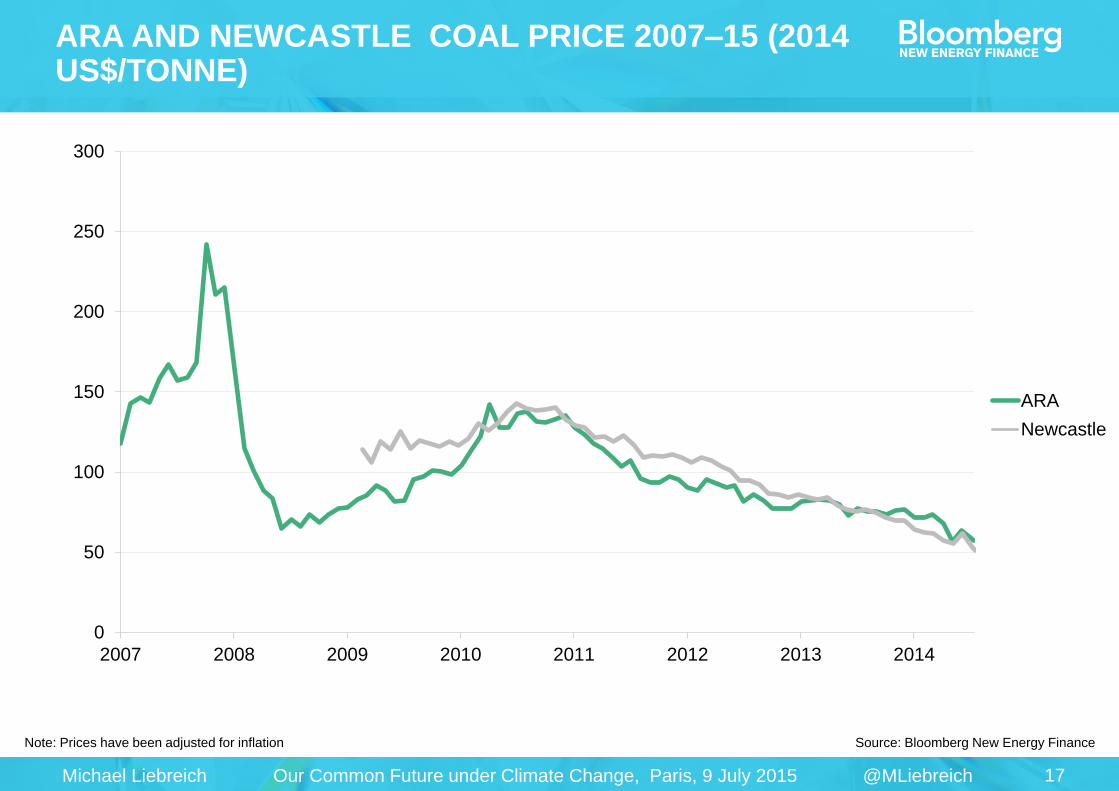
Note: Prices have been adjusted for inflation Source: Bloomberg New Energy Finance
ARA AND NEWCASTLE COAL PRICE 2007–15 (2014 US$/TONNE)
0
50
100
150
200
250
300
2007 2008 2009 2010 2011 2012 2013 2014
0
50
100
150
200
250
300
2007 2008 2009 2010 2011 2012 2013 2014
ARA
Newcastle
18 Michael Liebreich Our Common Future under Climate Change, Paris, 9 July 2015 @MLiebreich
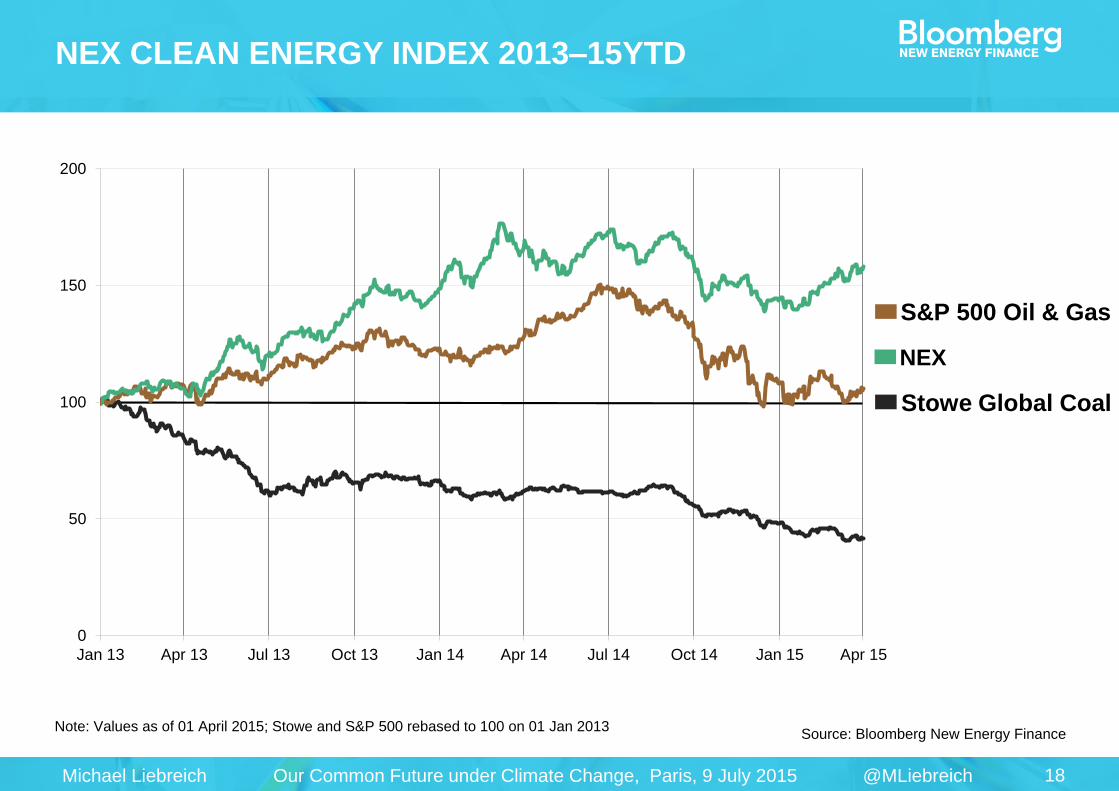
Note: Values as of 01 April 2015; Stowe and S&P 500 rebased to 100 on 01 Jan 2013 Source: Bloomberg New Energy Finance
NEX CLEAN ENERGY INDEX 2013–15YTD
0
50
100
150
200
Jan 13 Apr 13 Jul 13 Oct 13 Jan 14 Apr 14 Jul 14 Oct 14 Jan 15 Apr 15
S&P 500 Oil & Gas
Stowe Global Coal
NEX

19 Michael Liebreich Our Common Future under Climate Change, Paris, 9 July 2015 @MLiebreich
NUCLEAR POWER PLANTS – HISTORIC CONSTRUCTION
0
1
2
3
4
5
6
1
Chart Title
0-10
11-19
20-39
40-59
60+
Source: Bloomberg New Energy Finance; IAEA, World Nuclear Association
566 nuclear
power stations
ever built
20 Michael Liebreich Our Common Future under Climate Change, Paris, 9 July 2015 @MLiebreich
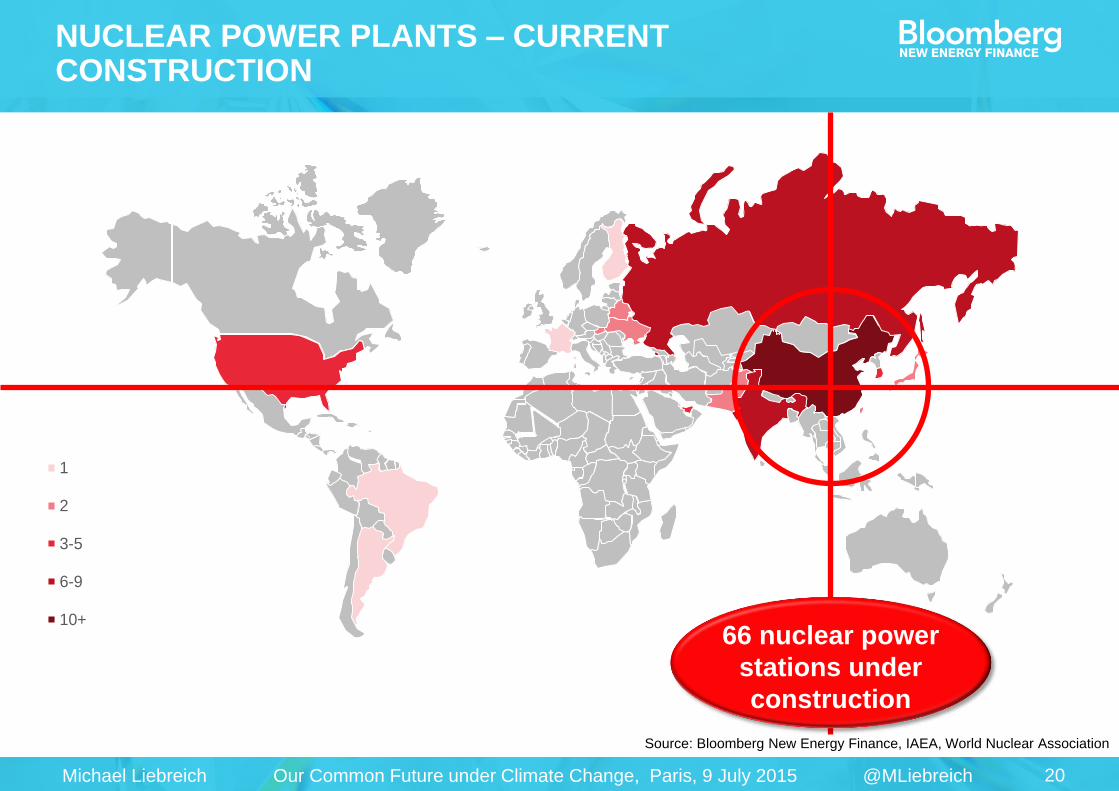
Chart Title
1
2
3-5
6-9
10+
Source: Bloomberg New Energy Finance, IAEA, World Nuclear Association
66 nuclear power
stations under
construction
NUCLEAR POWER PLANTS – CURRENT CONSTRUCTION
21 Michael Liebreich Our Common Future under Climate Change, Paris, 9 July 2015 @MLiebreich
There is still a need to
develop adequate storage
technologies.
LAUDATO SI – INTEGRATION
Pope Francis Picture: Wikimedia

22 Michael Liebreich Our Common Future under Climate Change, Paris, 9 July 2015 @MLiebreich
ENERGY RETAIL BATTLEFIELD
HIVE home
heating
controls
Smart
thermostats to
reduce churn
Virtual mobile
operator – 80k
customers
Smart home
partnerships/investment
IHD and smart
thermostat
program
BEMS for DR
and energy
efficiency
Smart thermostats
and load
disaggregation
Integrated smart
homes
Smart
lighting /
home
automation
Smart
thermostats and
‘behavioural’ DR
Residential
energy
storage
HEM tools
and DR
Home energy
management
Behavioural
engagement
Smart thermostats,
home automation
Load disaggregation
Solar PV and
energy monitoring
HEM tools
Smart
thermostats
Smart
thermostats Connected
home / IoT
Load
disaggregation
Heating controls
Home
automation
HomeKit
1m connected
home
customers
Digital Life
connected
home service
Smart home
platform
(AT&T)
Nest
acquisition
Smart home
hubs
HEMS
platform
DR and retail
services
Energy supply
and services
Registered
energy supplier
Home
automation
Home automation
???
Bundled electricity
telecoms services
Bundled electricity,
entertainment and
home automation
Bundled telecoms
and energy
Bundled telecoms,
energy. Residential
energy storage.
Bundled telecoms,
electricity supply
beginning in 2016
Bundled insurance,
telecoms and energy
Bundled telecoms,
electricity and gas
23 Michael Liebreich Our Common Future under Climate Change, Paris, 9 July 2015 @MLiebreich
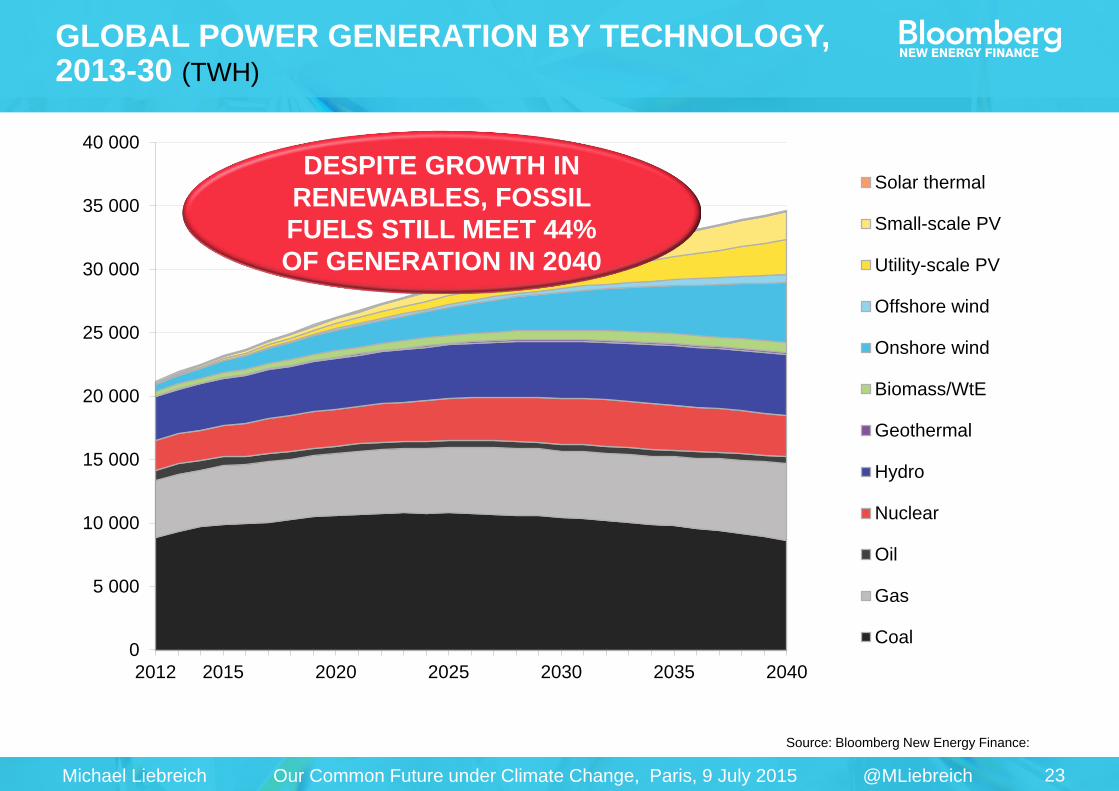
GLOBAL POWER GENERATION BY TECHNOLOGY, 2013-30 (TWH)
0
5 000
10 000
15 000
20 000
25 000
30 000
35 000
40 000
2012 2015 2020 2025 2030 2035 2040
Solar thermal
Small-scale PV
Utility-scale PV
Offshore wind
Onshore wind
Biomass/WtE
Geothermal
Hydro
Nuclear
Oil
Gas
Coal
Source: Bloomberg New Energy Finance:
DESPITE GROWTH IN
RENEWABLES, FOSSIL
FUELS STILL MEET 44%
OF GENERATION IN 2040

Unique analysis, tools and data for decision-makers
driving change in the energy system
MARKETS Renewable Energy
Energy Smart Technologies
Advanced Transport
Gas
Carbon and RECs
SERVICES Americas Service
Asia Pacific Service
EMEA Service
Applied Research
Events and Workshops
Michael Liebreich
Twitter: @mliebreich
Thanks!
Recommended