INTERNATIONAL ENERGY AGENCY AGENCE INTERNATIONALE DE L’ENERGIE
© OECD/IEA 2008
Liberalised electricity market
experience in OECD countries
Francois Nguyen
Senior Policy Advisor - Electricity
Office of Long Term Co-operation and Policy Analysis
Regulatory Reform Review
Working Group Seminar
Beijing - 28 March 2008

INTERNATIONAL ENERGY AGENCY AGENCE INTERNATIONALE DE L’ENERGIE
© OECD/IEA 2008
Outline
Introduction
Global energy challenges
Evolving electricity market structure
Security of supply and market delivery of
investments
Marginal pricing and competitive market
regulation
Empowering consumers for demand
participation
Conclusions
INTERNATIONAL ENERGY AGENCY AGENCE INTERNATIONALE DE L’ENERGIE
© OECD/IEA 2008
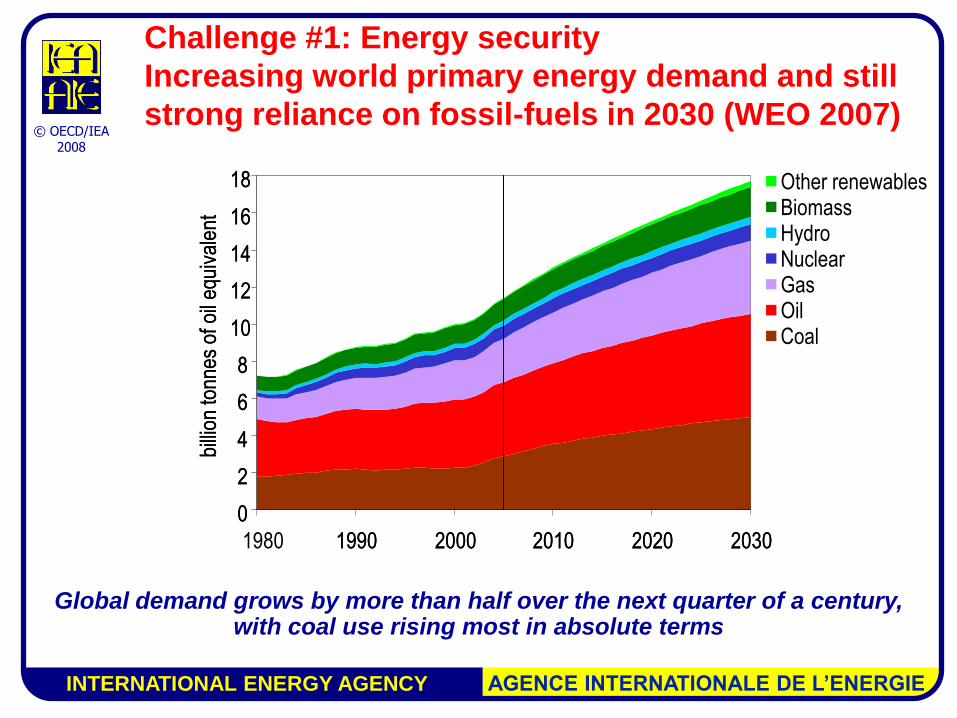
Challenge #1: Energy security
Increasing world primary energy demand and still
strong reliance on fossil-fuels in 2030 (WEO 2007)
Global demand grows by more than half over the next quarter of a century, with coal use rising most in absolute terms
0
2
4
6
8
10
12
14
16
18
1980 1990 2000 2010 2020 2030
billi
on to
nnes
of o
il eq
uiva
lent
0
2
4
6
8
10
12
14
16
18
1990 2000 2010 2020 2030
billi
on to
nnes
of o
il eq
uiva
lent
Other renewablesBiomassHydroNuclearGasOilCoal

INTERNATIONAL ENERGY AGENCY AGENCE INTERNATIONALE DE L’ENERGIE
© OECD/IEA 2008
Challenge #2: Energy investments
Huge investments will be required over the period
to 2030
0 1 000 2 000 3 000 4 000 5 000
OECD North America
China
OECD Europe
Transition economies
Middle East
Latin America
Africa
Rest of developing Asia
India
OECD Pacific
Inter regional transport
billion dollars (2006)
CoalOilGasElectricity
0 1 000 2 000 3 000 4 000 5 000
-
billion dollars (2006)
CoalOilGasElectricity
China and India account for 22 % of global energy investments

INTERNATIONAL ENERGY AGENCY AGENCE INTERNATIONALE DE L’ENERGIE
© OECD/IEA 2008
Challenge # 3: Climate change
CO2 emissions are on an unsustainable path
Stabilising greenhouse-gas concentration at 450 ppm would require
emissions to be reduced to 23 Gt in 2030
10
15
20
25
30
35
40
45
2005 2010 2015 2020 2025 2030
Gt o
f CO
2
CCS in industry - 3%CCS in power generation - 9%Nuclear - 13%
Renewables - 20%
Switching from coal to gas - 8%End Use electricity efficiency - 17%
End Use fuel efficiency - 30%
Reference Scenario
42 Gt
450 Stabilisation Case
23 Gt
27 Gt
Energy-Related CO2 Emissions

INTERNATIONAL ENERGY AGENCY AGENCE INTERNATIONALE DE L’ENERGIE
© OECD/IEA 2008
Evolving market structure:
Before reform
Centralised
investment decisions
Investment driven by
economies of scale
All risks and costs
passed-through
Regulated return on
investments
Vertically Integrated Utility
•Generation
•Transmission
•Distribution
Customers
Few incentives for efficiency, innovation or least-cost risk management

INTERNATIONAL ENERGY AGENCY AGENCE INTERNATIONALE DE L’ENERGIE
© OECD/IEA 2008
Evolving market structure:
After reform
Competitive generation
Generation investments
driven by risk/return
equation
T&D remain regulated
Unbundling limits pass -
through
Strong incentives for least-
cost risk management
Generators
Customers
T& D and related network services
LDC/ Retailers

INTERNATIONAL ENERGY AGENCY AGENCE INTERNATIONALE DE L’ENERGIE
© OECD/IEA 2008
Transmission in liberalised markets
Before Connect large scale generation
sources to load centers
Means to achieve economies of scale
Often a complement to generation
Planning is centralised and well coordinated
Reliability investments
After Connect diversified generation
sources to load centers
Means to achieve energy diversification and competitive markets – open and non discriminatory access
Can be a substitute to generation
Planning is more complex
Reliability and economic investments

INTERNATIONAL ENERGY AGENCY AGENCE INTERNATIONALE DE L’ENERGIE
© OECD/IEA 2008
“Unbundling” security of supply
Reliability of electricity supply
Energy security
Coal, natural gas, uranium...
Adequacy System security
Generation capacity,
transmission and
distribution networks
Operation, control,
contingency management...
INTERNATIONAL ENERGY AGENCY AGENCE INTERNATIONALE DE L’ENERGIE
© OECD/IEA 2008
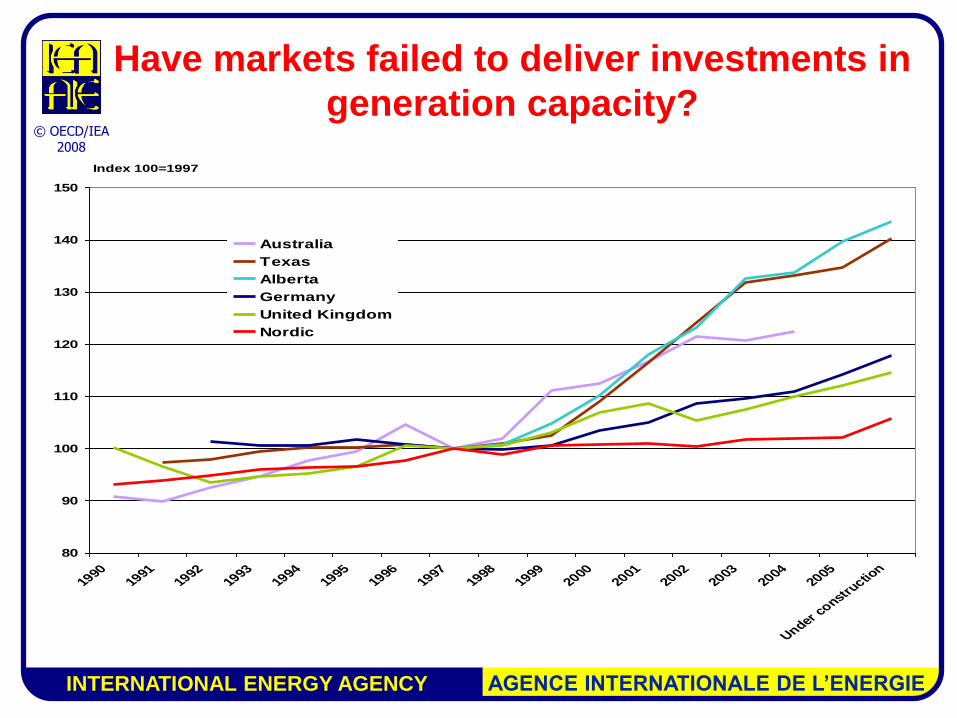
Have markets failed to deliver investments in
generation capacity?
80
90
100
110
120
130
140
150
19901991
19921993
19941995
19961997
19981999
20002001
20022003
20042005
Under constru
ction
Australia
Texas
Alberta
Germany
United Kingdom
Nordic
Index 100=1997
INTERNATIONAL ENERGY AGENCY AGENCE INTERNATIONALE DE L’ENERGIE
© OECD/IEA 2008
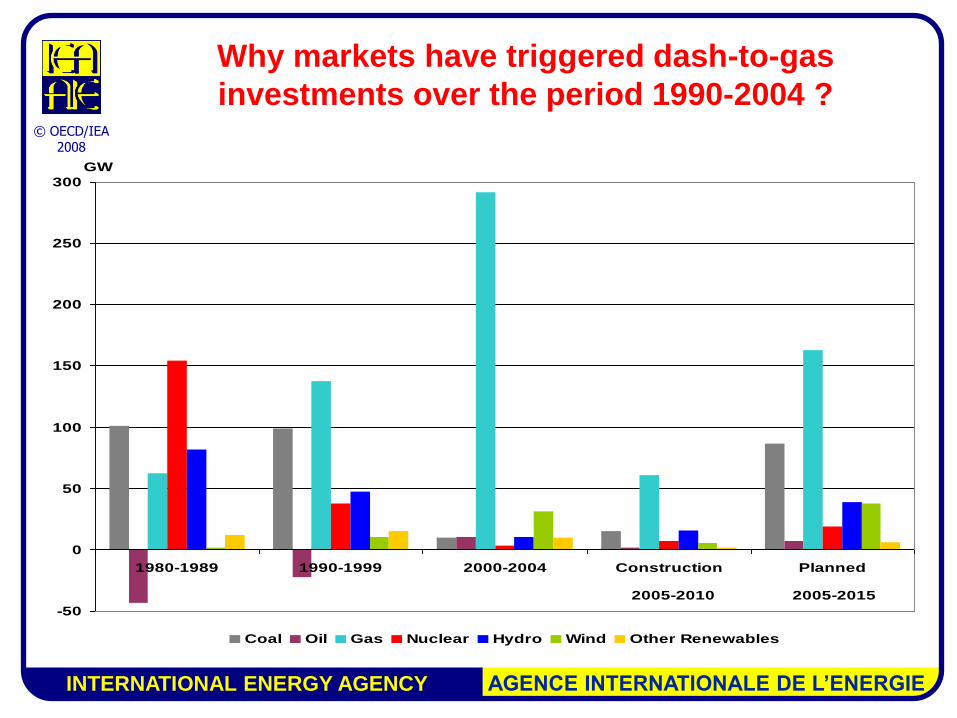
Why markets have triggered dash-to-gas
investments over the period 1990-2004 ?
-50
0
50
100
150
200
250
300
1980-1989 1990-1999 2000-2004 Construction Planned
Coal Oil Gas Nuclear Hydro Wind Other Renewables
GW
2005-2010 2005-2015

INTERNATIONAL ENERGY AGENCY AGENCE INTERNATIONALE DE L’ENERGIE
© OECD/IEA 2008
Risk and return assessment tends to favour
investments in gas-fired power plants

INTERNATIONAL ENERGY AGENCY AGENCE INTERNATIONALE DE L’ENERGIE
© OECD/IEA 2008
Market reform and grid reliability
Market reform is not to blame for the 2003
blackout in North America
Liberalised markets have contributed to:
increased cross-border and regional trade
longer distance use of transmission
infrastructure
greater, more volatile and less predictable
grid usage
Creating new real-time challenges for system
operators

INTERNATIONAL ENERGY AGENCY AGENCE INTERNATIONALE DE L’ENERGIE
© OECD/IEA 2008
Marginal pricing ensures optimal dispatch
in competitive generation markets
Decentralised decision making in competitive markets is a strong instrument to ensure optimal dispatch
Lack of price elasticity on the demand side may be the critical market failure for a robust price settlement at all times
Must run (e.g. wind)
Nuclear
Coal
Gas
Oil & old plants
USD/MWh
MW
0
to
- ?
15
to
5
40
to
20
55
to
40
100
to
60
Demand
- off peak
Demand
- peak
Demand
- extreme
Supply

INTERNATIONAL ENERGY AGENCY AGENCE INTERNATIONALE DE L’ENERGIE
© OECD/IEA 2008
Example of price responsiveness in
the Nordic markets
Nordic drought
-30%
-20%
-10%
0%
10%
20%
30%
1 8 15 22 29 36 43 50 5 12 19 26 33 40 47 2 9 16 23 30 37 44 51
-900
-600
-300
0
300
600
900
Norway hydro - Deviation from median, %
2002 2003 2004 WeekSource: adapted from ECON Energy, 2003
-30%
1
-900
-600
-300
0
300
600
900
Sweden hydro - Deviation from median, %
-30%
1
-900
-600
-300
0
300
600
900
Nord Pool System price, NOK/MWh
Price: NOK/MWh
-30%
1
-900
Net trade Norway to Sweden, GWh
Trade: GWh
1 EURO = 8 NOK

INTERNATIONAL ENERGY AGENCY AGENCE INTERNATIONALE DE L’ENERGIE
© OECD/IEA 2008
Flexibility is critical for market clearing in
tight situations
Cost reflective pricing creates incentives for flexible resources to meet peak-load particularly in situations of scarcity
Price caps and other market intervention mute incentives
Imports,open cycle gas,
back up generation,demand response
USD/MWh
MW
10000to
100
Imports

INTERNATIONAL ENERGY AGENCY AGENCE INTERNATIONALE DE L’ENERGIE
© OECD/IEA 2008
Increasing cross-border trade improves supply
flexibility

INTERNATIONAL ENERGY AGENCY AGENCE INTERNATIONALE DE L’ENERGIE
© OECD/IEA 2008
Demand participation makes markets
work better
Price
Quantitiy
Supply
Inelastic
Demand
Inelastic Clearing Price
Elastic
Demand
Elastic Clearing Price
Less demand
- improved
reliability
- less investment
Lower prices
- improved efficiency
- reduced market power
Consumption is not homogenous

INTERNATIONAL ENERGY AGENCY AGENCE INTERNATIONALE DE L’ENERGIE
© OECD/IEA 2008
Empowering consumers:
the third pillar
Retail competition protects and brings the benefits
to the consumer through competitive prices,
customer choice and innovation
Demand response to price adds real resources to
the system
Transparent prices improve framework for energy
efficiency
Balancing supply & demand investment
Mitigate possible abuse of market power
Large potential benefits still remain to be realised
De
ma
nd
Tra
ns
mis
sio
n
Ge
ne
rati
on

INTERNATIONAL ENERGY AGENCY AGENCE INTERNATIONALE DE L’ENERGIE
© OECD/IEA 2008
Real competition is a prerequisite
Unbundling
Truly independent system operation
Market rules giving fair and easy access to all
market players
Regulation of natural monopolies
Regulation of competition
Liberalisation is a process that requires political
commitment and strong government involvement
Competitive market framework provides signals to
market participants
INTERNATIONAL ENERGY AGENCY AGENCE INTERNATIONALE DE L’ENERGIE
© OECD/IEA 2008
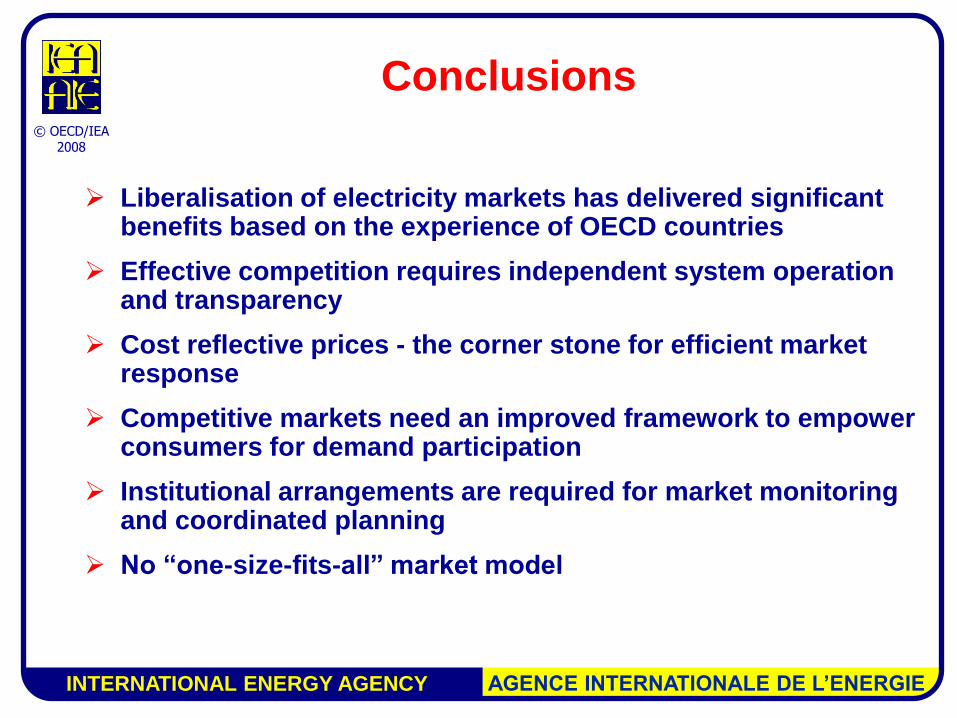
Conclusions
Liberalisation of electricity markets has delivered significant benefits based on the experience of OECD countries
Effective competition requires independent system operation and transparency
Cost reflective prices - the corner stone for efficient market response
Competitive markets need an improved framework to empower consumers for demand participation
Institutional arrangements are required for market monitoring and coordinated planning
No “one-size-fits-all” market model

INTERNATIONAL ENERGY AGENCY AGENCE INTERNATIONALE DE L’ENERGIE
© OECD/IEA 2008
Thank you!
Some references:
OECD/IEA, 2007: World Energy Outlook 2007 - China and India insights
OECD/IEA, 2007: Tackling investment challenges in power generation in IEA countries
OECD/IEA, 2006: China’s power sector reforms – Where to next?
OECD/IEA, 2005: Lessons from liberalised electricity markets
Planned publications (2008)
Electricity transmission investments in liberalised markets: trends, issues and best practices
Customer choice in electricity markets: Retail switching and demand response in competitive markets
Recommended