1
December 7, 2016
Dear Shareholder:
The performance of Pershing Square Holdings, Ltd. is set forth below1.
3rd Quarter 4th QTD 2016
2016 Through 11/30/2016
Pershing Square Holdings, Ltd. 12/31/12 - 11/30/16
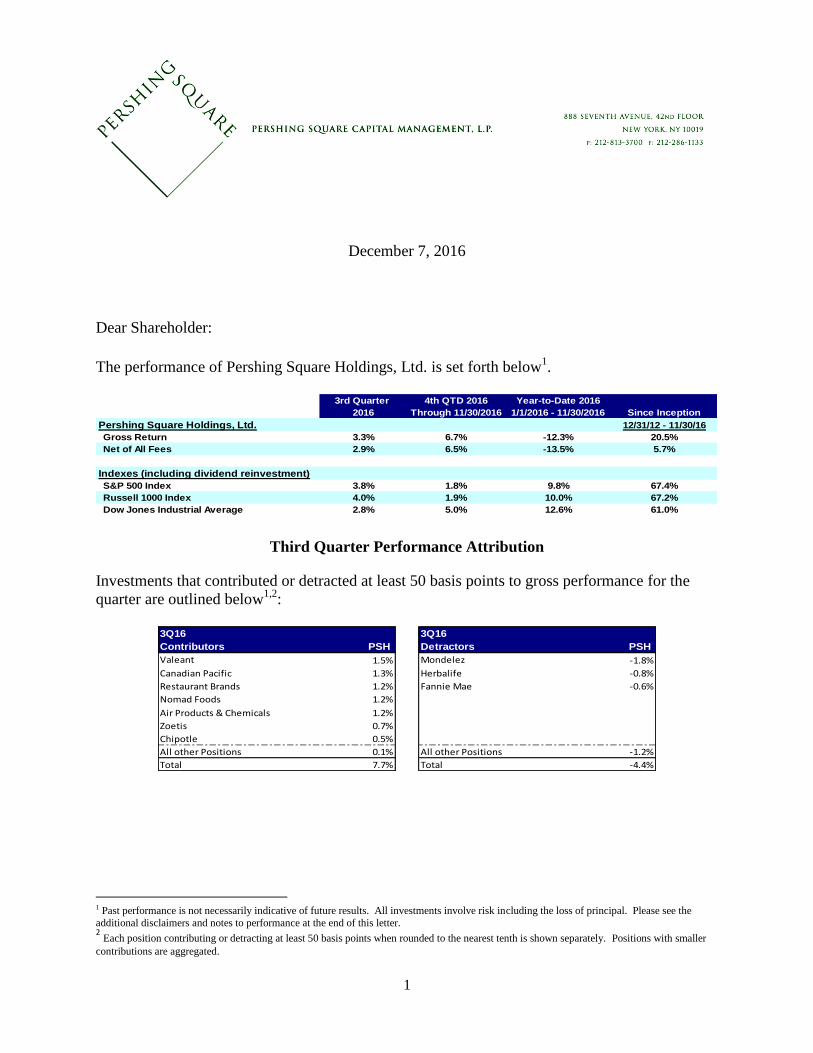
Gross Return 3.3% 6.7% -12.3% 20.5%
Net of All Fees 2.9% 6.5% -13.5% 5.7%
Indexes (including dividend reinvestment)
S&P 500 Index 3.8% 1.8% 9.8% 67.4%
Russell 1000 Index 4.0% 1.9% 10.0% 67.2%
Dow Jones Industrial Average 2.8% 5.0% 12.6% 61.0%
Year-to-Date 2016
1/1/2016 - 11/30/2016 Since Inception
Third Quarter Performance Attribution
Investments that contributed or detracted at least 50 basis points to gross performance for the
quarter are outlined below1,2
:
3Q16 3Q16
Contributors PSH Detractors PSH
Valeant 1.5% Mondelez -1.8%
Canadian Pacific 1.3% Herbalife -0.8%
Restaurant Brands 1.2% Fannie Mae -0.6%
Nomad Foods 1.2%
Air Products & Chemicals 1.2%
Zoetis 0.7%
Chipotle 0.5%
All other Positions 0.1% All other Positions -1.2%
Total 7.7% Total -4.4%
1 Past performance is not necessarily indicative of future results. All investments involve risk including the loss of principal. Please see the
additional disclaimers and notes to performance at the end of this letter. 2 Each position contributing or detracting at least 50 basis points when rounded to the nearest tenth is shown separately. Positions with smaller
contributions are aggregated.

2
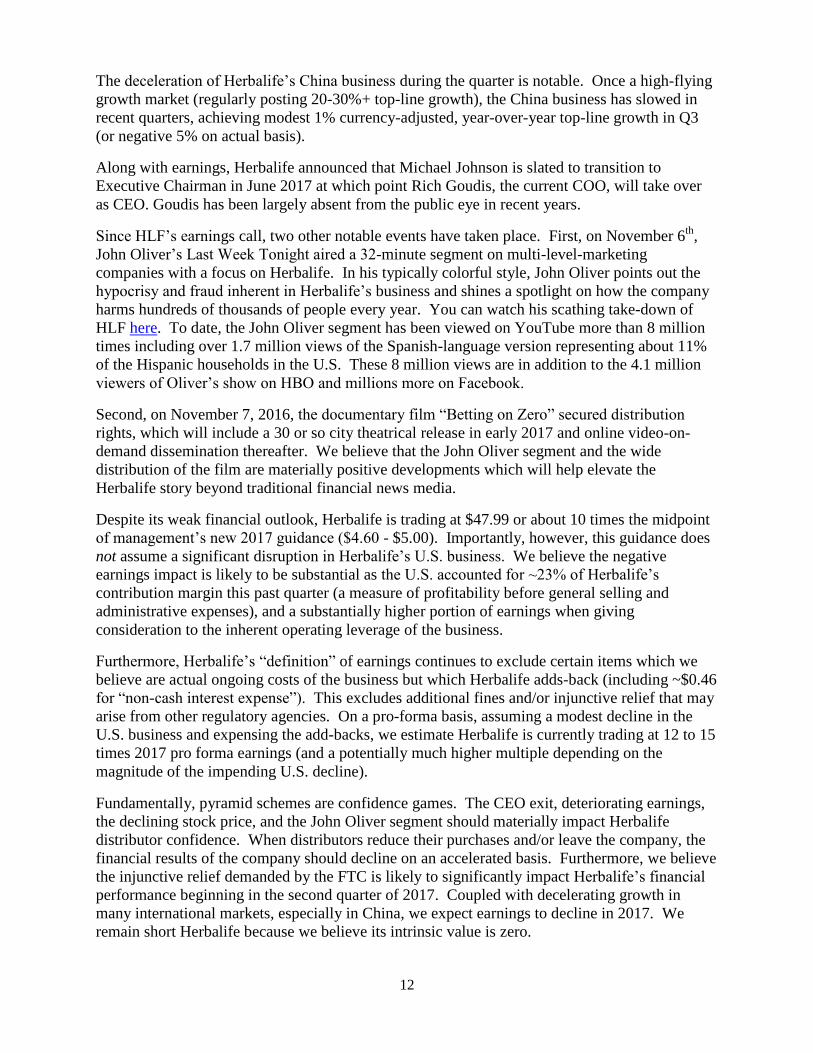
Pershing Square, L.P. Cumulative Net Return Since Inception
3
(1/1/2004 – 11/30/2016)
Performance
The chart above shows the performance of Pershing Square, L.P., our longest standing fund
which launched at the inception of the firm on January 1, 2004. The substantial decline in
performance from August 2015 through March 31, 2016 is largely due to Valeant’s decline,
which affected PSH’s performance as well. While year-to-date performance for PSH remains
negative, the fund’s performance turned positive in the second quarter, and in the third quarter,
and the fourth quarter to date. This is despite the continued decline in Valeant’s stock price, as
our other holdings have appreciated substantially. Valeant now represents approximately 5% of
the fund’s capital.
From inception of the strategy, investors have achieved a six-fold multiple of invested capital, a
14.9% annual compound return, which compares favorably with the S&P 500, which has
generated a 158% cumulative return and a 7.6% annual compound return over the same period.
While this is a good result, it is below our long-term goals and not much solace to PSH investors
who joined us in recent years.
Since the beginning of the year, we have worked to achieve a number of key business objectives
to improve both short-term and long-term performance. These objectives have included: (1)
exiting certain portfolio investments to free up capital for new opportunities, (2) identifying new
investments, (3) assisting our portfolio companies in executing their strategies, (4) obtaining
board representation at Valeant and assisting the company in a turnaround, and (5) putting in
place a long-term compensation arrangement for long standing Pershing Square employees. We
have made substantial progress on all of the above objectives. This progress is partially reflected
3 Past performance is not necessarily indicative of future results. All investments involve risk including the loss of principal. Please see the
additional disclaimers and notes to performance at the end of this letter.
-100%
0%
100%
200%
300%
400%
500%
600%
700%
800%
Jan
-04
Jul-
04
Jan
-05
Jul-
05
Jan
-06
Jul-
06
Jan
-07
Jul-
07
Jan
-08
Jul-
08
Jan
-09
Jul-
09
Jan
-10
Jul-
10
Jan
-11
Jul-
11
Jan
-12
Jul-
12
Jan
-13
Jul-
13
Jan
-14
Jul-
14
Jan
-15
Jul-
15
Jan
-16
Jul-
16
Pershing Square Capital Management, L.P. S&P 500
500%
158%

3
in the fund’s 18.4% NAV performance since the fund bottomed on March 31, 2016 versus 8.3%
for the S&P 500 over the same period, but more significantly in the business progress and
developments in the balance of the portfolio which we discuss in greater detail below (although
PSH’s share price performance has underperformed its NAV performance as the discount to
NAV has widened substantially, which we also discuss below).
Exited Positions
Over the past two quarters, we have exited our investments in Canadian Pacific and Zoetis, two
highly successful activist engagements that have contributed substantially to our profits over the
years. While we consider both to be high quality businesses run by extremely able management
teams, we harvested these investments to free up capital for new commitments.
Canadian Pacific Railway Limited (CP)
In our August 26, 2016 Investor letter we reported the sale of our remaining 9.8 million shares of
CP on August 4, 2016, approximately five years from the inception of the investment. During
the course of our investment, CP’s share price increased nearly four times, its operating
performance went from worst to nearly tied for first with Canadian National, and its credit rating
improved from a weak Baa-/BBB- to a strong Baa+/BBB+. While critics often accuse activists
of being short-term investors focused primarily on stock buybacks and dividends, CP is a
paradigmatic example of the long-term sustainable business performance enhancements and
shareholder value creation we have achieved in our core activist holdings.
Zoetis Inc. (ZTS)
On November 9th
we sold our last shares of Zoetis, about two years after we publicly announced
an 8.5% ownership stake. Despite the high quality nature of the business and its strong
management team, we sold to redeploy the capital in certain new investments.
We purchased our stake in Zoetis at an average cost of approximately $37 per share. Shortly
thereafter, we met with the Zoetis management to learn more about the company and to discuss
our views on potential initiatives to create shareholder value. On February 4, 2015, Zoetis
agreed to add then-Pershing Square investment team member (and healthcare industry veteran)
Bill Doyle and Actavis Executive Chairman Paul Bisaro to the board on April 13, 2015.
Over the course of our ownership, ZTS developed and implemented a number of value-
enhancing initiatives including restructuring its supply chain, pursuing organic revenue growth
opportunities while reducing costs, and setting a goal of increasing operating margins from
~25% in 2014 to ~34% by 2017. Zoetis outperformed each of these objectives during our
ownership.
We sold our remaining shares of Zoetis on November 9th. During our more than two-year
ownership, Zoetis generated a total shareholder return of 58%.

4
New Investments
We have publicly disclosed one of our new investments – Chipotle Mexican Grill – which we
describe in greater detail below. We have yet to disclose the second investment in which we
have built a half-sized position, as the accumulation of additional shares has been disrupted by
the recent increase in its stock price.
Chipotle Mexican Grill (CMG)
On September 6th
, we announced a 9.9% stake in Chipotle Mexican Grill which we purchased at
an average price of $405 per share. Chipotle has built a superb brand pioneering the “fast
casual” restaurant industry with the success of its outstanding product offering, unique culture
and powerful economic model. We have followed the business for years, noting how it has
disrupted the fast food industry with its high quality, delicious and customizable hot meals that
are prepared quickly and sold at affordable prices. The company has been significantly
negatively impacted by food safety issues beginning in the fourth quarter of 2015 which caused a
peak decline in average unit sales of 36%. In response, the company has implemented best-in-
class food safety protocols over the past year, and worked to win back lost customers. While
traffic and sales have begun to recover, average unit volumes are still 19% below peak levels.
We have always believed that a good time to buy a great business is when it is in temporary
trouble. While Chipotle’s reputation has been bruised, we think that with the passage of time
and improved marketing, technology and governance initiatives, the business will not only
recover but become much stronger. Chipotle’s sales recovery will be neither smooth nor
predictable over the next few quarters; yet, we believe that all of the key drivers of Chipotle’s
powerful economic moat and long-term success remain intact. These drivers include:
1. A strong and relevant brand built by visionary leadership
2. A differentiated product offering with a highly attractive value proposition
3. Substantial scale in the fast casual industry and first-mover advantage in real estate
4. Strong unit economics and extremely high returns on capital, driven by a well-honed
model that facilitates best-in-class throughput
5. Enormous growth opportunities including new units and operating enhancements such as
mobile ordering and catering
Strong Brand
The Chipotle brand was developed by founder Steve Ells with the philosophy that food served
fast does not have to be a traditional “fast-food” experience. This vision later evolved into an
ambition to change the way the world thinks about and eats fast food. Chipotle’s authentic brand
developed a loyal following, which allowed the company to grow from one restaurant to more
than 2,100 relying primarily on customer word of mouth, supplemented by non-traditional
marketing techniques including digital and social media, owned content, and local
events. Today, we believe that Chipotle is one of the most compelling and authentic large-scale
food brands in the U.S.
Differentiated Product Offering
Chipotle’s product offering is differentiated by the fact that it successfully competes in all the
desirable attributes of out-of-home fast food. As part of our research, we compared Chipotle’s
customer value proposition to those of fast casual, quick service, and casual dining competitors
across six key metrics: food quality, taste, in-store experience, customization ability, speed, and

5
value. We believe Chipotle’s food quality is superlative given the focus on cooking from scratch
with the best available ingredients. Chipotle’s “burrito line” service format engages customers
from the moment they walk in the door, allows exact customization of each order to
accommodate individual preferences, and facilitates the fastest throughput in the industry. The
product price point offers outstanding value given the quality and quantity of food served. While
some other concepts can successfully compete on one or more of these attributes, we believe that
few are able to replicate the Chipotle offering at comparable price points at scale.
Enormous Growth Opportunity
Prior to the recent food safety issues, Chipotle’s average unit volumes were approximately $2.5
million, nearly the highest in the industry, despite only serving two day-parts, and with limited
store hours, i.e., 11 versus as much as 24 hours for other fast food competitors. We believe that
initiatives such as mobile and digital ordering, loyalty program development, catering, and menu
innovation including dessert will drive an accelerated rate of same-store sales growth for the
foreseeable future, incremental to the impact of recovering lost customers. Returns on capital for
new units remain extremely compelling even at today’s lower sales levels. We believe that the
U.S. can support about 3,000 additional Chipotle restaurants, a total of 5,000 units representing
2.3 times the current store base.
Food Safety
We have researched the initiatives that Chipotle has taken to address food safety. While food
safety risk can never be completely eliminated in any restaurant, we think the company has done
an excellent job of significantly reducing the risk of another incident while maintaining the
freshness and taste of its food.
Chipotle has a number of other attractive attributes which include limited global macroeconomic
sensitivity and foreign currency exposure, a simple business model with limited non-GAAP
earnings adjustments, a high effective tax rate of nearly 40% (which means the company will be
a big beneficiary of lower U.S. tax rates if implemented by the Trump administration) and an
unlevered balance sheet with a strong net cash position.
Valuation
Given Chipotle’s depressed near-term earnings due to the recent decline in sales and its
detrimental impact on operating margins, we do not believe it is appropriate to value Chipotle
using a multiple of next year’s earnings based on comparables or estimated growth rates. To
estimate the intrinsic value of Chipotle shares, we have valued the discounted cash flows of the
business over its life using reasonable assumptions. In our base case, we have assumed a long-
term restaurant count of 5,000 units, some recovery of lost customers over the next several years,
and moderate same-store sales growth over the long-term driven by the impact of new
technology initiatives (like mobile, online ordering and loyalty) and day-part extension initiatives
(like catering). We conservatively have assumed that profit margins will be at a discount to peak
levels reflecting the cost of new food safety procedures as well as increased investments, offset
over time by thoughtful management of overhead costs and increased operating leverage.

6
Portfolio Update4
Mondelez International (MDLZ)
On October 26, Mondelez reported third quarter 2016 results. Underlying organic growth was
generally in-line with the company’s categories at nearly 2%, including volume growth of 1.3%.
This was the third straight quarter of positive underlying volume growth and a sequential
acceleration from the second quarter. We note that Mondelez is one of the few large cap
packaged food companies that is demonstrating any underlying volume growth, however modest.
While the global growth rate of Mondelez’s snacking categories has moderated over the course
of the year primarily due to macroeconomic headwinds, we continue to believe that the long-
term outlook for these categories remains robust, especially in the emerging markets where
Mondelez has large market shares and robust routes to market.
Operating profit margins expanded by 220 basis points to 15.8% in the quarter, driven primarily
by a reduction in overhead costs as a percentage of sales reflecting the implementation of zero-
based budgeting and the rollout of global shared services, as well as an increase in gross margin
reflecting the company’s supply chain transformation. Year-to-date, the company continues to
show progress with its significant cost savings opportunity and productivity initiatives, and
remains on track to reach its 2018 margin target of 17% to 18% with further upside beyond 2018.
Air Products and Chemicals, Inc. (APD)
Air Products’ fiscal year fourth quarter earnings per share of $2.01 increased 10% over the prior
year. This strong performance was driven by a 260 basis point increase in operating margins.
This quarter marked the ninth straight quarter of double-digit EPS growth since Seifi Ghasemi
joined Air Products as its CEO.
Sales increased 1% as 3% underlying growth was offset by a 2% drag from foreign exchange
rates and the pass-through of lower energy prices. The 3% underlying growth was driven by
increased volumes as pricing remained flat. Growth capex contributed to volume growth in
Asia, while global economic weakness led to weak volumes elsewhere around the globe.
The highlight of the quarter was continued productivity savings and margin progression, with
operating profit margins of 23.7%, up 260 basis points over the prior year. Excluding its non-
core businesses, APD’s industrial gases margins were 23% percent in FY Q4, slightly above
Praxair's 22% industrial gas margins. Air Products has fulfilled its goal of becoming the most
profitable company in the industrial gas industry.
Full year results generated EPS growth of 14%, exceeding the high end of the company’s fiscal
year guidance, despite 3% foreign exchange headwinds. Excluding these foreign exchange
headwinds, EPS grew 17% for the year.
Air Products provided fiscal year 2017 EPS guidance of $6.25 to $6.50 representing growth of
9% to 13% over the prior year, excluding the recent spinoff and sale of Versum and the
performance materials businesses. The guidance is principally driven by continued operating
productivity and returns on growth capex. Air Products expects to achieve an additional $100
4 By position size, longs then shorts

7
million of productivity improvement in FY 2017 which equates to $0.35 of EPS and
approximately half of 2017 anticipated EPS growth.
On the earnings call, Seifi emphasized that the guidance for the fiscal year does not include any
use of the $2.6 billion of net proceeds from the sale and spin of its non-core businesses. The
company highlighted that it is considering opportunities for growth capex projects, small
acquisitions, and share repurchases as potential uses of capital. Air Products remains optimistic
about the growth capex opportunities it has identified, including in the US Gulf Coast, China,
and certain limited opportunities in Europe. The company is well positioned for growth given its
leadership in the tonnage market and its strong balance sheet.
APD’s December 2, 2016 price of $144.55, less the $12 of cash from the spinoff and sale, the
stock trades at 20.8x earnings and 13.8x maintenance free cash flow, a price which we believe
significantly discounts the company’s intrinsic value.
Restaurant Brands International Inc. (QSR)
QSR reported strong results by executing on its three key growth drivers: same store sales, net
unit growth, and operational efficiency. In the third quarter, the company generated 2% same
store sales growth in its Burger King and Tim Hortons concepts. While same store sales growth
has decelerated over the last few quarters, it is still at a healthy overall level. Strong
international growth was partially offset by weaker U.S. performance at Burger King where
same store sales declined 0.5%. The decline in the U.S. is partially due to a tough comparison
with last year’s quarter’s 5% growth, but also reflects a more difficult industry environment as
the recent decline in food costs has widened the price gap between restaurant and grocery to
historically high levels, resulting in lower restaurant traffic.
QSR achieved net unit growth of 3% which management expects will accelerate in the fourth
quarter. In addition, Tim Hortons recently announced two master franchise agreements in the
U.K. and the Philippines, which should accelerate future growth.
QSR continues to improve the efficiency of Tim Hortons’ cost structure by reducing overhead
costs by more than 8% this quarter and meaningfully increasing margins in the franchised and
distribution businesses.
The Howard Hughes Corporation (HHC)
Net Operating Income (NOI) from HHC’s operating assets (consolidated and owned) decreased
sequentially from $35.2 million to $31.3 million (and year-over-year from $31.9 million), largely
due to headwinds in Houston that continue to negatively impact HHC’s owned hotels in Houston
($3.5 million sequential decline in hospitality NOI). HHC held steady its projected stabilized
annual NOI estimate (which excludes the South Street Seaport) of $215 million and kept
constant its estimated stabilized hospitality NOI levels. Land sales in its Master Planned
Community (MPC) segment decreased from $59 million to $32 million year-over-year in Q3 and
sequentially from $34 million due primarily to a $27 million reduction in commercial sales from
Q3 2015.
In Hawaii, at its Ward Village property, construction of the Waiea, HHC’s first residential tower,
is nearing completion. HHC has started collecting the proceeds from the sale of these

8
units. HHC’s second tower (Anaha) recently topped out and is on schedule to be completed by
mid-summer 2017. The company now has five condominium projects for sale, four of which are
under construction (see status of each one below). HHC executed 35 new sales contracts since
the end of Q2, representing 11% of the remaining inventory under construction (reducing the
number of unsold units to 280 from a total inventory of 1400 units).
Summerlin
Summerlin’s residential land sale market remains strong with $16.5 million in closings. HHC
has contracted 21 custom lots totaling $94 million at The Summit, HHC’s luxury golf course JV
development within Summerlin. HHC signed a 20-year ground lease for a two-rink practice
facility for the newly awarded NHL franchise in Las Vegas in Downtown Summerlin. The
facility is expected to be completed in August 2017.
Houston
While the broader Houston market remains negatively impacted by lower oil prices (especially in
the higher-end market), HHC continued to see increased activity at Bridgeland due to demand for
mid-priced homes. Bridgeland had 12.2 acres of residential land sales, which represented an
increase of 110% year-over-year (and flat sequentially). Sequentially, Woodlands land sale
closings increased from $1.4 million to $10.6 million, but at a reduced price per lot of $532,000
per acre compared to $603,000 per acre in the second quarter. The recent increase in oil prices
are likely to contribute to greater business confidence and demand for real estate in Houston.
South Street Seaport
On October 19, 2016, HHC obtained approval for the Seaport’s Pier 17 and Tin Building Minor
Modification, which will allow HHC to move and reconstruct the Tin Building, among other
changes to the Seaport. 10 Corso Como, an iconic Italian fashion retailer, signed a 13,000 square
foot lease in the historic district where it will open its only North American location. Finally,
iPic had its grand opening at the Seaport, which represents Manhattan’s first new commercial
multiplex movie theater opening in over a decade.
HHC named David O’Reilly as its new CFO replacing Andy Richardson. David was previously
the CFO of Parkway Properties, a publicly listed REIT.
Project Total Units
Under
Contract
Percent of
Units Sold
Total Projected
Costs
($M)
Costs
Incurred to
Date
($M)
Estimated
Completion
Date
Walea 174 160 92.0% 403.4$ 346.3$ Q4 2016
Anaha 317 297 93.7% 401.3$ 207.8$ 2017
Ae'o 466 257 55.2% 428.5$ (a) 53.8$ 2018
Ke Kilohana 424 387 91.3% 218.9$ 11.1$ 2019
Total Under Construction 1,381 1,101 79.7% 1,452.1$ 619.0$
(a) Also includes project costs of our flagship Whole Foods Market located on the same block.
Ward Village Towers Under Construction as of September 30, 2016

9
In summary, HHC continues its highly successful strategy of converting land and other non-
income development assets into cash and stabilized cash flows. This has had the effect of
increasing HHC’s intrinsic value and should assist investors in valuing the company.
Fannie Mae (FNMA) / Freddie Mac (FMCC) Fannie and Freddie’s underlying earnings continue to progress modestly in the core mortgage
guarantee business, while the non-core investment portfolio continues to shrink to a smaller and
appropriate level, resulting in a more profitable and lower-risk business model. The strength in
underlying earnings growth reflects two factors: (1) an increase in guarantee fees as the fees on
new mortgages exceed the average fees on the existing portfolio, and (2) lower credit losses as
the portfolio’s credit quality has meaningfully improved since the financial crisis.
There were a number of legal developments this quarter. In the Federal Court of Claims case,
Judge Sweeney granted the plaintiffs access to 56 documents the government had claimed were
privileged, many of which were contemporaneous with the period just prior to the Net Worth
Sweep and involved high level government officials. The plaintiffs have not yet had access to
the privileged documents as the government has appealed Judge Sweeney’s ruling. We find it
interesting that the government is fighting so hard against this ruling, as it has previously
complied with the judge’s prior motions to turn over documents.
A new lawsuit was filed in Texas that makes claims similar to the Perry case, but also makes
several new arguments. First, the lawsuit argues that the Housing and Economic Recovery Act
(HERA), which grants FHFA rights as conservator, is invalid and violates the separation of
powers. Second, the lawsuit contends that the FHFA has affected a liquidation of the GSEs in
violation of HERA by creating policies such as a common securitization platform and credit risk
transfer agreements which are designed to minimize the GSEs role in the marketplace.
Since the election, Fannie and Freddie’s share prices have appreciated materially as investors
believe that a more business-oriented administration that did not implement the Net Worth
Sweep would be more likely to seek a consensual resolution that benefits all stakeholders.
Recent statements by Steven Mnuchin, the presumptive Treasury Secretary, have also
contributed to the recent stock price increases. In an interview on Fox Business, Mr. Mnuchin
stated:
It makes no sense that [the GSEs] are owned by the government and have
been controlled by the government for as long as they have. In many cases
this displaces private lending in the mortgage markets and we need these
entities that will be safe. So let me just be clear— we’ll make sure that
when they’re restructured they’re absolutely safe and they don’t get taken
over again. But we gotta get them out of government control.
We strongly agree with Mr. Mnuchin’s views about the GSEs.
Valeant Pharmaceuticals International (VRX)
Since our last update in August, Valeant has bolstered its management ranks, improved
dermatology average selling prices (ASPs), stabilized its salesforces, and experienced
acceleration in Salix script trends. Despite these positive developments, financial results

10
continue to be challenged as certain unexpected events impacted Valeant in Q3 and weakness in
Valeant’s U.S. Diversified Products segment continues to weigh on near- to medium-term
earnings.
Valeant reported quarterly revenue of $2.48 billion, Adjusted EBITDA of $1.16 billion and
Adjusted EPS of $1.55. This represented sequential improvement of 2%, 7% and 11%,
respectively, as the business continues to stabilize following the disruption of recent quarters.
Beginning this quarter, management provided disclosure under the new financial reporting
structure. The business is now aligned across three verticals: (1) Bausch + Lomb / International
(“Durable”), (2) Branded Rx (“Growth”), and (3) U.S. Diversified Products (“Cash Generating”).
This new disclosure is consistent with Valeant’s commitment to greater transparency. Over
time, Valeant has indicated that a substantial mix-shift will take place in its business as Bausch +
Lomb / International and Branded Rx target mid-single digit revenue growth (high-single digit
operating income growth) while Valeant’s U.S. Diversified Products segment declines. As this
mix-shift happens over time, a greater percentage of Valeant’s profits will come from higher
quality, higher growth and more valuable businesses.
In conjunction with announcing Q3 results, management updated 2016 guidance, reducing full
year estimates. Full year Adjusted EBITDA and EPS are now projected to be $4.25 billion to
$4.35 billion (down from $4.8 billion - $4.95 billion) and $5.30 to $5.50, respectively (down
from $6.60 to $7.00). Implicit in updated guidance is a sequential decline in Q4 versus Q3.
Management addressed some of the key factors on the earnings call contributing to this dynamic,
some of which are permanent headwinds while others are temporary.
Valeant management provided initial perspectives on 2017 results on the earnings call including
an expectation for Bausch + Lomb / International and Branded Rx to achieve mid-single-digit
revenue growth and high-single-digit operating profit growth. Management anticipates that this
growth will be more than offset by the decline in U.S. Diversified Products (specifically the
neurology and generics business) as a result of patent expirations and generic competition.
Management announced the planned implementation of a zero-based-budgeting initiative,
expected to save $75 to $100 million in 2017 and a goal to improve gross profit by $150 to $250
million by 2020 through supply chain rationalization.
Management reiterated its commitment to achieve more than $5 billion of debt reduction over
the next 18 months from a combination of cash generation and asset divestitures. We believe
that asset sales are an important catalyst for value creation and stock price appreciation at
Valeant. Valeant has identified approximately $8 billion of assets that are non-core which it has
begun to market for sale.
Platform Specialty Products Corporation (PAH)
In September, Platform hosted an investor day where it provided a detailed explanation of the
secular growth drivers and unique competitive positioning of each of its Performance and
Agricultural Solutions businesses, along with long-term guidance of 4% annual organic revenue
growth and high-single digit annual EBITDA growth.
The company also announced that it had reached a revised agreement with Permira to settle its
$600 million preferred stock liability related to the Arysta acquisition. Under the revised
agreement, Platform has the option to pay Permira $450 million in cash and 5.5 million shares,

11
which equates to $500 million at the current market prices and represents a savings of $100
million relative to the original agreement. To finance the cash portion of the agreement, the
company raised $400 million of equity and, as a result, was able to refinance $2 billion of its
debt, reducing the rate on this debt by 50 basis points and extending the maturities by three years
to 2023.
At the beginning of November, Platform reported strong third quarter earnings. The company
delivered 3% organic revenue growth, comprised of 4% growth in Agricultural Solutions and 2%
in Performance Solutions. The results are particularly impressive given the cyclical weakness in
the company’s end markets. EBITDA grew 14%, due to 5% growth before synergies and
corporate costs, 6% impact from net synergies, and 3% from FX.
Nomad Foods (NOMD)
Nomad reported Q3 results in late November.
Third quarter like-for-like sales declined 3.3%, which marked the fourth straight quarter of
sequential improvement in like-for-like sales trends. This sequential improvement in trends is
consistent with management’s guidance and driven by the company’s shift in its strategy to
refocus its resources on its core product offerings.
Third quarter EBITDA was €85 million and the EBITDA margin was 19.4% or 200 basis points
better than prior year, although much of this improvement in margins was driven by a reduction
in bonus accruals. Net of this impact, margins grew modestly, driven by a reduction in indirect
expenses. The Company realized of €2.5 million of synergies during the quarter or €10 million
annually and reaffirmed its target of €43 to €48 million of total synergies by 2018. Nomad
remains focused on stabilizing its base business, integrating Findus and delivering the significant
synergies it has identified.
Nomad reiterated its expectation that sales trends will improve sequentially as the new strategy
rolls out. It also reiterated full year guidance that estimates that EBITDA will be broadly flat
with last year at €330 million and levered free cash flow will be €200 million before
restructuring and other one-time items. The stock trades at about 8 times free cash flow
guidance, a valuation we find attractive.
Herbalife Ltd. (HLF) Short
On November 1, 2016, Herbalife reported its third quarter financial results. Modest financial
performance in the quarter, disappointing 2017 guidance and the unexpected announcement of a
CEO transition caused the stock to decline. HLF stock has traded down more than 33% since the
announcement of the company’s settlement with the FTC on July 15th
, 2016, a 15% year-to-date
decline, as investors have come to increasingly ignore the company’s fraudulent characterization
of the FTC settlement. At its December 2, 2016, price of $47.99 per share, HLF currently trades
at approximately the price at which we shorted the shares in 2012.
On a consolidated basis the company reported net sales of $1.1 billion for the quarter, up 1.7%
year-over-year. Headline adjusted net income of $105 million for the quarter (down 3% YoY)
translated into adjusted EPS of $1.21 (down 4% YoY). On a constant currency basis the
company reported net sales growth of 5%, driven by EMEA (+15%), Mexico (+14%) and North
America (+10%).
12
The deceleration of Herbalife’s China business during the quarter is notable. Once a high-flying
growth market (regularly posting 20-30%+ top-line growth), the China business has slowed in
recent quarters, achieving modest 1% currency-adjusted, year-over-year top-line growth in Q3
(or negative 5% on actual basis).
Along with earnings, Herbalife announced that Michael Johnson is slated to transition to
Executive Chairman in June 2017 at which point Rich Goudis, the current COO, will take over
as CEO. Goudis has been largely absent from the public eye in recent years.
Since HLF’s earnings call, two other notable events have taken place. First, on November 6th
,
John Oliver’s Last Week Tonight aired a 32-minute segment on multi-level-marketing
companies with a focus on Herbalife. In his typically colorful style, John Oliver points out the
hypocrisy and fraud inherent in Herbalife’s business and shines a spotlight on how the company
harms hundreds of thousands of people every year. You can watch his scathing take-down of
HLF here. To date, the John Oliver segment has been viewed on YouTube more than 8 million
times including over 1.7 million views of the Spanish-language version representing about 11%
of the Hispanic households in the U.S. These 8 million views are in addition to the 4.1 million
viewers of Oliver’s show on HBO and millions more on Facebook.
Second, on November 7, 2016, the documentary film “Betting on Zero” secured distribution
rights, which will include a 30 or so city theatrical release in early 2017 and online video-on-
demand dissemination thereafter. We believe that the John Oliver segment and the wide
distribution of the film are materially positive developments which will help elevate the
Herbalife story beyond traditional financial news media.
Despite its weak financial outlook, Herbalife is trading at $47.99 or about 10 times the midpoint
of management’s new 2017 guidance ($4.60 - $5.00). Importantly, however, this guidance does
not assume a significant disruption in Herbalife’s U.S. business. We believe the negative
earnings impact is likely to be substantial as the U.S. accounted for ~23% of Herbalife’s
contribution margin this past quarter (a measure of profitability before general selling and
administrative expenses), and a substantially higher portion of earnings when giving
consideration to the inherent operating leverage of the business.
Furthermore, Herbalife’s “definition” of earnings continues to exclude certain items which we
believe are actual ongoing costs of the business but which Herbalife adds-back (including ~$0.46
for “non-cash interest expense”). This excludes additional fines and/or injunctive relief that may
arise from other regulatory agencies. On a pro-forma basis, assuming a modest decline in the
U.S. business and expensing the add-backs, we estimate Herbalife is currently trading at 12 to 15
times 2017 pro forma earnings (and a potentially much higher multiple depending on the
magnitude of the impending U.S. decline).
Fundamentally, pyramid schemes are confidence games. The CEO exit, deteriorating earnings,
the declining stock price, and the John Oliver segment should materially impact Herbalife
distributor confidence. When distributors reduce their purchases and/or leave the company, the
financial results of the company should decline on an accelerated basis. Furthermore, we believe
the injunctive relief demanded by the FTC is likely to significantly impact Herbalife’s financial
performance beginning in the second quarter of 2017. Coupled with decelerating growth in
many international markets, especially in China, we expect earnings to decline in 2017. We
remain short Herbalife because we believe its intrinsic value is zero.

13
The New Long-Term Incentive Program
Until recently, Pershing Square had been fortunate in not having experienced a meaningful
decline in annual performance other than a 12% to 13% decline in 2008 during the financial
crisis. While we are obviously unhappy about the Valeant investment, I am pleased that the
entire organization has managed through recent events extremely effectively without losing
focus on our long-term goals. That said, we are often reminded that incentives drive all human
behavior, and as such earlier this year we began work on a new long-term incentive program for
the team.
The new long-term incentive program was designed by Brian Welch and Ali Namvar (we
thought that a younger and older member of the investment team would generate a structure that
would appeal widely in the organization). The program creates a new form of compensation and
long-term incentives for long-standing employees of Pershing Square.
Today, we have two forms of compensation for employees. Some employees receive base and
bonus compensation, and the balance receive a profit interest which entitles them to a percentage
interest in the net profits of the firm from management and incentive fees. About half of
Pershing Square employees have profit interests in the firm. These interests behave like legal
interests in the firm except that they are terminated when an employee leaves the company.
Under the new Long-Term Incentive Plan (LTIP), when an employee has been a profit interest
partner, she can become eligible to be a member of the LTIP. If an employee is awarded
membership into the LTIP program, her profit interest vests over a 10-year period such that after
10 years, the employee can then retire and continue to receive a reduced percentage of her
previous profit interest on a permanent basis. In addition, the LTIP partner will receive an
additional sharing of incentive fees for the following three years after retirement, in both cases as
long as she does not compete with the firm. The program allows an employee to retire and
pursue other interests outside the industry, and continue to have an ongoing pension-like interest
in the firm’s profits.
We believe that the LTIP is unique in the hedge fund industry and is reflective of how we think
about our business. We have built Pershing Square to last. We believe that further aligning the
interests of our employees with our investors increases the probability that Pershing Square will
succeed over the long term.
Discount from NAV
Pershing Square Holdings’ discount from NAV has increased substantially over the last eight
months and was more than 20% as of November 30, 2016. As an investor’s return is a function
both of underlying NAV performance and price versus NAV, we find the current discount
unacceptable. We believe the discount is attributable to a number of factors which include our
below-expectation performance, and recent capital flows out of the hedge fund industry. We are
exploring potential steps to narrow the discount to NAV and expect to report back to investors as
soon as we have decided our intended approach.

14
***
We recognize that the recent period has been a difficult one for our investors. We are extremely
appreciative of your support and patience. Please feel free to contact the Investor Relations team
or me if you have questions about any of the above.
Sincerely,
William A. Ackman

15
Additional Disclaimers and Notes to Performance Results
Presentation of Performance Results and Other Data
The performance results of Pershing Square Holdings, Ltd. (“PSH” or the “Company”) and Pershing Square, L.P.
shown in this letter are presented on a gross and net-of-fees basis. Gross and net performance includes the
reinvestment of all dividends, interest, and capital gains, and reflects the deduction of, among other things,
brokerage commissions and administrative expenses. Net performance reflects the deduction of management fees
and accrued performance fee/allocation, if any. All performance provided herein assumes an investor has been in
PSH or Pershing Square, L.P., as applicable, since its respective inception date and participated in any “new issues”,
as such term is defined under Rules 5130 and 5131 of FINRA. Depending on the timing of a specific investment and
participation in “new issues”, net performance for an individual investor may vary from the net performance stated
herein. Performance data for 2016 is estimated and unaudited.
The inception date for PSH is December 31, 2012. The performance data presented on the first page of this letter for
the market indices under “since inception” is calculated from December 31, 2012. The market indices shown on the
first page of this letter have been selected for purposes of comparing the performance of an investment in PSH with
certain well-known, broad-based equity benchmarks. The statistical data regarding the indices has been obtained
from Bloomberg and the returns are calculated assuming all dividends are reinvested. The indices are not subject to
any of the fees or expenses to which the funds are subject. PSH is not restricted to investing in those securities
which comprise any of these indices, its performance may or may not correlate to any of these indices and it should
not be considered a proxy for any of these indices. The volatility of an index may materially differ from the
volatility of PSH. The S&P 500 index is proprietary to and is calculated, distributed and marketed by S&P Opco,
LLC (a subsidiary of S&P Dow Jones Indices LLC), its affiliates and/or its licensors and has been licensed for use.
S&P® and S&P 500®, among other famous marks, are registered trademarks of Standard & Poor's Financial
Services LLC. © 2015 S&P Dow Jones Indices LLC, its affiliates and/or its licensors. All rights reserved.
The inception date for Pershing Square, L.P. is January 1, 2004. Pershing Square, L.P.’s net returns for 2004 were
calculated net of a $1.5 million (approximately 3.9%) annual management fee and performance allocation equal to
20% above a 6% hurdle, in accordance with the terms of the limited partnership agreement of Pershing Square, L.P.
then in effect. That limited partnership agreement was later amended to provide for a 1.5% annual management fee
and 20% performance allocation effective January 1, 2005. The net returns for Pershing Square, L.P. set out in this
document reflect the different fee arrangements in 2004, and subsequently. In addition, pursuant to a separate
agreement, in 2004 the sole unaffiliated limited partner paid Pershing Square an additional $840,000 for overhead
expenses in connection with services provided unrelated to Pershing Square, L.P., which have not been taken into
account in determining Pershing Square, L.P.’s net returns. To the extent that such overhead expenses had been
included as fund expenses, net returns would have been lower.
The attributions presented on page 1 are based on gross returns which do not reflect deduction of certain fees or
expenses charged to the Company, including, without limitation, management fees and accrued incentive fee (if
any). Inclusion of such fees and expenses would produce lower returns than presented here. Positions with
performance attributions of at least 50 basis points are listed above separately, while positions with performance
attributions of 50 basis points or less are aggregated.
In addition, at times, PSH may engage in hedging transactions to seek to reduce risk in the portfolio, including
investment specific hedges that do not relate to the underlying securities of an issuer in which PSH is invested.
Unless otherwise noted herein, the gross returns: (i) include only returns on the investment in the underlying issuer
and the hedge positions that directly relate to the securities that reference the underlying issuer (e.g., if the Company
was long Issuer A stock and also purchased puts on Issuer A stock, the gross return reflects the profit/loss on the
stock and the profit/loss on the put); (ii) do not reflect the cost/benefit of hedges that do not relate to the securities
that reference the underlying issuer (e.g., if the Company was long Issuer A stock and short Issuer B stock, the
profit/loss on the Issuer B stock is not included in the gross returns attributable to the investment in Issuer A); and
(iii) do not reflect the cost/benefit of portfolio hedges. Performance with respect to currency hedging related to a
specific issuer is included in the overall performance attribution of such issuer. All other currency positions are
aggregated. The performance attributions to the gross returns provided herein are for illustrative purposes only. The
securities on this list may not have been held by a Pershing Square fund for the entire calendar year.

16
Past performance is not necessarily indicative of future results. All investments involve risk including the loss of
principal. It should not be assumed that investments made in the future will be profitable.
General Notes
This letter does not constitute a recommendation, an offer to sell or a solicitation of an offer to purchase any security
or investment product.
This letter contains information and analysis relating to publicly disclosed positions above 50 basis points in the
Company’s portfolio during the period reflected on the first page. Pershing Square may currently or in the future
buy, sell, cover or otherwise change the form of its investment in the companies discussed in this letter for any
reason. Pershing Square hereby disclaims any duty to provide any updates or changes to the information contained
here including, without limitation, the manner or type of any Pershing Square investment.
Forward-Looking Statements
This letter also contains forward-looking statements, which reflect Pershing Square’s views. These forward-looking
statements can be identified by reference to words such as “believe”, “expect”, “potential”, “continue”, “may”,
“will”, “should”, “seek”, “approximately”, “predict”, “intend”, “plan”, “estimate”, “anticipate” or other comparable
words. These forward-looking statements are subject to various risks, uncertainties and assumptions. Accordingly,
there are or will be important factors that could cause actual outcomes or results to differ materially from those
indicated in these statements. Should any assumptions underlying the forward-looking statements contained herein
prove to be incorrect, the actual outcome or results may differ materially from outcomes or results projected in these
statements. None of the Company, Pershing Square or any of their respective affiliates undertakes any obligation to
update or review any forward-looking statement, whether as a result of new information, future developments or
otherwise, except as required by applicable law or regulation.
Risk Factors
Investors in PSH may lose all, or substantially all, of their investment in PSH. Any person acquiring shares in PSH
must be able to bear the risks involved. These include, among other things, the following:
PSH is exposed to a concentration of investments, which could exacerbate volatility and investment risk;
Activist investment strategies may not be successful and may result in significant costs and expenses;
Pershing Square may fail to identify suitable investment opportunities. In addition, the due diligence performed by
Pershing Square before investing may not reveal all relevant facts in connection with an investment;
While Pershing Square may use litigation in pursuit of activist investment strategies, Pershing Square itself and
PSH may be the subject of litigation or regulatory investigation;
Pershing Square may participate substantially in the affairs of portfolio companies, which may result in PSH’s
inability to purchase or sell the securities of such companies;
PSH may invest in derivative instruments or maintain positions that carry particular risks. Short selling exposes
PSH to the risk of theoretically unlimited losses;
PSH’s non-U.S. currency investments may be affected by fluctuations in currency exchange rates;
Adverse changes affecting the global financial markets and economy may have a material negative impact on the
performance of PSH’s investments;
Changes in laws or regulations, or a failure to comply with any laws and regulations, may adversely affect PSH’s
business, investments and results of operations;
Pershing Square is dependent on William A. Ackman;
PS Holdings Independent Voting Company Limited controls a majority of the voting power of all of PSH’s shares;
PSH shares may trade at a discount to NAV and their price may fluctuate significantly and potential investors
could lose all or part of their investment;
The ability of potential investors to transfer their PSH shares may be limited by the impact on the liquidity of the
PSH shares resulting from restrictions imposed by ERISA and similar regulations, as well as a 4.75 per cent.
ownership limit;
PSH is exposed to changes in tax laws or regulations, or their interpretation; and
PSH may invest in United States real property holding corporations which could cause PSH to be subject to tax
under the United States Foreign Investment in Real Property Tax Act.
Recommended