LFS Botswana. LFS Lesotho. LFS Mozambique. LFS Namibia.
LFS Swaziland. LFS Tanzania. LFS Uganda. LFS ZambiaLFS Botswana. LFS Lesotho. LFS Mozambique. LFS Namibia. LFS Swaziland. LFS Tanzania. LFS Uganda. LFS Zambia
Letshego Holdings LimitedInterim Results Presentation
Six months period to 31 July 2013
18 October 2013,GICC,Gaborone
Botswana . Kenya . Lesotho . Mozambique . Namibia . Rwanda . South Sudan . Swaziland . Tanzania . Uganda . Zambia

LFS Botswana. LFS Lesotho. LFS Mozambique. LFS Namibia.
LFS Swaziland. LFS Tanzania. LFS Uganda. LFS Zambia
LFS Botswana. LFS Lesotho. LFS Mozambique. LFS Namibia.
LFS Swaziland. LFS Tanzania. LFS Uganda. LFS Zambia2
Contents
Group Milestones
Group Business Structure
African Footprint
Group Financial Highlights – 31st July 2013
Botswana . Kenya . Lesotho . Mozambique . Namibia . Rwanda . South Sudan . Swaziland . Tanzania . Uganda . Zambia

LFS Botswana. LFS Lesotho. LFS Mozambique. LFS Namibia.
LFS Swaziland. LFS Tanzania. LFS Uganda. LFS Zambia
LFS Botswana. LFS Lesotho. LFS Mozambique. LFS Namibia.
LFS Swaziland. LFS Tanzania. LFS Uganda. LFS Zambia
Letshego Group History - Major Milestones
Incorporates and trading commences in Botswana
BSE listingLegal Guard launched
EntersTanzanian
Enters Uganda
Enters Zambia
Name change to Letshego Holdings Limited
Eduloan Namibia Acquired
1998 2003 2005 2007 2009 2011 2013 2015
Sale of Legal Guard
Enters Mozambique
Enters Lesotho
Medium Term Notes Listed on JSE
Micro Africa acquired
3
IFSC Accreditation
30m new shares issued on BSE
Kingdom Zephyr exit commences
10 year anniversary
Global credit rating obtained
Core lending and banking system selected
Kingdom Zephyr exit concluded
EntersSwaziland
10 for 1 share split
Script dividend approved
Mozambique banking ops start
LFS Botswana. LFS Lesotho. LFS Mozambique. LFS Namibia.
LFS Swaziland. LFS Tanzania. LFS Uganda. LFS Zambia
LFS Botswana. LFS Lesotho. LFS Mozambique. LFS Namibia.
LFS Swaziland. LFS Tanzania. LFS Uganda. LFS Zambia
Group Business Structures
4Botswana . Kenya . Lesotho . Mozambique . Namibia . Rwanda . South Sudan . Swaziland . Tanzania . Uganda . Zambia

LFS Botswana. LFS Lesotho. LFS Mozambique. LFS Namibia.
LFS Swaziland. LFS Tanzania. LFS Uganda. LFS Zambia
LFS Botswana. LFS Lesotho. LFS Mozambique. LFS Namibia.
LFS Swaziland. LFS Tanzania. LFS Uganda. LFS Zambia
Group Corporate Structure
85% 85% 100%87%Letshego Financial Services
Swaziland (Pty) Ltd
LetshegoFinancial Services
(Namibia) (Pty) Ltd
Letshego Uganda
Ltd
Letshego Financial Services
Ltd (Zambia)
Letshego Financial Services (Pty) Ltd
(Botswana)
LetshegoTanzania
Ltd
Letshego Holdings Limited(IFSC registered and listed on the Botswana Stock Exchange)
Letshego Financial Services
Mozambique
95%100%85%
OPERATINGCOMPANIES
5
Letshego Financial Services Lesotho
Ltd
96.25%100%
Letshego Kenya(Micro Africa Ltd)
Finance SS Ltd 74%
Letshego Rwanda (Rwanda
Micro Finance Ltd)
100%
Micro Uganda Ltd
100%
AMDC LTD (Mauritius)
100%
Botswana . Kenya . Lesotho . Mozambique . Namibia . Rwanda . South Sudan . Swaziland . Tanzania . Uganda . Zambia

LFS Botswana. LFS Lesotho. LFS Mozambique. LFS Namibia.
LFS Swaziland. LFS Tanzania. LFS Uganda. LFS Zambia
LFS Botswana. LFS Lesotho. LFS Mozambique. LFS Namibia.
LFS Swaziland. LFS Tanzania. LFS Uganda. LFS Zambia
Organisational structure
GROUP MD
Jan Claassen (61)
Bcom, LLB, Banking
ZAMBIA
George Barlow (41)
BSc, MSc Economics
UGANDA
Geoffrey Kitakule (43)
MBA Finance, Msc. Comp.
BA Statistics, ML IT
SWAZILAND
Mbuso Dlamini (36)
Bcom,CA (SA)
TANZANIA
Marion Moore (58)
CPA,CISA
BOTSWANA
Fred Mmelesi (44)
AAT,MBA
NAMIBIA
Nicolaas Esterhuyse (32)
Bcom,ACCA,
MOZAMBIQUEChipiliro Katundu (37)
BSC,MBA
GROUP COO
Shawn Bruwer (36)
BCom, ACMA,CAIB
GROUP CFO
Colm Patterson (41)
FCA, CPA
RISK & COMPLIANCE
Dumisani Ndebele (47)
B,Acc ,MBA, FCCA, FCPA
HUMAN RESOURCES
Portia Ketshabile (44)
AAT, MDP
Barati Rwelengera (35) ACCA
Mythri Sambasivan-George (34)
FCCA,CIMA,FCPA
Onkemetse Mtonga (35)
BAcc, ACCA
Andrew Knight (45)
BEng(Honours) Electrical
Engineering, MBCS
GROUP CIO
Duduetsang Olsen (35)
BBA,MBA
COUNTRY / FUNCTION
Person in-charge (age)
QualificationKey
6
GROUP STRATEGY & COMMS
Lydia Andries (40)
Actuarial, Strategy, Banking
Botswana . Kenya . Lesotho . Mozambique . Namibia . Rwanda . South Sudan . Swaziland . Tanzania . Uganda . Zambia
Letshego Kenya Limited
Tim Carsons (49)
CA SA

LFS Botswana. LFS Lesotho. LFS Mozambique. LFS Namibia.
LFS Swaziland. LFS Tanzania. LFS Uganda. LFS Zambia
LFS Botswana. LFS Lesotho. LFS Mozambique. LFS Namibia.
LFS Swaziland. LFS Tanzania. LFS Uganda. LFS Zambia
Ownership Structure The share capital of Letshego consists of 2,167,540,271 as at July 2013 shares all of which are
ordinary shares 10,790,099 new shares were issued during April 2013 in terms of the staff Long Term Incentive Plan 158,105,858 new shares were issued to ADP I Holding 2 during April 2013 in terms of the convertible
loan Note Subscription agreement that was approved by shareholders during April 2010 Some shares are owned by investors registered through asset management companies or
trustees/funds. These investors are not registered individually in the share register maintained by the independent Transfer Secretaries
MAJOR SHAREHOLDERSINVESTOR SHARE CAPITAL %
Jan 2011 Jan 2012 Jan 2013 July 2013
Botswana Life Insurance Ltd 16.4% 25.6% 25.3% 23.3%
BIFM – funds under management 17.3% 17.8% 17.5% 15.5%
Investec – funds under management 13.0% 13.0% 13.0% 9.0%
Fleming – funds under management 9.2% 10.8% 11.5% 10.0%
ADP I Holding 2 0.0% 0.0% 1.1% 8.3%
PAIP - PCAP - FMO (managed by KZ) 13.1% 3.9% 0.0% 0.0%
International Finance Corporation (IFC) 5.7% 4.2% 2.0% 0.0%
Emerging Markets 4.0% 4.0% 3.9% 3.6%
SQM 2.0% 2.5% 3.6% 3.0%
Management 1.0% 1.0% 1.6% 0.5%
As of 31st July 2013 approx. 85% of the total share capital was owned by residents of Botswana and approx. 15 % by those outside Botswana.
7Botswana . Kenya . Lesotho . Mozambique . Namibia . Rwanda . South Sudan . Swaziland . Tanzania . Uganda . Zambia
LFS Botswana. LFS Lesotho. LFS Mozambique. LFS Namibia.
LFS Swaziland. LFS Tanzania. LFS Uganda. LFS Zambia
LFS Botswana. LFS Lesotho. LFS Mozambique. LFS Namibia.
LFS Swaziland. LFS Tanzania. LFS Uganda. LFS Zambia
African Footprint
8Botswana . Kenya . Lesotho . Mozambique . Namibia . Rwanda . South Sudan . Swaziland . Tanzania . Uganda . Zambia
LFS Botswana. LFS Lesotho. LFS Mozambique. LFS Namibia.
LFS Swaziland. LFS Tanzania. LFS Uganda. LFS Zambia
LFS Botswana. LFS Lesotho. LFS Mozambique. LFS Namibia.
LFS Swaziland. LFS Tanzania. LFS Uganda. LFS Zambia9
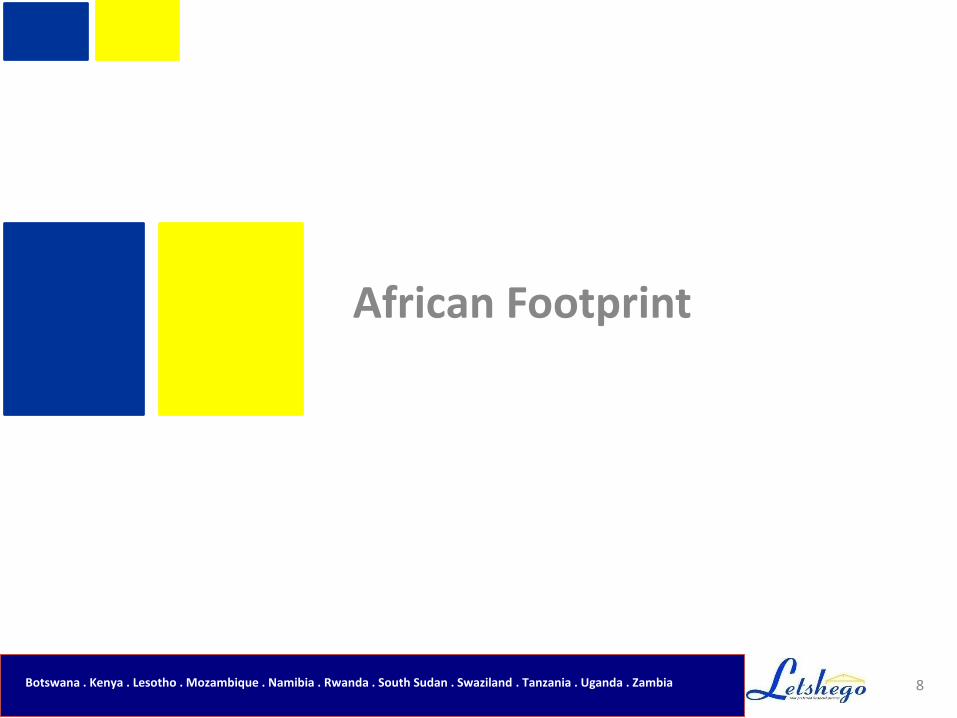
African Footprint
Swaziland
Botswana
Zambia
Tanzania
Uganda
Aim to be leading consumer finance provider
on African continent
Transform into a broader financial institution
Proven management ability to penetrate into
new growth markets
Strong relationships with key stakeholders
Established platform and infrastructure
(cross-border shared services center)
Focus on both horizontal and vertical
expansion
Acquisition of Micro Africa Limited added
Kenya, South Sudan and Rwanda as new
countries
Evaluate other expansion opportunities (
Ghana, Zimbabwe, and Nigeria)
MozambiqueExisting Operations
Potential Future
Expansion
Strategic Goals
Angola
Ghana
Namibia
Lesotho
Nigeria
Kenya
Zimbabwe
9
Rwanda
S Sudan
Botswana . Kenya . Lesotho . Mozambique . Namibia . Rwanda . South Sudan . Swaziland . Tanzania . Uganda . Zambia
Exiting
South Sudan

LFS Botswana. LFS Lesotho. LFS Mozambique. LFS Namibia.
LFS Swaziland. LFS Tanzania. LFS Uganda. LFS Zambia
LFS Botswana. LFS Lesotho. LFS Mozambique. LFS Namibia.
LFS Swaziland. LFS Tanzania. LFS Uganda. LFS Zambia
Description
African Footprint and Market Profiles where Letshego Operates - 31 July 2013
Botswana Swaziland Tanzania Uganda Zambia Namibia Mozamb’e Lesotho
10
Year established 1998 2006 2006 2005 2007 2008 2011 2012
Population 2,098,000 1,202,000 45,040,000 33,796,000 13,257,000 2,212,000 24,100,000 2,193,843
Formally employed 539,000 100,000 3,870,000 555,900 500,000 300,000 9,600,000 539,000
Government employees 133,000 35,358 573,000 250,000 150,000 93,000 248,000 43,000
Number of customers 32,095 6,006 52,139 31,793 1,550 38,723 14,435 2,716
Market penetration based
on total Govt employees
(%) 24% 17% 9% 13% 1% 48% 2% 8%
No of branches 4 2 16 13 1 11 8 1
No of satellite offices 7 0 90 23 0 1 0 2
Permanent Staff 77 9 84 50 11 34 39 9
Commission based staff 14 4 275 136 0 13 14 10
Botswana . Kenya . Lesotho . Mozambique . Namibia . Rwanda . South Sudan . Swaziland . Tanzania . Uganda . Zambia
LFS Botswana. LFS Lesotho. LFS Mozambique. LFS Namibia.
LFS Swaziland. LFS Tanzania. LFS Uganda. LFS Zambia
LFS Botswana. LFS Lesotho. LFS Mozambique. LFS Namibia.
LFS Swaziland. LFS Tanzania. LFS Uganda. LFS Zambia
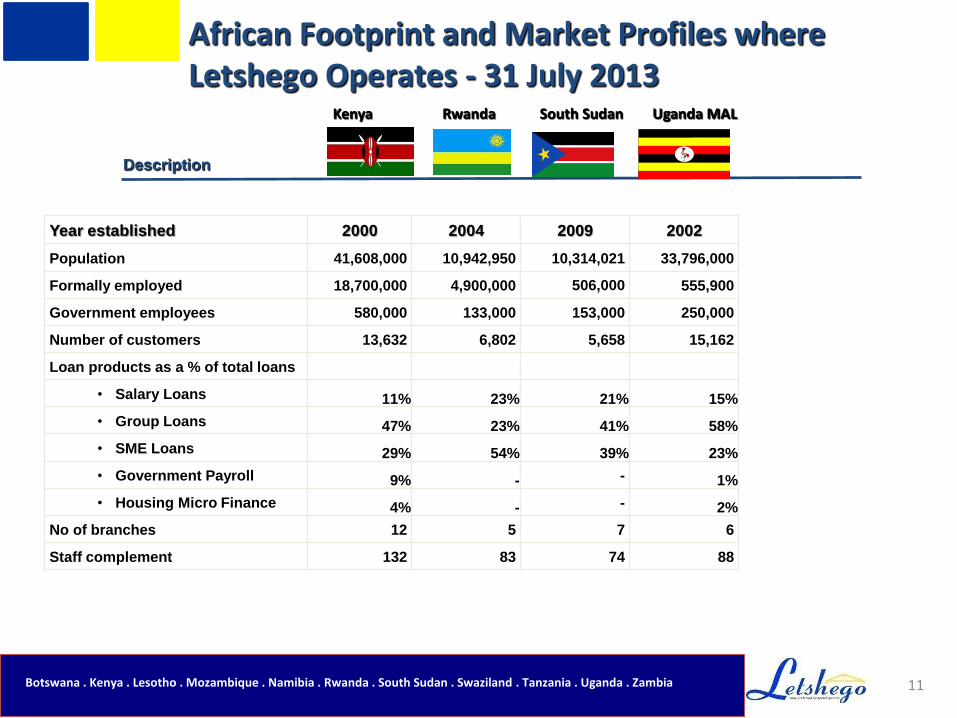
Description
African Footprint and Market Profiles where Letshego Operates - 31 July 2013
Kenya Rwanda South Sudan Uganda MAL
11
Year established 2000 2004 2009 2002
Population 41,608,000 10,942,950 10,314,021 33,796,000
Formally employed 18,700,000 4,900,000 506,000 555,900
Government employees 580,000 133,000 153,000 250,000
Number of customers 13,632 6,802 5,658 15,162
Loan products as a % of total loans
• Salary Loans 11% 23% 21% 15%
• Group Loans 47% 23% 41% 58%
• SME Loans 29% 54% 39% 23%
• Government Payroll 9% - - 1%
• Housing Micro Finance 4% - - 2%
No of branches 12 5 7 6
Staff complement 132 83 74 88
Botswana . Kenya . Lesotho . Mozambique . Namibia . Rwanda . South Sudan . Swaziland . Tanzania . Uganda . Zambia

LFS Botswana. LFS Lesotho. LFS Mozambique. LFS Namibia.
LFS Swaziland. LFS Tanzania. LFS Uganda. LFS Zambia
LFS Botswana. LFS Lesotho. LFS Mozambique. LFS Namibia.
LFS Swaziland. LFS Tanzania. LFS Uganda. LFS Zambia
Group Financial Highlights
31 July 2013
12Botswana . Kenya . Lesotho . Mozambique . Namibia . Rwanda . South Sudan . Swaziland . Tanzania . Uganda . Zambia

LFS Botswana. LFS Lesotho. LFS Mozambique. LFS Namibia.
LFS Swaziland. LFS Tanzania. LFS Uganda. LFS Zambia
LFS Botswana. LFS Lesotho. LFS Mozambique. LFS Namibia.
LFS Swaziland. LFS Tanzania. LFS Uganda. LFS Zambia 13
31 July 2013 Financial Highlights
Botswana . Kenya . Lesotho . Mozambique . Namibia . Rwanda . South Sudan . Swaziland . Tanzania . Uganda . Zambia
July 2013 July 2012 % change
Advances to customers P3.8 billion P3.1 billion 22%
Profits before tax P455.0million P422.9 million 8%
Impairment charges 2.0% 2.8% (33%)
Profits before tax generated outside Botswana
55% 39%
Dividend declare 90 million 84 million 7%
Cost to income ratio 27.6% 24%
Debt to equity 25.2% 30.4%

LFS Botswana. LFS Lesotho. LFS Mozambique. LFS Namibia.
LFS Swaziland. LFS Tanzania. LFS Uganda. LFS Zambia
LFS Botswana. LFS Lesotho. LFS Mozambique. LFS Namibia.
LFS Swaziland. LFS Tanzania. LFS Uganda. LFS Zambia
Group Statement of Financial position
14
AT 31 July 31 July 2013 31 July 2012 % Change 31 January 2013
(Reviewed) (Reviewed) (Audited)
P’000 P’000 P’000
ASSETS
Cash and cash equivalents 412,544 277,241 807,254
Advances to customers 3,819,982 3,139,596 22 3,336,204
Other receivables 45,373 29,867 12,143
Short term investments 17,939 11,439 26,206
Long term receivables - 11,563 11,468
Investment in associate 344
Plant and equipment 17,344 14,520 14,559
Intangible assets 32,600 7,179 12,457
Goodwill 55,250 49,948 49,948
Deferred taxation 7,980 10,645 8,939
Total assets 4,409,356 3,551,998 24 4,279,178
LIABILITIES AND EQUITY
Liabilities
Customer cash collateral 39,446 30,371 34,185
Trade and other payables 70,927 70,178 78,828
Income tax 29,947 12,455 28,327
Borrowings 858,830 801,952 7 1,277,395
Total liabilities 999,150 914,956 1,418,735
Shareholders’ equity
Stated capital 959,554 689,243 689,243
Foreign currency translation reserve (7,472) (21,324) (45,982)Legal reserve
2,696 -
Share based payment reserve 11,887 9,782 19,173
Retained earnings 2,354,479 1,887,458 2,112,485
Total equity attributable to equity holders of the parent
company 3,321,144 2,565,159 29 2,774,919
Minority interest 89,062 71,883 85,524
Total shareholders' equity 3,410,206 2,637,042 2,860,443
Total liabilities and equity 4,409,356 3,551,998 24 4,279,178
Botswana . Kenya . Lesotho . Mozambique . Namibia . Rwanda . South Sudan . Swaziland . Tanzania . Uganda . Zambia

LFS Botswana. LFS Lesotho. LFS Mozambique. LFS Namibia.
LFS Swaziland. LFS Tanzania. LFS Uganda. LFS Zambia
LFS Botswana. LFS Lesotho. LFS Mozambique. LFS Namibia.
LFS Swaziland. LFS Tanzania. LFS Uganda. LFS Zambia
Group Income Statement
15
6 months ended 6 months ended 12 months ended
31 July 2013 31 July 2012 31 January 2013
(Reviewed) (Reviewed) (Audited)
P'000 P'000 % Change P'000
Interest income 584,253 571,412 2 1,074,822
Interest expense (28,519) (42,686) (33) (108,807)
Net interest income 555,734 528,726 5 966,015
Premium income 52,522 44,975 86,992
Insurance fees (3,761) (3,803) (8,008)
Net interest and insurance income 604,495 569,898 1,044,999
Fee and commission income 64,338 40,301 60 127,646
Other operating income 7,911 6,094 11,479
Operating income 676,744 616,293 10 1,184,124
Employee benefits (81,720) (63,326) 29 (123,086)
Other operating expenses (99,383) (75,654) 31 (157,395)
Insurance Claims expense (6,481) (9,471) (25,853)
Insurance claim mitigation reserve movement (25) (1,306)
Net income before impairment and taxation 489,160 467,817 5 876,484
Impairment of advance (34,062) (40,680) (16) (35,097)
Profit before taxation for the period 455,098 427,137 7 841,387
Share of results of associate 344
Income tax (95,917) (93,532) (181,750)
Profit for the period 359,525 333,605 8 659,637
Attributable to :
Equity holders of the parent company 337,693 319,043 628,084
Minority interest 21,832 14,562 31,553
Profit for the period 359,525 333,605 8 659,637
Botswana . Kenya . Lesotho . Mozambique . Namibia . Rwanda . South Sudan . Swaziland . Tanzania . Uganda . Zambia
LFS Botswana. LFS Lesotho. LFS Mozambique. LFS Namibia.
LFS Swaziland. LFS Tanzania. LFS Uganda. LFS Zambia
LFS Botswana. LFS Lesotho. LFS Mozambique. LFS Namibia.
LFS Swaziland. LFS Tanzania. LFS Uganda. LFS Zambia
Segmental Reporting
16Botswana . Kenya . Lesotho . Mozambique . Namibia . Rwanda . South Sudan . Swaziland . Tanzania . Uganda . Zambia
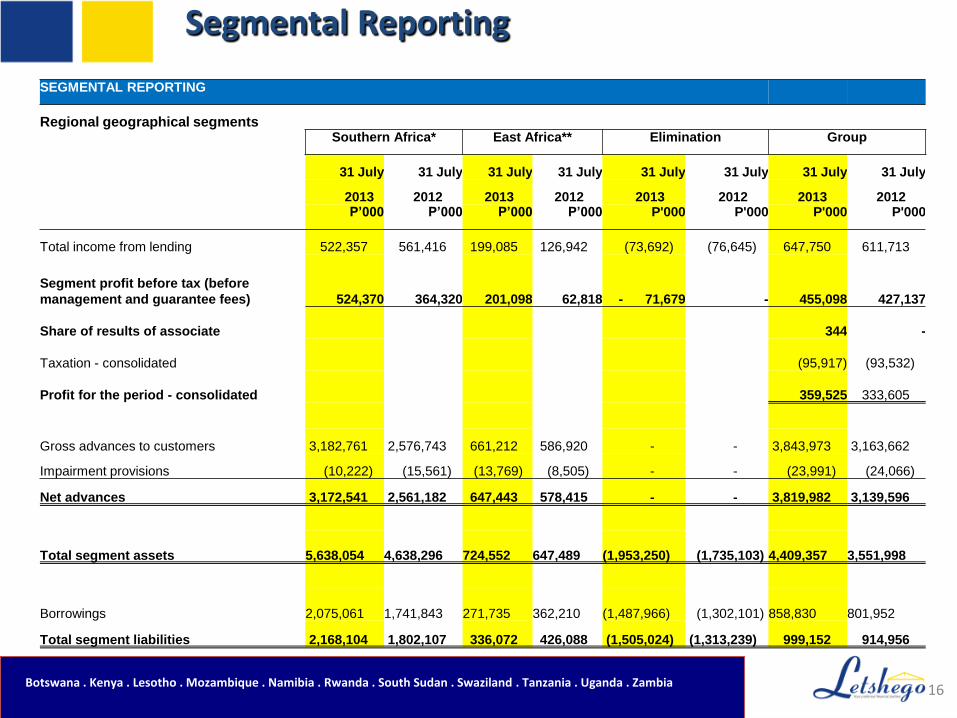
SEGMENTAL REPORTING
Regional geographical segmentsSouthern Africa* East Africa** Elimination Group
31 July 31 July 31 July 31 July 31 July 31 July 31 July 31 July
2013 2012 2013 2012 2013 2012 2013 2012 P’000 P’000 P’000 P’000 P'000 P'000 P'000 P'000
Total income from lending 522,357 561,416 199,085 126,942 (73,692) (76,645) 647,750 611,713
Segment profit before tax (before
management and guarantee fees) 524,370 364,320 201,098 62,818 - 71,679 - 455,098 427,137
Share of results of associate 344 -
Taxation - consolidated (95,917) (93,532)
Profit for the period - consolidated 359,525 333,605
Gross advances to customers 3,182,761 2,576,743 661,212 586,920 - - 3,843,973 3,163,662
Impairment provisions (10,222) (15,561) (13,769) (8,505) - - (23,991) (24,066)
Net advances 3,172,541 2,561,182 647,443 578,415 - - 3,819,982 3,139,596
Total segment assets 5,638,054 4,638,296 724,552 647,489 (1,953,250) (1,735,103) 4,409,357 3,551,998
Borrowings 2,075,061 1,741,843 271,735 362,210 (1,487,966) (1,302,101) 858,830 801,952
Total segment liabilities 2,168,104 1,802,107 336,072 426,088 (1,505,024) (1,313,239) 999,152 914,956

LFS Botswana. LFS Lesotho. LFS Mozambique. LFS Namibia.
LFS Swaziland. LFS Tanzania. LFS Uganda. LFS Zambia
LFS Botswana. LFS Lesotho. LFS Mozambique. LFS Namibia.
LFS Swaziland. LFS Tanzania. LFS Uganda. LFS Zambia
Group Loan Book Concentration
17Botswana . Kenya . Lesotho . Mozambique . Namibia . Rwanda . South Sudan . Swaziland . Tanzania . Uganda . Zambia
77%
68% 68%64%
58%
42%
3%9% 14%
13%
19%
7%
10%
8% 6% 8% 10%
3%2%
4% 5% 5% 7%
13%14%
9% 7% 7% 4%
3% 2%1% 1%
0%
20%
40%
60%
80%
100%
120%
HY2008 HY2009 HY2010 HY2011 HY2012 HY2013
Lesotho
South Sudan
Rwanda
Kenya
Zambia
Swaziland
Uganda
Tanzania
Mozambique
Namibia
Botswana

LFS Botswana. LFS Lesotho. LFS Mozambique. LFS Namibia.
LFS Swaziland. LFS Tanzania. LFS Uganda. LFS Zambia
LFS Botswana. LFS Lesotho. LFS Mozambique. LFS Namibia.
LFS Swaziland. LFS Tanzania. LFS Uganda. LFS Zambia 18Botswana . Kenya . Lesotho . Mozambique . Namibia . Rwanda . South Sudan . Swaziland . Tanzania . Uganda . Zambia
0.0
1.0
2.0
3.0
4.0
5.0
0
500,000
1,000,000
1,500,000
2,000,000
2,500,000
3,000,000
3,500,000
4,000,000
4,500,000
2010 2011 2012 2013 2014
Rest of Africa (P'000)
Botswana (P'000)
Impairment to gross advances (%)
-
100,000
200,000
300,000
400,000
500,000
600,000
700,000
2010 2011 2012 2013 2014
P'0
00
Second Half
First Half
-
5
10
15
20
25
30
0
200000
400000
600000
800000
1000000
2010 2011 2012 2013 2014
PB
T P
'000
Rest of Africa (P'000) Botswana (P'000)
-
5
10
15
20
25
30
35
40
45
50
-
500,000
1,000,000
1,500,000
2,000,000
2,500,000
3,000,000
3,500,000
2010 2011 2012 2013 2014Shareholder Funds (P'000) Debt to equity (%)
Shareholders Funds: Debt to Equity
Financial Indicators
Sh
are
ho
lde
r’s
Fu
nd
s
De
bt
Fu
nd
ing
Ad
va
nc
es
P’0
00
Imp
air
me
nt
as
% o
f a
ve
rag
e g
ros
s a
dva
nc
es
Advances vs. Impairment to Gross Advances
Geographic Diversification PBT to Cost Income Ratio
Profit After Tax (P’000)

LFS Botswana. LFS Lesotho. LFS Mozambique. LFS Namibia.
LFS Swaziland. LFS Tanzania. LFS Uganda. LFS Zambia
LFS Botswana. LFS Lesotho. LFS Mozambique. LFS Namibia.
LFS Swaziland. LFS Tanzania. LFS Uganda. LFS Zambia 19Botswana . Kenya . Lesotho . Mozambique . Namibia . Rwanda . South Sudan . Swaziland . Tanzania . Uganda . Zambia
0
2
4
6
8
10
12
14
16
2010 2011 2012 2013 2014
The
be
First Half Second Half Scrip
where applicable all figures / ratio’shave been adjusted to take into accountthe 10 for 1 share split that was
approved by shareholders during April 2010’
-
5.00
10.00
15.00
20.00
20102011
20122013
2014
EP
S (
in t
heb
e)
First Half Second Half
-
5
10
15
20
25
30
35
40
-
100,000
200,000
300,000
400,000
500,000
600,000
700,000
2010 2011 2012 2013 2014First Half Second Half Return on equity
-
5.00
10.00
15.00
20.00
25.00
-
100,000
200,000
300,000
400,000
500,000
600,000
700,000
2010 2011 2012 2013 2014First Half Second Half Return on assets
Financial IndicatorsDividends per Share (Thebe) ROA vs. PAT
ROE vs. PATBasic Earnings per Share
LFS Botswana. LFS Lesotho. LFS Mozambique. LFS Namibia.
LFS Swaziland. LFS Tanzania. LFS Uganda. LFS Zambia
LFS Botswana. LFS Lesotho. LFS Mozambique. LFS Namibia.
LFS Swaziland. LFS Tanzania. LFS Uganda. LFS Zambia
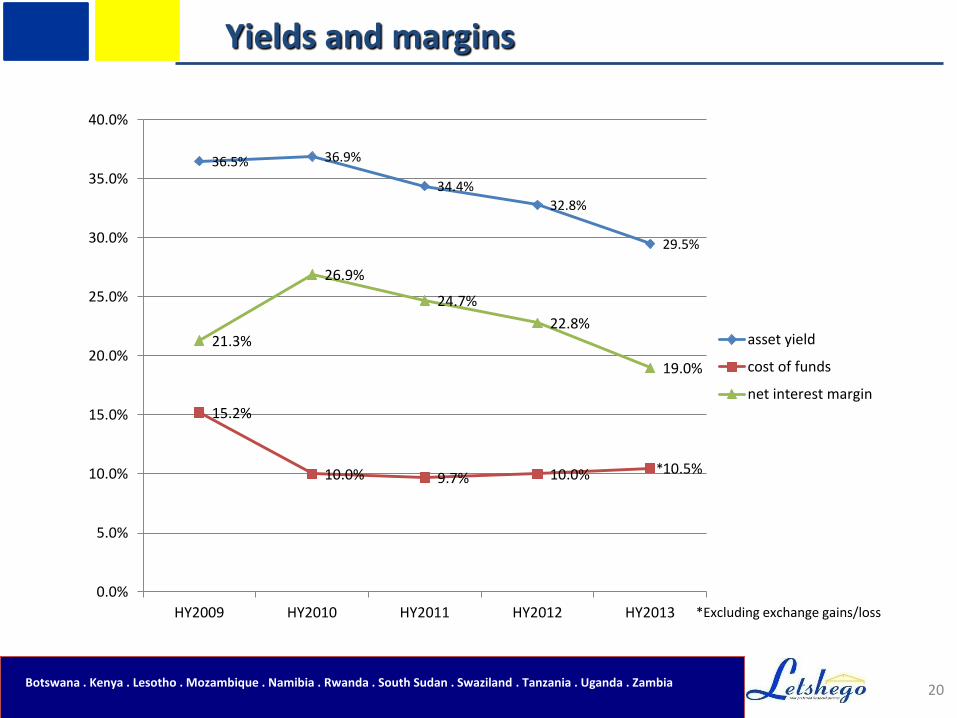
Yields and margins
20Botswana . Kenya . Lesotho . Mozambique . Namibia . Rwanda . South Sudan . Swaziland . Tanzania . Uganda . Zambia
36.5% 36.9%
34.4%
32.8%
29.5%
15.2%
10.0% 9.7% 10.0% 10.5%
21.3%
26.9%
24.7%
22.8%
19.0%
0.0%
5.0%
10.0%
15.0%
20.0%
25.0%
30.0%
35.0%
40.0%
HY2009 HY2010 HY2011 HY2012 HY2013
asset yield
cost of funds
net interest margin
*Excluding exchange gains/loss
*

LFS Botswana. LFS Lesotho. LFS Mozambique. LFS Namibia.
LFS Swaziland. LFS Tanzania. LFS Uganda. LFS Zambia
LFS Botswana. LFS Lesotho. LFS Mozambique. LFS Namibia.
LFS Swaziland. LFS Tanzania. LFS Uganda. LFS Zambia
31 July 2013 – Post Period end Developments
21
The group is at an advanced stage to dispose of its entire shareholding inLetshego Zambia. This disposal, if concluded, will not have any significantimpact on the group results given its current level of contribution.
Botswana . Kenya . Lesotho . Mozambique . Namibia . Rwanda . South Sudan . Swaziland . Tanzania . Uganda . Zambia
The Group continues to actively explore new regions in Africa, new businessstreams, both through acquisitive and “green fields” methods
Given prevailing economic conditions, the Directors expect continued growth inthe advances book during the financial year to 31 January 2014 and continuedprofitability.
31 July 2013 – Prospects

LFS Botswana. LFS Lesotho. LFS Mozambique. LFS Namibia.
LFS Swaziland. LFS Tanzania. LFS Uganda. LFS Zambia
LFS Botswana. LFS Lesotho. LFS Mozambique. LFS Namibia.
LFS Swaziland. LFS Tanzania. LFS Uganda. LFS Zambia
THANK YOU
22Botswana . Kenya . Lesotho . Mozambique . Namibia . Rwanda . South Sudan . Swaziland . Tanzania . Uganda . Zambia

LFS Botswana. LFS Lesotho. LFS Mozambique. LFS Namibia.
LFS Swaziland. LFS Tanzania. LFS Uganda. LFS Zambia
LFS Botswana. LFS Lesotho. LFS Mozambique. LFS Namibia.
LFS Swaziland. LFS Tanzania. LFS Uganda. LFS Zambia
Key contacts
Letshego Holdings Group Managing Director – Jan Claassen
Letshego Holdings Group CFO – Colm Patterson
T: +267 364 3011
W: www.letshego.com
E: [email protected] ; [email protected]
23Botswana . Kenya . Lesotho . Mozambique . Namibia . Rwanda . South Sudan . Swaziland . Tanzania . Uganda . Zambia
Recommended