Lesson 13: Populations, Samples, and Generalizing from a Sample to a Population
Date: 4/9/14
148
© 2013 Common Core, Inc. Some rights reserved. commoncore.org This work is licensed under a Creative Commons Attribution-NonCommercial-ShareAlike 3.0 Unported License.
NYS COMMON CORE MATHEMATICS CURRICULUM 7•5 Lesson 13
Lesson 13: Populations, Samples, and Generalizing from a
Sample to a Population
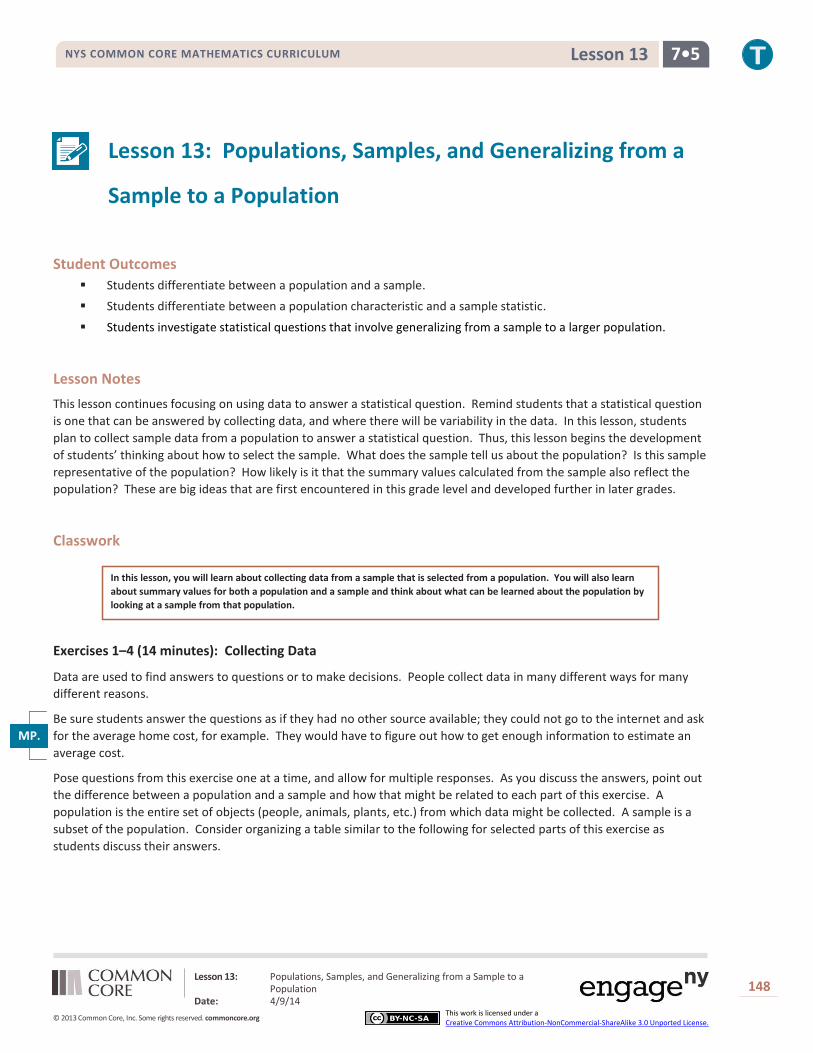
Student Outcomes
Students differentiate between a population and a sample.
Students differentiate between a population characteristic and a sample statistic.
Students investigate statistical questions that involve generalizing from a sample to a larger population.
Lesson Notes
This lesson continues focusing on using data to answer a statistical question. Remind students that a statistical question
is one that can be answered by collecting data, and where there will be variability in the data. In this lesson, students
plan to collect sample data from a population to answer a statistical question. Thus, this lesson begins the development
of students’ thinking about how to select the sample. What does the sample tell us about the population? Is this sample
representative of the population? How likely is it that the summary values calculated from the sample also reflect the
population? These are big ideas that are first encountered in this grade level and developed further in later grades.
Classwork
In this lesson, you will learn about collecting data from a sample that is selected from a population. You will also learn
about summary values for both a population and a sample and think about what can be learned about the population by
looking at a sample from that population.
Exercises 1–4 (14 minutes): Collecting Data
Data are used to find answers to questions or to make decisions. People collect data in many different ways for many
different reasons.
Be sure students answer the questions as if they had no other source available; they could not go to the internet and ask
for the average home cost, for example. They would have to figure out how to get enough information to estimate an
average cost.
Pose questions from this exercise one at a time, and allow for multiple responses. As you discuss the answers, point out
the difference between a population and a sample and how that might be related to each part of this exercise. A
population is the entire set of objects (people, animals, plants, etc.) from which data might be collected. A sample is a
subset of the population. Consider organizing a table similar to the following for selected parts of this exercise as
students discuss their answers.
MP.3

Lesson 13: Populations, Samples, and Generalizing from a Sample to a Population
Date: 4/9/14
149
© 2013 Common Core, Inc. Some rights reserved. commoncore.org This work is licensed under a Creative Commons Attribution-NonCommercial-ShareAlike 3.0 Unported License.
NYS COMMON CORE MATHEMATICS CURRICULUM 7•5 Lesson 13
Population Sample
pot of soup teaspoon of soup
all batteries of a
certain brand
The group of batteries put in
flashlights and timed to determine
how long they last
Exercises 1–4: Collecting Data
1. Describe what you would do if you had to collect data to investigate the following statistical questions using either a
sample statistic or a population characteristic. Explain your reasoning in each case.
a. How might you collect data to answer the question, “Does the soup taste good?”
Take a teaspoon of soup used to check the seasoning.
b. How might you collect data to answer the question, “How many movies do students in your class see in a
month?”
Ask each student to write down how many movies they went to and collect their responses.
c. How might you collect data to answer the question, “What is the median price of a home in our town?”
Find the price of homes listed in the newspaper and use that data to estimate the median price. Another
option is to go to a realty office and get prices for the homes they have listed for sale.
d. How might you collect data to answer the question, “How many pets do people own in my neighborhood?”
Answers might vary depending on where students live. Students living in urban areas with high rise
apartment buildings might ask some people on each floor of the building, or people as they go to work in the
morning; those living in suburban or rural areas might go door-to-door and ask their neighbors.
e. How might you collect data to answer the question, “What is the typical number of absences in math classes
at your school on a given day?”
Ask each math teacher how many students were absent in each of his or her math classes for a given day.
f. How might you collect data to answer the question, “What is the typical lifetime of a particular brand
flashlight battery?”
Put some batteries in flashlights and time how long they last.
g. How might you collect data to answer the question, “What percentage of girls and of boys in your school
have a curfew?”
Ask all students if they have a curfew. Note: Students may find it challenging to ask everyone in the school
the question (especially students at large schools). Let students describe how they could use a sample (for
example, asking a group of students selected at random from the school directory) to answer the question.
h. How might you collect data to answer the question, “What is the most common blood type of students in my
class?”
Prick the fingers of everyone in class to get some blood and have it tested.

Lesson 13: Populations, Samples, and Generalizing from a Sample to a Population
Date: 4/9/14
150
© 2013 Common Core, Inc. Some rights reserved. commoncore.org This work is licensed under a Creative Commons Attribution-NonCommercial-ShareAlike 3.0 Unported License.
NYS COMMON CORE MATHEMATICS CURRICULUM 7•5 Lesson 13
Remind students that numerical summary values calculated using data from an entire population are called population
characteristics. Numerical summary values calculated using data from a sample are called statistics. Let students work
with partners on Exercises 2–3. Discuss as a class.
A population is the entire set of objects (people, animals, plants, etc.) from which data might be collected. A sample is a
subset of the population. Numerical summary values calculated using data from an entire population are called
population characteristics. Numerical summary values calculated using data from a sample are called statistics.
2. For which of the scenarios in Exercise 1 did you describe collecting data from a population, and which from a
sample?
Answers will vary depending on the responses. Students should indicate that data on the soup seasoning, battery
life, median home cost, and number of pets would be collected from a sample. Data on the number absent from
math classes, the average number of movies, and most common blood type might be collected from the population.
3. Think about collecting data in the scenarios above. Give at least two reasons you might want to collect data from a
sample rather than from the entire population.
If you used the whole population, you might use it all up like in the soup and batteries examples. In some cases, a
sample can give you all of the information you need. For instance, you only need a sample of soup to see that the
seasoning of the soup in the pot is good because it is the same all the way through. Sometimes it is too hard to
collect the data for an entire population. It might cost too much or take too long to ask everyone in a population.
4. Make up a result you might get in response to the situations in Exercise 1, and identify whether the result would be
based on a population characteristic or a sample statistic.
a. Does the soup taste good?
“Yes, but it needs more salt.” The spoonful seasoning would be similar to a statistic. (Although it is not really
a “statistic,” it is based on a sample, so in that way it is like a statistic.)
b. How many movies do your classmates see in a month?
The mean number of movies was ; population characteristic.
c. What is the median price of a home in our town?
; statistic.
d. How many pets do people in my neighborhood own?
pet, either a population characteristic or a statistic (depending on method used to collect the data).
e. What is the typical number of absences in math classes at your school on a given day?”
absences (mean or median representing typical); population characteristic.
f. What is the typical lifetime of a particular brand of flashlight batteries?
hours; sample statistics.
g. What percentage of girls and of boys in your school that have a curfew?
of the girls, and of the boys have a curfew; either a population characteristic or statistic depending
on method of collecting data.

Lesson 13: Populations, Samples, and Generalizing from a Sample to a Population
Date: 4/9/14
151
© 2013 Common Core, Inc. Some rights reserved. commoncore.org This work is licensed under a Creative Commons Attribution-NonCommercial-ShareAlike 3.0 Unported License.
NYS COMMON CORE MATHEMATICS CURRICULUM 7•5 Lesson 13
h. What is the most common blood type of my classmates?
Type is the most common, with of the class having ; the class is the population, so the
would be a population characteristic. (It could be possible to think of the class as a sample of all seventh
graders, and then it would be a sample statistic.)
Exercise 5 (9 minutes): Population or Sample?
Let students continue to work with their partners on Exercise 5. Confirm answers as a class.
Exercise 5: Population or Sample?
5. Indicate whether the following statements are summarizing data collected to answer a statistical question from a
population or from a sample. Identify references in the statement as population characteristics or sample statistics.
a. of the responders to a poll at a university indicated that wealth needed to be distributed more evenly
among people.
The population would be all students attending the university; poll respondents would be a sample, not the
population. would be a sample statistic.
b. Are students in the Bay Shore school district proficient on the state assessments in mathematics? After all
the tests taken by the students in the Bay Shore schools were evaluated, over of those students were at
or above proficient on the state assessment.
The population would be all of the students in the Bay Shore school district; would be a population
characteristic.
c. Does talking on mobile phones while driving distract people? Researchers measured the reaction times of
study participants as they talked on mobile phones and found that the average level of distraction from their
driving was rated out of .
The study participants would be a sample. All drivers would be the population; the out of would be a
sample statistic.
d. Did most people living in New York in 2010 have at least a high school education? Based on the data
collected from all New York residents in 2010 by the United States Census Bureau, of people living in
New York had at least a high school education.
The population is all of the people living in New York in 2010; the would be a population
characteristic.
e. Were there more deaths than births in the United States between July 2011 and July 2012? Data from a
health service agency indicated that there were more deaths than births in the U.S. during that
timeframe.
This is a good question to discuss with students. The population would be all people in the U.S., but the data
probably came from a sample of the population. If necessary, point out to students that a nearly complete
census of the United State did not occur in 2011 or 2012; the would be a sample statistic. (Although
obtaining number of births and deaths out of everyone in the U.S. would be possible for 2011 or 2012, it
would be very difficult and is generally done when a national census is conducted.)
f. What is the fifth best-selling book in the United States? Based on the sales of books in the United States, the
fifth best-selling book was Oh, the Places You’ll Go! by Dr. Seuss.
The population would be a list of all best-selling books in the U.S. (using some subjective benchmark for
“best”); the number of copies sold for each book would need to be known to determine the fifth best-selling
book, so this is a population characteristic.

Lesson 13: Populations, Samples, and Generalizing from a Sample to a Population
Date: 4/9/14
152
© 2013 Common Core, Inc. Some rights reserved. commoncore.org This work is licensed under a Creative Commons Attribution-NonCommercial-ShareAlike 3.0 Unported License.
NYS COMMON CORE MATHEMATICS CURRICULUM 7•5 Lesson 13
Exercises 6–8 (14 minutes): A Census
This exercise would be most effective if students can access the census web site to look at the questionnaires and data
from the 2010 census: www.census.gov/2010census/data/ . They can access the form and data from the entire United
States related to the census questions. Students should understand that the census data is used to allocate the number
of representatives each state has in the House of Representatives, and to allocate federal funds for various services and
programs.
If it is not possible for students to access the site, make a copy of the history of the United States Census for students to
use in responding to the questions. If needed, a copy of the pages can be found at the end of the lesson. Let students
work with a partner. If class time is running short, you may choose to work on these exercises as a class.

Lesson 13: Populations, Samples, and Generalizing from a Sample to a Population
Date: 4/9/14
153
© 2013 Common Core, Inc. Some rights reserved. commoncore.org This work is licensed under a Creative Commons Attribution-NonCommercial-ShareAlike 3.0 Unported License.
NYS COMMON CORE MATHEMATICS CURRICULUM 7•5 Lesson 13
Exercises 6–8: A Census
6. When data are collected from an entire population, it is called a census. The United States takes a census of its
population every ten years, with the last one in 2010. Go to http://ri.essortment.com/unitedstatesce_rlta.htm to
find the history of the U.S. census.
a. Identify three things that you found to be interesting.
Students might suggest (1) the idea of a census dates back to ancient Egyptian times; (2) the U.S. constitution
mandates a census every years; (3) the first censuses only counted the number of men; (4) until 1950, all of
the counting was done manually.
b. Why is the census important in the United States?
According to the constitution, it is important for taxation purposes and in determining the number of
representatives in Congress. Other reasons might include planning for things such as roads and schools.
7. Go to the site: www.census.gov/2010census/popmap/ipmtext.php?fl=36
Select the state of New York.
a. How many people were living in New York for the 2010 census?
people.
b. Estimate the ratio of those and older to those under years old. Why is this important to think about?
The ratio is to or about to , a bit less than . It is important because when
there are a greater number of older people than younger people, there will be fewer workers than people
who have to be supported.
c. Is the ratio a population characteristic or a statistic? Explain your thinking.
The ratio is a population characteristic because it is based on data from the entire population of New York
state.
8. The American Community Survey (ACS) takes samples from a small percentage of the US population in years
between the Censuses. (www.census.gov/acs/www/about_the_survey/american_community_survey/)
a. What is the difference between the way the ACS collects information about the U.S. population and the way
the U.S. Census Bureau collects information?
The ACS obtains its results from a small percentage of the U.S. population while the Census Bureau attempts
to obtain its results from the entire population.
b. In 2011, the ACS sampled workers living in New York about commuting to work each day. Why do you think
these data are important for the state to know?
In order to plan for the best ways to travel, communities need to know how many people are using the roads,
which roads, whether they travel by public transportation, and so on.
c. Suppose that from a sample of New York workers, reported traveling more than an hour
to work each day. From this information, statisticians determined that between and of the
workers in the state traveled more than an hour to work every day in 2011. If there were
workers in the entire population, about how many traveled more than an hour to work each day?
Between about and people.

Lesson 13: Populations, Samples, and Generalizing from a Sample to a Population
Date: 4/9/14
154
© 2013 Common Core, Inc. Some rights reserved. commoncore.org This work is licensed under a Creative Commons Attribution-NonCommercial-ShareAlike 3.0 Unported License.
NYS COMMON CORE MATHEMATICS CURRICULUM 7•5 Lesson 13
d. Reasoning from a sample to the population is called making an inference about a population characteristic.
Identify the statistic involved in making the inference in part (c).
The sample statistic is or .
e. The data about traveling time to work suggest that across the United States typically between and
of commuters travel alone, to carpool, and to use public transportation. Survey your
classmates to find out how a worker in their family gets to work. How do the results compare to the national
data? What might explain any differences?
Answers will vary. Reasons for the differences will largely depend on the type of community in which
students live. Those living near a large metropolitan area, such as Washington, D.C. or New York City, may
have lots of commuters using public transportation; while other areas, such as Milwaukee, WI, do not have
many public transportation options.
Closing (4 minutes)
Consider posing the following questions; allow a few student responses for each.
Describe two examples you have read about or experienced where data were collected from a population and
two examples where data were collected from a sample drawn from a population.
Data collected from a population could be grades on a test in class or the amount of taxes paid on
homes in a given area. Data collected from a sample could be polls about an election or studies of
certain kinds of new medicines or treatments.
What does it mean to make an inference in statistics?
You get information from a sample and draw conclusions from that information as to what that same
information might be for the whole population.
Exit Ticket (4 minutes)
Lesson Summary
The focus of this lesson was on collecting information either from a population, which is the entire set of elements
in the group of interest, or a subset of the population, called a sample. One example of data being collected from a
population is the US Census, which collects data from every person in the United States every ten years. The
Census Bureau also samples the population to study things that affect the economy and living conditions of people
in the U.S. in more detail. When data from a population are used to calculate a numerical summary, the value is
called a population characteristic. When data from a sample are used to calculate a numerical summary, the value
is called a sample statistic. Sample statistics can be used to learn about population characteristics.

Lesson 13: Populations, Samples, and Generalizing from a Sample to a Population
Date: 4/9/14
155
© 2013 Common Core, Inc. Some rights reserved. commoncore.org This work is licensed under a Creative Commons Attribution-NonCommercial-ShareAlike 3.0 Unported License.
NYS COMMON CORE MATHEMATICS CURRICULUM 7•5 Lesson 13
Name ___________________________________________________ Date____________________
Lesson 13: Populations, Samples, and Generalizing from a
Sample to a Population
Exit Ticket
What is the difference between a population characteristic and a sample statistic? Give an example to support your
answer. Clearly identify the population and sample in your example.

Lesson 13: Populations, Samples, and Generalizing from a Sample to a Population
Date: 4/9/14
156
© 2013 Common Core, Inc. Some rights reserved. commoncore.org This work is licensed under a Creative Commons Attribution-NonCommercial-ShareAlike 3.0 Unported License.
NYS COMMON CORE MATHEMATICS CURRICULUM 7•5 Lesson 13
Exit Ticket Sample Solutions
What is the difference between a population characteristic and a sample statistic? Give an example to support your
answer. Clearly identify the population and sample in your example.
A population characteristic is a summary measure that describes some feature of population, the entire set of things or
objects from which data might be collected. A sample statistic is a summary measure that describes a feature of some
subset of the population. For example, the population could be all of the students in school, and a population
characteristic could be the month in which most of the students were born. A sample of students could be those that had
fifth-hour mathematics, and a sample statistic could be their grade-point average.
Problem Set Sample Solutions
The problem set is intended to support students’ emerging understanding of the difference between a population and a
sample, and summary measures for each. Students should do at least problems 1, 3, and 4 of the set below.
1. The lunch program at Blake Middle School is being revised to align with the new nutritional standards that reduce
calories and increase servings of fruit and vegetables. The administration decided to do a census of all students at
Blake Middle School by giving a survey to all students about the school lunches.
http://frac.org/federal-foodnutrition-programs/school-breakfast-program/school-meal-nutrition-standards
a. Name some questions that you would include in the survey. Explain why you think those questions would be
important to ask.
Answers will vary. Possibilities include: How often do you eat the school lunch? Do you ever bring your lunch
from home? What is your favorite food? Would you eat salads if they were served? What do you drink with
your lunch? What do you like about our lunches now? What would you change? Explanations would vary
but might include the need to find out how many students actually eat lunch, and if the lunches were
different, would more students eat? What types of food should be served so more people will eat it?
b. Read through the paragraph below that describes some of the survey results. Then, identify the population
characteristics and the sample statistics.
About of the students surveyed eat the school lunch regularly. The median number
of days per month that students at Blake Middle School ate a school lunch was
days. of students responded that their favorite fruit is bananas. The survey
results for Tanya’s 7th grade homeroom showed that the median number of days per
month that her classmates ate lunch at school was and only liked bananas.
The fiesta salad was approved by of the group of students who tried it, but when
it was put on the lunch menu, only of the students liked it. Of the seventh
graders as a whole, liked spicy jicama strips, but only out of all the middle
school students liked them.
Population characteristics: eat school lunch; median number of days is ; like bananas; liked
fiesta salad; out of liked jicama strips.
Sample statistics: homeroom median number of days ; liked bananas; liked fiesta salad in trial;
liked spicy jicama strips.
Lesson 13: Populations, Samples, and Generalizing from a Sample to a Population
Date: 4/9/14
157
© 2013 Common Core, Inc. Some rights reserved. commoncore.org This work is licensed under a Creative Commons Attribution-NonCommercial-ShareAlike 3.0 Unported License.
NYS COMMON CORE MATHEMATICS CURRICULUM 7•5 Lesson 13
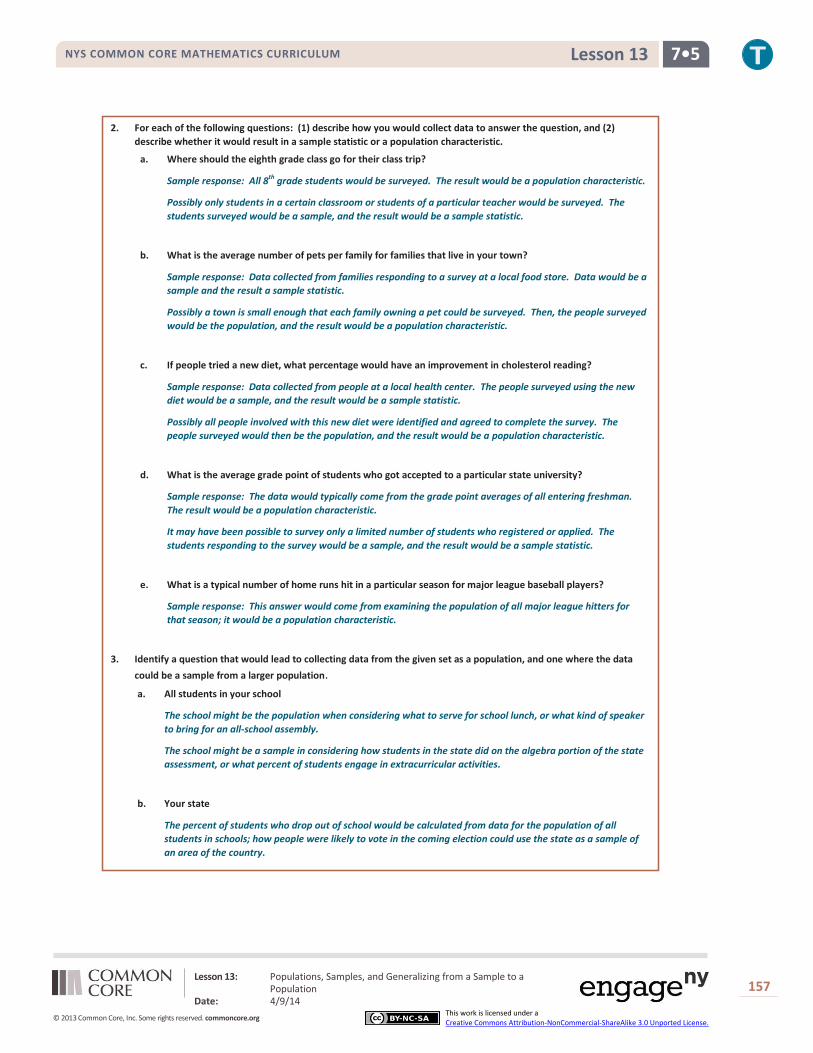
2. For each of the following questions: (1) describe how you would collect data to answer the question, and (2)
describe whether it would result in a sample statistic or a population characteristic.
a. Where should the eighth grade class go for their class trip?
Sample response: All 8th grade students would be surveyed. The result would be a population characteristic.
Possibly only students in a certain classroom or students of a particular teacher would be surveyed. The
students surveyed would be a sample, and the result would be a sample statistic.
b. What is the average number of pets per family for families that live in your town?
Sample response: Data collected from families responding to a survey at a local food store. Data would be a
sample and the result a sample statistic.
Possibly a town is small enough that each family owning a pet could be surveyed. Then, the people surveyed
would be the population, and the result would be a population characteristic.
c. If people tried a new diet, what percentage would have an improvement in cholesterol reading?
Sample response: Data collected from people at a local health center. The people surveyed using the new
diet would be a sample, and the result would be a sample statistic.
Possibly all people involved with this new diet were identified and agreed to complete the survey. The
people surveyed would then be the population, and the result would be a population characteristic.
d. What is the average grade point of students who got accepted to a particular state university?
Sample response: The data would typically come from the grade point averages of all entering freshman.
The result would be a population characteristic.
It may have been possible to survey only a limited number of students who registered or applied. The
students responding to the survey would be a sample, and the result would be a sample statistic.
e. What is a typical number of home runs hit in a particular season for major league baseball players?
Sample response: This answer would come from examining the population of all major league hitters for
that season; it would be a population characteristic.
3. Identify a question that would lead to collecting data from the given set as a population, and one where the data
could be a sample from a larger population.
a. All students in your school
The school might be the population when considering what to serve for school lunch, or what kind of speaker
to bring for an all-school assembly.
The school might be a sample in considering how students in the state did on the algebra portion of the state
assessment, or what percent of students engage in extracurricular activities.
b. Your state
The percent of students who drop out of school would be calculated from data for the population of all
students in schools; how people were likely to vote in the coming election could use the state as a sample of
an area of the country.
Lesson 13: Populations, Samples, and Generalizing from a Sample to a Population
Date: 4/9/14
158
© 2013 Common Core, Inc. Some rights reserved. commoncore.org This work is licensed under a Creative Commons Attribution-NonCommercial-ShareAlike 3.0 Unported License.
NYS COMMON CORE MATHEMATICS CURRICULUM 7•5 Lesson 13
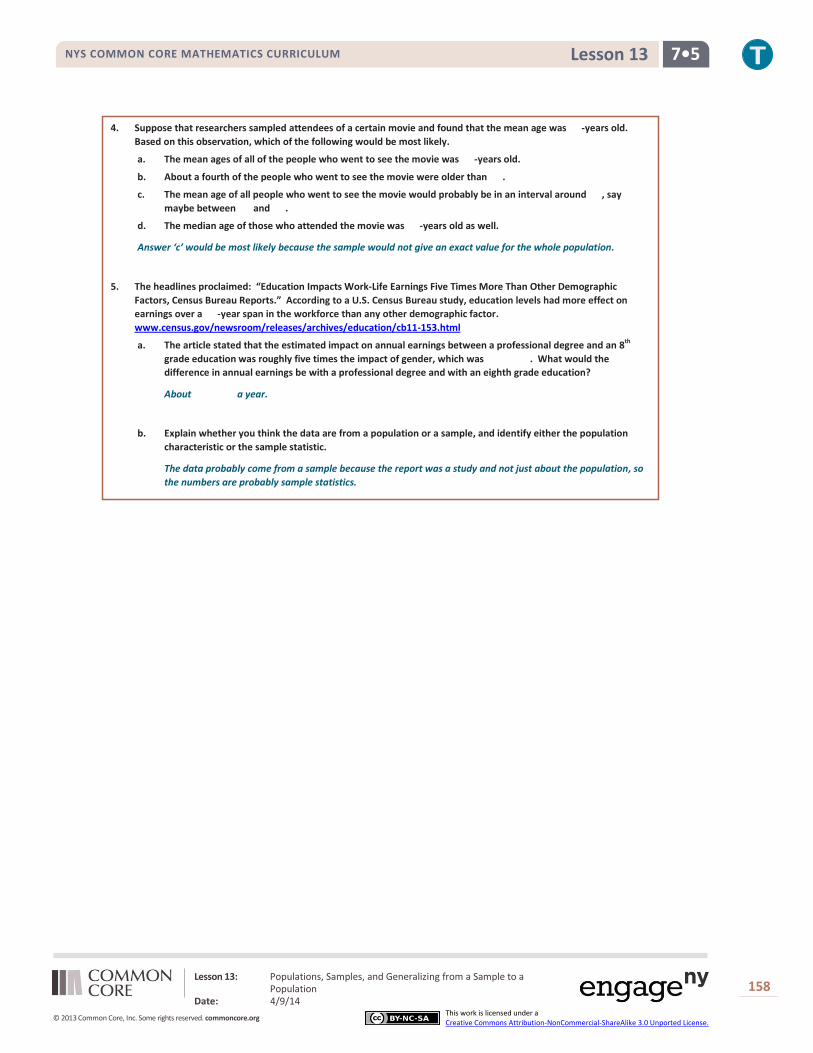
4. Suppose that researchers sampled attendees of a certain movie and found that the mean age was -years old.
Based on this observation, which of the following would be most likely.
a. The mean ages of all of the people who went to see the movie was -years old.
b. About a fourth of the people who went to see the movie were older than .
c. The mean age of all people who went to see the movie would probably be in an interval around , say
maybe between and .
d. The median age of those who attended the movie was -years old as well.
Answer ‘c’ would be most likely because the sample would not give an exact value for the whole population.
5. The headlines proclaimed: “Education Impacts Work-Life Earnings Five Times More Than Other Demographic
Factors, Census Bureau Reports.” According to a U.S. Census Bureau study, education levels had more effect on
earnings over a -year span in the workforce than any other demographic factor.
www.census.gov/newsroom/releases/archives/education/cb11-153.html
a. The article stated that the estimated impact on annual earnings between a professional degree and an 8th
grade education was roughly five times the impact of gender, which was . What would the
difference in annual earnings be with a professional degree and with an eighth grade education?
About a year.
b. Explain whether you think the data are from a population or a sample, and identify either the population
characteristic or the sample statistic.
The data probably come from a sample because the report was a study and not just about the population, so
the numbers are probably sample statistics.
Lesson 13: Populations, Samples, and Generalizing from a Sample to a Population
Date: 4/9/14
159
© 2013 Common Core, Inc. Some rights reserved. commoncore.org This work is licensed under a Creative Commons Attribution-NonCommercial-ShareAlike 3.0 Unported License.
NYS COMMON CORE MATHEMATICS CURRICULUM 7•5 Lesson 13
History of the U.S. Census
Do you realize that our census came from the Constitution of the United States of America? It was nowhere near being
the very first census ever done, though. The word "census" is Latin, and it means to "tax." Archeologists have found
ancient records from the Egyptians dating as far back as 3000 B.C.
In the year of 1787, the United States became the first nation to make a census mandatory in its constitution. Article
One, Section Two of this historic document directs that “Representatives and direct taxes shall be apportioned among the
several states ... according to their respective numbers ...” It then goes on to describe how the “numbers” or “people” of
the United States would be counted and when.
Therefore, the first census was started in the year of 1790. The members of Congress gave the responsibility of visiting
every house and every establishment and filling out the paperwork to the federal marshals. It took a total of eighteen
months, but the tally was finally in on March of 1792. The results were given to President Washington. The first census
consisted of only a few simple questions about the number of people in the household and their ages. (The census was
primarily used to determine how many young men were available for wars.)
Every ten years thereafter, a census has been performed. In 1810, however, Congress decided that, while the population
needed to be counted, other information needed to be gathered, also. Thus, the first census in the field of manufacturing
began. Other censuses [are also conducted] on: agriculture, construction, mining, housing, local governments,
commerce, transportation, and business.
Over the years, the census changed and evolved many times over. Finally, in 1950, the UNIVAC (which stood for Universal
Automatic Computer) was used to tabulate the results of that year's census. It would no longer be done manually. Then,
in 1960, censuses were sent via the United States Postal Service. The population was asked to complete the censuses and
then wait for a visit from a census official.
Nowadays, as with the 2000 census, questionnaires were sent out to the population. The filled-out censuses are
supposed to be returned via the mail to the government Census Bureau. There are two versions of the census, a short
form and then a longer, more detailed form. If the census is not filled out and sent back by the required date, a census
worker pays a visit to each and every household who failed to do so. The worker then verbally asks the head of the
household the questions and fills in the appropriate answers on a printed form.
Being an important part of our Constitution, the census is a useful way for the Government to find out, not only the
number of the population, but also other useful information.
eSsortment http://ri.essortment.com/unitedstatesce_rlta.htm
Recommended