1
Legal Institutions, Ownership Concentration, and Stock
Repurchases around the world: Signaling or Mimicking?
In-Mu Haw
Professor of Accounting, M.J. Neeley School of Business
Texas Christian University, Fort Worth, TX 76129
Tel: (817) 257-7563 Fax: (817) 257-7227 Email: [email protected]
Simon SM Ho
Professor of Accounting, Rector’s Office,
University of Macau, Av. Padre Tomás Pereira Taipa, Macau
Tel: (853) 8397 4313 Fax: (853) 2883 5961 Email: [email protected]
Bingbing Hu
Assistant Professor of Accounting, School of Business
Hong Kong Baptist University, Kowloon Tong, Kowloon, Hong Kong
Tel: (852) 3411-5273 Fax: (852) 3411-5588 Email: [email protected]
Xu Zhang
Assistant Professor of Accounting, Faculty of Business Administration
University of Macau, Av. Padre Tomás Pereira, Taipa, Macau
Tel: (853) 8397- 4186 Fax: (853) 2883 8320 Email: [email protected]
Current version: November 2011
2
Legal Institutions, Ownership Concentration, and Stock
Repurchases around the world: Signaling or Mimicking?
Abstract
In the long history of signaling theory, one of the central puzzles is how to assess and ensure the quality of signals, which this study aims to address in the context of stock repurchases. Based on an ex-ante proxy (earnings quality prior to repurchase activities) for potential mimicking repurchases and collecting open market stock repurchase data from 30
economies around the world, we identify a subset of repurchasing firms who are likely to use stock
repurchases as a tool to mislead investors, and find that the long-term operating and market
performance following these mimicking repurchases do not improve, which is contradictory to the
conventional signaling stories. We find that mimicking firms are potentially over-valued, cash-poor,
relatively small in size, and are more likely to reduce capital investment and issue new shares or
resell treasury shares in the repurchase year. The latter indicates a lower cost associated with the
mimicked repurchases. Furthermore, we find that mimicking activities are more likely to occur in
countries with weak investor protection and in firms with highly concentrated ownership. However,
the mimicking transactions induced by highly concentrated ownership structure are curbed by
strong investor protection institutions in a country.
Keywords: Signaling Theory, Agency Theory,Stock Market Manipulation,Stock Repurchase,
Earnings Quality, Ownership Structure
3
1. Introduction
Open market stock repurchases have become an increasingly frequent corporate transaction,
especially in the U.S., and have received great attention from both academics and practitioners.
Grullon & Michaely (2002) report that U.S. firms have spent more money annually on stock
repurchases than on dividends since 1999. Outside the U.S., more and more countries have adopted
laws allowing firms to buyback their stocks since late 1990s. As a result, repurchase programs have
become more common worldwide. Eije & Megginson (2008) find that the fraction of European
firms paying dividends has declined significantly, while the proportion of repurchasing firms has
grown steadily. A similar trend can be observed in East Asia. For instance, Japanese firms have
been able to execute stock repurchases without approval at a shareholders’ meeting since 1997
following revision of the Commercial Law. Despite the growing popularity of stock repurchases as
a payout method in multinational companies, international research on stock repurchases is sparse.
Given the high degree of institutional variation across countries, what we know about stock
repurchases in the U.S. may not be generalizable elsewhere.
Unlike dividends, stock repurchase is a flexible and temporary payout method to shareholders
because firms can cancel this payout by reselling the treasury shares or issuing new shares, and thus
does not require a long-term commitment. Managers can exercise discretion on the timing and size
of repurchases. Prior research identifies several motives for stock repurchases: signaling
undervaluation, distributing free cash flow, achieving optimal leverage ratio, funding stock option,
and defending takeover (see, for example, Commet & Jarrell, 1991; Gup & Nam, 2001; Ikenberry,
4
Lakonishok, & Vermaelen, 1995; Lie, 2005). Although firms repurchase stocks for multiple
purposes, the extant literature points out that the signaling of undervaluation is the dominant motive
(Dittmar, 2000; Chan, Ikenberry, & Lee, 2004). Brav, Graham, Harvey, & Michaely (2005) show
that managers time the market when they believe their stock price is low. The signaling hypothesis
suggests that when there exists information asymmetry, corporate insiders use repurchases to signal
undervaluation or better future performance, hence, the stock repurchase announcements should be
followed by positive price movements and positive changes in the firm’s expectation on operating
performance. In contrast to the conventional stories, recent studies find that some managers use
repurchase as a tool to mislead the investors. Notably, Hribar, Jenkins, & Johnson (2006) document
that firms use stock repurchase to meet or beat analysts’ earnings forecasts. Chan, Ikenberry, Lee, &
Wang (2010) find that a subset of repurchasing firms does not show improvement in operating and
market performance following repurchase programs. Massa, Rehman, & Vermaelen (2007)
document that in concentrated industries, repurchases are chosen as a strategic reaction to the other
firms’ repurchase decisions rather than motivated by the desire to pursue undervaluation advantages.
Gong, Louis, & Sun (2008) find that managers manipulate earnings prior to repurchases.
Motivated by the emerging literature on mimicking repurchases, this study investigates the role
of a country’s investor protection institutions and a firm’s internal governance system (proxied by
ownership structure) in shaping the quality of signaling via repurchase activities in an international
setting. The extant literature provides little knowledge on this query and this study attempts to fill in
the void.
5
Insiders have incentives to undertake mimicking repurchases if mimicking can bring them
private benefits. Examples of such private benefits range from the enhancement of stock-based
remuneration to inducement for conversion of convertible bonds. Stock-based payments account for
a large proportion of executives’ total remuneration and CEO’s long-term cumulative financial gain
from unexpected good stock price performance is positive and significant (Boschen, Duru, Gordon,
& Smith, 2003). Moreover, CEO turnover is associated with poor stock returns (DeFond & Hung,
2004). As stock repurchases are interpreted as a good signal and markets react positively to
repurchase programs, entrenched insiders have incentives to undertake repurchases to manipulate
stock prices, hence enhance their own remuneration or keep their executive positions at the cost of
outside investors. Besides, stock repurchase could enhance reported earnings per share (Hribar et al.,
2006). Jung, Kim, & Stulz (1996) argue that agency problems may lead managers to ignore the
costs of issuing equity. It is likely that stock repurchases are used as an inducement for issuing
equity. For example, some firms buy back shares during the conversion period of convertible bonds
and stop buyback after the expiry date of conversion. Firms may also buy back shares before
issuance of new shares in order to boost the offering price. Although stock repurchases can be costly
as a mimicking tool because cash is consumed, repurchase programs are less costly to insiders as
long as cash obtained or saved is greater than that consumed, or the cash consumed is borne by
outside investors.
In this study, we regard repurchases as mimicking repurchases if they are driven by managers’
intention to mislead the market rather than by the conventional motives to signal undervaluation.
6
Earnings management literature suggests that earnings quality can reflect managers’ intention, and
low earnings quality leads to less efficient capital investment decisions (e.g., Biddle, Hilary, &
Verdi (2009); Chan, Chan, Jegadeesh, & Lakonishok, 2006; Liang & Wen, 2007). In the context of
the repurchases, Gong et al. (2008) and Chan et al. (2010) document that managers manipulate
earnings prior to repurchases and the pre-repurchase discretionary accruals are negatively associated
with future performance. Following these literature, we consider earnings quality as a noisy proxy
for managerial intention, and conjecture that repurchasing firms who aggressively employ positive
and large discretionary accruals prior to stock repurchases are likely to mislead the market. We thus
ex-ante identify a subset of repurchasing firms which are likely to be mimickers, using
pre-repurchase discretionary accruals as a noisy proxy for mimicking.
Based on 8,578 repurchases from 1999 to 2006 across 30 economies around the world, our
empirical results show that both the long-term operating and market performance following actual
repurchases do not improve for the potential mimickers, while improve for the non-mimickers. An
alternative proxy for identifying mimickers provides similar results. The analysis shows that the
mimickers have higher market-to-book ratio (i.e., overvalued) and lower free cash flows, which are
contradictory to the undervaluation and free cash flow hypotheses. They exhibit poorer operating
performance, lower investment in capital expenditure, lower level of intangible assets, and smaller
firm size relative to non-mimickers. Furthermore, this study documents that entrenched insiders
minimize their costs of false signaling by reselling the treasury shares or issuing new shares
following the repurchases.
7
More importantly, we test the impact of country-level and firm-level governance systems on
the quality of signaling through repurchases and find that mimicking activities are more likely to
exist in countries with weak investor protection (proxied by anti-self-dealing and legal origin) and
in firms with high agency problems (proxied by concentrated ownership). Our results provide
partial explanation about recent findings that stock repurchases are less effective than dividends in
mitigating agency conflicts in countries with poor investor protection (e.g., Pinkowitz, Stultz, &
Williamson, 2006; Haw, Ho, Hu, & Zhang, 2011). Further analysis illustrates that the mimicking
behavior induced by ownership concentration is restrained by a country’s strong investor protection
institutions. Our findings are robust to alternative measure for mimicking repurchases and
governance indices, sample composition, and refined measures of repurchases.
Our study contributes to a growing body of literature on stock repurchases in several ways.
Firstly, this study extends the literature on the motives and economic consequences of repurchase
programs, mostly for U.S. firms to the international setting, where ownership structures are more
concentrated and country-level institutional environments significantly vary. Our results suggest
that a country’s legal institutions as well as a firm’s internal governance mechanism influence
insiders’ mimicking behavior through repurchasing activities. This study complements the work
performed by Massa et al. (2007), which identifies mimicking repurchases in concentrated
industries in the U.S. From a corporate governance perspective, the findings of this paper
corroborate the prior international studies providing that earnings quality is less credible in
countries with weak investor protection and in firms with high ownership concentration (DeFond,
8
Hung, & Trezevant, 2007; Haw, Hu, Hwang, & Wu, 2004; and Leuz, Nanda, & Wysocki, 2003).
Secondly, our work builds on the classic signaling theory, which suggests that honest signals
are given when both the sender and receiver have the same interest in the result, while deceit signals
come about when the sender can exploit the receiver for private benefits (see, for example, Breed,
2001; Dawkins & Guiford, 1991). This study provides empirical evidence that external and internal
corporate governance mechanisms affect the quality of signal in the context of repurchase programs.
Thirdly, this study provides an alternative explanation for the phenomenon documented by
Fama and French (2005) that many firms that are net issuers in a given year repurchase in the same
year and many of the firms making net repurchases have financing deficits. Our findings suggest
that entrenched insiders use repurchases as a tool to manipulate stock price before share issuance,
thus firms repurchase and issue shares in the same year even though they have financing deficits.
The remainder of this paper is organized as follows. In Section 2, we develop the major
hypotheses of this study. Section 3 describes the research design and methodology, and Section 4
discusses the data and sample selection. Section 5 reports main empirical results and Section 6
provides robustness tests. Section 7 concludes.
2. Hypotheses Development
Signaling theory suggests that when valuation is noisy, firms who view themselves as
undervalued may engage in activities to signal their quality. However, if investors have difficulty in
9
distinguishing between high and low-quality of signaling firms and if the corporate insiders have
large private benefits of control in the firms, corporate insiders may have incentives to send a false
signal to mislead investors, hence they can obtain private benefits even if the firms are not
undervalued. In the signaling theory, one central issue is what mechanisms ensure the quality of
signal. This argument suggests that repurchases could be employed as a false signal by corporate
insiders given the managerial flexibility and a low cost of repurchase program when they are
canceled out or when new shares are issued following repurchases. Breed (2001) argues that honest
signals in communication are given when both sender and receiver have the same interest in the
result, while deceit signals come up when the sender can exploit the receiver. As strong corporate
governance mechanisms can mitigate the conflict of interests between corporate insiders and
outsiders, we explore their role in shaping the quality of signal through repurchases.
2.1 The effect of investor protection institutions on mimicking behavior
La Porta, Lopez-de-Silanes, & Shleifer (1998) argue that fundamentally important corporate
governance mechanisms rest with the extent to which a country’s laws protect investor rights and
those laws are enforced. Insiders have incentives to conceal their private benefits from outsiders
because, if these benefits are detected, outsiders are likely to take disciplinary action against them
(see, e.g., Shleifer & Vishny, 1997; Zingales, 1994). Literature finds that external governance has
significant influence on corporate insiders’ incentives and behavior. In countries where investor
protection is weak, corporate insiders enjoy large private benefits of control and the costs to extract
these benefits are low (Dyck & Zingales, 2004). Leuz et al. (2003) argue that insiders have
10
incentives to manage reported earnings in order to mask true performance and to conceal their
private benefits of control from outsiders and document that earnings management decreases in
legal protection. DeFond et al. (2007) examine the cross-country differences in the information
content of annual earnings announcements and find that annual earnings announcements are more
informative in countries with strong investor protection through underlying mechanisms of higher
quality earnings and better enforced insider trading laws. They suggest that accounting earnings in
countries with weak investor protection are less credible and informative.
From the information asymmetry perspective, Bushman, Piotroski, & Smith (2004) document
that corporate transparency is higher in countries with a legal/judicial regime characterized by a
common law legal origin and high judicial efficiency. In countries with weak investor protection,
the information asymmetry between corporate insiders and outside investors is severe. When
corporate insiders implement repurchase programs, outside investors may not have sufficient
information to assess the true value of the firm, which makes mimicking repurchases efficacious.
This argument is consistent with Morck, Yeung, & Yu (2000) that stock price fluctuations are less
correlated with corporate fundamentals in emerging markets. These findings suggest that repurchase
programs might be less credible in countries with weak legal protection than in countries with
strong protection.
Another stream of literature shows that repurchase can be used as a tool to manipulate earnings
(Bens, Nagar, Skinner, & Wong, 2003; Hribar et al., 2006). As stock repurchase is a flexible payout
method and markets react positively to repurchase programs, it can be used as a tool either to signal
11
undervaluation or to mislead the market. Stock repurchase is a temporary payout to shareholders
because firms can cancel this payout by reselling the treasury shares or issuing new shares, and thus
may not be a costly signal. In weak legal environment, insiders hold private information in order to
pursue their own private benefits. As such, stock repurchase might be used as a deceit signal to
mislead investors and manipulate stock prices, rather than to signal undervaluation or to disgorge
cash to investors when a country’s legal environment is not strong. The discussion above leads to
our first (alternative) hypothesis.
Hypothesis 1: Repurchasing firms in countries with weak investor protection are more
likely to be mimickers than those in countries with strong investor
protection, ceteris paribus.
2.2 The effect of ownership concentration on mimicking behavior
In countries outside the U.S., firms are typically controlled by controlling shareholders, who
frequently exercise control rights in excess of their cash flow rights (Claessens, Djankov & Lang,
2000; Faccio & Lang, 2002; La Porta, Lopez-de-Silanes & Shleifer, 1999). The fundamental agency
problem for such closely held corporations is the conflict of interests between controlling owners
and minority shareholders (Shleifer & Vishny, 1997). Ownership concentration has both an
entrenchment effect and an alignment effect. On one side, concentrated control is considered to be
detrimental to minority shareholders as it induces insider expropriation and distorts management
decision making (Shleifer & Vishny, 1997; Bebchuk, Kraakman, & Triantis, 2003). On the other
hand, the presence of controlling owners helps alleviate the traditional agency problems between
owners and managers. However, the existing literature suggests that the alignment effect is
12
subordinated to entrenchment effect under concentrated ownership structures (e.g., Claessens,
Djankov, Fan, & Lang, 2002; Lins, 2003).
La Porta et al. (1999) investigate the ownership concentration around the world and find that
weak legal and institutional environments are associated with highly concentrated ownership of
listed companies. Similarly, Dyck & Zingales (2004) find that higher private benefits of control are
associated with more concentrated ownership. Thus, corporate governance is weak in firms with
concentrated ownership, where corporate insiders have large private benefits of control. Prior work
shows that the concentration of control and the control-cash flow separation induces controlling
shareholders to manage accounting earnings more aggressively, which in turn leads investors to
perceive accounting earnings to be less credible and informative (see Fan & Wong, 2002; Francis,
Schipper, & Vincent, 2005; Haw et al., 2004). We thus argue that the decisions of self-interested
managers to undertake repurchase programs may arise from their private benefits of control rather
than signaling undervaluation. The discussion above leads to the following second (alternative)
hypothesis:
Hypothesis 2: Repurchasing firms with highly concentrated ownership are more likely to
be mimickers than those with low concentrated ownership, ceteris
paribus.
2.3 The joint effect of investor protection and ownership structure on mimicking behavior
It is well established that legal protection is the primary constraint on agency costs and insider
expropriation (Bebchuk et al., 2003; Doidge, Karolyi, & Stulz, 2007; Jensen & Meckling, 1976).
When agency problems are embedded in a concentrated ownership structure, well-functioning
external institutions become important means of protecting minority shareholders. Furthermore,
13
several recent studies suggest that country-level institutions dominate firm-level governance
mechanisms in mitigating agency conflicts (Dittmar, Mahart-Smith, & Servaes, 2003; Doidge et al.,
2007; Harford, Mansi, & Maxwell, 2008; La Porta, Lopez-de-Silanes, Shleifer, & Vishny, 2000).
They argue that true entrenchment requires low legal shareholder rights. Just as strong legal investor
protection can restrain the corporate insiders’ incentive to pursue their own benefits, strong
monitoring curbs insiders’ intention to mimicking induced by concentrated ownership. The
discussion above leads to the following third (alternative) hypothesis:
Hypothesis 3: The association between concentrated ownership structure and mimicking
repurchases is less pronounced in countries with strong investor protection.
3. Research Design
3.1. Identifying potential mimickers
It is a daunting task to distinguish mimickers from genuine repurchasing firms, as they are not
observable and most repurchasing firms claim that their stocks were undervalued and they buy back
in order to enhance the value of shareholders. Massa et al. (2007) investigate mimicking
repurchases in the U.S. market and find that firms in highly concentrated industries buy back their
own shares to mimic the behavior of other repurchasing firms in the same industry to avoid negative
effects on their stock prices. However, it is difficult to identify mimickers out of the full set of
repurchasing firms. In this study, we follow Chan et al. (2010) and Gong et al. (2008), and consider
earnings quality as a noisy proxy for the propensity of managers to falsely signal. We employ
alternative proxy in a sensitivity test.
Chan et al. (2006) argue that earnings quality may be a reflection of managerial intention to
14
mislead investors. They find that firms with high accruals face symptoms of a cooling in growth,
but these firms use creative accounting to delay reporting the bad news. Since accruals management
does not consume cash, it is less costly and presumably preferable to manipulation of underlying
business activities (Black, Seller, & Manly, 1998). However, when managers face constraints in
their ability to inflate accruals, accruals management becomes more difficult and is subject to a
higher risk of regulatory scrutiny and shareholder lawsuits. Consequently, firms that have
constraints in their ability to increase earnings via accruals manipulation are more likely to choose
to increase earnings through stock repurchases (Xu & Taylor, 2007). These firms pay higher prices
relative to the intrinsic value of their stocks than firms that repurchase stock for other economic
reasons. Hribar et al. (2006) document that firms use stock repurchase to meet or beat analysts’
earnings per share forecasts. In other words, stock repurchases could be used as an alternative tool
secondary to accrual management to mislead the market. Thus, we use earnings quality prior to
repurchases as an ex-ante proxy for mimickers. The underlying reasoning is consistent with Liang
& Wen (2007), who predict that more noises in accounting earnings lead to less efficient capital
investment decisions, and Biddle et al., (2009), who document that higher financial reporting
quality relates to investment efficiency.
3.2 Measuring earnings quality
Accounting accruals are a common measure of earnings quality. We adopt the Jones model
modified by Dechow, Sloan, & Sweeney (1995) to estimate accrual quality.
=itTACC itit4it3it210 εROAβGPPEβ∆Salesβ)(1/TAββ1
+++++−
(1)
where total accruals (TACC) are defined as total net income minus total net cash flows from operation,
15
scaled by lagged total assets.1 ∆Sales is the change in sales and GPPE is gross property, plant and
equipment, both of which are scaled by lagged total assets, TA-1. ROA is defined as net income divided
by total assets following Kothari, Leone, & Wasley (2005). Consistent with prior work, we define
non-discretionary accruals (NDA) as the fitted values from this model for a given firm. Discretionary
accruals (DA) are then defined as the residual for a given case away from its expected value. We include
a constant in the model as Kothari et al. (2005) suggest. DA are measured at the fiscal year-end. The
Jones model is estimated cross-sectionally each country-year using all observations in the same one-digit
SIC code.2 We require a minimum of 20 firms in each country-year-industry combination. As higher DA
may reflect insiders’ intention to manipulate stock price upward, we identify repurchasing firms with DA
belonging to the top 20% quintile of DAs of all stock universe as a cutoff point for potential mimickers.3
3.3 Measuring abnormal long-term operating performance
Although accrual-based performance is the conventional measure for operating performance,
in the context of repurchases, an accrual-based performance measure can lead to an erroneous
conclusion about post-repurchase performance because of pre-repurchase accrual management.
Barber & Lyon (1996) suggest that, in certain sampling situations where sample firms can be
motivated to manipulate their reported earnings, the cash-based, rather than accrual-based,
performance measure allows the researcher to ascertain whether an erosion in operating
1 As cash flows from operation items in Worldscope include extraordinary items, we use bottom line net income rather than net income
before extraordinary items. 2 Although Kothari et al. (2005) document that within-industry estimation is less important, we also estimate Jones model
cross-sectionally using country-year observations in the same two-digit SIC code and performance matching method. The results are very
similar, while the sample size decreased by 30%.
3 In a U.S. study, Chan et al. (2010) also use this cutoff point to identify repurchasing firms who are likely to mislead the market.
16
performance is the result of an erosion in performance or the reversal of pre-event accruals. As prior
studies show that managers tend to manipulate accruals before actual repurchases (Gong et al., 2008;
Chan et al., 2010), we use cash-based performance to measure operating performance in the period
following repurchases. Specifically, operating performance is measured by net cash flows from
operating activities scaled by the average of cash-adjusted assets (i.e., book value of assets less cash
and short-term investments) at the beginning and end of the fiscal year. Abnormal operating
performance is defined as the difference between operating performance of sample and control
firms.
The control firms are composed of firms in the same industry that have similar performance
characteristics and market-to-book ratios, closely following Lie (2005). For each repurchasing firm, we
first identify all firms with the same country and same two-digit SIC code, operating cash flows
performance within ±20% or within ±0.01 of the performance of the sample firm in the repurchase year,
and pre-repurchase market-to-book value of assets within ±20% or within ±0.1 of that of the sample firm.
If no firms meet the criteria, we relax the industry criterion to a one-digit SIC code.
3.4 Measuring abnormal long-term market performance
Following Barber & Lyon (1997), this study uses buy-and-hold abnormal returns to measure
long-term market performance after repurchase events. Based on monthly windows, buy-and-hold
returns (BHRs) are estimated up to one, two, and three years following actual stock repurchase.
Abnormal BHRs are computed as the differences between the BHRs of sample and matched control
firms as following.
17
)R(1)R(1RAbnormalBHτ
1t
cit
τ
1t
sitiτ ∏∏
==
+−+=
where sitR denotes the stock return of sample firm i, while c
itR denotes the stock return of the control
firm i, in month t. A sample firm is matched to a control firm by first identifying all firms from the same
country and same two-digit SIC code industry with a market value of equity that is between 70% and
130% of the market value of equity of the sample firm; from this set of firms, we choose the firm with
the book-to-market ratio that is closest to that of the sample firm.
3.5 Testing the determinants of mimicking repurchases
We develop the following model to test our three hypotheses.
Mimic =
εsYearDummieηDVDTaxβLnGDPβSMGDPβIndConβRetβMTBβSizeβLevβ
CashβCPTEXPβITAβRepβIssueβDVDβCFOβROAβLnOwnInstβLnOwnβInstββ
i191817
16115114113112
111109876
54131210
+++++
+++++
++++++
++×+++
∑−−−−
−
−−
(2)
where Mimic is a dummy variable that equals one if a repurchasing firm is identified as a mimicker,
and zero otherwise. Inst stands for legal institutions, which is measured by anti-self-dealing (ASD)
and legal origin (OGN). The anti-self-dealing index is a measure of legal protection of minority
shareholders against expropriation by corporate insiders, which is developed by Djankov, La Porta,
Lopez-de-Silanes, & Shleifer (2008). The higher of this index, the stronger the investor protection is.
Legal origin is a dummy variable, equaling one if the origin of the company law or commercial
code is common law, and otherwise, zero. La Porta et al. (1998) find that common law countries
generally have the strongest legal protections to investors. Bushman et al. (2004) document that
governance transparency is higher in countries with a common legal origin, indicating that
18
information between insiders and outsiders is less asymmetric, and the costs to mimic are high in
common law countries. Hypothesis 1 predicts 1β to be negative.
We use the closely held ownership reported by Worldscope database for block holdings as a
proxy for ownership held by corporate insiders (LnOwn) following Stulz (2005).4 The insider
ownership data has a limitation because it consists of the sum of blocks of shares owned, which
may include blocks unrelated to the controlling shareholders. Although the ownership measure is far
from perfect, Stulz (2005) shows similar results when he uses the family-controlled ownership data
(based on La Porta et al., 1999 and Claessens et al., 2000) or fractional cash flow ownership by
insiders from Worldscope to explain the expropriation index and the anti-director rights index.
However, the direction of the effect of insiders’ ownership on mimicking is unclear as the cash flow
rights may affect the controlling shareholders’ incentive to pay out cash and the empirical evidence
is mixed (Farinha, 2003; Gugler, 2003). While some studies find that block shareholders play an
effective monitoring role (e.g., Karamanou & Vafeas, 2005), others show that block shareholders
behave as insiders, who take private benefits of control from minority shareholders (e.g., Ajinkya,
Bhojraj, & Sengupta, 2005). To the extent that the ownership of corporate insiders represents
controlling rights of controlling shareholders due to an ownership structure dominated by family
control in firms with voting rights exceeding cash flow rights in countries outside the U.S. (e.g., La
Porta et al., 2000; Stulz, 2005), we predict a positive relationship between the insider ownership and
mimicking behaviors (i.e., positive2β ) if hypothesis 2 holds. Following Demsetz & Lehn (1985),
4 Stulz (2005) use the same ownership measure, and discuss the weaknesses and advantages of insider ownership as determinants of
agency problems in detail.
19
we calculate LnOwn-1 using the formula: LnOwn-1 = 1
1
ershipInsiderOwnPercentage100
ershipInsiderOwnPercentagelog
−
−
−
.
In order to test Hypothesis 3, we add an interaction between legal institutions and ownership
concentration in the model. Hypothesis 3 predicts 3β to be negative.
We include a number of firm-specific variables such as market-to-book ratio (MTB-1), Cash
holdings (Cash-1), cash flow from operating activities (CFO), leverage ratio (Lev-1), and dividend
tax advantage (DVDTax) to control for the motivation of signaling, free cash flow, leverage, and tax
advantage. We describe the variable definitions in Table 1, which follow prior studies (e.g., Dittmar
& Mahrt-Smith, 2007; Harford et al., 2008; Pinkowitz, Stulz, & Williamson, 2006). DVDTax is
measured as the difference between taxes on income and capital gain and is collected from La Porta
et al. (1998). We add profitability (ROA) and dividends (DVD) because stock repurchase is regarded
as a way of corporate payout. We include firm size (Size-1) and intangible assets (ITA) to control for
information asymmetry between insiders and outside investors (Barth & Kasznik, 1999). We
incorporate capital expenditure (CPTEXP) to capture the impact of investment opportunities on
mimicking behavior. In order to test the costs and benefits of mimicking, we add new shares issued
or treasury shares resold during the repurchase year (Issue) and cash paid for repurchases (Rep) in
the model. As repurchases consume cash resources, mimickers may minimize these costs by issuing
new shares or reselling treasury stocks. We also incorporate the annual stock return in the prior year
(Ret-1) as Stephens & Weisbach (1998) show that stock repurchases are negatively related to prior
stock price performance. As Massa et al. (2007) find that firms in concentrated industries are more
likely to mimic other firms’ repurchase decision in the same industry, we include industry
20
concentration (IndCon) to control for the industry effect. Industry concentration is defined as the
sum of the squared market share in sales of each firm in the same industry (three-digit SIC code)
during a year. Following La Porta et al. (2000), we include two country-level variables to control for
cross-country differences: market capitalization to GDP (SMGDP) and GDP per capita (LnGDP).
SMGDP is from Beck, Demirguc-Kunt, & Levine (2000) with updates for later years from the
World Bank databases (Doidge et al., 2007), while LnGDP is the logarithm of per capita GDP (in
US dollars) in 2003 from Djankov et al. (2008).
4. Sample Selection and Descriptive Statistics
Our initial sample starts with all of listed firms which undertake stock repurchases from 30
economies around the world. Our sample period covers for 1999 through 2006 for two reasons. First,
stock repurchases have become popular or legally allowed since late 1990s in many countries.
Second, we want to avoid the effects of 1997 Asia financial crisis on corporate financing decisions,
as observations from Asian countries, especially from Japan, Korea and Hong Kong, account for a
large portion of our sample.
In this study, we focus on actual stock repurchases rather than repurchase announcements
because repurchase announcements do not commit the firm to actually buy back shares. Without a
commitment, the signaling models unravel due to the absence of a signaling cost (Lie, 2005).
Stephens & Weisbach (1998) and Allen & Michaely (2003) suggest that the dollar amount spent on
repurchases in the cash flow statement is likely to yield the least biased estimate of the actual dollar
amount spent on repurchases. Therefore, we estimate actual stock repurchases in a given year using
21
Worldscope data item #04751 (Common/Preferred Redeemed, Retired, Converted, etc). This item is
an aggregation of many other types of transaction besides stock repurchases, including purchase of
treasury stock and conversion of preferred stock into common stock. As this item may overestimate
actual repurchases, we attempt to reduce the noise associated with Worldscope item #04751 to
estimate actual repurchases by excluding firms whose preferred shares decreased during the fiscal
year of repurchases in a sensitivity analysis.
Using Worldscope item #04751 and excluding all financial firms (SIC codes between 6,000
and 6,999), we identify 20,886 firm-year repurchase observations. Then, we merge this dataset with
the discretionary accruals (DA) in the year prior to repurchases, ending up with 13,816 observations.
We delete observations that have missing values for all the firm-level independent variables, which
further reduces the sample by 2,808 observations. To reduce the effect of outliers, we trim the
sample at the 1% and the 99% level of each variable. The final sample consists of 8,578 firm-year
observations from 30 economies. The financial data come from Worldscope, and stock price data
from Datastream.
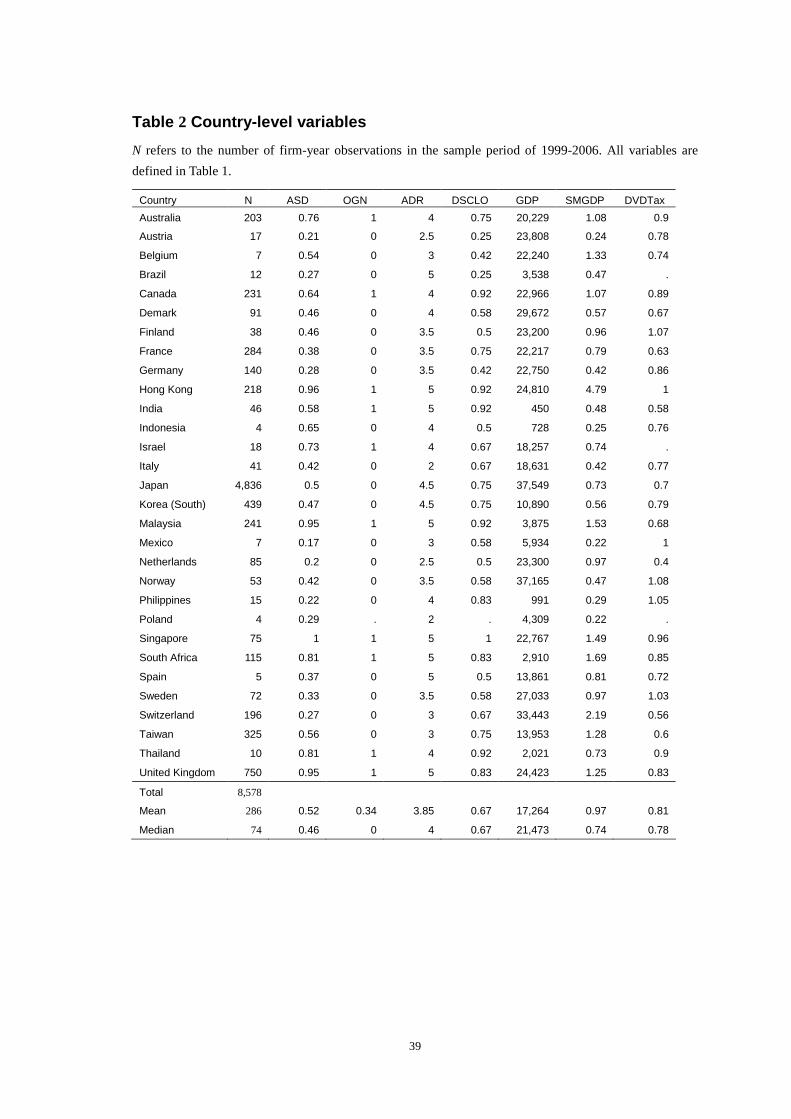
Table 2 presents the number of firm-year observations per country as well as descriptive
statistics for the country-level variables. A significant variation exists in the number of firm-year
observations across countries. There are 4,836 observations from Japan, which accounts for more
than 50% of our sample, and thus we perform sensitivity tests without Japanese firms. Table 2
shows substantial cross-country variations in per capita GDP and dividend tax preference.
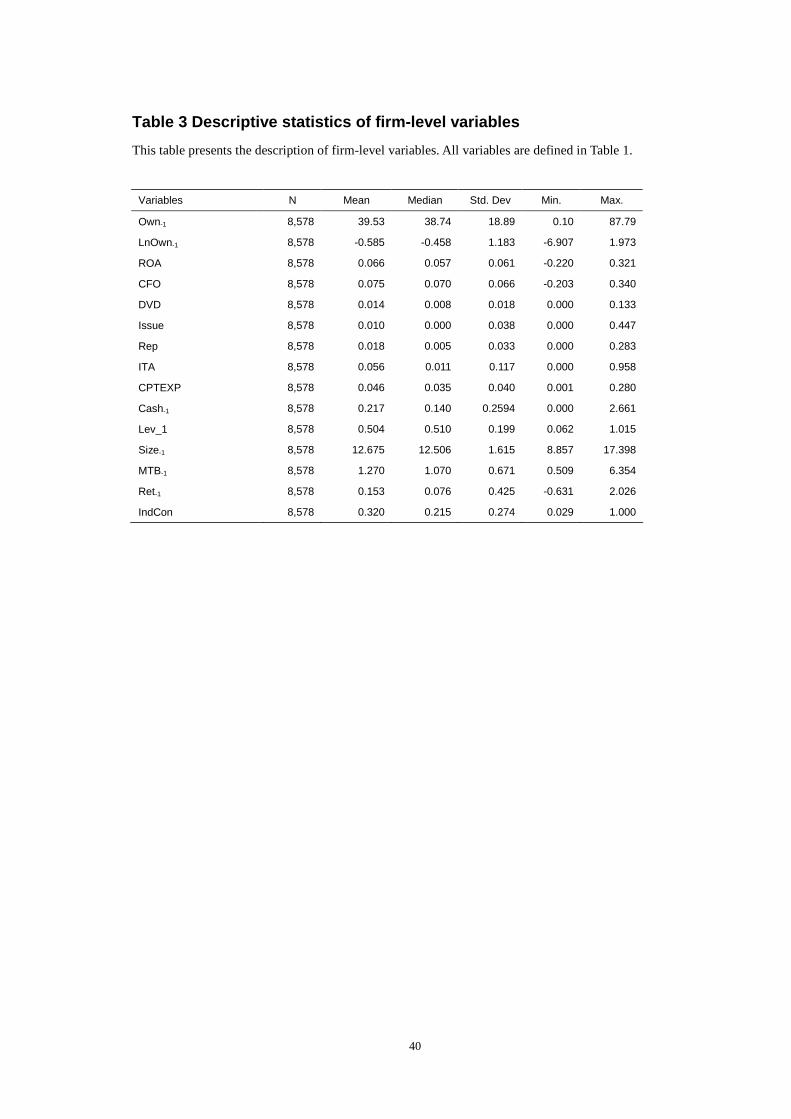
Table 3 provides summary statistics for the firm-level independent variables. There is
22
considerable cross-sectional variation in each variable. For example, the maximum insider
ownership (Own-1) is 87.79%, while the minimum is only 0.1%. On average, repurchasing firms
buy back 1.8% of their market value of equity, with the maximum amount of 28.3% and the
minimum close to zero.5 On average, repurchasing firms issue new shares or resell 1% treasury
shares of market value of equity during the repurchase year, with the maximum amount of 44.7%.
The (untabulated) Pearson correlation coefficients show that the correlation is high for the two
measures for legal institutions between ASD and OGN (a coefficient of 0.89) but not for other
variables. The mimicking measure (Mimic) displays the predicted significant correlations with most
of the variables. For example, Mimic is negatively and significantly correlated with ASD, OGN,
ROA, CFO, Cash-1 and Size-1, and positively and significantly correlated with LnOwn-1 and Issue.
5. Empirical Results
5.1 Long-term performance following stock repurchases
We identify mimicking repurchases based on earnings quality prior to actual repurchases, and
use discretionary accruals (DA) to measure earnings quality. Repurchasing firms whose DA in the
year prior to repurchases belong to the top 20% DA quintile (i.e., the largest DA or the highest
quintile) are considered to be mimickers.6 DA are the residuals from Model (1), and DA quintile is
5 As Worldscope item #04751 may include repurchases other than open market repurchases, such as tender offers, we exclude
repurchases larger than 10% of market value of equity in a sensitivity test. 6 We also consider repurchasing firms whose DAs in the year prior to repurchases belong to the top 15% DA quintile as mimickers, and
the results for both the post performance and regression analysis are similar.
23
the quintile ranking relative to all stock universe based on country-year-industry combination. Thus,
sample size in each quintile varies.
5.1.1 Operating performance. To the extent that the identification for potential mimickers above is
effective, we predict that both the long-term operating and market performance following
repurchases do not improve for mimickers, while improve for non-mimickers. Although Barber &
Lyon (1996) document that change models dominate level models in detecting abnormal operating
performance, Table 4 reports both the levels of and changes in long-term operating and market
performance following stock repurchases.
In Panel A of Table 4, the levels of abnormal operating cash flow performance for the full
sample as well as all the five DA quintiles are close to zero during the repurchase year. The mean is
0.001 and the median is 0.000 for the whole sample. Even though they are close to zero, most of
them are statistically different from zero at the 1% level. These statistical significances arise
because of a particularly low standard deviation of differences between the performance of the
repurchasing firms and their performance-matched control firms in the repurchase year.7 More
importantly, in each of the three years following repurchases, repurchasing firms of the first four
quintiles outperform their control counterparts, while repurchasing firms of the fifth (High) quintile
(the mimickers) do not.
Panel B of Table 4 shows the changes in abnormal operating performance from year 0 to each
of the future 3 years exhibit significant improvements for the whole sample, consistent with Lie
(2005). All of the first four quintiles exhibit significant improvements, while the fifth quintile (i.e.,
7 Lie (2005) reports similar results.
24
the mimickers) does not. In particular, the means (medians) of changes in abnormal operating
performance from year 0 to year +3 for the first four quintiles are 0.105 (0.075), 0.070 (0.045),
0.039 (0.021) and 0.030 (0.012), respectively, showing a monotonic decrease with DA quintiles. All
of them are significant at the 1% level. However, for the fifth (High) quintile (i.e., mimickers), the
corresponding mean (median) is 0.006 (-0.008) and statistically insignificant. The differences of
abnormal operating performance between mimickers and non-mimickers for the following three
years (0.011, 0.031 and 0.054, respectively) are statistically significant using both t-test and
Man-Whitney test (Panel C of Table 4).
5.1.2 Market performance. The market performance following repurchases is reported in Table 5.
For the whole sample, both the annual abnormal stock returns and the BHRs for repurchasing firms
outperform their control firms in each of the three years following repurchases, consistent with prior
studies (see, e.g., Ikenberry et al., 1995; Stephens & Weisbach, 1998). Panel B of Table 5 shows
significant improvements in BHRs for non-mimickers, while not for mimickers in any of the three
years following repurchases. The means (medians) of abnormal BHRs for the first four quintiles
from year 0 to year +3 are 1.771 (1.115), 1.229 (0.677), 1.098 (0.748) and 0.908 (0.843),
respectively. All of them are significant at the 1% level. However, the corresponding mean (median)
for the fifth (High) quintile (mimickers) is 0.485 (0.318) and statistically insignificant. Panel C
shows that the differences of abnormal BHRs following repurchases between non-mimicker and
mimickers are 0.121, 0.290 and 0.759, respectively and statistically significant using both t-tests
and Mann-Whitney tests. These results suggest that repurchasing firms with highest DA prior to
repurchases show little improvement in post-repurchase performance, which is contradictory to
25
signaling and undervaluation hypotheses. Interestingly, both Tables 4 and 5 exhibit that the
post-repurchase operating and market performance decreases monotonically with DA quintile,
suggesting that DA is an effective ex-ante proxy for capturing managerial intention. Figure 1 plots
the differences of changes in abnormal performance following repurchases between mimickers and
non-mimickers and shows that the abnormal operating and market performance improve
significantly following actual repurchases for non-mimickers, while not for mimickers.
5.2 Characteristics of mimickers
Table 6 presents the characteristics of mimicking firms in comparison with those of
non-mimicking firms. The cash holding (Cash-1) before repurchases is lower for mimickers,
suggesting that they are not cash-rich. Mimickers have poorer accounting and cash flow based
operating performance (ROA and CFO), invest less in capital expenditure, and are relatively smaller
in market valuation, compared with non-mimickers. However, the amount of cash consumed for
repurchases (Rep) is not significantly different between non-mimickers and mimickers. As cash paid
for repurchases represents the cost for signaling, one might expect that mimickers consume less
cash. However, as long as the private benefits of insiders from mimicking exceed the corresponding
costs, or the costs are borne by outside investors, the insiders still have incentives to mimic. The
proceeds of new shares issuance or treasury shares resale (Issue) is significantly higher for
mimickers than non-mimickers, suggesting the costs of false signal by mimickers are lowered.
During the repurchase year, mimicking firms collect more proceeds from issuing new shares or
reselling treasury stocks than non-mimicking firms. It is worth noting that the amount spent by
mimicking firms on repurchases is insignificantly different from that received from new issuance or
26
resale of treasury stock (0.019 vs. 0.014), while the amount spent on repurchases for non-mimicking
firms is significantly higher (almost twice) than that from new issuance or resale of treasury stock
(0.018 vs. 0.009). This is consistent with the argument that mimickers minimize the costs of false
signaling by issuing new shares or reselling treasury stocks.
5.3 Regression results for the determinants of mimicking repurchases
Table 7 reports the results of testing our three hypotheses. The logit model (Model 2) is
estimated with two alternative country level legal institutions (Inst), anti-self-dealing (ASD) and
legal origin (OGN) in columns (1-2) and (3-4), respectively. Because of limited data availability,
including DVDTax will reduce our sample from 30 to 27 economies, thus, we run the regressions
separately in columns (2) and (4). As shown in Table 7, across four columns, the legal institutions
(Inst) are negatively and significantly associated with mimicking repurchase measure (Mimic) at the
1% level, suggesting that repurchasing firms from countries with weak investor protection are more
likely driven by the intention to mislead investors relative to those from countries with strong
investor protection, supporting Hypothesis 1.
Corporate insider ownership (LnOwn-1) is positively and significantly associated with
mimicking repurchases at the 1% level in each of the four columns, regardless of the investor
protection proxies used. To the extent that the corporate insider ownership represents the ability for
expropriation, the result indicates that entrenched insiders undertaking stock repurchases are likely
to mimic undervalued firms, which is consistent with Hypothesis 2. To test Hypothesis 3, we
include the interaction term between insider ownership (LnOwn-1) and legal institutions (Inst). The
coefficients on the interaction are negative and significant at the 1% level in all four specifications.
27
As these coefficients do not represent the marginal effects, we use the methodology developed by
Norton, Wang, & Ai (2004) to compute the correct marginal effect of a change in the interaction
variable between the legal institutions and ownership concentration. We report both the marginal
effects and their z-statistics in the last row. The mean interaction effects are negative and significant,
suggesting that mimicking transactions are curbed in good legal institution environments, which
supports Hypothesis 3.
Interestingly, the coefficients on stock issuance (Issue) are all positive and significant at the 1%
level, suggesting that mimicking transactions have positive association with stock issuance or
treasury stock resale. As stock issuance or treasury stock resale can compensate for the cash
consumed on stock repurchases, it suggests that stock repurchase for mimickers is a less costly
signal. The coefficients on industry concentration (IndCon) are positive and significant, consistent
with Massa et al. (2007) that firms in highly concentrated industries repurchase their own shares to
mimic other repurchasing firms in the same industry.8
The results on the control variables are also reported in each of the four columns. They show
that the probability of mimicking repurchases is increasing with market-to-book ratio (MTB-1),
indicating that mimickers are likely to be overvalued, and decreasing with cash flow performance
(CFO) and cash holding (Cash-1), which are contradictory to signaling and free cash flow
hypotheses. In addition, mimicking firms are likely to have poor operating performance (ROA), less
investment in capital expenditure (CPTEXP), less intangible assets (ITA) and are relatively small
firms (Size-1).
8 But this result seems to be driven by Japanese firms. In the sensitivity tests when Japanese firms are excluded, this result disappears.
28
6. Robustness Tests
In this section, we perform a set of the sensitivity tests to reassure that the documented results
are robust.
6.1 Using alternative measure to identify mimicking repurchases
As signaling (undervaluation) and free cash flows are two major hypotheses for stock
repurchases in the literature, we consider repurchasing firms that experience high market-to-book
(MTB-1, i.e., overvalued firms) ratio and lower cash flows prior to stock repurchases (CFO) as
potential mimickers. Higher MTB ratio is defined as MTB that is higher than the median MTB of
the industry and firm size portfolio. For each country-year and industry (two-digit SIC code), we
create four portfolios with at least four firms each by sorting the data into quintile based on the
market value of the firm at the beginning of the repurchase year. Lower cash flow is defined as
operating cash flows (scaled by average total assets) that is lower than its corresponding industry
(two-digit SIC code) median at the beginning of the repurchase year. Thus, repurchasing firms
whose MTB ratios are higher than their respective portfolio and operating cash flows are lower than
their respective industry median are identified as potential mimicking firms, and non-mimicking
firms otherwise.
Panels A and B of Table 8 report the long-term operating performance and buy-and-hold
returns following actual repurchases. Non-mimickers experience significant improvement in both
operating and market performance, while mimickers do not, consistent with Table 5. Panel C
exhibits the logit regression results using the new classification measure. The results on the main
29
hypotheses are qualitatively similar to those in Table 7.
6.2 Using alternative country-level corporate governance indices
We employ two alternative measures of investor protection to test the effect of legal institutions
on mimicking behavior: revised anti-director rights (ADR) (Djankov et al., 2008) and disclosure
requirements (DSCLO) (La Porta, Lopez-de-Silanes, & Shleifer, 2006). Anti-director rights index
measures how strongly a legal system favors minority shareholders over insiders in the corporate
decision-making process, including the voting process (La Porta et al., 1998). Disclosure
requirements index measures the laws mandating disclosure. We estimate Model (2) using these two
alternative measures of investor protection, and the results shown in Panel A of Table 9 are similar
to those in Table 7.
6.3 Excluding Japanese firms
As Japan represents the largest number of repurchasing firms in our sample and the large
weight on Japan might drive the results in our tests, we repeat the regressions in Table 7 after
excluding Japanese firms from the sample. Panel B of Table 9 yields consistent results.
6.4 Excluding large and small amount of repurchases
Prior studies document that firms may buyback shares to avoid the EPS dilution by the
exercise of stock options. To control for the effect of this motive, we delete observations with
repurchase amount less than 0.1% of firm’s market valuation as the repurchase amount for the stock
option program is assumed to be smaller. As repurchase data from Worldscope do not distinguish
different types of stock repurchases, we also delete observations with repurchase amount greater
than 10% of market valuation to rule out the effects of tender offers. The (untabulated) results
30
remain unchanged. Furthermore, as the data of actual stock repurchases from Worldscope could be
noisy and incorporate the repurchases of preferred shares, we exclude observations whose preferred
shares decreased during the repurchase year. The analyses (not tabulated) show consistent results.
6.5 Using corporate insider ownership percentage
In our previous analyses, we take a log-transformation for corporate insider ownership as there
is evidence of non-linearity. When we assume a linear relation between ownership and mimicking
measure and re-estimate regressions with ownership percentage, the results remain unchanged.
6.6 Controlling for discretionary accruals in measuring post performance
The absence of performance improvement in the post-repurchase period may be caused by
large positive discretionary accruals (DA) before repurchases. Although we have controlled ROA in
calculating the discretionary accruals, we now control for DA in selecting the control firms.
Specifically, for operating performance, we identify control firms by locating all firms in same
country and same two-digit SIC code and in the same DA quintile, and then choosing the company
with the closest pre-event operating performance as that of the sample firm, following Chan et al.
(2010). For market performance, control firm is formed based on comparable market-cap,
book-to-market ratio and DA. The results reported in Table 10 demonstrate similar patterns as in
Tables 4 and 5.9
7. Conclusions
9 As some firms buy back their shares in more than one year during our sample period, a clustering problem may occur. Hence, we use
Rogers method of clustering by firm to estimate the robust standard errors. The (untabulated) results are qualitatively consistent.
31
Prior studies identify signaling (undervaluation) and free cash flows as the major motives for
undertaking stock repurchases and document that the long-term operating and market performance
improve following actual repurchases. The purpose of this study is two-fold. First, it identifies a
subset of repurchasing firms which are likely to use repurchase as a tool to mislead the markets for
their private benefits. Second, it explores the role of a country-level investor protection institutions
and ownership structure in shaping the quality of signaling via repurchases in an international
setting.
Following prior studies, we consider earning quality as a noisy proxy of insiders’ intention for
mimicking repurchases. Firms which aggressively employ positive discretionary accruals before
repurchases are likely to undertake repurchases to mislead the markets. Using this classification and
a sample of repurchasing firms across 30 economies outside the U.S over the period of 1999 to
2006, we ex-ante identify a subset of repurchasing firms and find that their operating and market
performance do not improve in three years following actual repurchases. Contrary to the signaling
and free cash hypotheses, the mimicking firms identified in this study are neither undervalued nor
cash-abundant. Compared with non-mimicking firms, they are less likely to invest in capital
expenditure, but are more likely to issue new shares or resell treasury shares during the repurchase
year, which lowers the costs of false signaling. Taken together, these findings are consistent with
our conjecture of mimicry. The regression results reveal that mimicking transactions are more likely
to occur in countries with weak investor protection and in firms with highly concentrated insider
ownership. The strong legal institutions are effective in ensuring the signaling credibility of stock
32
repurchases and curbing the mimicking behavior of corporate insiders. Given sparse international
research on stock repurchases, our study highlights the importance of sound external and internal
corporate governance mechanisms on enhancing the quality of signal in the context of repurchase
programs in an international setting.
Our empirical findings are subject to several caveats. First, although we employ different
methods to identify mimicking repurchases, there is likely an error in the classification. However,
the error will work against supporting our hypotheses. Second, we use corporate insider ownership
as a proxy for internal corporate governance. One of the weaknesses of this measure is that insider
ownership consists of the sum of all block holdings, some of which may be unrelated to the
controlling shareholders, thus may not accurately capture the control rights. Third, repurchase
regulations vary across countries. Different regulations may have different impact on insiders’
motives for repurchases. We were not able to control for these effects because of the lack of
sufficient public data on the sample countries.10
10
In some countries, such as the U.K., Hong Kong, India, and Singapore, repurchased shares are required to be cancelled. The canceling
of treasury shares increase the costs of mimicking as insiders can not resell them. Thus, we conduct additional test after deleting these
four countries. The regression results remain qualitatively unchanged; suggesting that repurchase regulation may not be a big threat.
33
References
Ajinkya, B., Bhojraj, S. & Sengupta, P., 2005. The association between outside directors, institutional
investors and the properties of management forecasts. Journal of Accounting Research 43(3):
343-376.
Allen, F. & Michaely, R., 2003. Payout policy. In: Constantinides, G., Harris, M., Stulz, R. (Eds.),
Handbook of Economics. North-Holland, Amsterdam: 337-430.
Barber, B. M. & Lyon, J. D., 1996. Detecting abnormal operating performance: the empirical power
and specification of test statistics. Journal of Financial Economics 41(3): 359-399.
Barber, B. M. & Lyon, J. D., 1997. Detecting Long-term abnormal stock returns: the empirical power
and specification of test statistics. Journal of Financial Economics 43(3): 341-372.
Barth, M. E. & Kasznik, R., 1999. Share repurchases and intangible assets. Journal of Accounting and
Economics 28(2): 211-241.
Bebchuk, L., Kraakman, R. & Triantis, G., 2003. Stock pyramids, cross-ownership, and dual class
equity in concentrated corporate ownership. edited by Morck, R. K., Chicago: National Bureau of
Economic Research 2000: 295-318.
Beck, T., Demirguc-Kunt, A. & Levine, R., 2000. A new database on the structure and development of
the financial sector. World Bank Economic Review 14: 597-605.
Bens, D. A., Nagar, V., Skinner, D. J. & Wong, M. H. F., 2003. Employee stock options, EPS dilution,
and stock repurchases. Journal of Accounting and Economics 36(1-3): 51-90.
Biddle, G. C., Hilary, G., & Verdi, R. S., 2009. How does financial reporting quality relates to
investment efficiency. Journal of Accounting and Economics 48(2-3): 112-131.
Black, E. L., Sellers, K. F. & Manly, T. S., 1998. Earnings management using asset sales: an
international study of countries allowing noncurrent asset revaluation. Journal of Business Finance
& Accounting 25(9-10): 1287-1319.
Boschen, J. F., Duru, A., Gordon, L. A. & Smith, K. J., 2003. Accounting and stock price performance
in dynamic CEO compensation. The Accounting Review 78(1): 143-168.
Brav, A., Graham, J. R., Harvey, C. R. & Michaely, R., 2005. Payout policy in the 21st century.
Journal of Financial Economics 77(3): 483-527.
Breed, M. D., 2001. Animal Behavior. An Online Textbook, www. Animalbehavioronline .com/
deceit.html.
Bushman, R. M., Piotroski, J. D. & Smith, A. J., 2004. What determines corporate transparency.
Journal of Accounting Research 42(2): 207-251.
Chan, K., Chan, L. K. C., Jegadeesh, N. & Lakonishok, J., 2006. Earnings quality and stock returns.
Journal of Business 79(3): 1041-1082.
Chan, K., Ikenberry, D. L. & Lee, I., 2004. Economic sources of gain in stock repurchases. Journal of
Financial and Quantitative Analysis 39(3): 461-480.
Chan, K., Ikenberry, D. L., Lee, I. & Wang, Y., 2010. Share repurchases as a potential tool to mislead
investors. Journal of Corporate Finance 16(2): 137-158.
Claessens, S., Djankov, S., Fan, J. P. H. & Lang, L. H. P., 2002. Disentangling the incentive and
entrenchment effects of large shareholdings. The Journal of Finance 57(6): 2741-2771.
34
Claessens, S., Djankov, S. & Lang, L. H. P., 2000. The separation of ownership and control in East
Asian corporations. Journal of Financial Economics 58(1-2): 81-112.
Comment, R. & Jarrell, G. A., 1991. The relative signaling power of Dutch-auction and fixed-price
self-tender offers and open market share repurchases. The Journal of Finance 46(4): 1243-1271.
Dawkins, M. S. & Guilford, T., 1991. The corruption of honest signaling. Animal Behavior 41(5):
865-873.
Dechow, P. M., Sloan, R. G. & Sweeney, A. P., 1995. Detecting earnings management. The
Accounting Review 70(2): 193-225.
DeFond, M. L. & Hung, M., 2004. Investor protection and corporate governance: Evidence from
worldwide CEO turnover. Journal of Accounting Research 42(2): 269-312.
DeFond, M. L., Hung, M. & Trezevant, R., 2007. Investor protection and the information content of
annual earnings announcements: International evidence. Journal of Accounting and Economics
43(1): 37-67.
Demsetz, H. & Lehn, K., 1985. The structure of corporate ownership: causes and consequences.
Journal of Political Economy 93(6): 1155-1177.
Dittmar, A. K., 2000. Why do firms repurchase stock? Journal of Business 73(3): 331-355.
Dittmar, A. K. & Mahrt-Smith, J., 2007. Corporate governance and the value of cash holding. Journal
of Financial Economics 83(3): 599-634.
Dittmar, A. K., Mahrt-Smith, J. & Servaes, H., 2003. International corporate governance and corporate
cash holdings. Journal of Financial and Quantitative Analysis 38(1): 111-133.
Djankov, S., La Porta, R., Lopez-de-Silanes, F. & Shleifer, A., 2008. The law and economics of
self-dealing. Journal of Financial Economics, 88(3): 430-465.
Doidge, C., Karolyi, G. A. & Stulz, R. M., 2007. Why do countries matter so much for corporate
governance. Journal of Financial Economics 86(1): 1-39.
Dyck, A. & Zingales, L., 2004. Private benefits of control: an international comparison. The Journal of
Finance 59(2): 537-600.
Eije, H.V., Megginson, W.L., 2008. Dividends and share repurchases in the European Union. Journal
of Financial Economics 89(2), 347-374.
Faccio, M. & Lang, L. H. P., 2002. The ultimate ownership of Western Europe corporations. Journal of
Financial Economics 65(3): 365-395.
Fama, E. F. & French, K. R., 2005. Financing decision: who issues stock? Journal of Financial
Economics 76(3): 549-582.
Fan, J. P. H. & Wong, T, J., 2002. Corporate ownership structure and the informativeness of
accounting earnings in East Asia. Journal of Accounting and Economics 33(3): 401-425.
Farinha, J., 2003. Dividend policy, corporate governance and the managerial entrenchment hypothesis:
an empirical analysis. Journal of Business Finance & Accounting 30(9-10): 1173-1209.
Francis, J., Schipper, K. & Vincent, L., 2005. Earnings and dividends informativeness when cash flow
rights are separated from voting rights. Journal of Accounting and Economics 39(2): 329-360.
Gong, G., Louis, H. & Sun, A. X., 2008. Earnings management and firm performance following
open-market repurchases. The Journal of Finance 63(2): 947-986.
35
Grullon, G. & Michaely, R., 2002. Dividends, share repurchases, and the substitution hypothesis. The
Journal of Finance 57(4): 1649-1684.
Gugler, K., 2003. Corporate governance, dividend payout policy, and the interrelation between
dividends, R&D, and capital investment. Journal of Banking & Finance 27(7): 1297-1321.
Gup, B. E. & Nam, D., 2001. Stock buybacks, corporate finance, and EVA. Journal of Applied
Corporate Finance 14(1): 99-110.
Harford, J., Mansi, S. & Maxwell, W., 2008. Corporate governance and firm cash holdings in the US.
The Journal of Financial Economics 87(3): 535-555.
Haw, I.-M., Hu, B., Hwang, L.-S. & Wu, W., 2004. Ultimate ownership, income management, and
legal and extra-legal institutions. Journal of Accounting Research 42(2): 423-462.
Haw, I.-M., Ho, S., Hu, B. & Zhang, X., 2011. Contribution of stock repurchases to the value of firm
and cash holding around the world. Journal of Corporate Finance 17(1): 152-166.
Hribar, p., Jenkins, N. T. & Johnson, W. B., 2006. Stock repurchases as an earnings management
device. Journal of Accounting and Economics 41(1): 3-27.
Ikenberry, D. L., Lakonishok, J. & Vermaelen, T., 1995. Market underreaction to open market share
repurchases. Journal of Financial Economics 39(2-3): 181-208.
Jensen, M. C. & Meckling, W. H., 1976. Theory of the firm: managerial behavior, agency costs and
ownership structure. Journal of Financial Economics 3(4): 305-360.
Jung, K., Kim, Y. & Stulz, R. M., 1996. Timing, investment opportunities, managerial discretion, and
the security issue decision. Journal of Financial Economics 42(2): 159-185.
Karamanou, I. & Vafeas, N., 2005. The association between corporate boards, audit committees, and
management earnings forecasts: an empirical analysis. Journal of Accounting Research 43(3):
453-486.
Kothari, S. P., Leone, A. J. & Wasley, C. E., 2005. Performance matched discretionary accrual
measures. Journal of Accounting and Economics 39(1): 163-197.
La Porta, R., Lopez-de-Silanes, F. & Shleifer, A., 1998. Law and finance. Journal of Political
Economy.106(6): 1113-1155.
La Porta, R., Lopez-de-Silanes, F. & Shleifer, A., 1999. Corporate ownership around the world. The
Journal of Finance 54(2): 471-517.
La Porta, R., Lopez-de-Silanes, F. & Shleifer, A., 2006. What works in securities laws. The Journal of
Finance 61(1): 1-32.
La Porta, R., Lopez-de-Silanes, F., Shleifer, A. & Vishny, R. W., 2000. Agency problems and dividend
policies around the world. The Journal of Finance 55(1): 1-33.
Leuz, C., Nanda, D. & Wysocki, P. D., 2003. Earnings management and investor protection: an
international comparison. Journal of Financial Economics 69(3): 505-527.
Liang, P. J. & Wen, X., 2007. Accounting measurement basis, market mispricing, and firm investment
efficiency. Journal of Accounting Research 45(1): 155-197.
Lie, E., 2005. Operating performance following open market share repurchase announcements. Journal
of Accounting and Economics 39(3): 411-436.
Lins, K. L., 2003. Equity ownership and firm value in emerging market. Journal of Financial and
Quantitative Analysis 38(1): 159-184
36
Massa, M., Rehman, Z. and Vermaelen, T., 2007. Mimicking repurchases. Journal of Financial
Economics 84(3): 624-666.
Morck, R., Yeung, B. & Yu, W., 2000. The information content of stock markets: why do emerging
markets have synchronous stock price movements? Journal of Financial Economics 58(1-2):
215-260.
Norton, E. C., Wang, H. & Ai, C., 2004. Computing interaction effects and standard errors in Logit and
Probit models. The Stata Journal 4(2): 154-167.
Pinkowitz, L., Stultz, R. & Williamson, R., 2006. Does the contribution of corporate cash holdings and
dividends to firm value depend on governance? a cross-country analysis. The Journal of Finance
61(6): 2725-2751.
Shleifer, A. & Vishny, R. W., 1997. A survey of corporate governance. The Journal of Finance 52(2):
737-779.
Stephens, C. P. & Weisbach, M. S., 1998. Actual share reacquisitions in open-market repurchase
programs. The Journal of Finance 53(1): 313-333.
Stulz, R. M., 2005. The limits of financial globalization. The Journal of Finance 60(4): 1595-1638.
Xu, R. Z. & Taylor, G. K., 2007. Economic cost of earnings management through stock repurchases.
Working paper.
Zingales, L., 1994. The value of voting rights: a study of the Milan stock exchange experience. Review
of Financial Studies 7(1): 125-148
37
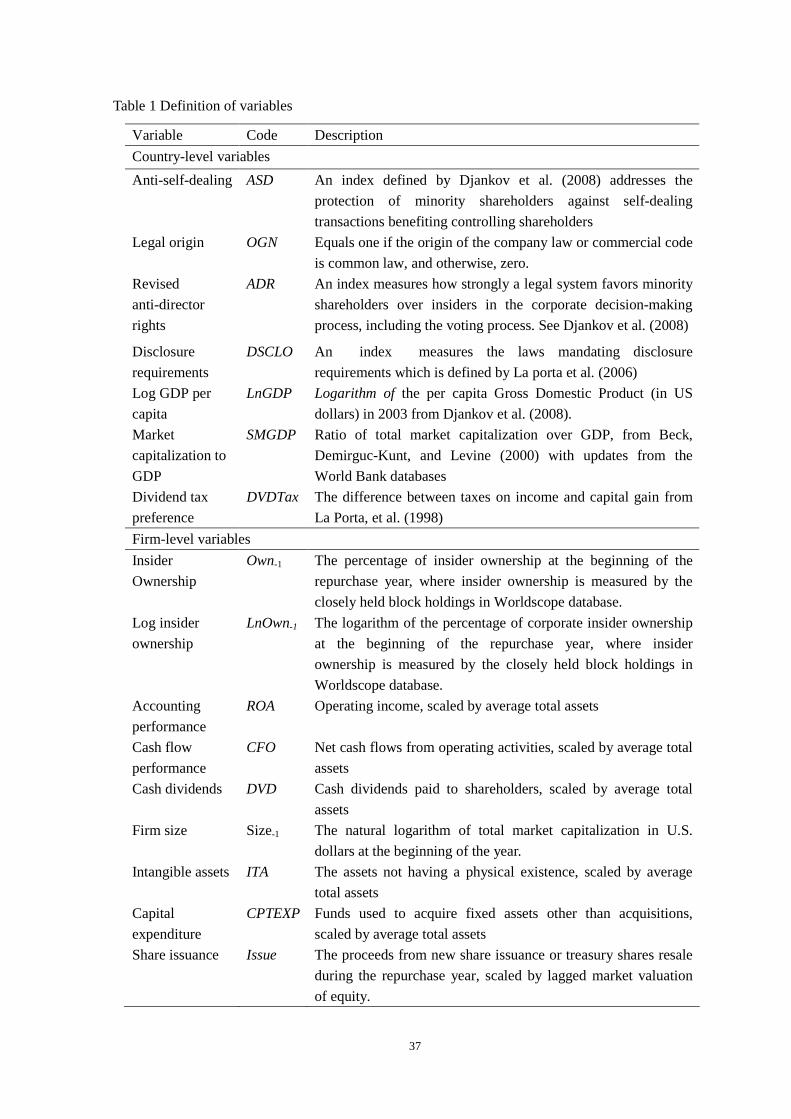
Table 1 Definition of variables
Variable Code Description
Country-level variables
Anti-self-dealing ASD An index defined by Djankov et al. (2008) addresses the
protection of minority shareholders against self-dealing
transactions benefiting controlling shareholders
Legal origin OGN Equals one if the origin of the company law or commercial code
is common law, and otherwise, zero.
Revised
anti-director
rights
ADR An index measures how strongly a legal system favors minority
shareholders over insiders in the corporate decision-making
process, including the voting process. See Djankov et al. (2008)
Disclosure
requirements
DSCLO An index measures the laws mandating disclosure
requirements which is defined by La porta et al. (2006)
Log GDP per
capita
LnGDP Logarithm of the per capita Gross Domestic Product (in US
dollars) in 2003 from Djankov et al. (2008).
Market
capitalization to
GDP
SMGDP Ratio of total market capitalization over GDP, from Beck,
Demirguc-Kunt, and Levine (2000) with updates from the
World Bank databases
Dividend tax
preference
DVDTax The difference between taxes on income and capital gain from
La Porta, et al. (1998)
Firm-level variables
Insider
Ownership
Own-1 The percentage of insider ownership at the beginning of the
repurchase year, where insider ownership is measured by the
closely held block holdings in Worldscope database.
Log insider
ownership
LnOwn-1 The logarithm of the percentage of corporate insider ownership
at the beginning of the repurchase year, where insider
ownership is measured by the closely held block holdings in
Worldscope database.
Accounting
performance
ROA Operating income, scaled by average total assets
Cash flow
performance
CFO Net cash flows from operating activities, scaled by average total
assets
Cash dividends
Firm size
DVD
Size-1
Cash dividends paid to shareholders, scaled by average total
assets
The natural logarithm of total market capitalization in U.S.
dollars at the beginning of the year.
Intangible assets ITA The assets not having a physical existence, scaled by average
total assets
Capital
expenditure
CPTEXP Funds used to acquire fixed assets other than acquisitions,
scaled by average total assets
Share issuance Issue The proceeds from new share issuance or treasury shares resale
during the repurchase year, scaled by lagged market valuation
of equity.
38
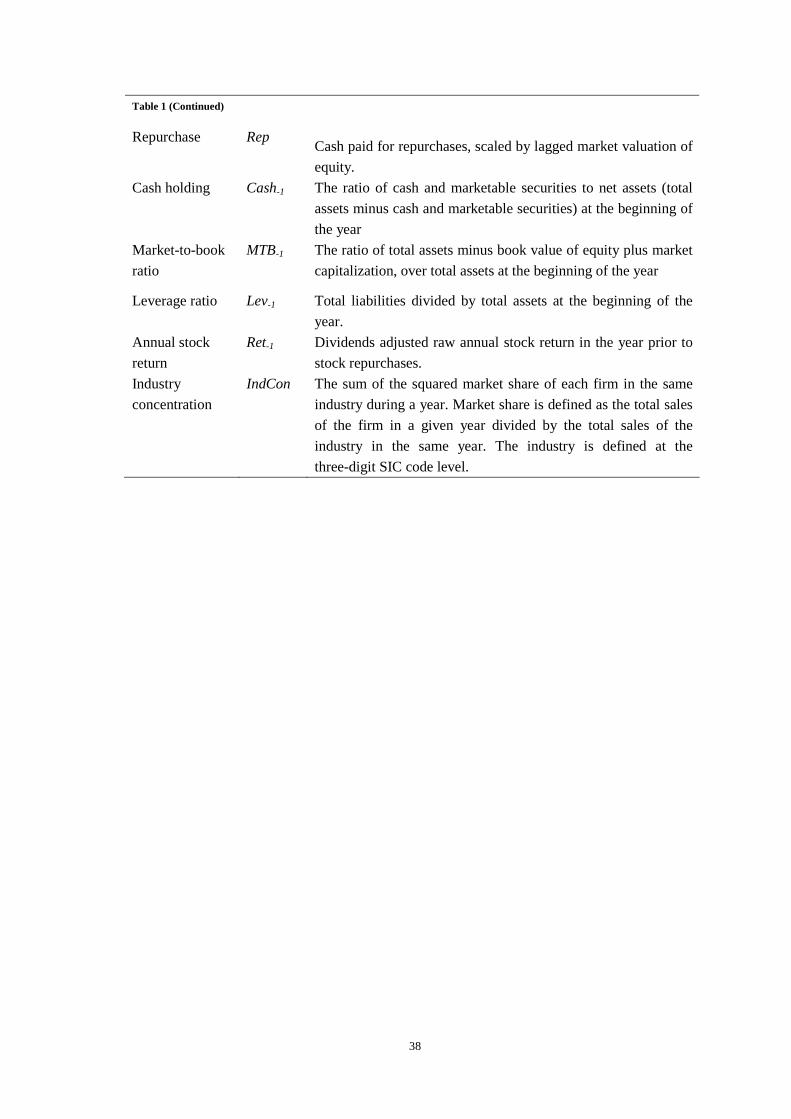
Table 1 (Continued)
Repurchase Rep Cash paid for repurchases, scaled by lagged market valuation of
equity.
Cash holding Cash-1 The ratio of cash and marketable securities to net assets (total
assets minus cash and marketable securities) at the beginning of
the year
Market-to-book
ratio
MTB-1 The ratio of total assets minus book value of equity plus market
capitalization, over total assets at the beginning of the year
Leverage ratio Lev-1 Total liabilities divided by total assets at the beginning of the
year.
Annual stock
return
Ret-1 Dividends adjusted raw annual stock return in the year prior to
stock repurchases.
Industry
concentration
IndCon The sum of the squared market share of each firm in the same
industry during a year. Market share is defined as the total sales
of the firm in a given year divided by the total sales of the
industry in the same year. The industry is defined at the
three-digit SIC code level.
39
Table 2 Country-level variables
N refers to the number of firm-year observations in the sample period of 1999-2006. All variables are
defined in Table 1.
Country N ASD OGN ADR DSCLO GDP SMGDP DVDTax
Australia 203 0.76 1 4 0.75 20,229 1.08 0.9
Austria 17 0.21 0 2.5 0.25 23,808 0.24 0.78
Belgium 7 0.54 0 3 0.42 22,240 1.33 0.74
Brazil 12 0.27 0 5 0.25 3,538 0.47 .
Canada 231 0.64 1 4 0.92 22,966 1.07 0.89
Demark 91 0.46 0 4 0.58 29,672 0.57 0.67
Finland 38 0.46 0 3.5 0.5 23,200 0.96 1.07
France 284 0.38 0 3.5 0.75 22,217 0.79 0.63
Germany 140 0.28 0 3.5 0.42 22,750 0.42 0.86
Hong Kong 218 0.96 1 5 0.92 24,810 4.79 1
India 46 0.58 1 5 0.92 450 0.48 0.58
Indonesia 4 0.65 0 4 0.5 728 0.25 0.76
Israel 18 0.73 1 4 0.67 18,257 0.74 .
Italy 41 0.42 0 2 0.67 18,631 0.42 0.77
Japan 4,836 0.5 0 4.5 0.75 37,549 0.73 0.7
Korea (South) 439 0.47 0 4.5 0.75 10,890 0.56 0.79
Malaysia 241 0.95 1 5 0.92 3,875 1.53 0.68
Mexico 7 0.17 0 3 0.58 5,934 0.22 1
Netherlands 85 0.2 0 2.5 0.5 23,300 0.97 0.4
Norway 53 0.42 0 3.5 0.58 37,165 0.47 1.08
Philippines 15 0.22 0 4 0.83 991 0.29 1.05
Poland 4 0.29 . 2 . 4,309 0.22 .
Singapore 75 1 1 5 1 22,767 1.49 0.96
South Africa 115 0.81 1 5 0.83 2,910 1.69 0.85
Spain 5 0.37 0 5 0.5 13,861 0.81 0.72
Sweden 72 0.33 0 3.5 0.58 27,033 0.97 1.03
Switzerland 196 0.27 0 3 0.67 33,443 2.19 0.56
Taiwan 325 0.56 0 3 0.75 13,953 1.28 0.6
Thailand 10 0.81 1 4 0.92 2,021 0.73 0.9
United Kingdom 750 0.95 1 5 0.83 24,423 1.25 0.83
Total 8,578
Mean 286 0.52 0.34 3.85 0.67 17,264 0.97 0.81
Median 74 0.46 0 4 0.67 21,473 0.74 0.78
40
Table 3 Descriptive statistics of firm-level variables
This table presents the description of firm-level variables. All variables are defined in Table 1.
Variables N Mean Median Std. Dev Min. Max.
Own-1 8,578 39.53 38.74 18.89 0.10 87.79
LnOwn-1 8,578 -0.585 -0.458 1.183 -6.907 1.973
ROA 8,578 0.066 0.057 0.061 -0.220 0.321
CFO 8,578 0.075 0.070 0.066 -0.203 0.340
DVD 8,578 0.014 0.008 0.018 0.000 0.133
Issue 8,578 0.010 0.000 0.038 0.000 0.447
Rep 8,578 0.018 0.005 0.033 0.000 0.283
ITA 8,578 0.056 0.011 0.117 0.000 0.958
CPTEXP 8,578 0.046 0.035 0.040 0.001 0.280
Cash-1 8,578 0.217 0.140 0.2594 0.000 2.661
Lev_1 8,578 0.504 0.510 0.199 0.062 1.015
Size-1 8,578 12.675 12.506 1.615 8.857 17.398
MTB-1 8,578 1.270 1.070 0.671 0.509 6.354
Ret-1 8,578 0.153 0.076 0.425 -0.631 2.026
IndCon 8,578 0.320 0.215 0.274 0.029 1.000
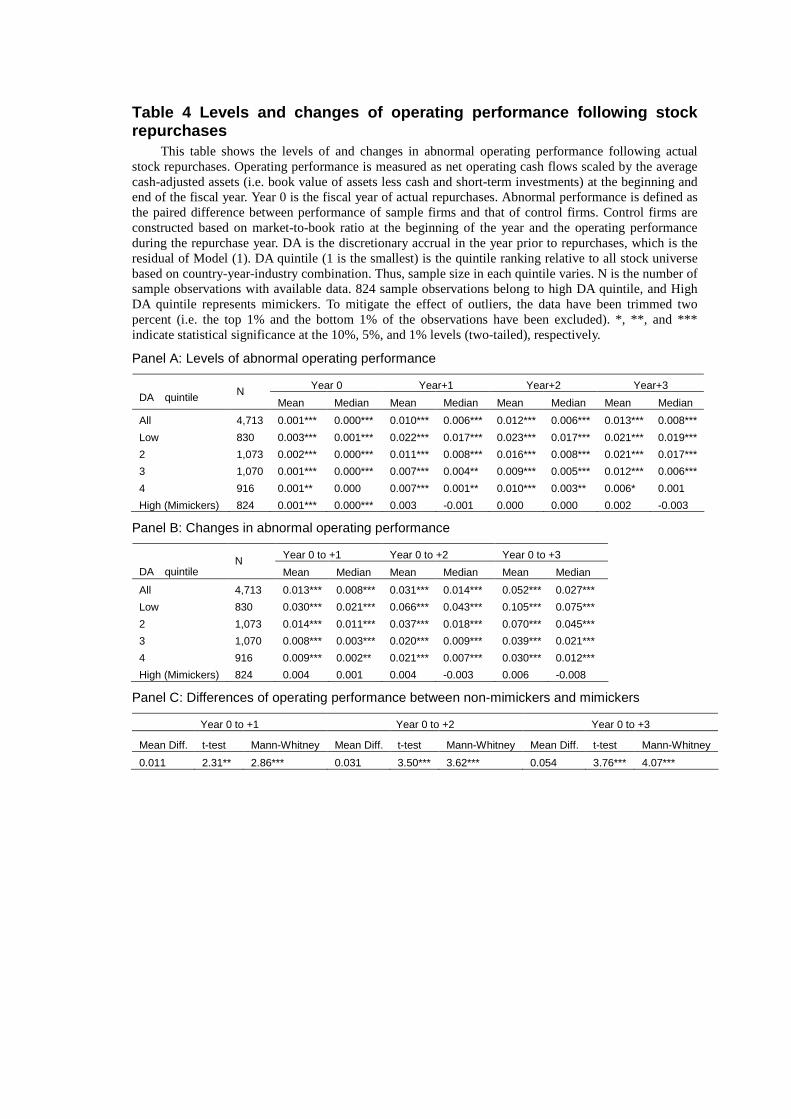
Table 4 Levels and changes of operating performance following stock repurchases
This table shows the levels of and changes in abnormal operating performance following actual stock repurchases. Operating performance is measured as net operating cash flows scaled by the average cash-adjusted assets (i.e. book value of assets less cash and short-term investments) at the beginning and end of the fiscal year. Year 0 is the fiscal year of actual repurchases. Abnormal performance is defined as the paired difference between performance of sample firms and that of control firms. Control firms are constructed based on market-to-book ratio at the beginning of the year and the operating performance during the repurchase year. DA is the discretionary accrual in the year prior to repurchases, which is the residual of Model (1). DA quintile (1 is the smallest) is the quintile ranking relative to all stock universe based on country-year-industry combination. Thus, sample size in each quintile varies. N is the number of sample observations with available data. 824 sample observations belong to high DA quintile, and High DA quintile represents mimickers. To mitigate the effect of outliers, the data have been trimmed two percent (i.e. the top 1% and the bottom 1% of the observations have been excluded). *, **, and *** indicate statistical significance at the 10%, 5%, and 1% levels (two-tailed), respectively.
Panel A: Levels of abnormal operating performance
Year 0 Year+1 Year+2 Year+3 DA quintile N
Mean Median Mean Median Mean Median Mean Median
All 4,713 0.001*** 0.000*** 0.010*** 0.006*** 0.012*** 0.006*** 0.013*** 0.008***
Low 830 0.003*** 0.001*** 0.022*** 0.017*** 0.023*** 0.017*** 0.021*** 0.019***
2 1,073 0.002*** 0.000*** 0.011*** 0.008*** 0.016*** 0.008*** 0.021*** 0.017***
3 1,070 0.001*** 0.000*** 0.007*** 0.004** 0.009*** 0.005*** 0.012*** 0.006***
4 916 0.001** 0.000 0.007*** 0.001** 0.010*** 0.003** 0.006* 0.001
High (Mimickers) 824 0.001*** 0.000*** 0.003 -0.001 0.000 0.000 0.002 -0.003
Panel B: Changes in abnormal operating performance
Year 0 to +1 Year 0 to +2 Year 0 to +3 DA quintile
N Mean Median Mean Median Mean Median
All 4,713 0.013*** 0.008*** 0.031*** 0.014*** 0.052*** 0.027***
Low 830 0.030*** 0.021*** 0.066*** 0.043*** 0.105*** 0.075***
2 1,073 0.014*** 0.011*** 0.037*** 0.018*** 0.070*** 0.045***
3 1,070 0.008*** 0.003*** 0.020*** 0.009*** 0.039*** 0.021***
4 916 0.009*** 0.002** 0.021*** 0.007*** 0.030*** 0.012***
High (Mimickers) 824 0.004 0.001 0.004 -0.003 0.006 -0.008
Panel C: Differences of operating performance between non-mimickers and mimickers
Year 0 to +1 Year 0 to +2 Year 0 to +3
Mean Diff. t-test Mann-Whitney Mean Diff. t-test Mann-Whitney Mean Diff. t-test Mann-Whitney
0.011 2.31** 2.86*** 0.031 3.50*** 3.62*** 0.054 3.76*** 4.07***
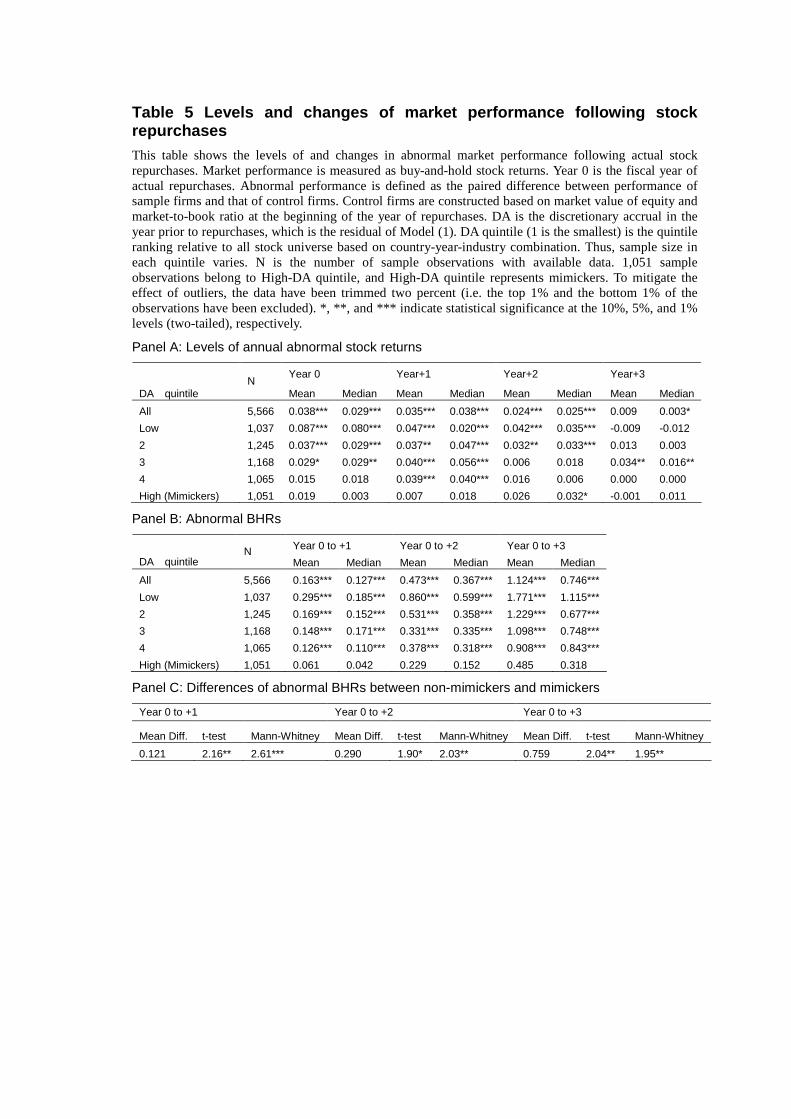
Table 5 Levels and changes of market performance following stock repurchases This table shows the levels of and changes in abnormal market performance following actual stock repurchases. Market performance is measured as buy-and-hold stock returns. Year 0 is the fiscal year of actual repurchases. Abnormal performance is defined as the paired difference between performance of sample firms and that of control firms. Control firms are constructed based on market value of equity and market-to-book ratio at the beginning of the year of repurchases. DA is the discretionary accrual in the year prior to repurchases, which is the residual of Model (1). DA quintile (1 is the smallest) is the quintile ranking relative to all stock universe based on country-year-industry combination. Thus, sample size in each quintile varies. N is the number of sample observations with available data. 1,051 sample observations belong to High-DA quintile, and High-DA quintile represents mimickers. To mitigate the effect of outliers, the data have been trimmed two percent (i.e. the top 1% and the bottom 1% of the observations have been excluded). *, **, and *** indicate statistical significance at the 10%, 5%, and 1% levels (two-tailed), respectively.
Panel A: Levels of annual abnormal stock returns
Year 0 Year+1 Year+2 Year+3 DA quintile
N Mean Median Mean Median Mean Median Mean Median
All 5,566 0.038*** 0.029*** 0.035*** 0.038*** 0.024*** 0.025*** 0.009 0.003*
Low 1,037 0.087*** 0.080*** 0.047*** 0.020*** 0.042*** 0.035*** -0.009 -0.012
2 1,245 0.037*** 0.029*** 0.037** 0.047*** 0.032** 0.033*** 0.013 0.003
3 1,168 0.029* 0.029** 0.040*** 0.056*** 0.006 0.018 0.034** 0.016**
4 1,065 0.015 0.018 0.039*** 0.040*** 0.016 0.006 0.000 0.000
High (Mimickers) 1,051 0.019 0.003 0.007 0.018 0.026 0.032* -0.001 0.011
Panel B: Abnormal BHRs
Year 0 to +1 Year 0 to +2 Year 0 to +3 DA quintile
N Mean Median Mean Median Mean Median
All 5,566 0.163*** 0.127*** 0.473*** 0.367*** 1.124*** 0.746***
Low 1,037 0.295*** 0.185*** 0.860*** 0.599*** 1.771*** 1.115***
2 1,245 0.169*** 0.152*** 0.531*** 0.358*** 1.229*** 0.677***
3 1,168 0.148*** 0.171*** 0.331*** 0.335*** 1.098*** 0.748***
4 1,065 0.126*** 0.110*** 0.378*** 0.318*** 0.908*** 0.843***
High (Mimickers) 1,051 0.061 0.042 0.229 0.152 0.485 0.318
Panel C: Differences of abnormal BHRs between non-mimickers and mimickers
Year 0 to +1 Year 0 to +2 Year 0 to +3
Mean Diff. t-test Mann-Whitney Mean Diff. t-test Mann-Whitney Mean Diff. t-test Mann-Whitney
0.121 2.16** 2.61*** 0.290 1.90* 2.03** 0.759 2.04** 1.95**
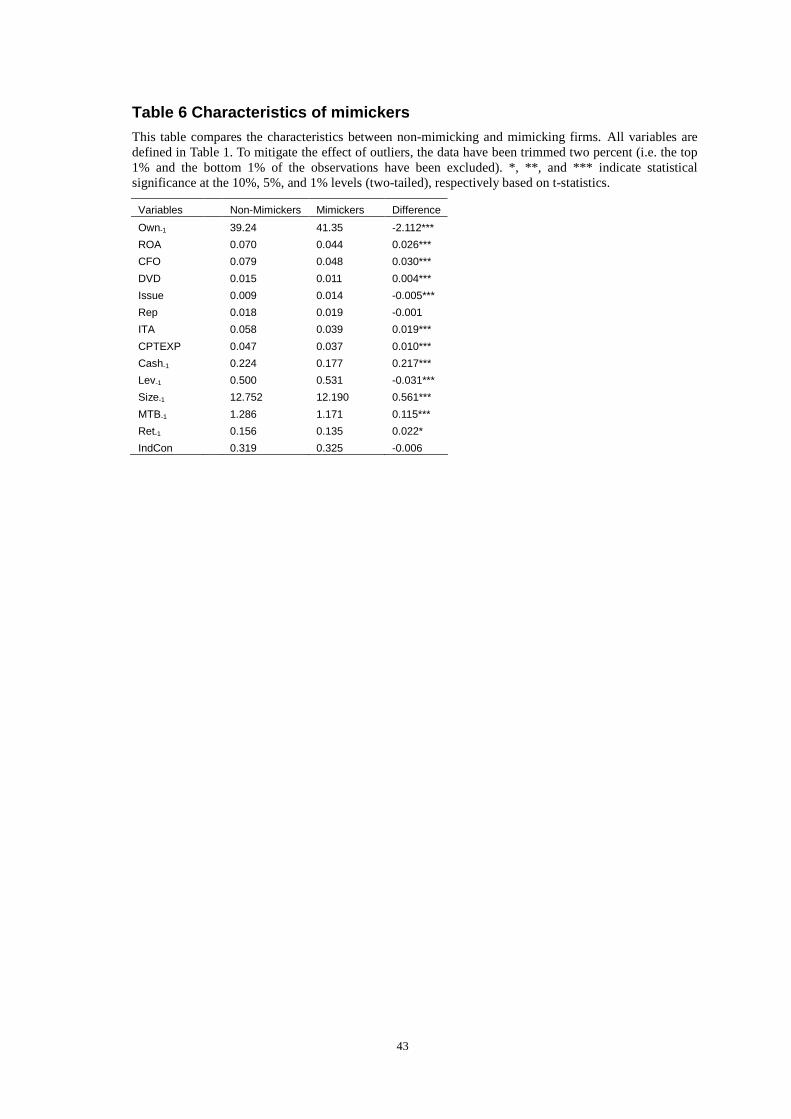
43
Table 6 Characteristics of mimickers This table compares the characteristics between non-mimicking and mimicking firms. All variables are defined in Table 1. To mitigate the effect of outliers, the data have been trimmed two percent (i.e. the top 1% and the bottom 1% of the observations have been excluded). *, **, and *** indicate statistical significance at the 10%, 5%, and 1% levels (two-tailed), respectively based on t-statistics.
Variables Non-Mimickers Mimickers Difference
Own-1 39.24 41.35 -2.112***
ROA 0.070 0.044 0.026***
CFO 0.079 0.048 0.030***
DVD 0.015 0.011 0.004***
Issue 0.009 0.014 -0.005***
Rep 0.018 0.019 -0.001
ITA 0.058 0.039 0.019***
CPTEXP 0.047 0.037 0.010***
Cash-1 0.224 0.177 0.217***
Lev-1 0.500 0.531 -0.031***
Size-1 12.752 12.190 0.561***
MTB-1 1.286 1.171 0.115***
Ret-1 0.156 0.135 0.022*
IndCon 0.319 0.325 -0.006
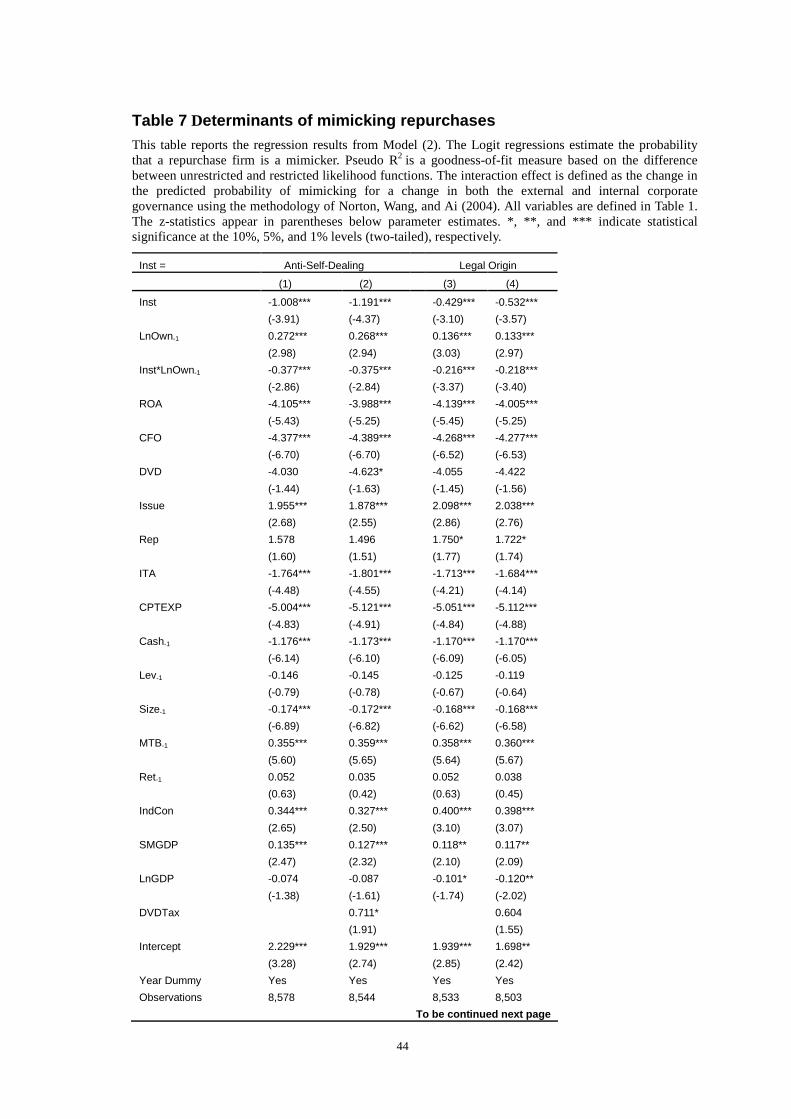
44
Table 7 Determinants of mimicking repurchases This table reports the regression results from Model (2). The Logit regressions estimate the probability that a repurchase firm is a mimicker. Pseudo R2 is a goodness-of-fit measure based on the difference between unrestricted and restricted likelihood functions. The interaction effect is defined as the change in the predicted probability of mimicking for a change in both the external and internal corporate governance using the methodology of Norton, Wang, and Ai (2004). All variables are defined in Table 1. The z-statistics appear in parentheses below parameter estimates. *, **, and *** indicate statistical significance at the 10%, 5%, and 1% levels (two-tailed), respectively.
Inst = Anti-Self-Dealing Legal Origin
(1) (2) (3) (4)
Inst -1.008*** -1.191*** -0.429*** -0.532***
(-3.91) (-4.37) (-3.10) (-3.57)
LnOwn-1 0.272*** 0.268*** 0.136*** 0.133***
(2.98) (2.94) (3.03) (2.97)
Inst*LnOwn-1 -0.377*** -0.375*** -0.216*** -0.218***
(-2.86) (-2.84) (-3.37) (-3.40)
ROA -4.105*** -3.988*** -4.139*** -4.005***
(-5.43) (-5.25) (-5.45) (-5.25)
CFO -4.377*** -4.389*** -4.268*** -4.277***
(-6.70) (-6.70) (-6.52) (-6.53)
DVD -4.030 -4.623* -4.055 -4.422
(-1.44) (-1.63) (-1.45) (-1.56)
Issue 1.955*** 1.878*** 2.098*** 2.038***
(2.68) (2.55) (2.86) (2.76)
Rep 1.578 1.496 1.750* 1.722*
(1.60) (1.51) (1.77) (1.74)
ITA -1.764*** -1.801*** -1.713*** -1.684***
(-4.48) (-4.55) (-4.21) (-4.14)
CPTEXP -5.004*** -5.121*** -5.051*** -5.112***
(-4.83) (-4.91) (-4.84) (-4.88)
Cash-1 -1.176*** -1.173*** -1.170*** -1.170***
(-6.14) (-6.10) (-6.09) (-6.05)
Lev-1 -0.146 -0.145 -0.125 -0.119
(-0.79) (-0.78) (-0.67) (-0.64)
Size-1 -0.174*** -0.172*** -0.168*** -0.168***
(-6.89) (-6.82) (-6.62) (-6.58)
MTB-1 0.355*** 0.359*** 0.358*** 0.360***
(5.60) (5.65) (5.64) (5.67)
Ret-1 0.052 0.035 0.052 0.038
(0.63) (0.42) (0.63) (0.45)
IndCon 0.344*** 0.327*** 0.400*** 0.398***
(2.65) (2.50) (3.10) (3.07)
SMGDP 0.135*** 0.127*** 0.118** 0.117**
(2.47) (2.32) (2.10) (2.09)
LnGDP -0.074 -0.087 -0.101* -0.120**
(-1.38) (-1.61) (-1.74) (-2.02)
DVDTax 0.711* 0.604
(1.91) (1.55)
Intercept 2.229*** 1.929*** 1.939*** 1.698**
(3.28) (2.74) (2.85) (2.42)
Year Dummy Yes Yes Yes Yes
Observations 8,578 8,544 8,533 8,503
To be continued next page
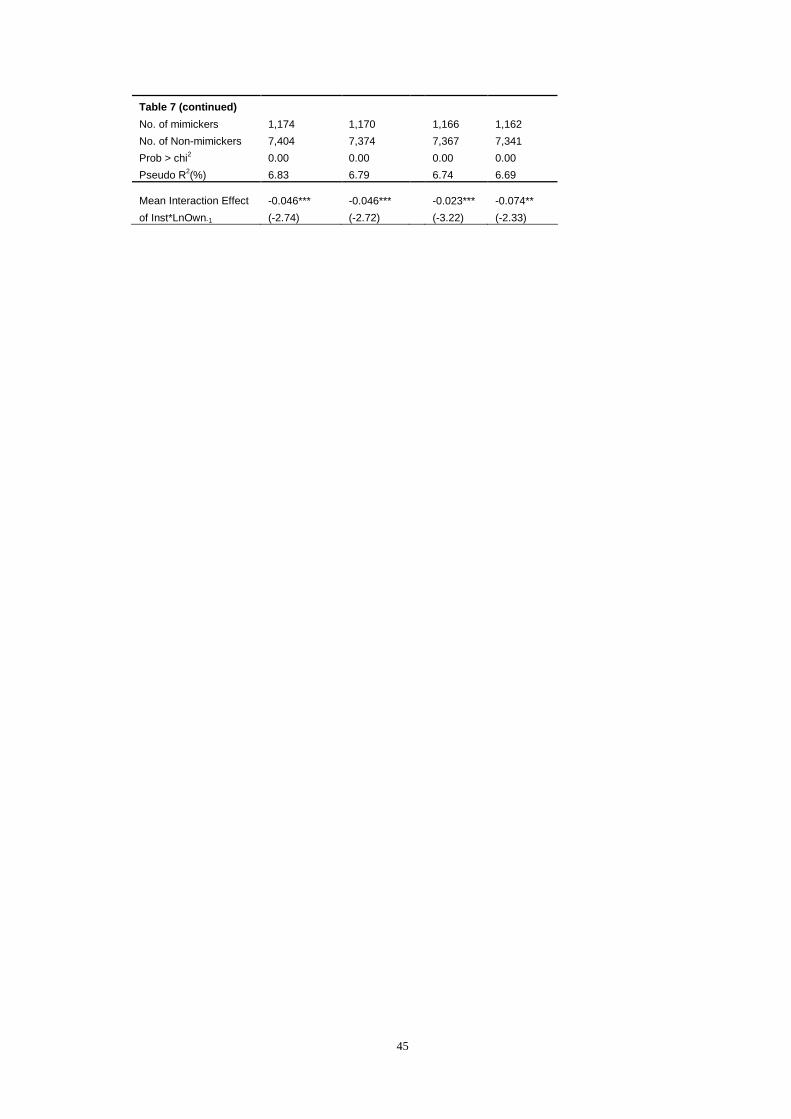
45
Table 7 (continued)
No. of mimickers 1,174 1,170 1,166 1,162
No. of Non-mimickers 7,404 7,374 7,367 7,341
Prob > chi2 0.00 0.00 0.00 0.00
Pseudo R2(%) 6.83 6.79 6.74 6.69 Mean Interaction Effect -0.046*** -0.046*** -0.023*** -0.074**
of Inst*LnOwn-1 (-2.74) (-2.72) (-3.22) (-2.33)
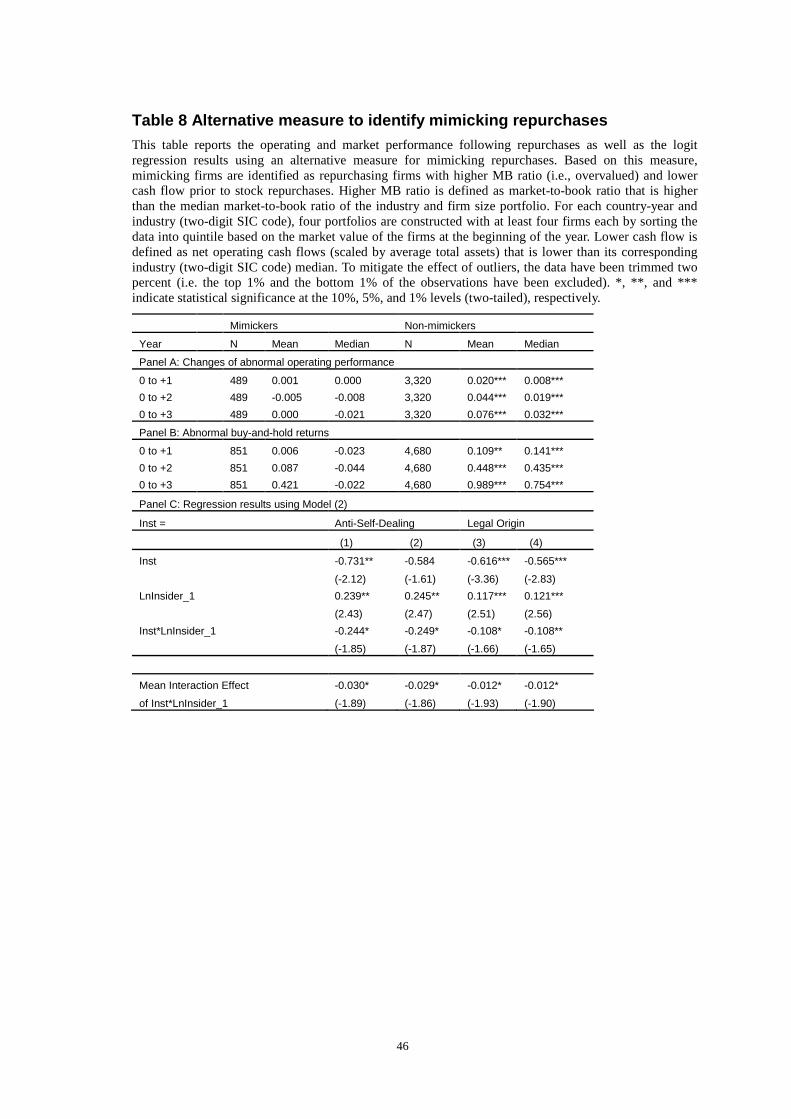
46
Table 8 Alternative measure to identify mimicking repurchases This table reports the operating and market performance following repurchases as well as the logit regression results using an alternative measure for mimicking repurchases. Based on this measure, mimicking firms are identified as repurchasing firms with higher MB ratio (i.e., overvalued) and lower cash flow prior to stock repurchases. Higher MB ratio is defined as market-to-book ratio that is higher than the median market-to-book ratio of the industry and firm size portfolio. For each country-year and industry (two-digit SIC code), four portfolios are constructed with at least four firms each by sorting the data into quintile based on the market value of the firms at the beginning of the year. Lower cash flow is defined as net operating cash flows (scaled by average total assets) that is lower than its corresponding industry (two-digit SIC code) median. To mitigate the effect of outliers, the data have been trimmed two percent (i.e. the top 1% and the bottom 1% of the observations have been excluded). *, **, and *** indicate statistical significance at the 10%, 5%, and 1% levels (two-tailed), respectively.
Mimickers Non-mimickers
Year N Mean Median N Mean Median
Panel A: Changes of abnormal operating performance
0 to +1 489 0.001 0.000 3,320 0.020*** 0.008***
0 to +2 489 -0.005 -0.008 3,320 0.044*** 0.019***
0 to +3 489 0.000 -0.021 3,320 0.076*** 0.032***
Panel B: Abnormal buy-and-hold returns
0 to +1 851 0.006 -0.023 4,680 0.109** 0.141***
0 to +2 851 0.087 -0.044 4,680 0.448*** 0.435***
0 to +3 851 0.421 -0.022 4,680 0.989*** 0.754***
Panel C: Regression results using Model (2)
Inst = Anti-Self-Dealing Legal Origin
(1) (2) (3) (4)
Inst -0.731** -0.584 -0.616*** -0.565***
(-2.12) (-1.61) (-3.36) (-2.83)
LnInsider_1 0.239** 0.245** 0.117*** 0.121***
(2.43) (2.47) (2.51) (2.56)
Inst*LnInsider_1 -0.244* -0.249* -0.108* -0.108**
(-1.85) (-1.87) (-1.66) (-1.65)
Mean Interaction Effect -0.030* -0.029* -0.012* -0.012*
of Inst*LnInsider_1 (-1.89) (-1.86) (-1.93) (-1.90)
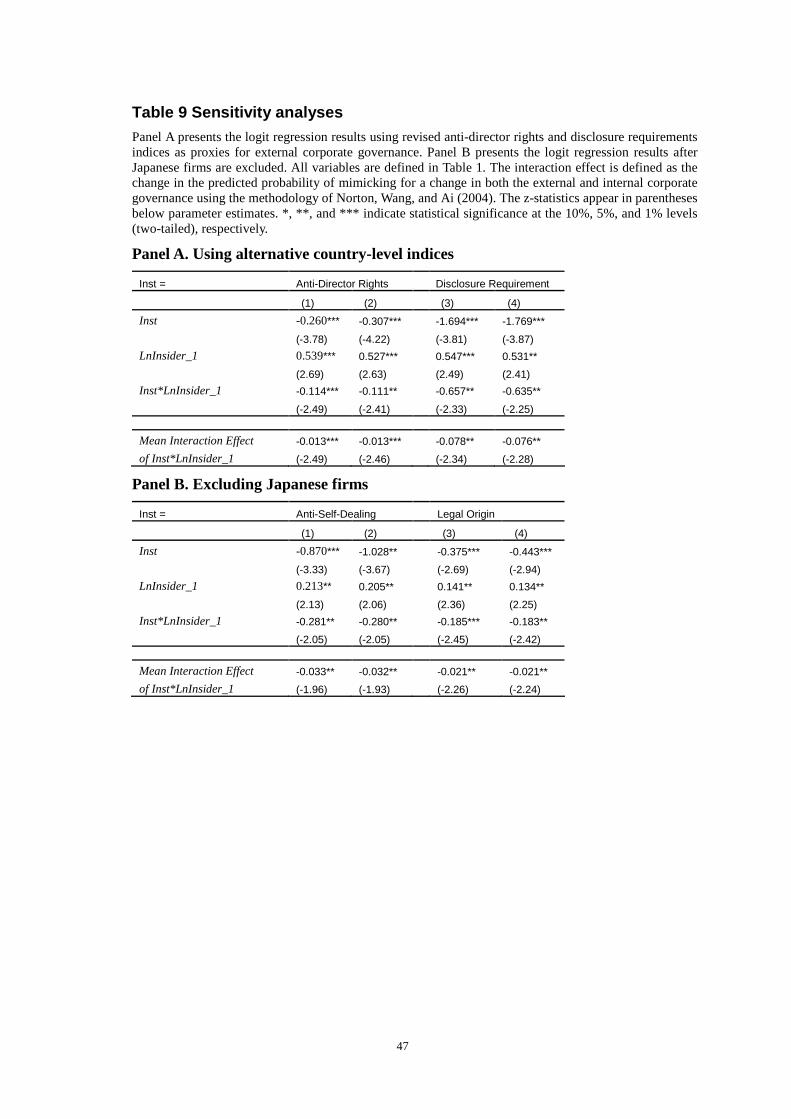
47
Table 9 Sensitivity analyses Panel A presents the logit regression results using revised anti-director rights and disclosure requirements indices as proxies for external corporate governance. Panel B presents the logit regression results after Japanese firms are excluded. All variables are defined in Table 1. The interaction effect is defined as the change in the predicted probability of mimicking for a change in both the external and internal corporate governance using the methodology of Norton, Wang, and Ai (2004). The z-statistics appear in parentheses below parameter estimates. *, **, and *** indicate statistical significance at the 10%, 5%, and 1% levels (two-tailed), respectively.
Panel A. Using alternative country-level indices
Inst = Anti-Director Rights Disclosure Requirement
(1) (2) (3) (4)
Inst -0.260*** -0.307*** -1.694*** -1.769***
(-3.78) (-4.22) (-3.81) (-3.87)
LnInsider_1 0.539*** 0.527*** 0.547*** 0.531**
(2.69) (2.63) (2.49) (2.41)
Inst*LnInsider_1 -0.114*** -0.111** -0.657** -0.635**
(-2.49) (-2.41) (-2.33) (-2.25)
Mean Interaction Effect -0.013*** -0.013*** -0.078** -0.076**
of Inst*LnInsider_1 (-2.49) (-2.46) (-2.34) (-2.28)
Panel B. Excluding Japanese firms
Inst = Anti-Self-Dealing Legal Origin
(1) (2) (3) (4)
Inst -0.870*** -1.028** -0.375*** -0.443***
(-3.33) (-3.67) (-2.69) (-2.94)
LnInsider_1 0.213** 0.205** 0.141** 0.134**
(2.13) (2.06) (2.36) (2.25)
Inst*LnInsider_1 -0.281** -0.280** -0.185*** -0.183**
(-2.05) (-2.05) (-2.45) (-2.42)
Mean Interaction Effect -0.033** -0.032** -0.021** -0.021**
of Inst*LnInsider_1 (-1.96) (-1.93) (-2.26) (-2.24)
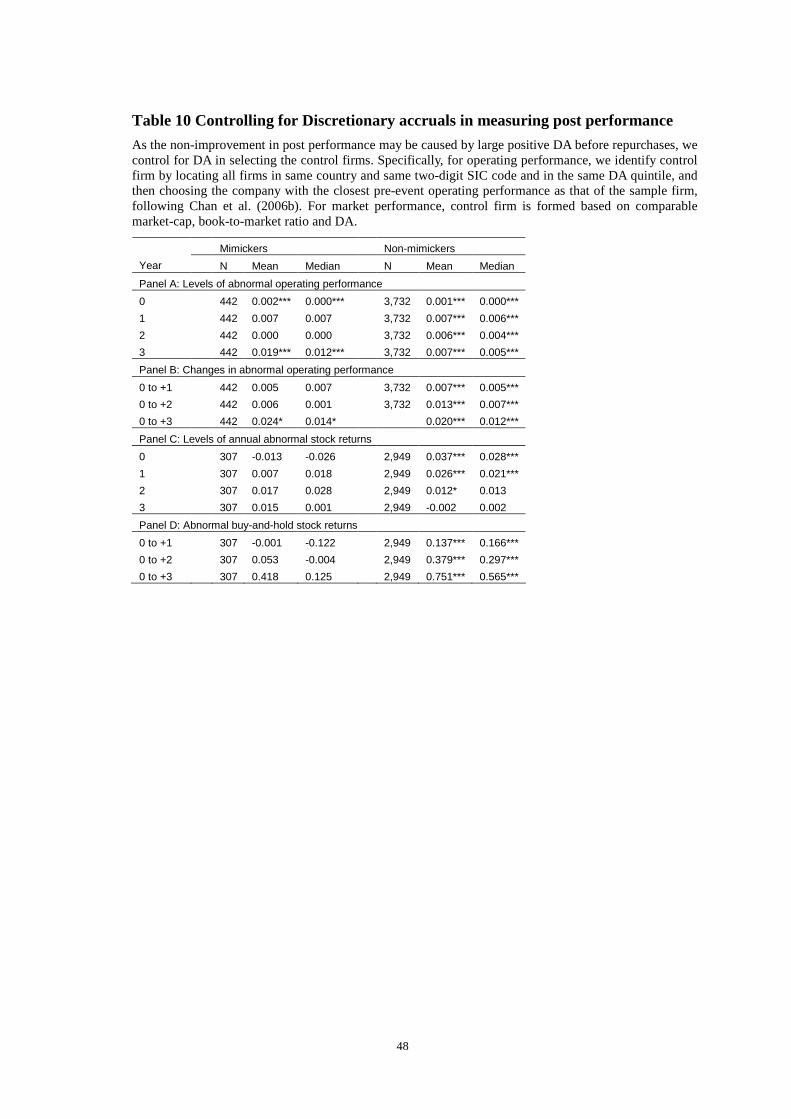
48
Table 10 Controlling for Discretionary accruals in measuring post performance
As the non-improvement in post performance may be caused by large positive DA before repurchases, we control for DA in selecting the control firms. Specifically, for operating performance, we identify control firm by locating all firms in same country and same two-digit SIC code and in the same DA quintile, and then choosing the company with the closest pre-event operating performance as that of the sample firm, following Chan et al. (2006b). For market performance, control firm is formed based on comparable market-cap, book-to-market ratio and DA.
Mimickers Non-mimickers
Year N Mean Median N Mean Median
Panel A: Levels of abnormal operating performance
0 442 0.002*** 0.000*** 3,732 0.001*** 0.000***
1 442 0.007 0.007 3,732 0.007*** 0.006***
2 442 0.000 0.000 3,732 0.006*** 0.004***
3 442 0.019*** 0.012*** 3,732 0.007*** 0.005***
Panel B: Changes in abnormal operating performance
0 to +1 442 0.005 0.007 3,732 0.007*** 0.005***
0 to +2 442 0.006 0.001 3,732 0.013*** 0.007***
0 to +3 442 0.024* 0.014* 0.020*** 0.012***
Panel C: Levels of annual abnormal stock returns
0 307 -0.013 -0.026 2,949 0.037*** 0.028***
1 307 0.007 0.018 2,949 0.026*** 0.021***
2 307 0.017 0.028 2,949 0.012* 0.013
3 307 0.015 0.001 2,949 -0.002 0.002
Panel D: Abnormal buy-and-hold stock returns
0 to +1 307 -0.001 -0.122 2,949 0.137*** 0.166***
0 to +2 307 0.053 -0.004 2,949 0.379*** 0.297***
0 to +3 307 0.418 0.125 2,949 0.751*** 0.565***
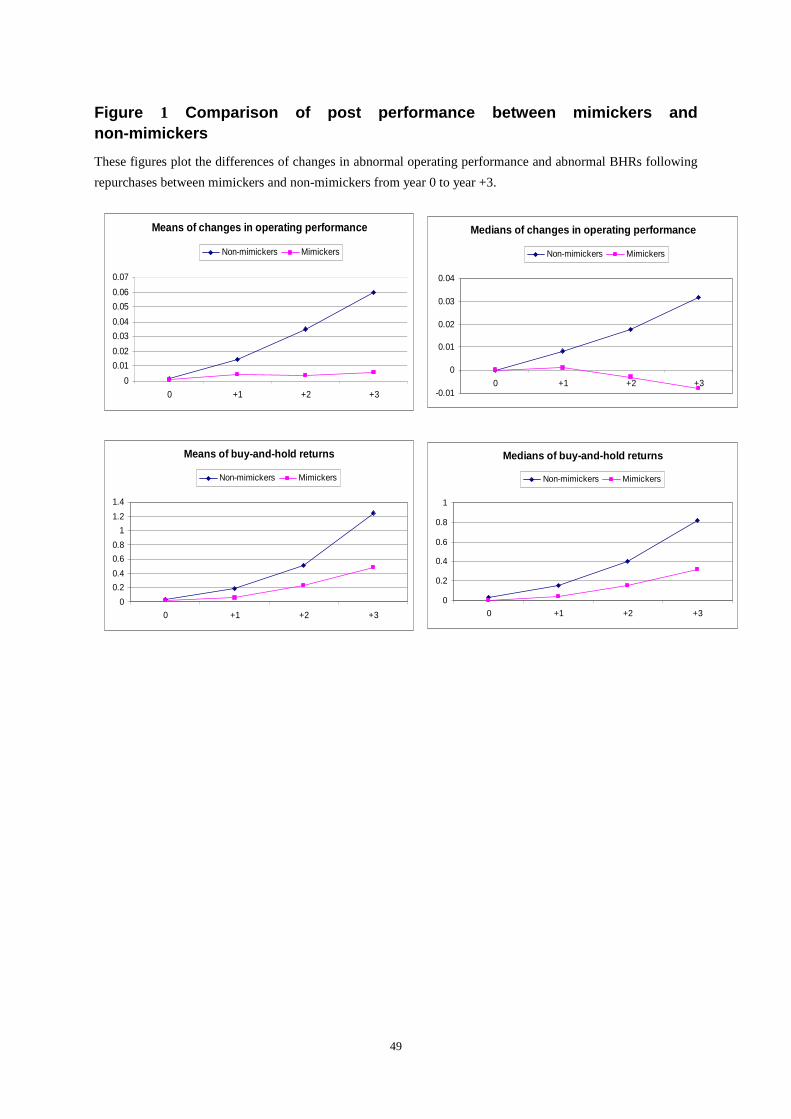
49
Figure 1 Comparison of post performance between mimickers and non-mimickers
These figures plot the differences of changes in abnormal operating performance and abnormal BHRs following
repurchases between mimickers and non-mimickers from year 0 to year +3.
Means of changes in operating performance
0
0.01
0.02
0.03
0.04
0.05
0.06
0.07
0 +1 +2 +3
Non-mimickers Mimickers
Medians of changes in operating performance
-0.01
0
0.01
0.02
0.03
0.04
0 +1 +2 +3
Non-mimickers Mimickers
Means of buy-and-hold returns
0
0.2
0.4
0.6
0.8
1
1.2
1.4
0 +1 +2 +3
Non-mimickers Mimickers
Medians of buy-and-hold returns
0
0.2
0.4
0.6
0.8
1
0 +1 +2 +3
Non-mimickers Mimickers
Recommended