Lecture 1:
Population Boom and Bust: Population Change in
Developing and Developed Countries
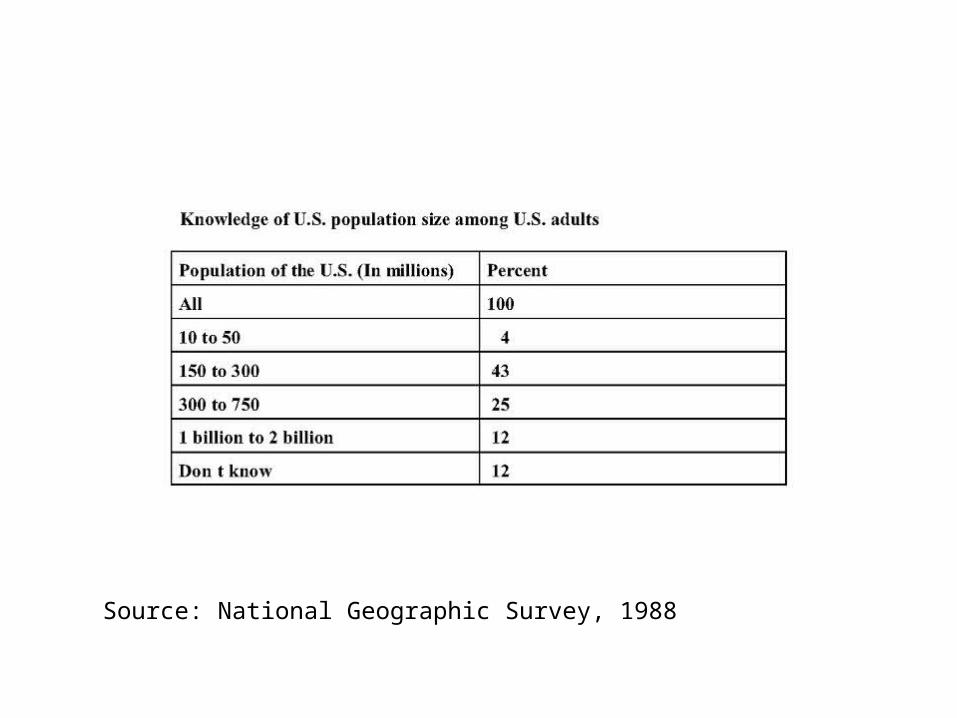
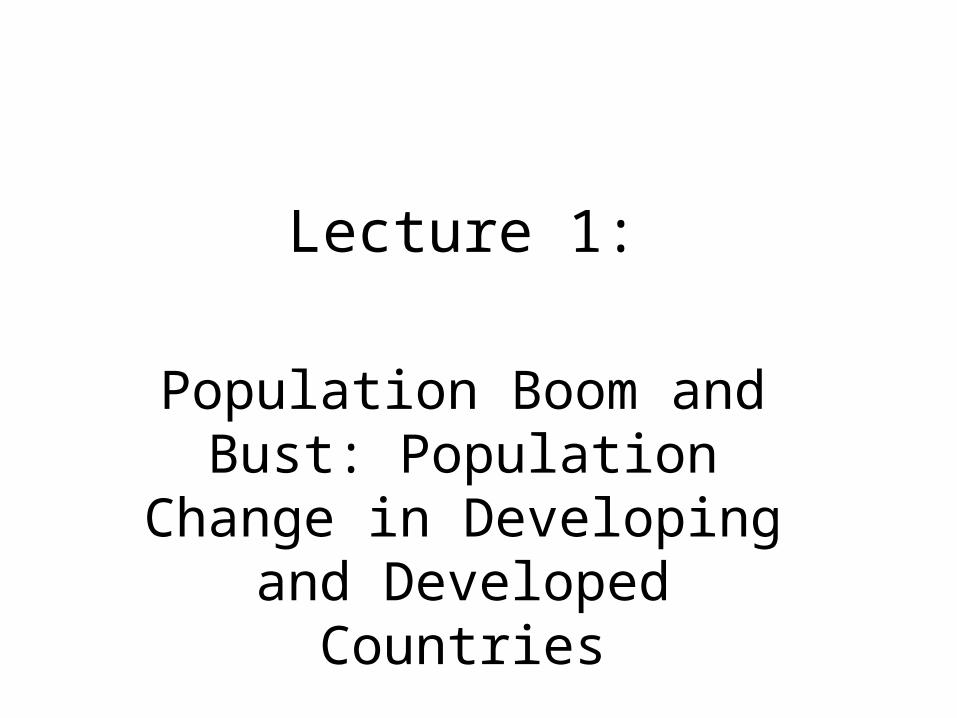
Source: National Geographic Survey, 1988
Source: National Geographic Survey, 1988

Outline World population growth
by region, over time, projections,
Formula for population change
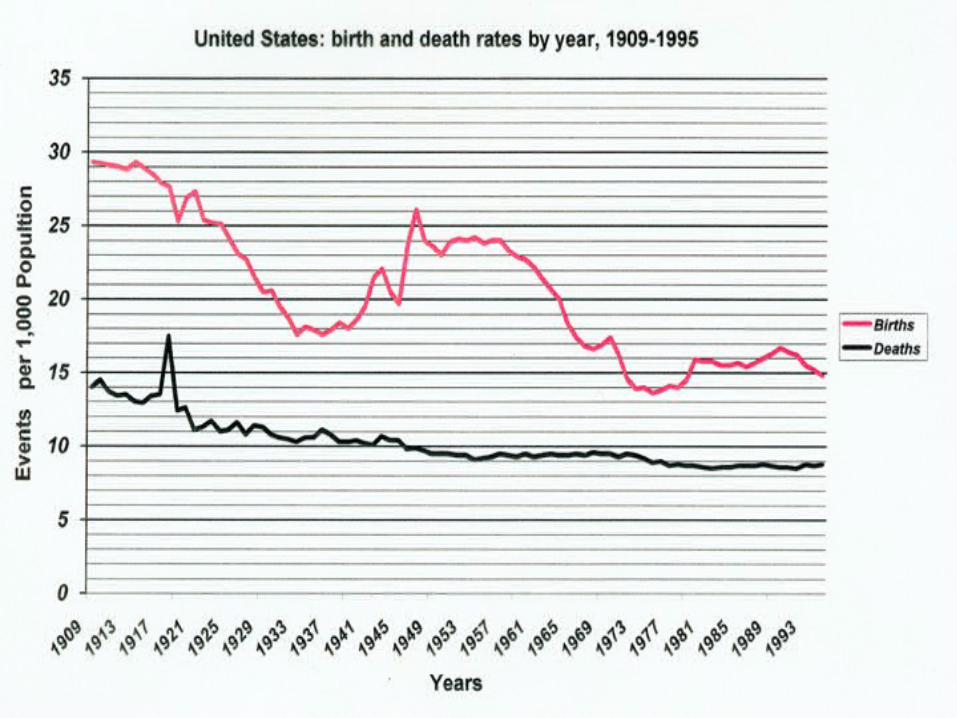
Population growth in the USA
Demographic transition theory
Age distribution changes
Urbanization
Population growth and economic growth

Global Population Growth
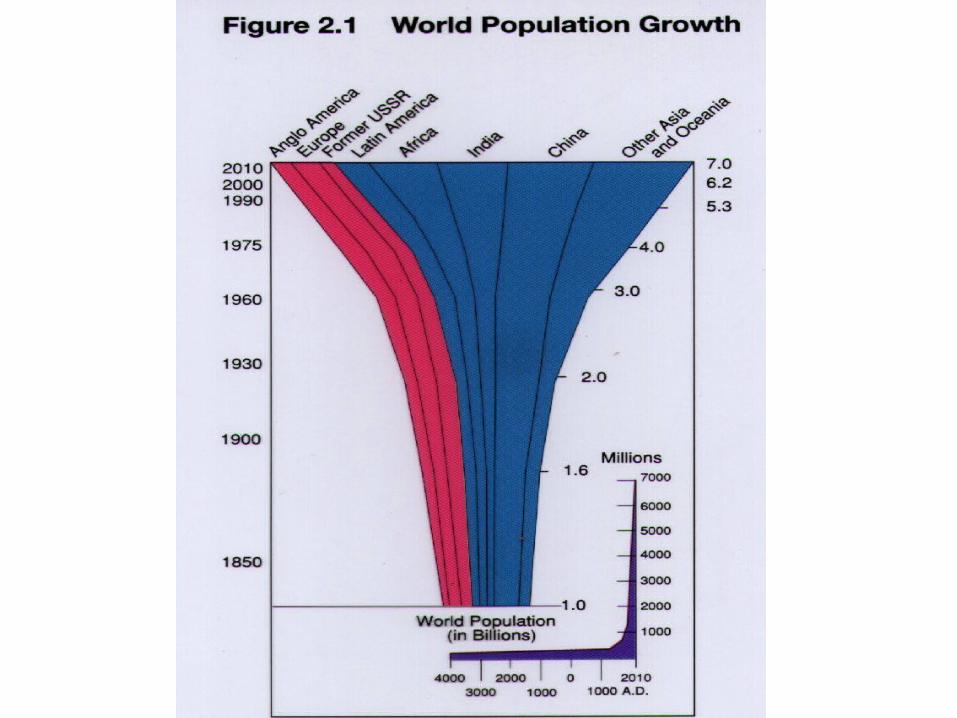
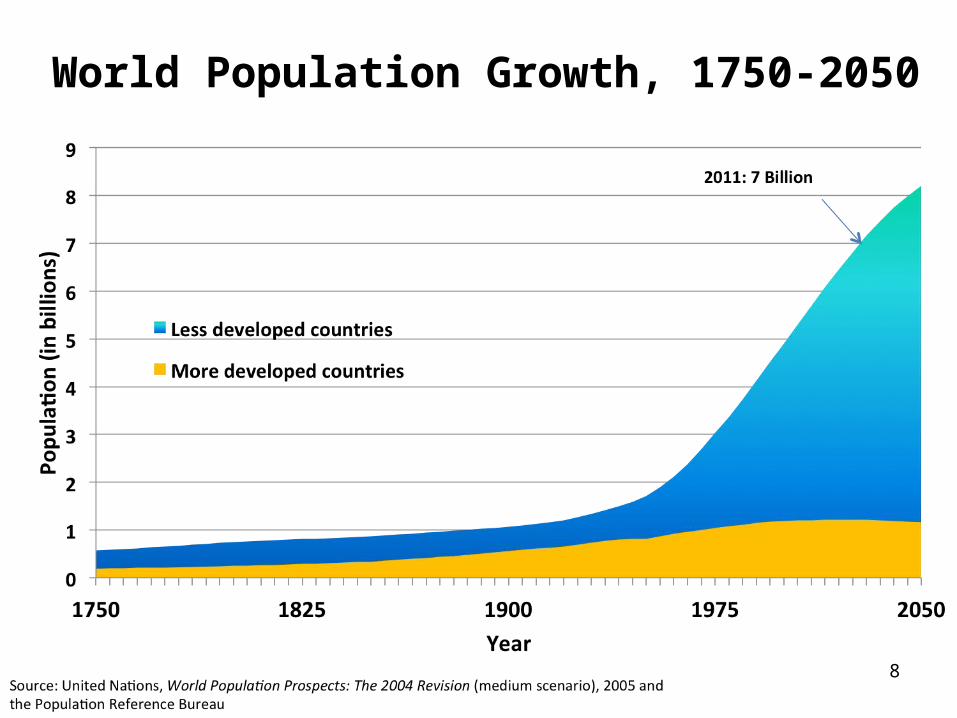
World Population Growth, 1750-2050
8

Class participation
Additions of population to the planet in real time.
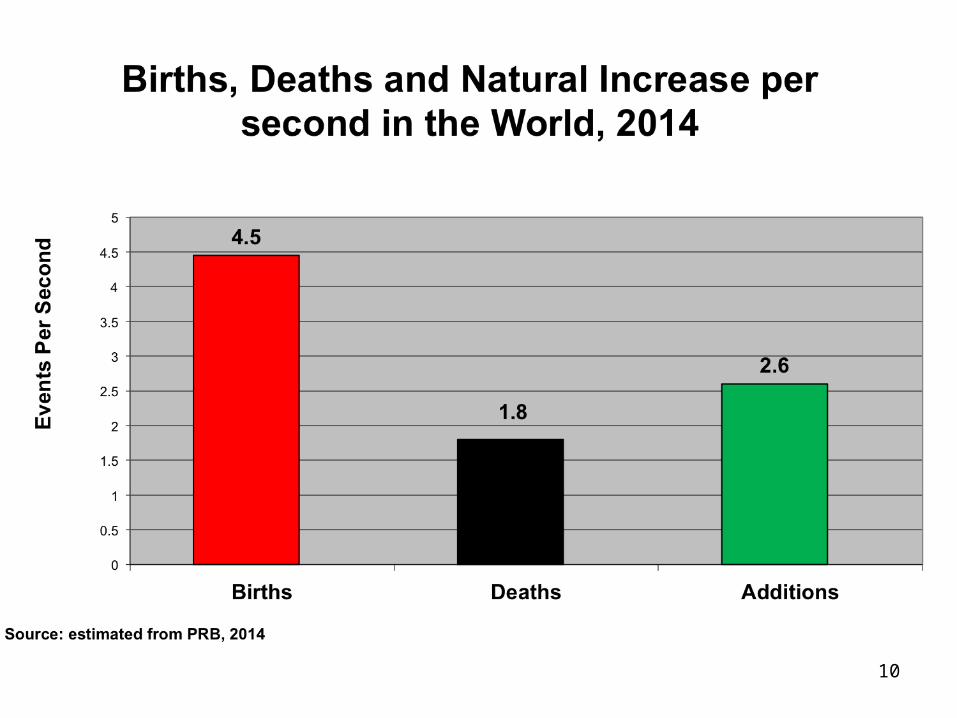
10
Population growth in real time(visual display of same)
http://www.worldometers.infohttp://www.census.gov/popclock/?
intcmp=home_pop
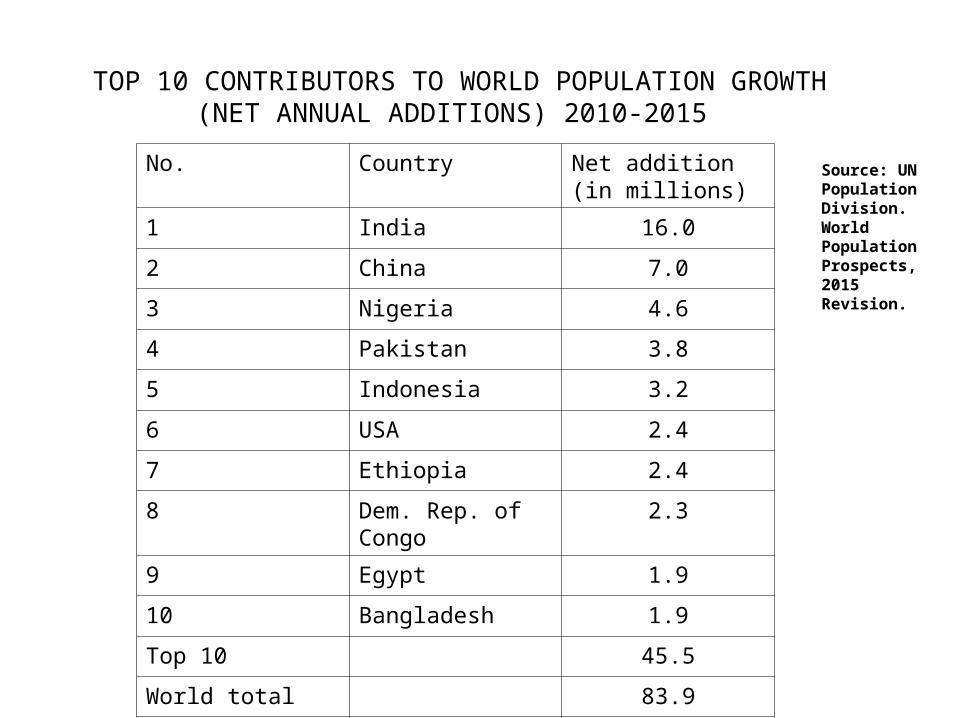
TOP 10 CONTRIBUTORS TO WORLD POPULATION GROWTH (NET ANNUAL ADDITIONS) 2010-2015
No. Country Net addition (in millions)
1 India 16.0
2 China 7.0
3 Nigeria 4.6
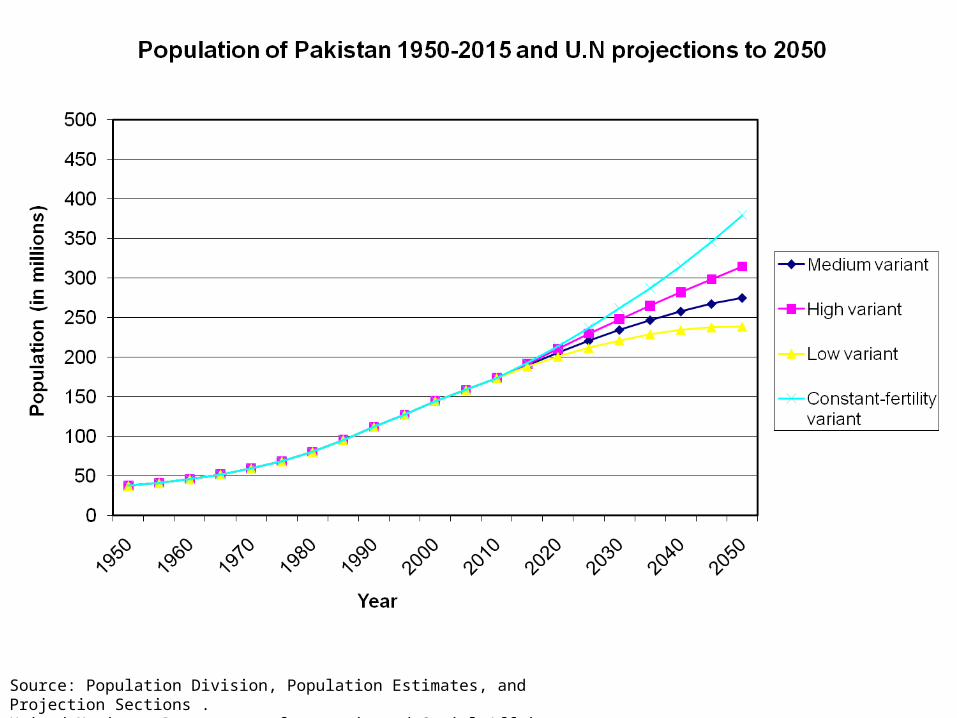
4 Pakistan 3.8
5 Indonesia 3.2
6 USA 2.4
7 Ethiopia 2.4
8 Dem. Rep. of Congo
2.3
9 Egypt 1.9
10 Bangladesh 1.9
Top 10 45.5
World total 83.9
Source: UN Population Division. World Population Prospects, 2015 Revision.
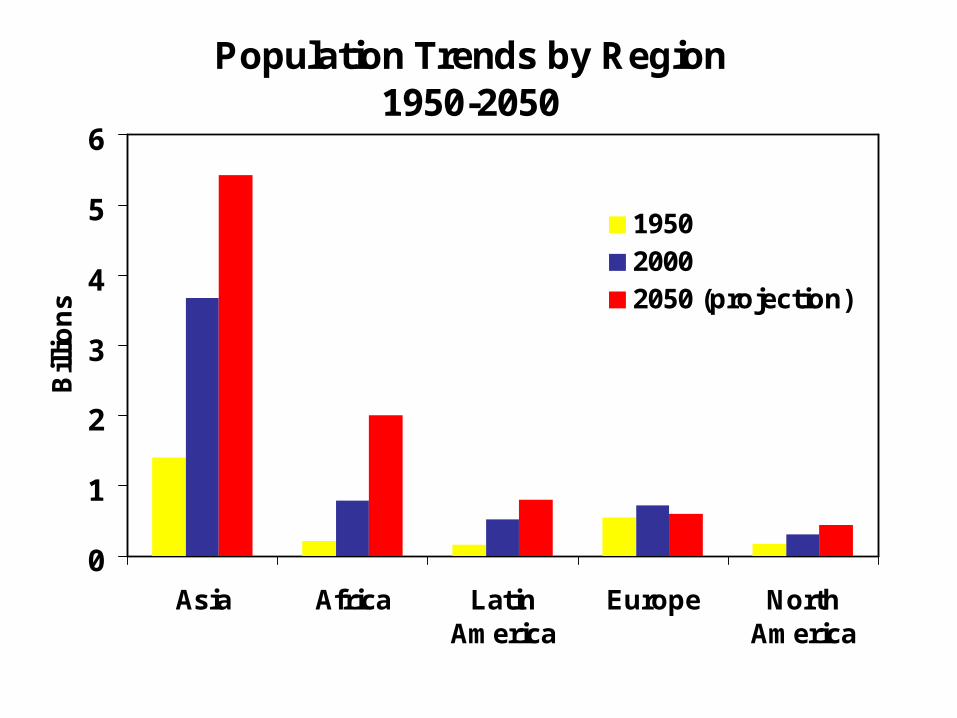
Population Trends by Region 1950-2050
0
1
2
3
4
5
6
Asia Africa LatinAmerica
Europe NorthAmerica
Bill
ion
s
195020002050 (projection)
Source: United Nations 2001

Projections
http://www.un.org/esa/population/unpop.htm
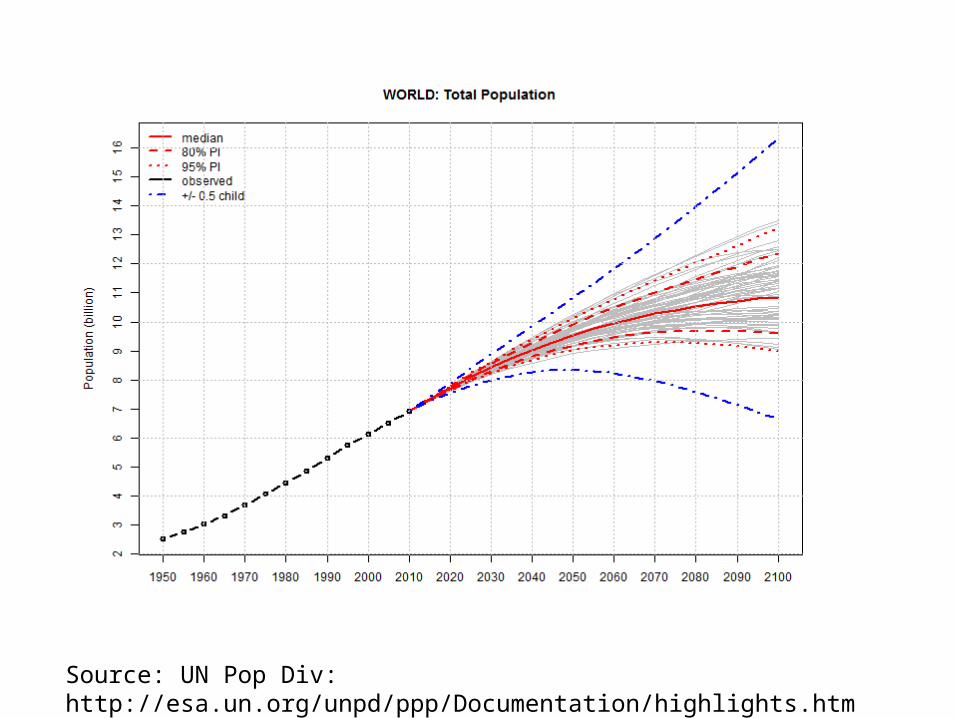
Source: UN Pop Div: http://esa.un.org/unpd/ppp/Documentation/highlights.htm
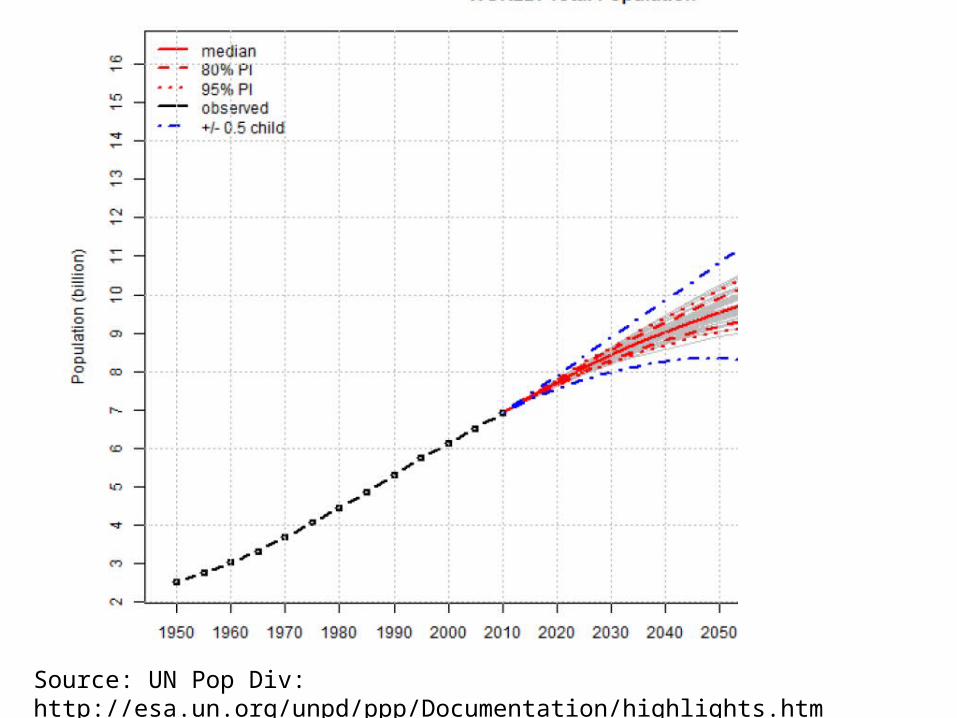
Source: UN Pop Div: http://esa.un.org/unpd/ppp/Documentation/highlights.htm
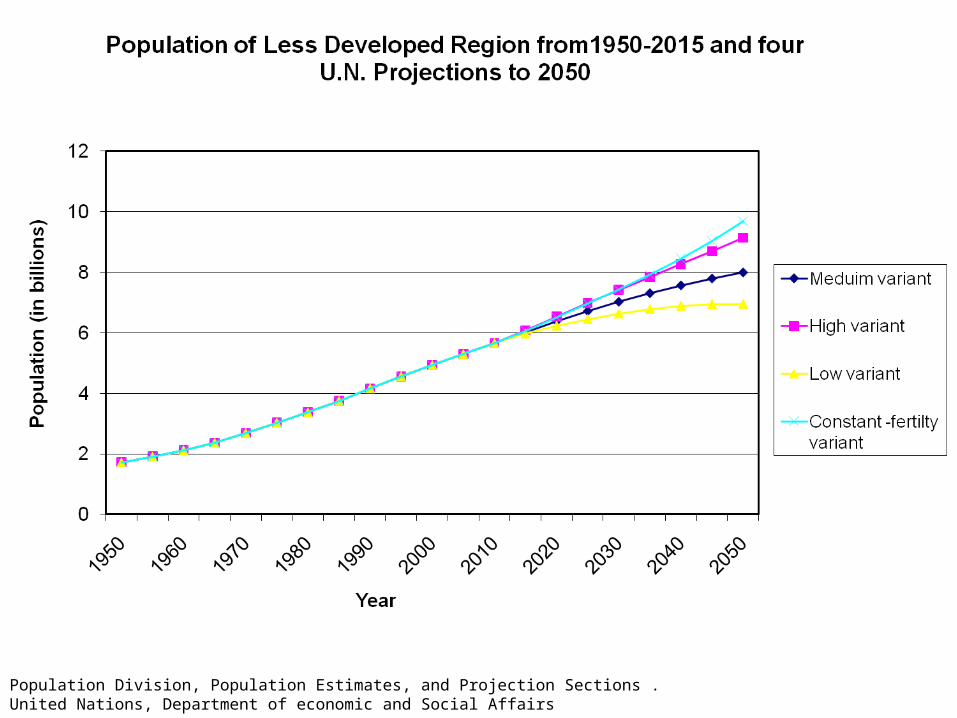
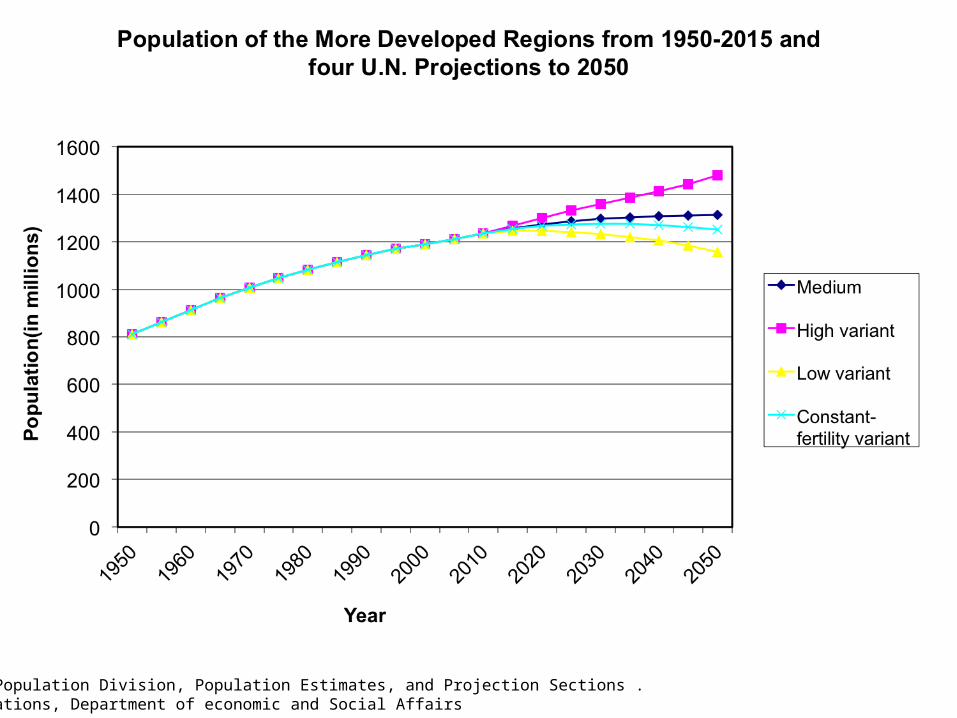
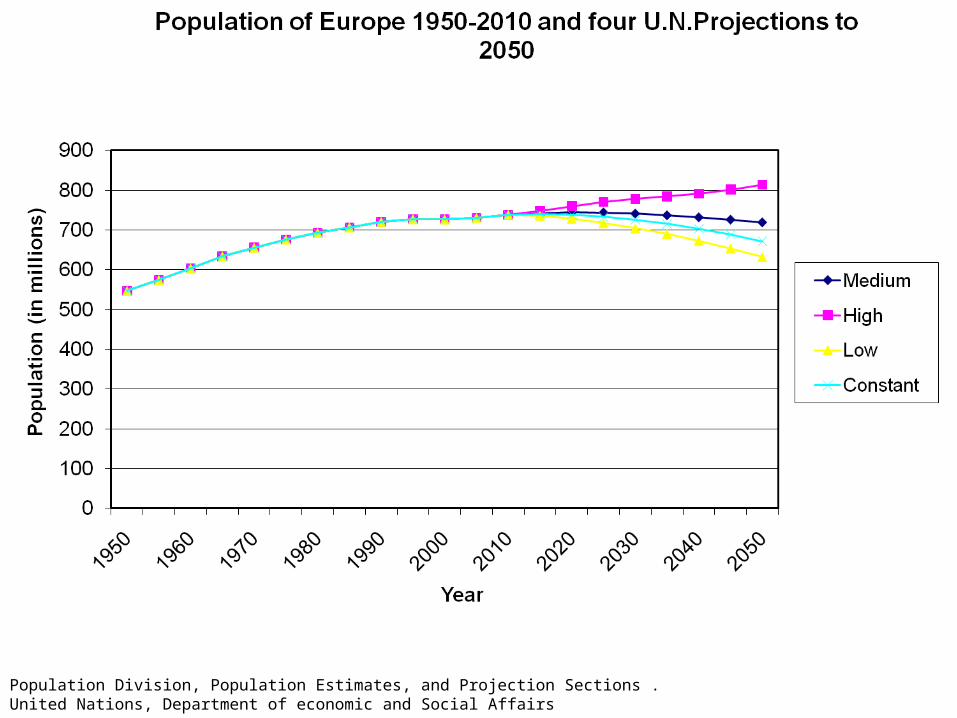
Source: Population Division, Population Estimates, and Projection Sections .United Nations, Department of economic and Social Affairs
0
2
4
6
8
10
12
Po
pu
lati
on
(in
bil
lio
ns)
Year
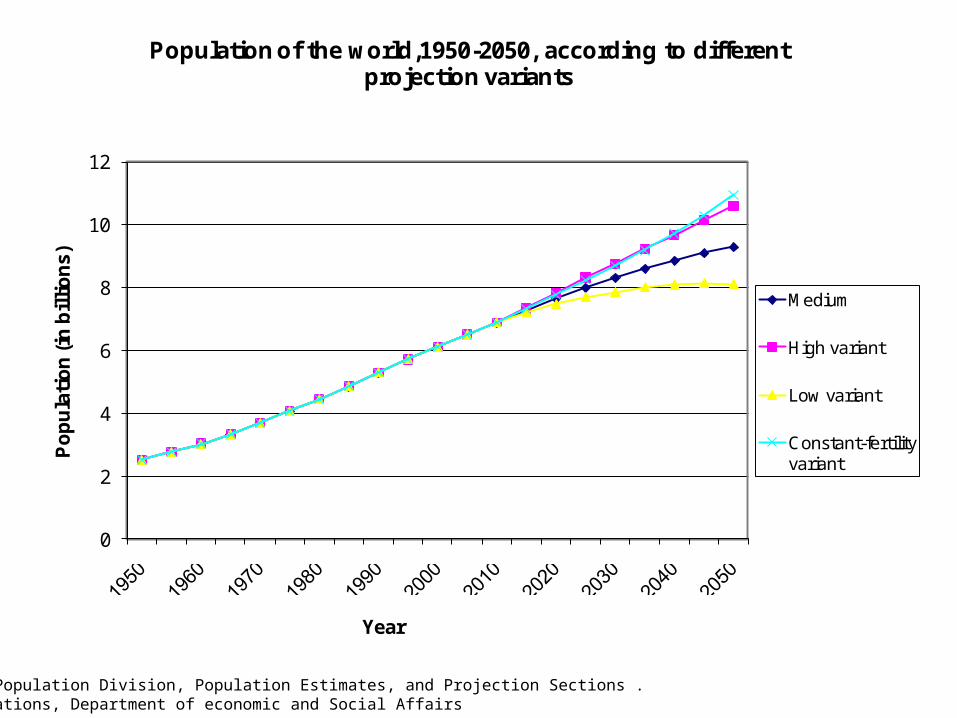
Population of the world,1950-2050, according to different projection variants
Medium
High variant
Low variant
Constant-fertility variant
Population Division, Population Estimates, and Projection Sections .United Nations, Department of economic and Social Affairs
Source: Population Division, Population Estimates, and Projection Sections .United Nations, Department of economic and Social Affairs
Population Division, Population Estimates, and Projection Sections .United Nations, Department of economic and Social Affairs
Source: Population Division, Population Estimates, and Projection Sections .United Nations, Department of economic and Social Affairs
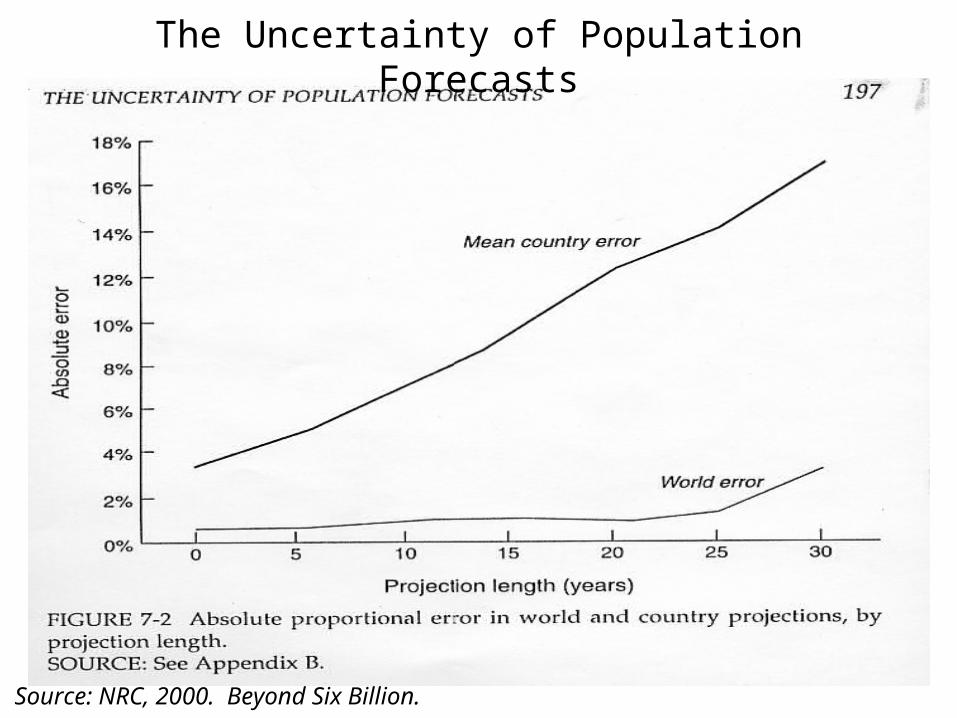
The Uncertainty of Population Forecasts
Source: NRC, 2000. Beyond Six Billion.
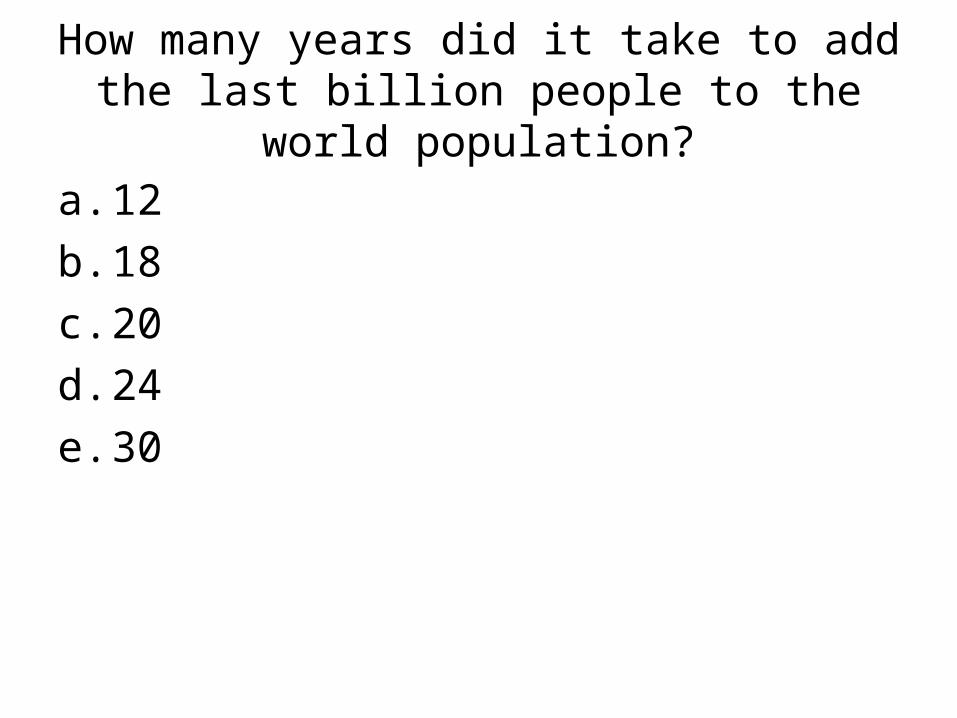
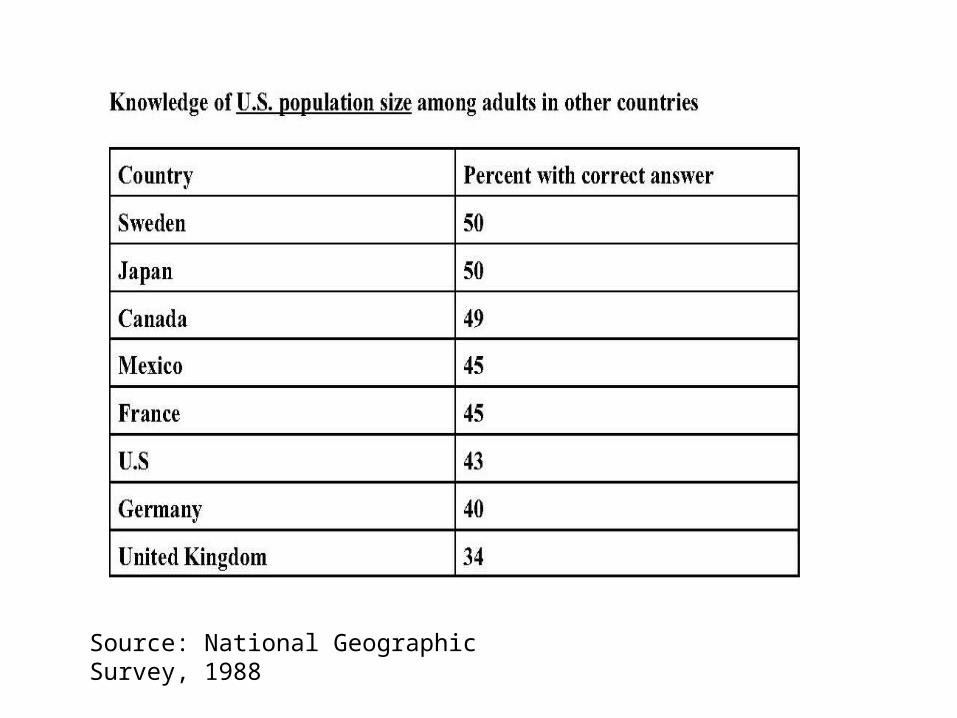
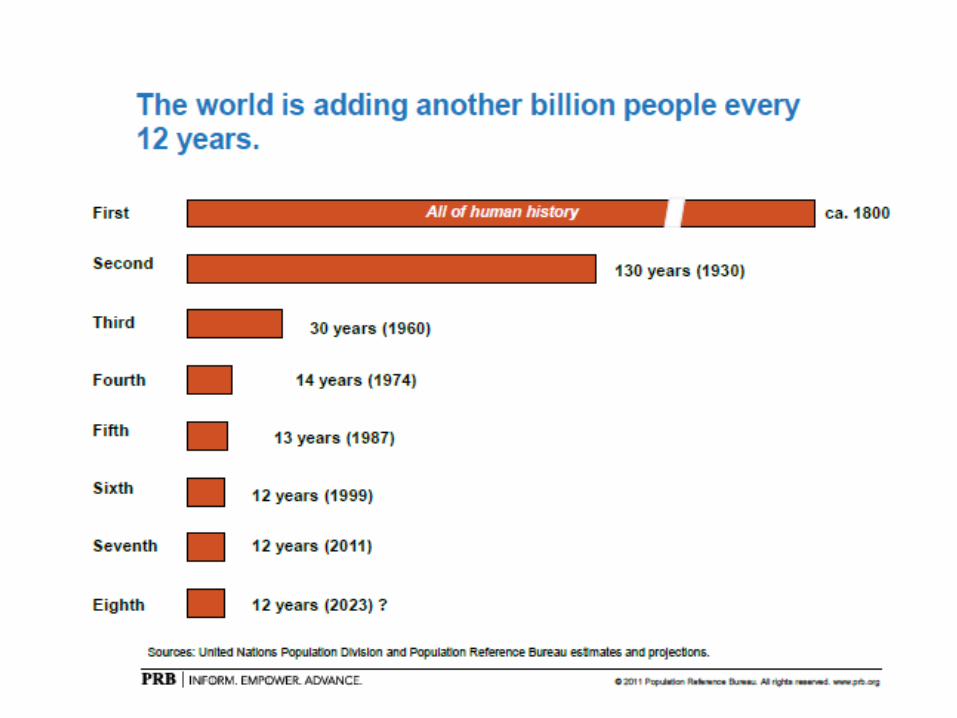
How many years did it take to add the last billion people to the world population?
a. 12
b. 18
c. 20
d. 24
e. 30
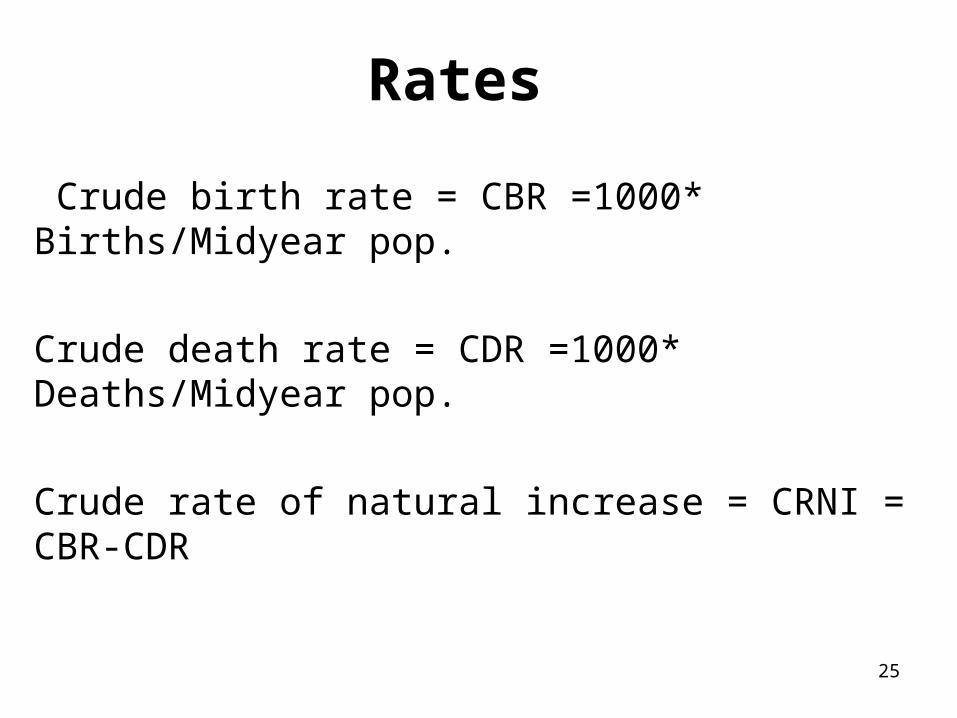
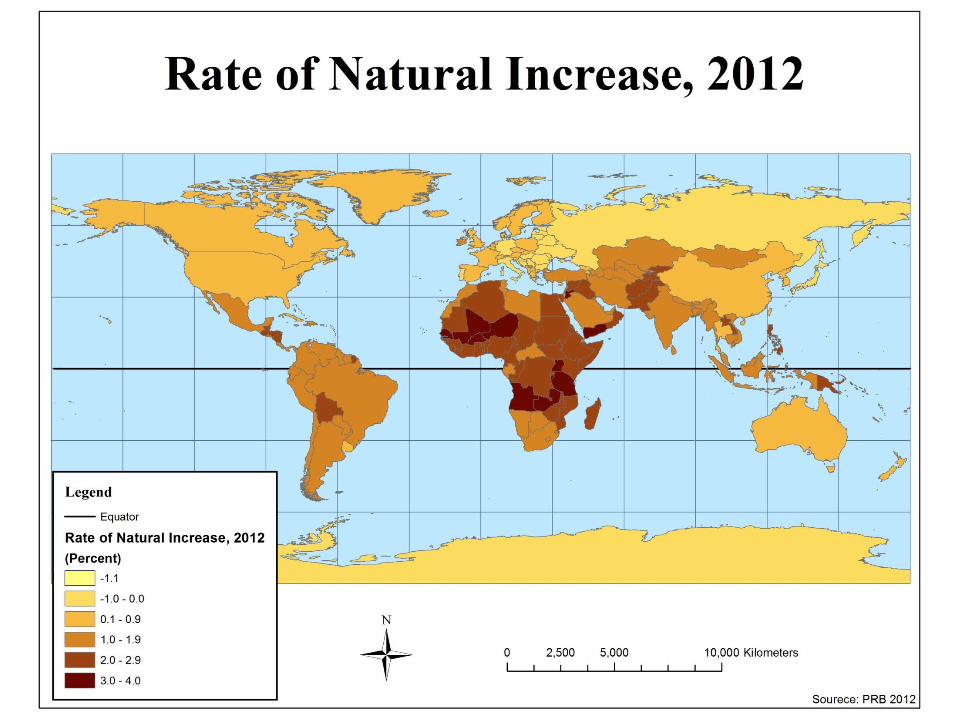
Rates
Crude birth rate = CBR =1000* Births/Midyear pop.
Crude death rate = CDR =1000* Deaths/Midyear pop.
Crude rate of natural increase = CRNI = CBR-CDR
25
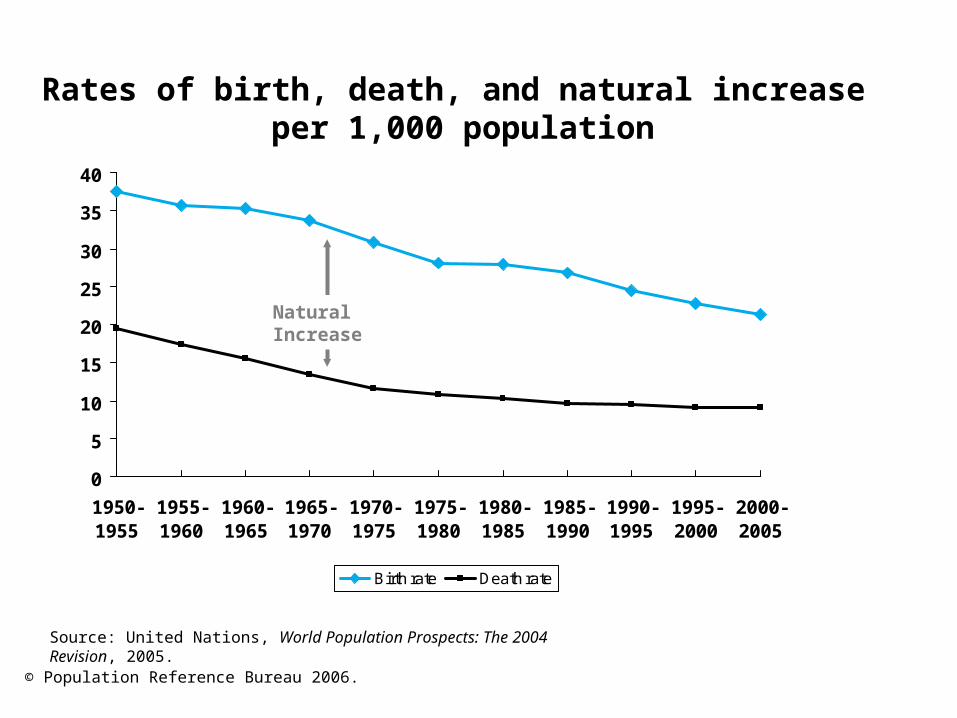
Source: United Nations, World Population Prospects: The 2004 Revision, 2005.
Rates of birth, death, and natural increase per 1,000 population
0
5
10
15
20
25
30
35
40
1950-1955
1955-1960
1960-1965
1965-1970
1970-1975
1975-1980
1980-1985
1985-1990
1990-1995
1995-2000
2000-2005
Birth rate Death rate
Natural Increase
© Population Reference Bureau 2006.
01
02
03
04
05
06
07
08
09
01
00P
op
adde
d pe
r ye
ar (
mill
ion
s)
1950 1960 1970 1980 1990 2000 2010year
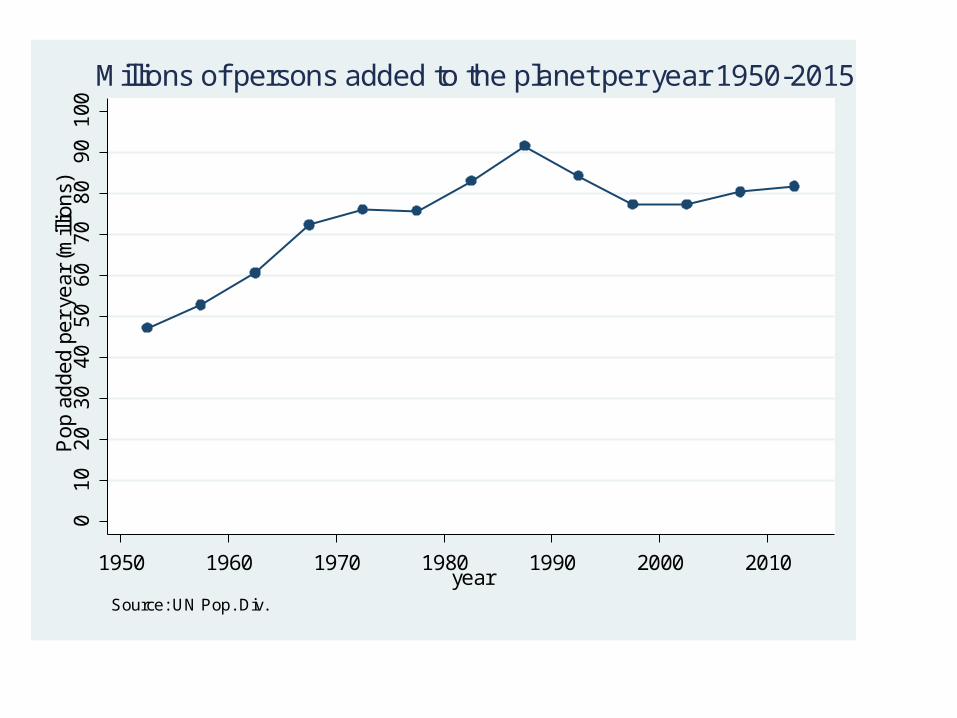
Source: UN Pop. Div.
Millions of persons added to the planet per year 1950-2015
“Pair and share:” How is it possible for absolute numbers of births to increase even when
birth rates are declining?
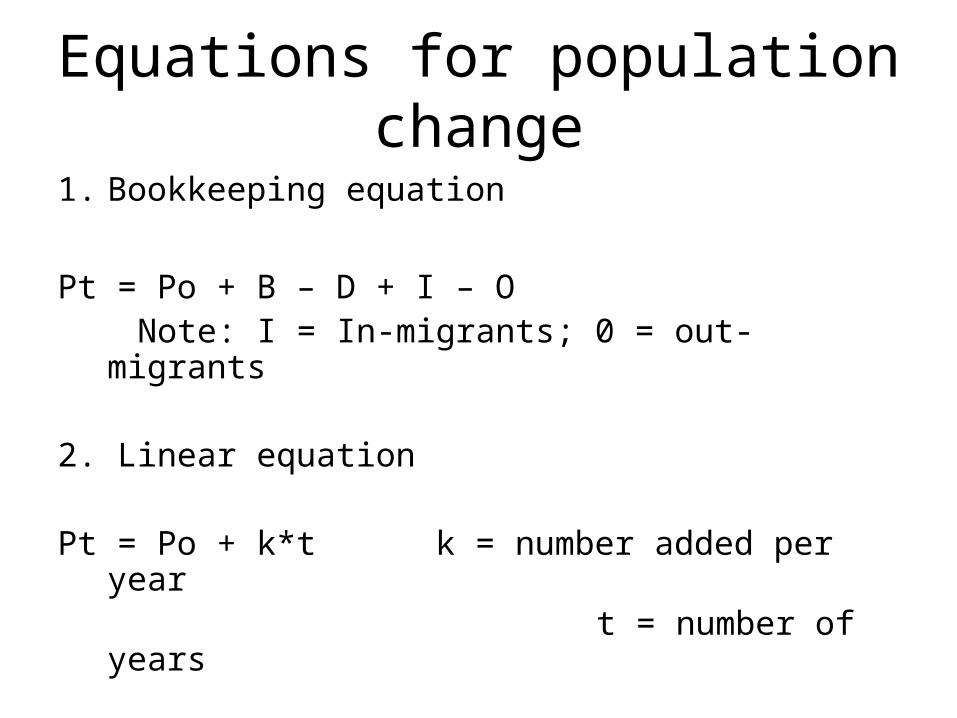
Equations for population change
1. Bookkeeping equation
Pt = Po + B – D + I – O Note: I = In-migrants; 0 = out-migrants
2. Linear equation
Pt = Po + k*t k = number added per year t = number of years
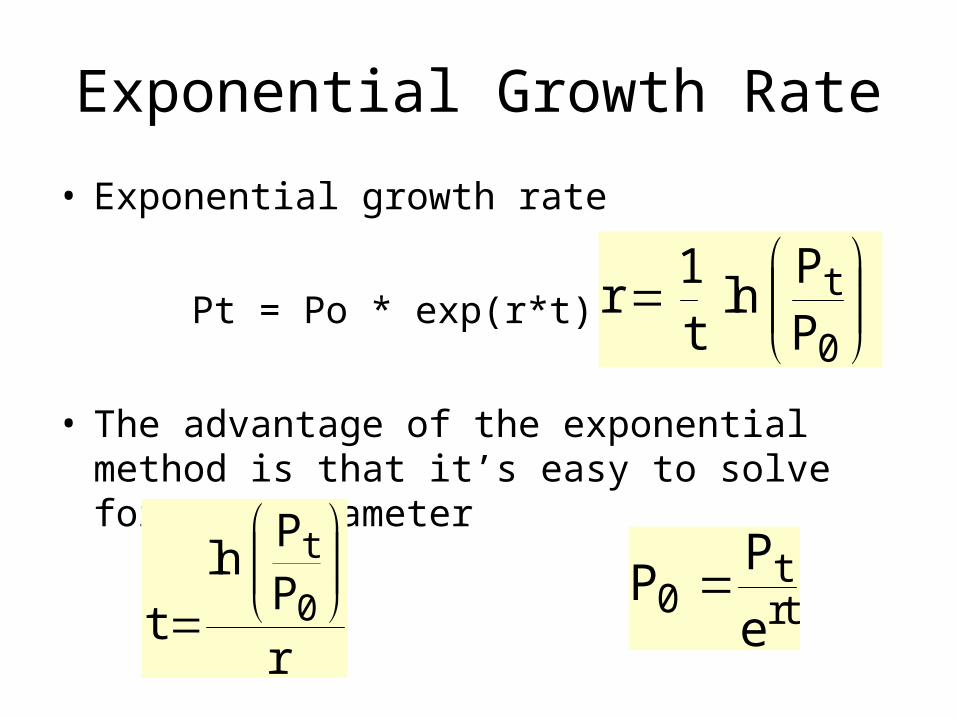
Exponential Growth Rate
• Exponential growth rate
Pt = Po * exp(r*t) solving
• The advantage of the exponential method is that it’s easy to solve for any parameter
PP
ln t1
r0
t
r
PP
ln
t 0
t
rtt
0e
PP
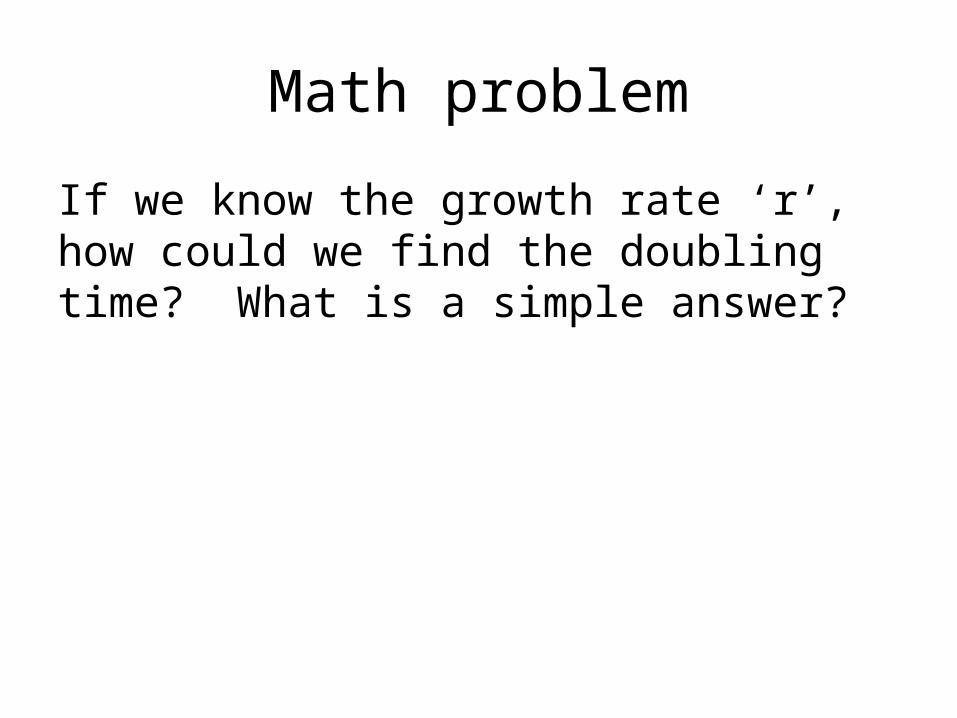
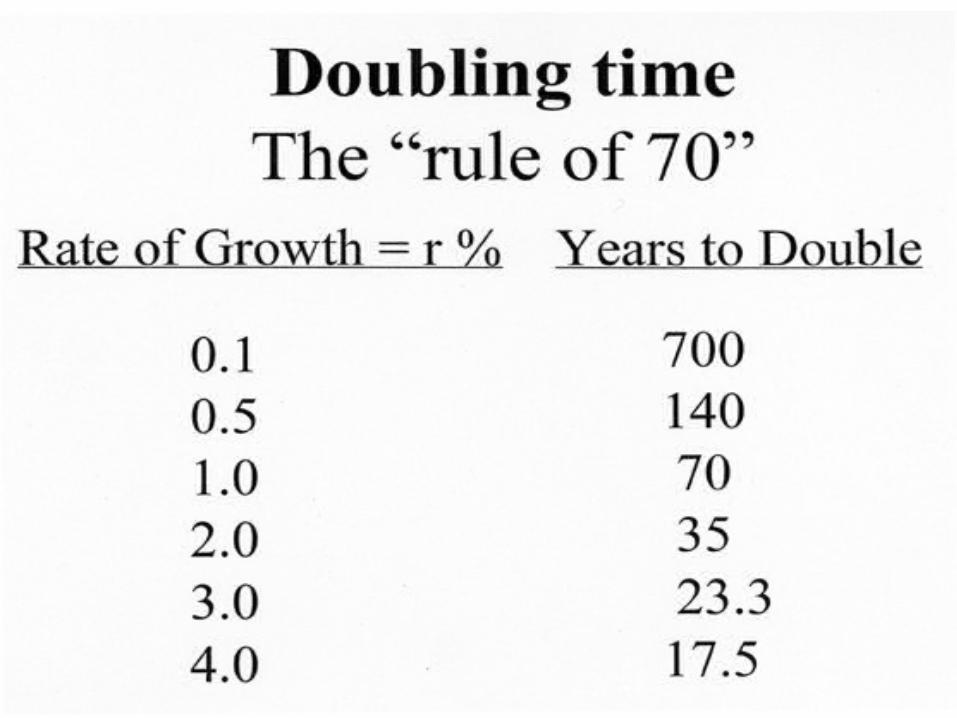
Math problem
If we know the growth rate ‘r’, how could we find the doubling time? What is a simple answer?
Question: What is the only sustainable population
growth rate in the long term?
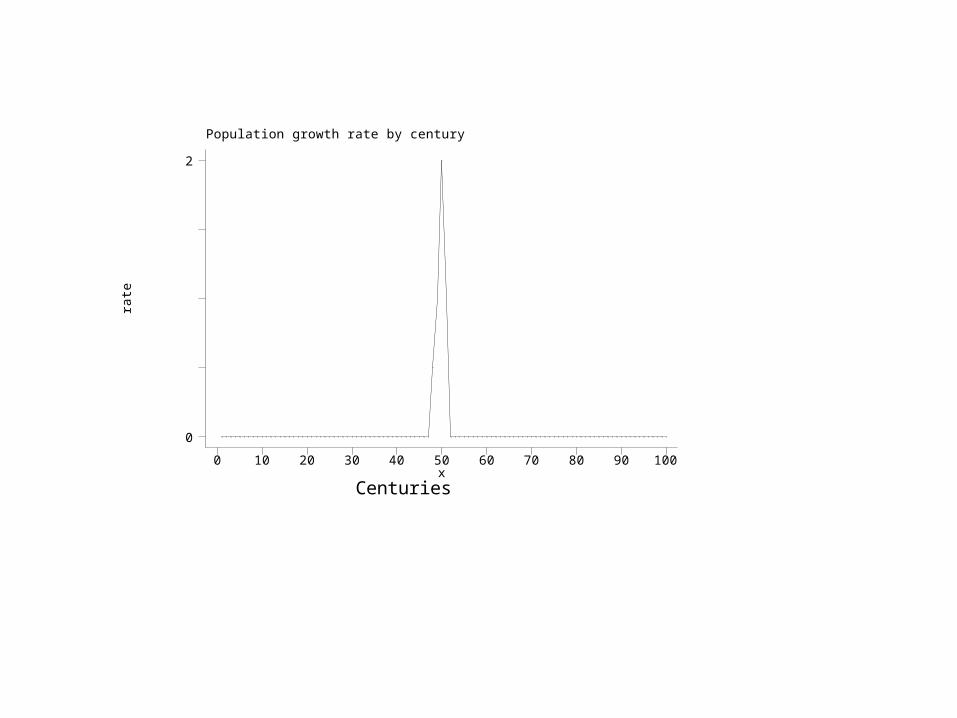
Population growth rate by centuryra
te
Centuriesx
0 10 20 30 40 50 60 70 80 90 100
0
2
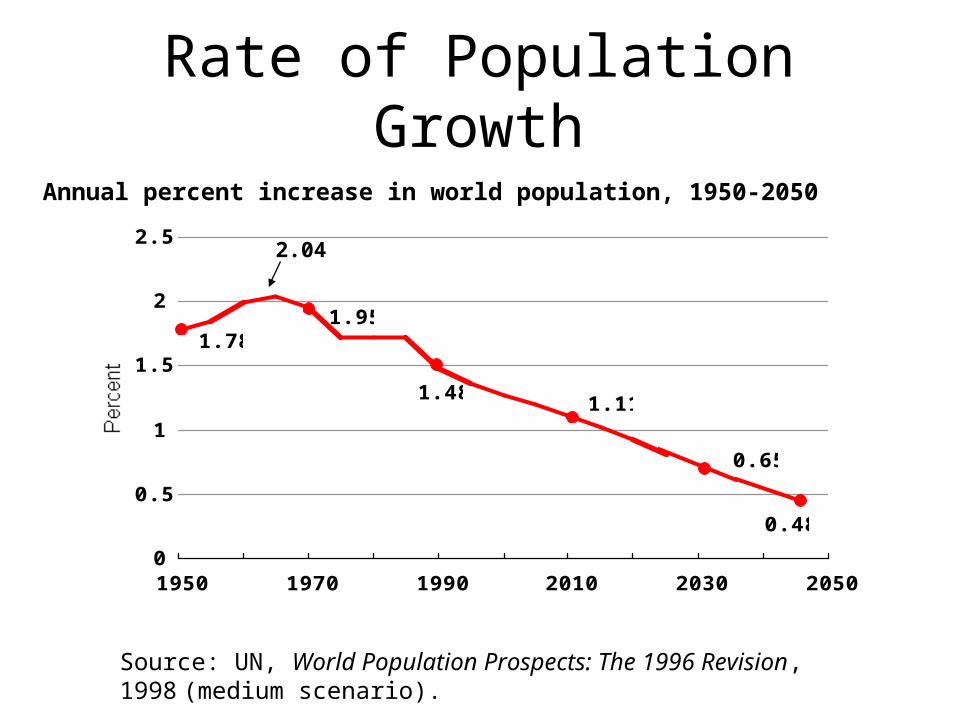
Rate of Population Growth
0.48
0.65
1.111.48
1.951.78
0
0.5
1
1.5
2
2.5
1950 1970 1990 2010 2030 2050
Annual percent increase in world population, 1950-2050
Source: UN, World Population Prospects: The 1996 Revision, 1998 (medium scenario).
2.04
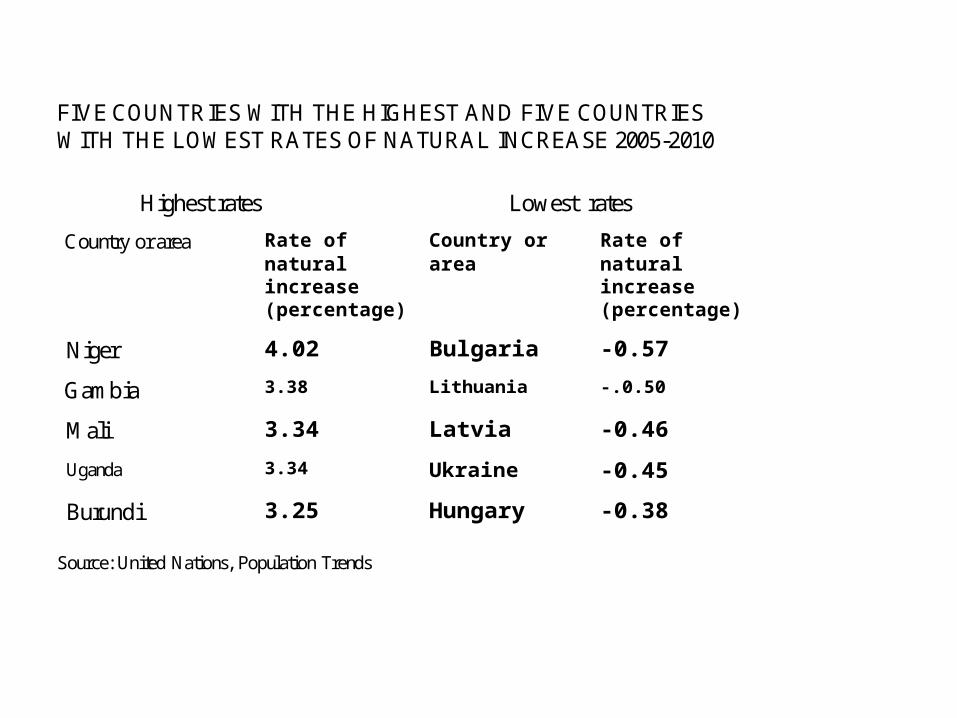
FIVE COUNTRIES WITH THE HIGHEST AND FIVE COUNTRIES WITH THE LOWEST RATES OF NATURAL INCREASE 2005-2010
Highest rates Lowest rates
Country or area Rate ofnaturalincrease(percentage)
Country orarea
Rate ofnaturalincrease(percentage)
Niger 4.02 Bulgaria -0.57
Gambia 3.38 Lithuania -.0.50
Mali 3.34 Latvia -0.46
Uganda 3.34 Ukraine -0.45
Burundi 3.25 Hungary -0.38
Source: United Nations, Population Trends
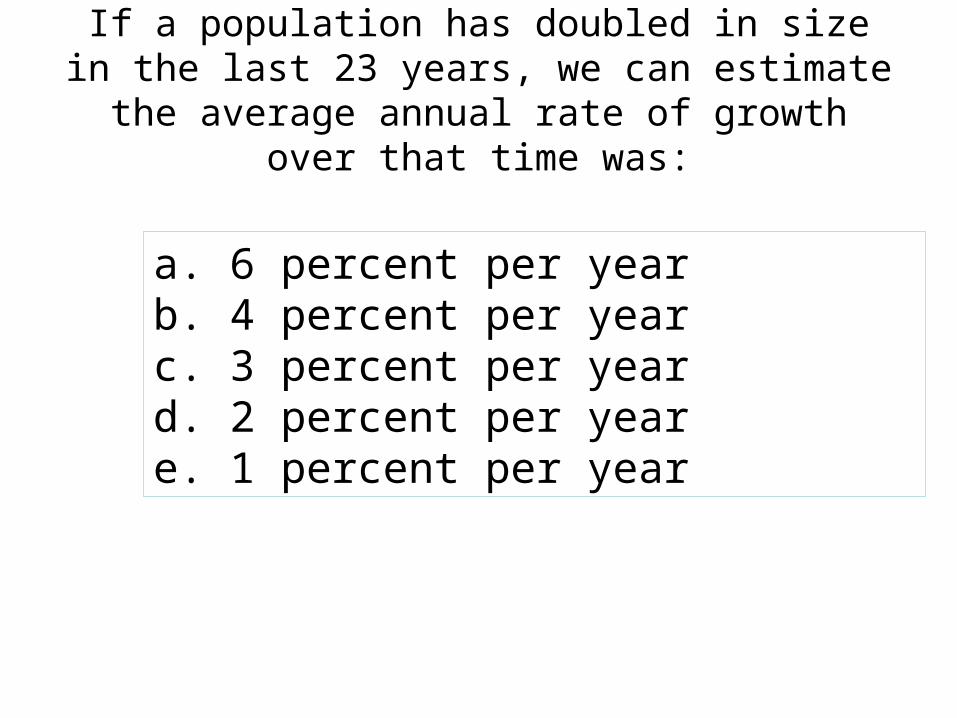
If a population has doubled in size in the last 23 years, we can estimate the average annual rate of
growth over that time was:
a. 6 percent per yearb. 4 percent per yearc. 3 percent per yeard. 2 percent per yeare. 1 percent per year

Conclusion:
We live in a very demographically
divided/diverse world!

Population Growth in the U.S.A.
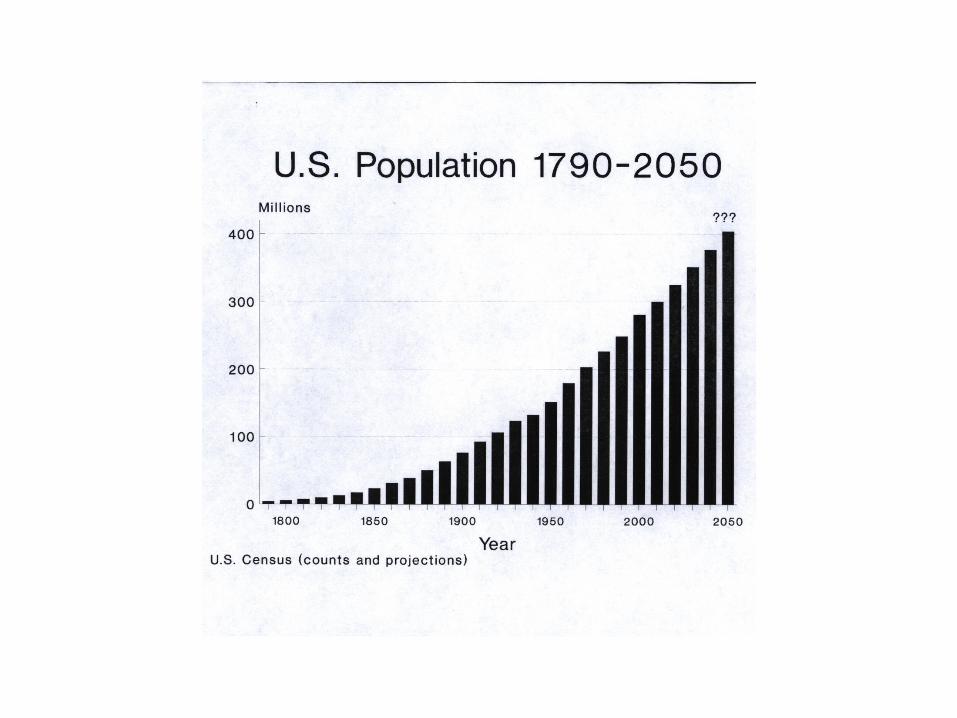

U.S. Population Growth
• Net immigration About 1 million new legal immigrants Maybe 300,000 net undocumented Relatively small number of emigrants
• Approximately 4.0 million births
• Approximately 2.6 million deaths
• NET GROWTH= ABOUT 2.4 -2.7 MILLION
Sources: Migration Policy Inst., 2015; Pew Center, 2012; US Census Bureau, 2014

Our local area
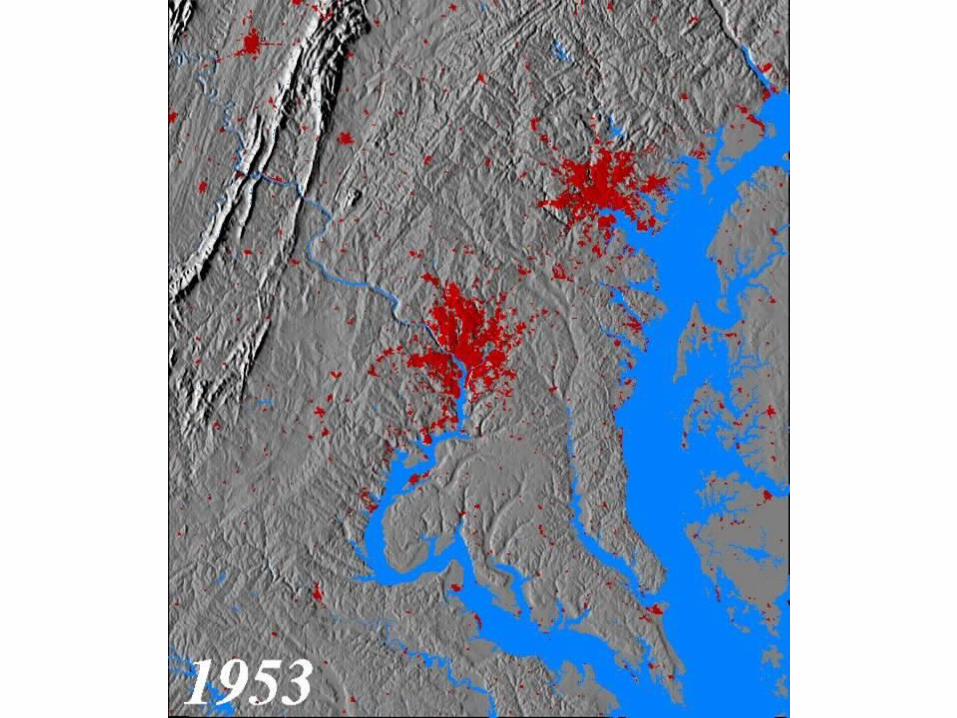
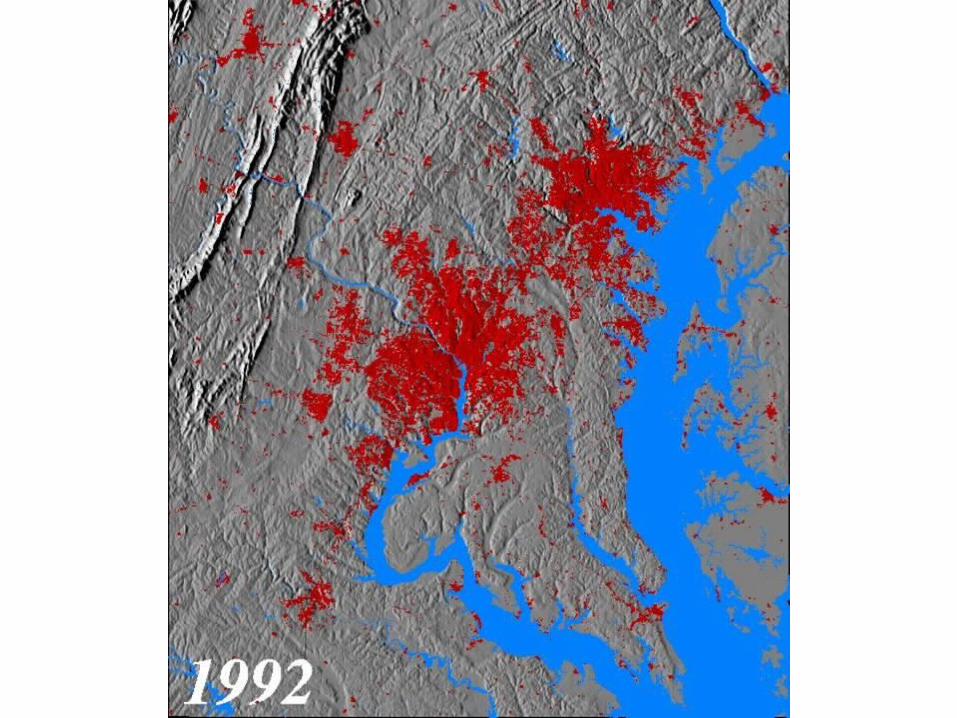

Source: http://www.inliquid.com/artist/oliva_daniel/oliva.phpphoto 6: Baltimore/Washington, from Composite Views series, 2007, 12” x 16”
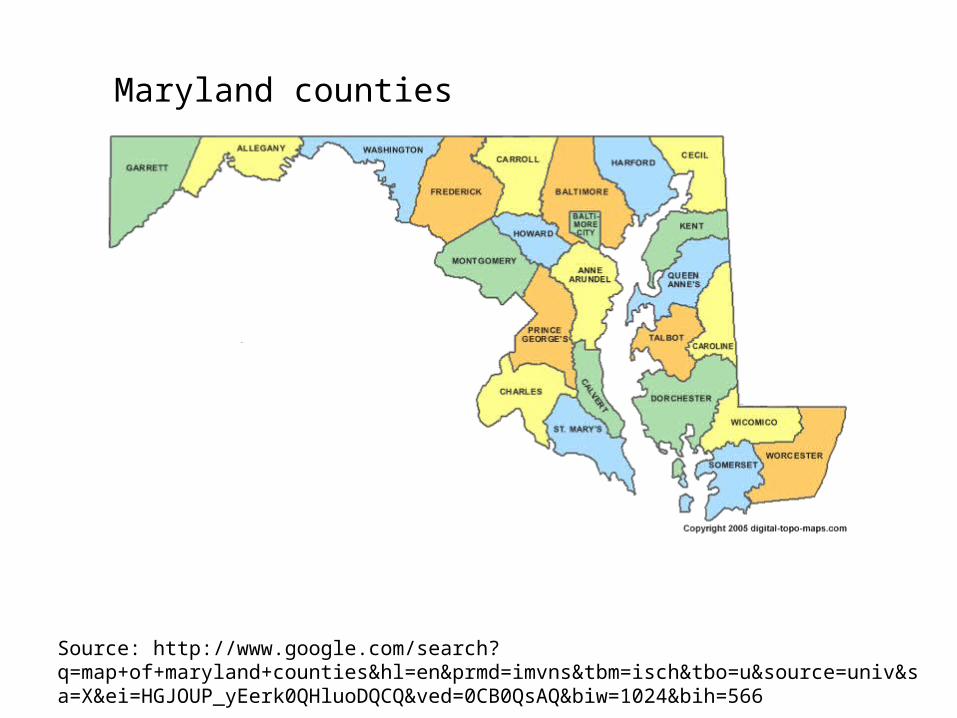
Maryland counties
Source: http://www.google.com/search?q=map+of+maryland+counties&hl=en&prmd=imvns&tbm=isch&tbo=u&source=univ&sa=X&ei=HGJOUP_yEerk0QHluoDQCQ&ved=0CB0QsAQ&biw=1024&bih=566
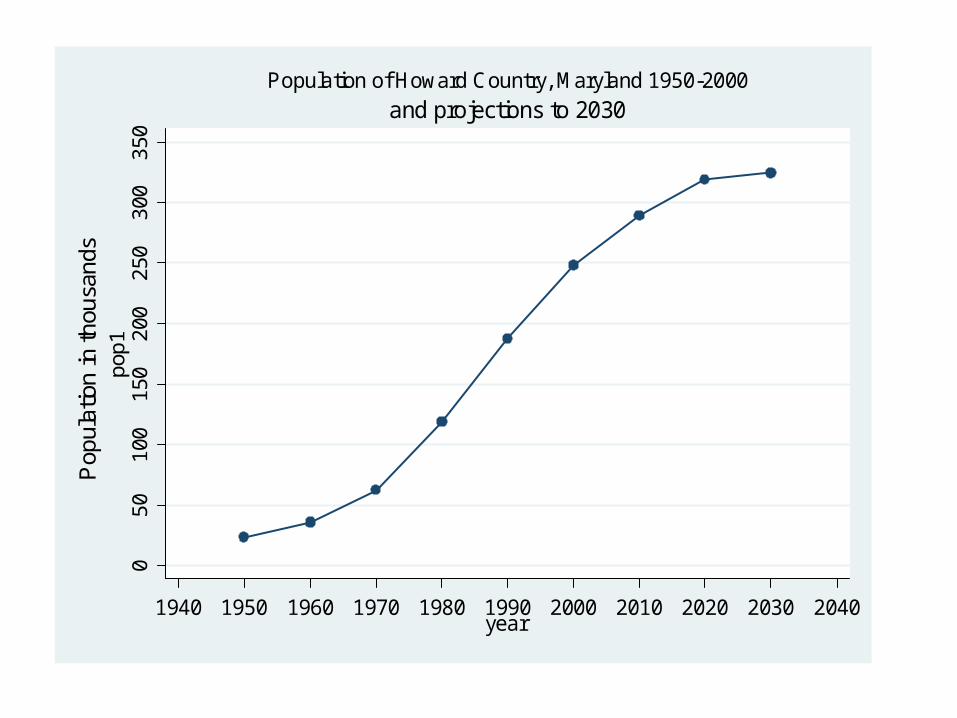
050
100
150
200
250
300
350
pop1
1940 1950 1960 1970 1980 1990 2000 2010 2020 2030 2040year
Pop
ulat
ion
in th
ousa
nds
and projections to 2030Population of Howard Country, Maryland 1950-2000
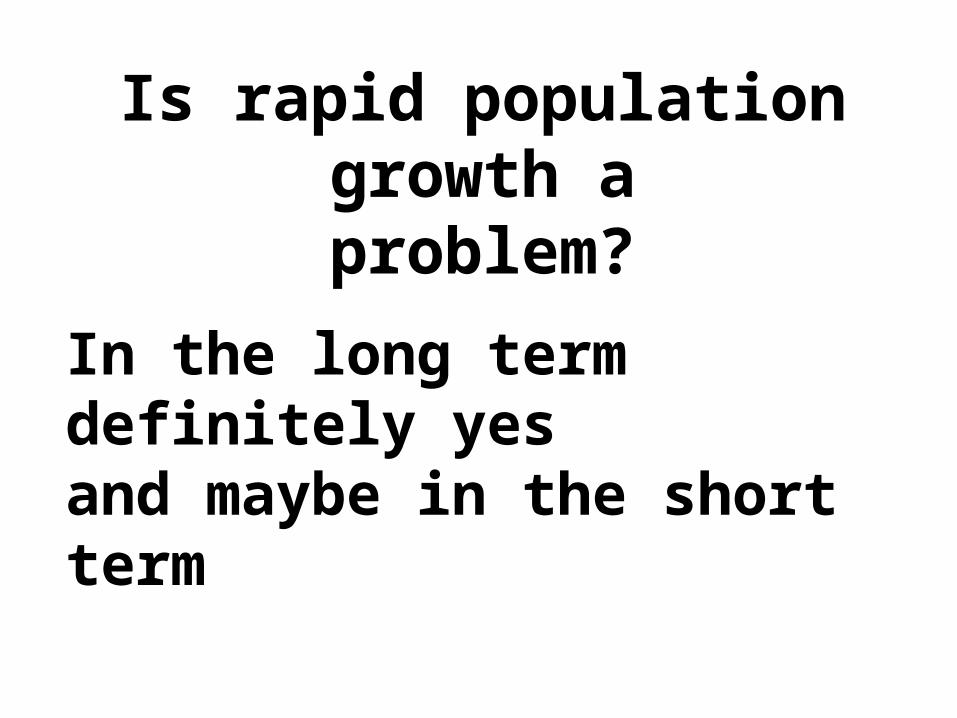
Is rapid population growth a
problem?
In the long term definitely yesand maybe in the short term
Is population decline a problem?
In the long term definitely yes, but in the short term not necessarily

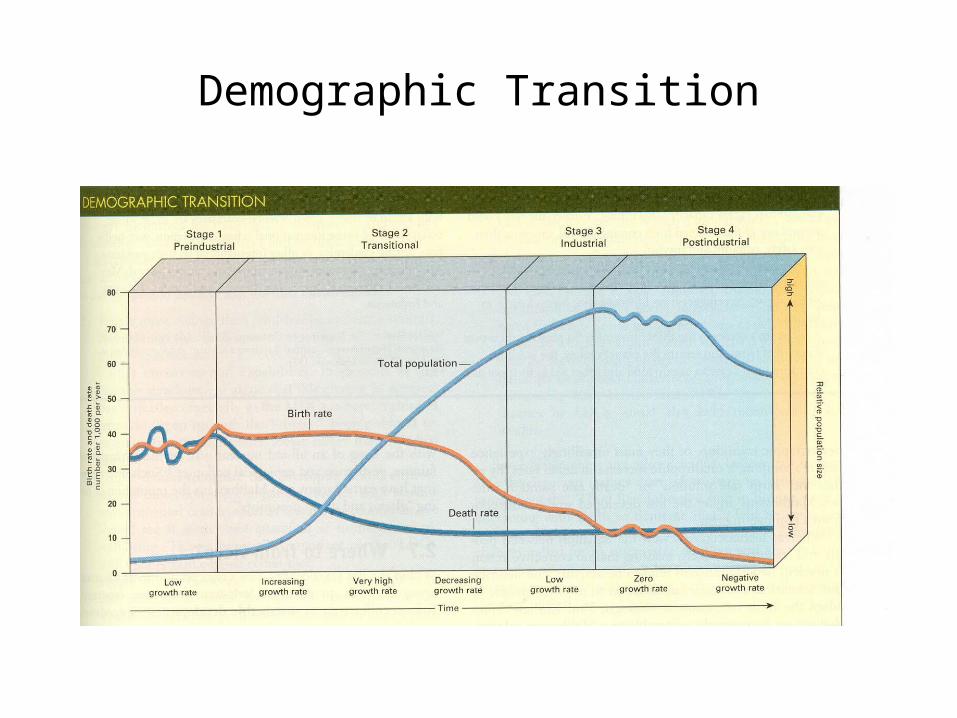
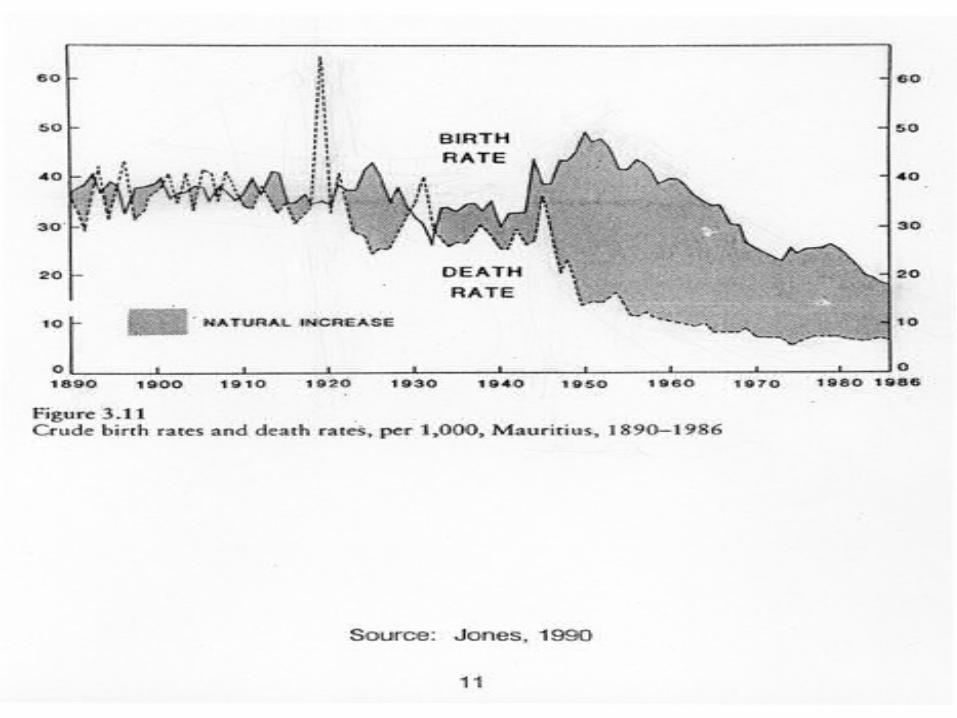
Demographic Transition
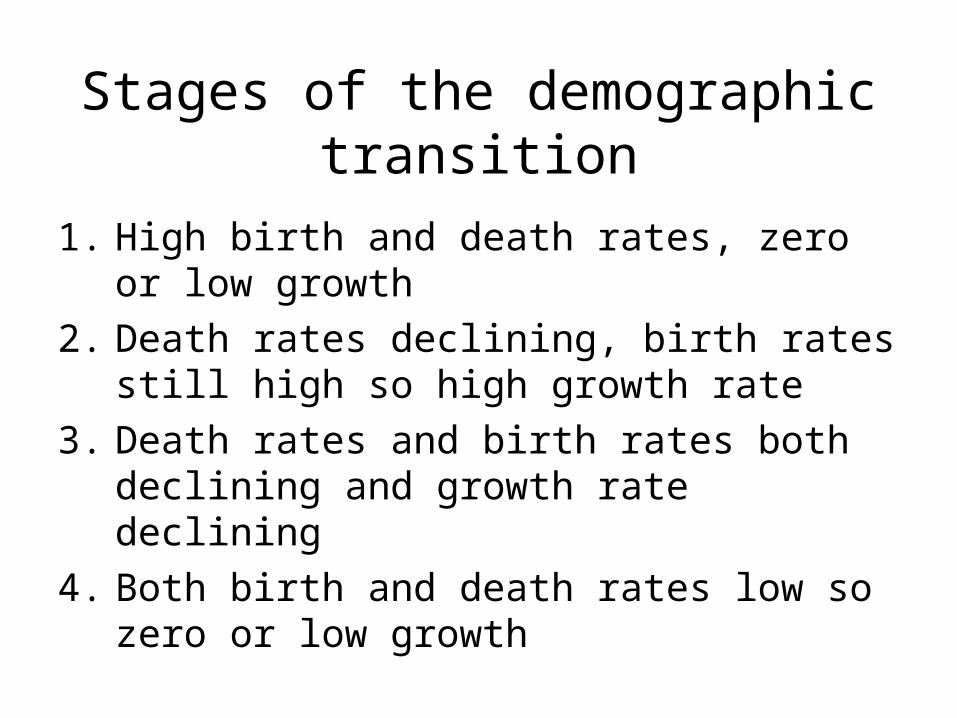
Stages of the demographic transition
1. High birth and death rates, zero or low growth
2. Death rates declining, birth rates still high so high growth rate
3. Death rates and birth rates both declining and growth rate declining
4. Both birth and death rates low so zero or low growth
Demographic Transition
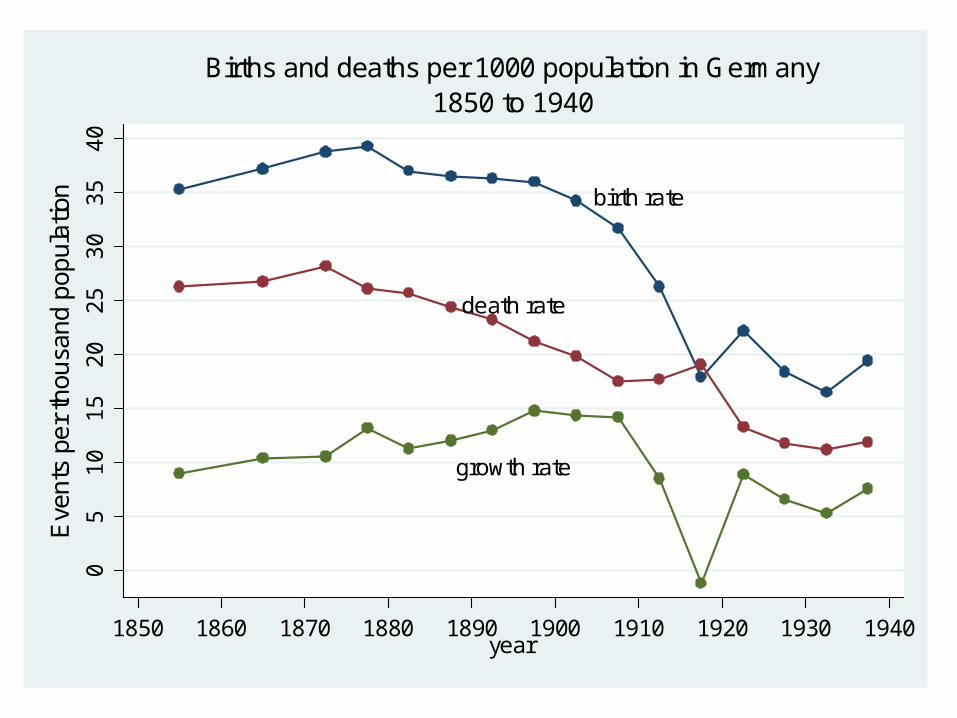
birth rate
growth rate
death rate
05
10
15
20
25
30
35
40
1850 1860 1870 1880 1890 1900 1910 1920 1930 1940year
Eve
nts
pe
r th
ousa
nd
pop
ula
tion
1850 to 1940Births and deaths per 1000 population in Germany
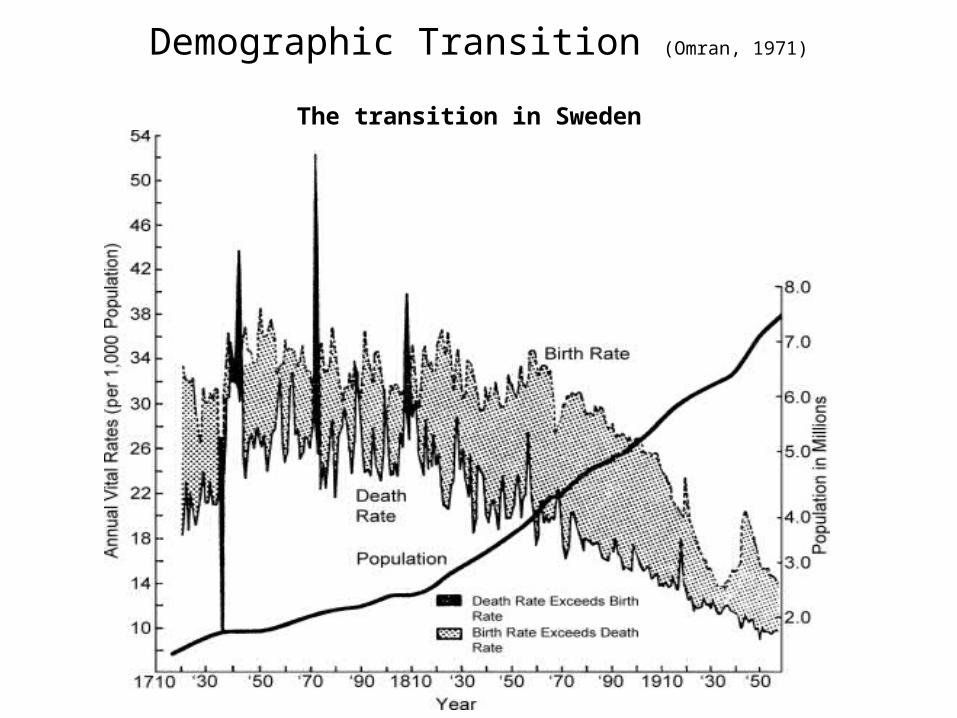
Demographic Transition (Omran, 1971)
The transition in Sweden
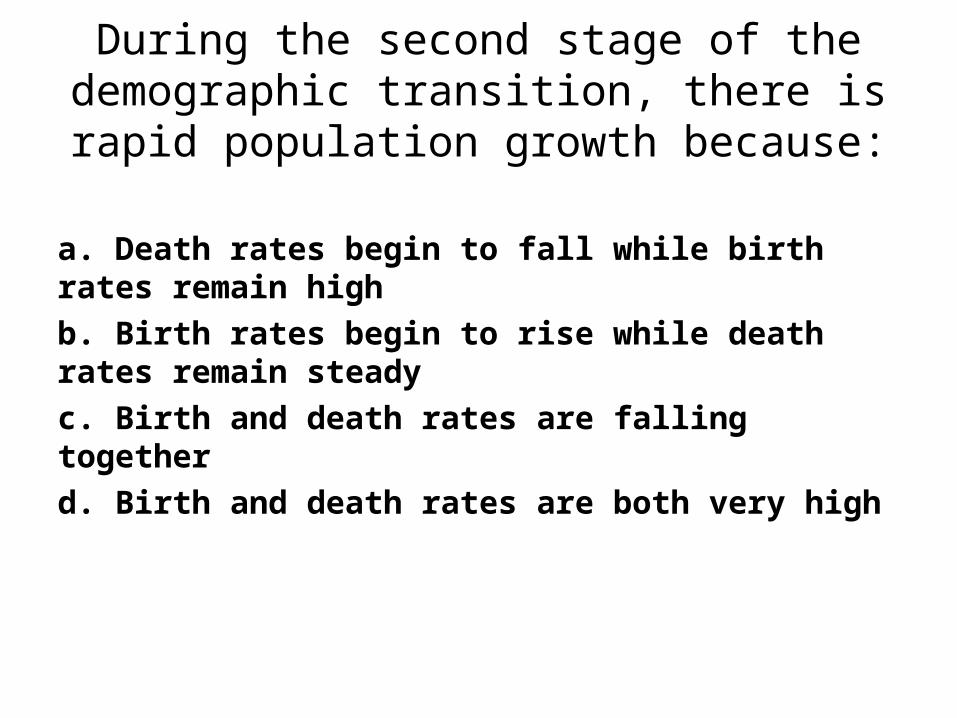
During the second stage of the demographic transition, there is rapid population growth
because:
a. Death rates begin to fall while birth rates remain high
b. Birth rates begin to rise while death rates remain steady
c. Birth and death rates are falling together
d. Birth and death rates are both very high
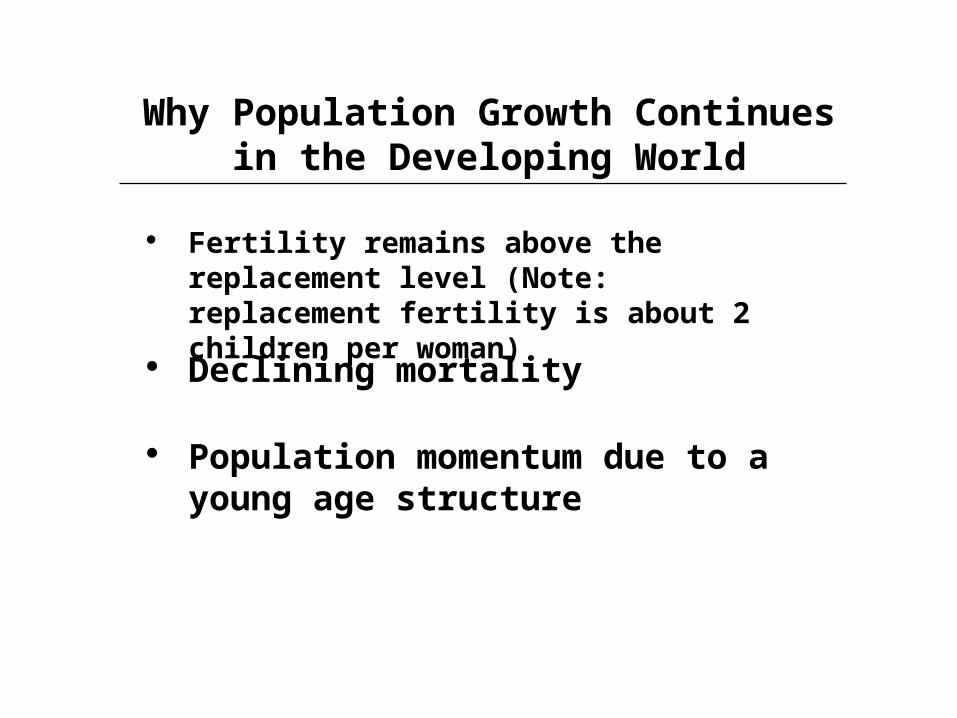
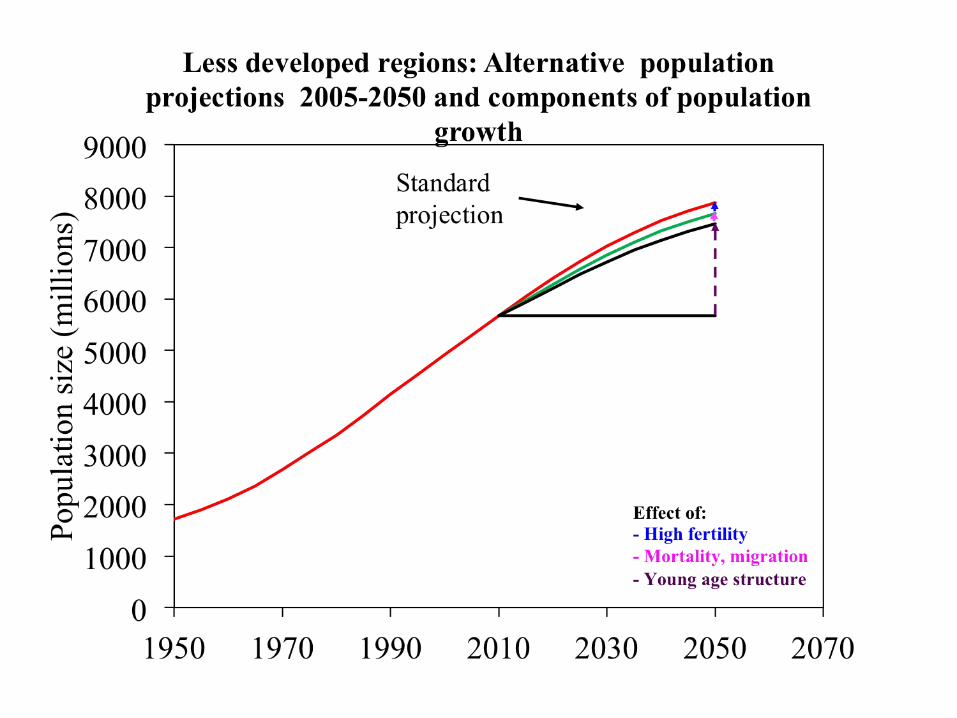
Why Population Growth Continues in the Developing World
Fertility remains above the replacement level (Note: replacement fertility is about 2 children per woman)
Declining mortality
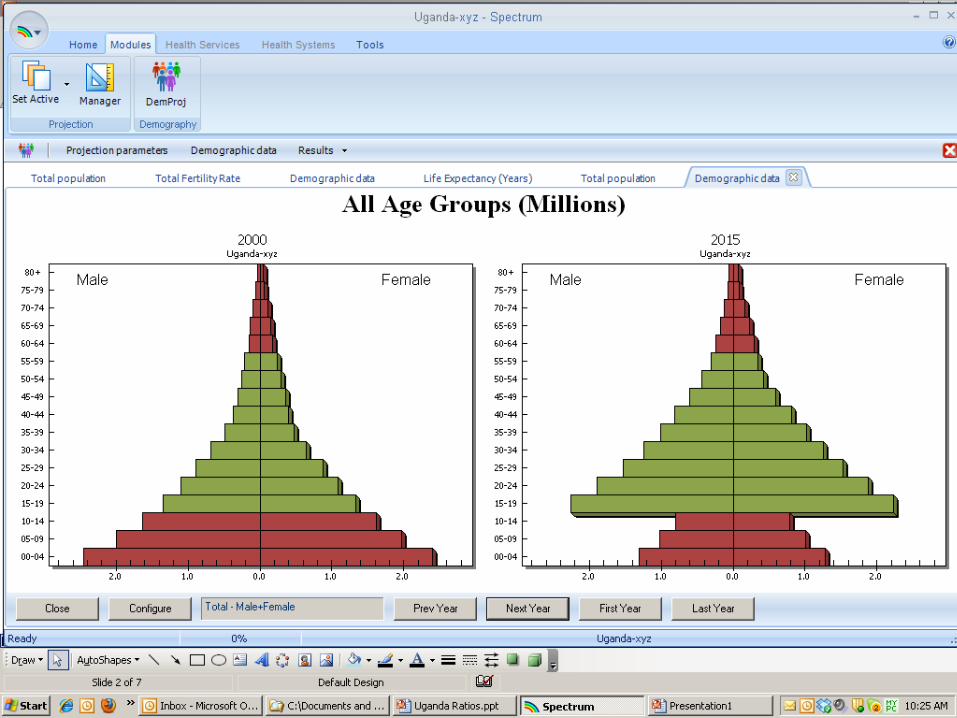
Population momentum due to a young age structure

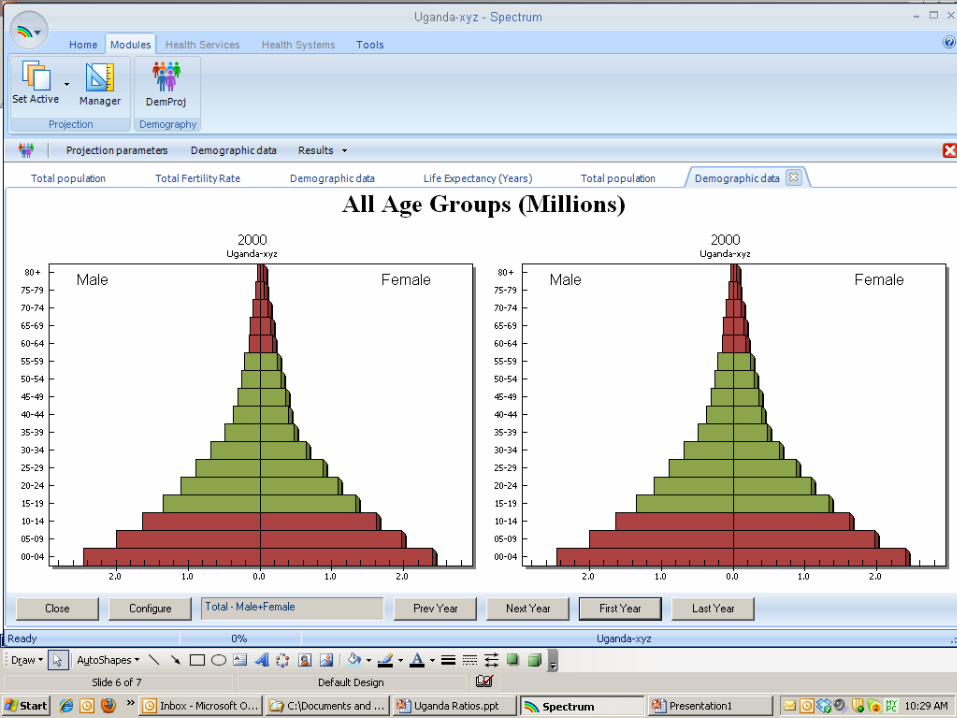
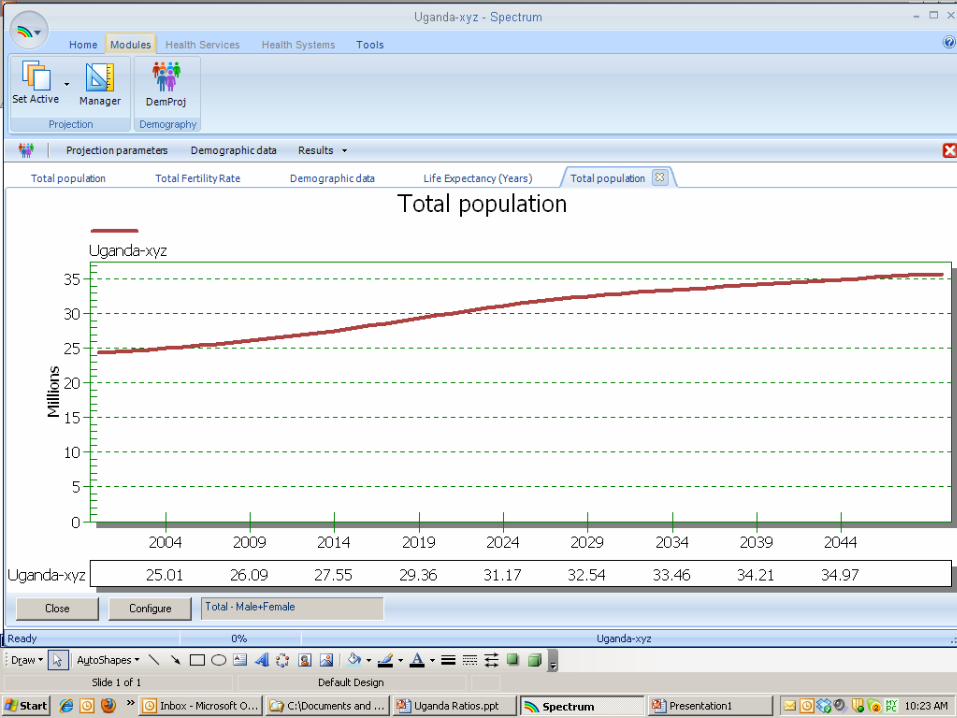
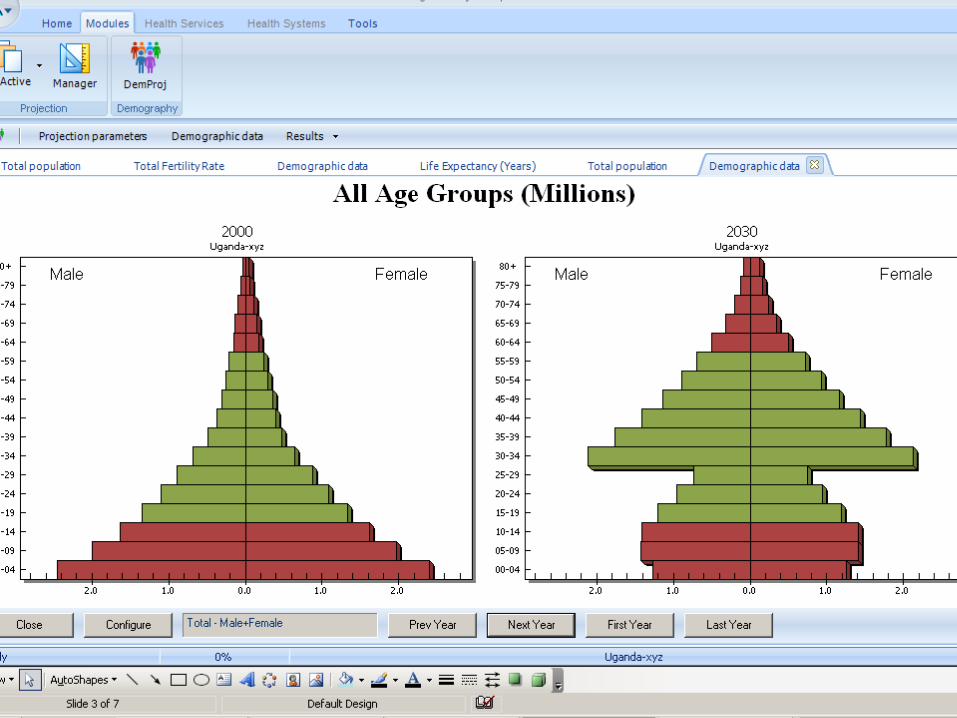
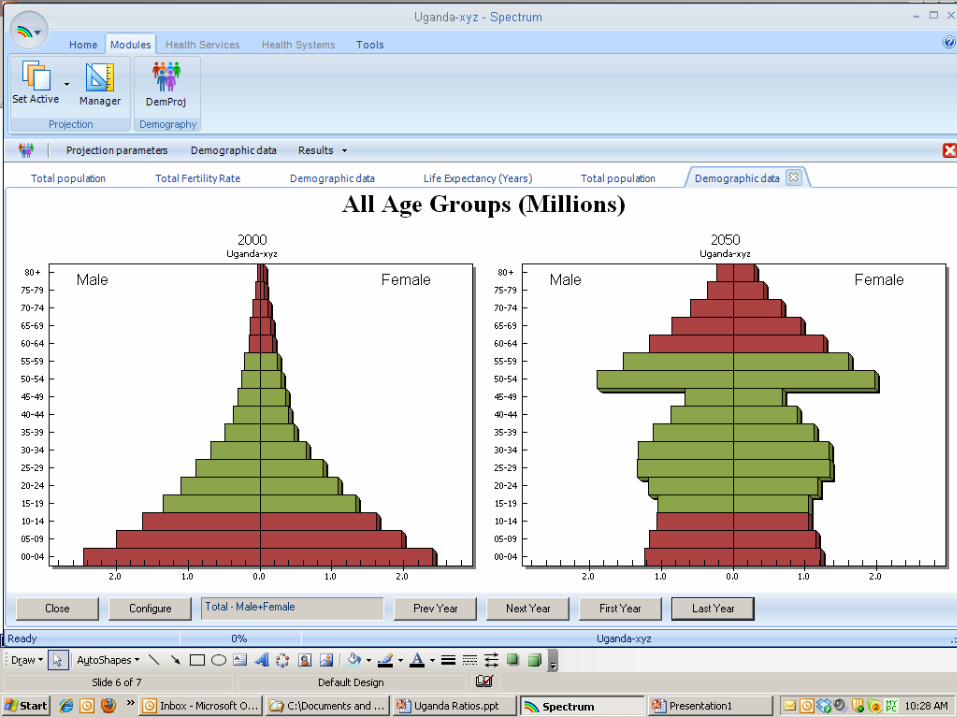
Population momentum
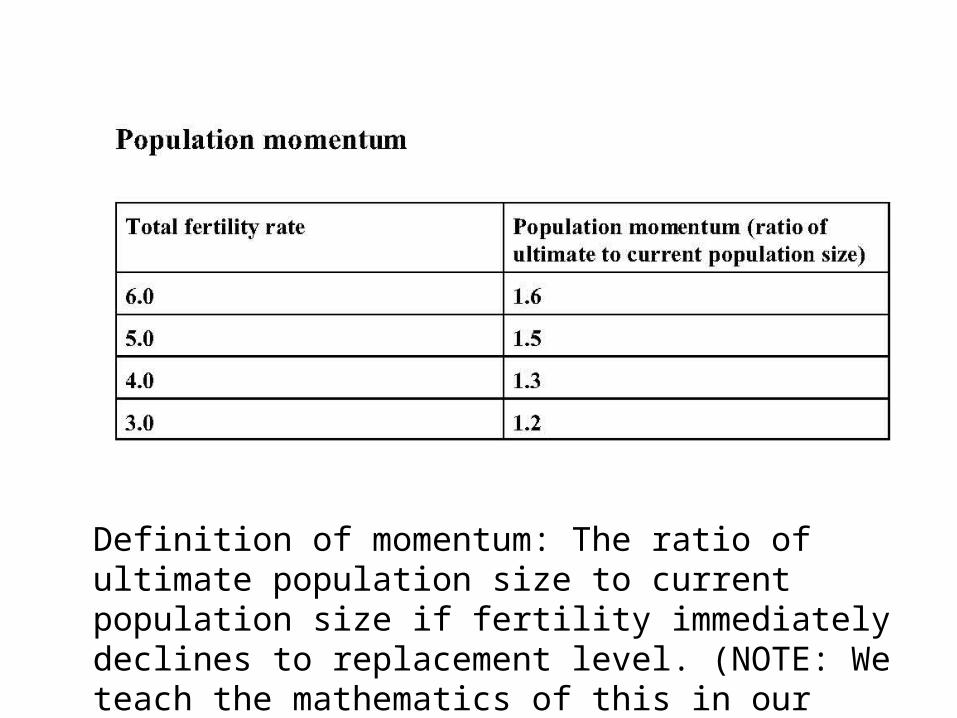
Definition of momentum: The ratio of ultimate population size to current population size if fertility immediately declines to replacement level. (NOTE: We teach the mathematics of this in our advanced demographic methods course at JHSPH)
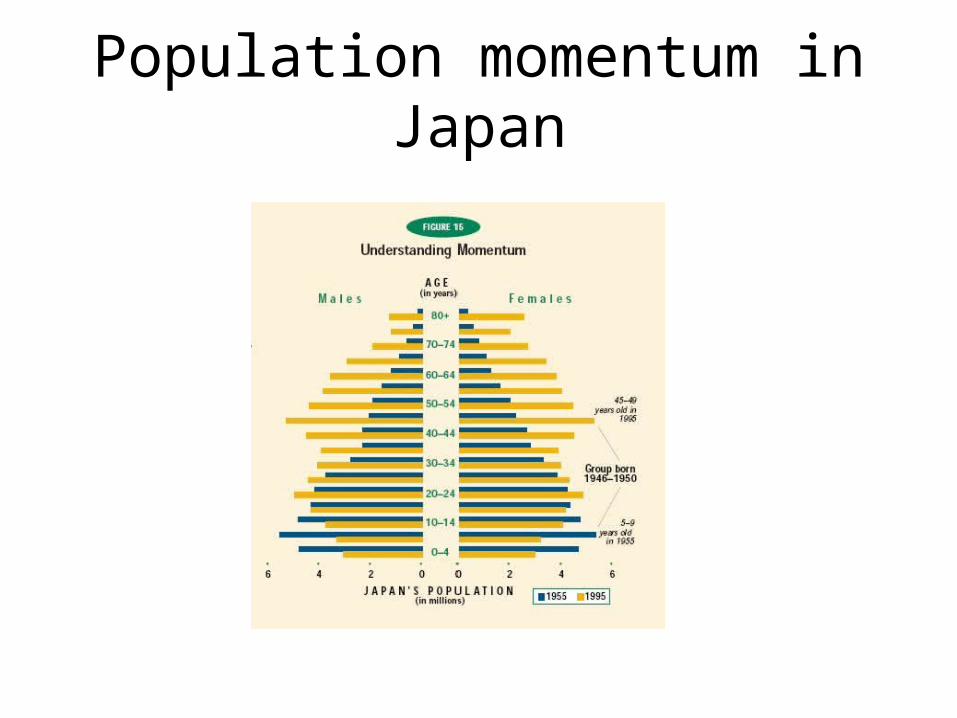
Population momentum in Japan
Population Momentum
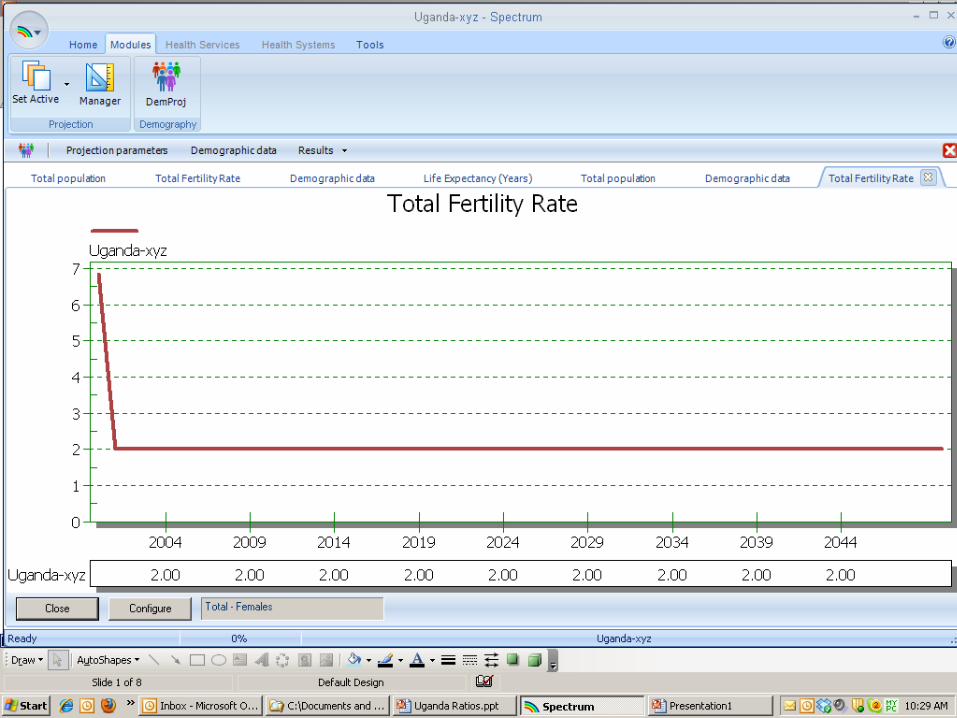
Uganda Example
(Source: Spectrum program)
From colleague Pf Mosley

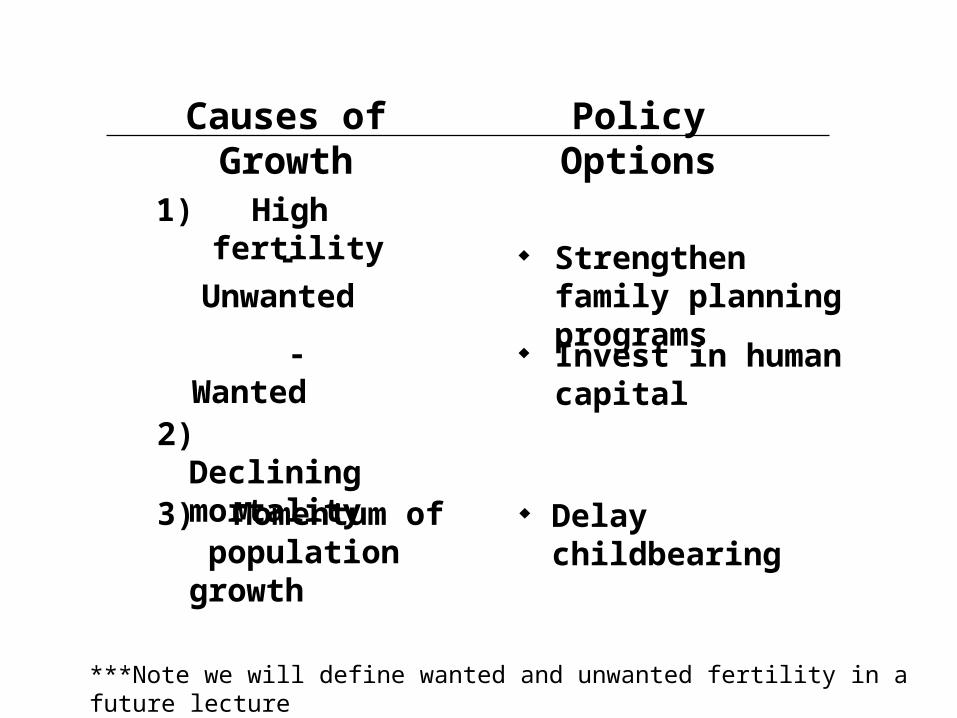
1) High fertility Strengthen family
planning programs
Causes of Growth
Policy Options
2) Declining mortality
3) Momentum of population growth
Delay childbearing
Invest in human capital
- Wanted
- Unwanted
***Note we will define wanted and unwanted fertility in a future lecture
Another way to counteract the effect of momentum:
Below replacement fertility
e.g. one child family norm

Age composition changes
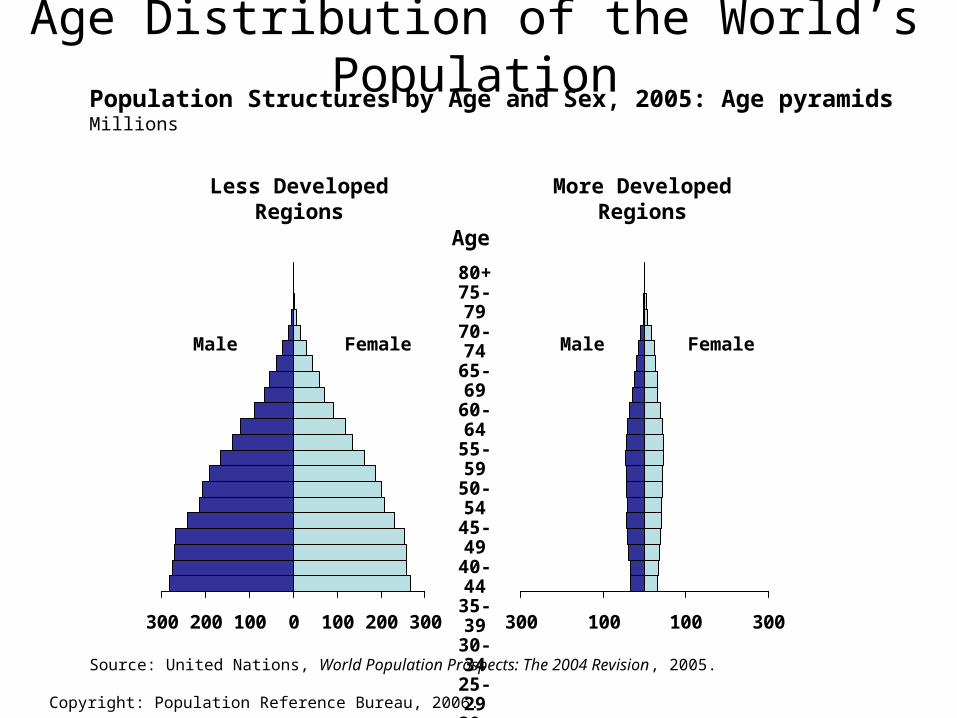
Population Structures by Age and Sex, 2005: Age pyramidsMillions
300 100 100 300300 200 100 0 100 200 300
Less Developed Regions
More Developed Regions
Male Female Male Female
80+ 75-79 70-74 65-69 60-64 55-59 50-54 45-49 40-44 35-39 30-34 25-29 20-24 15-19 10-14
5-90-4
Age
Source: United Nations, World Population Prospects: The 2004 Revision, 2005.
Age Distribution of the World’s Population
Copyright: Population Reference Bureau, 2006.
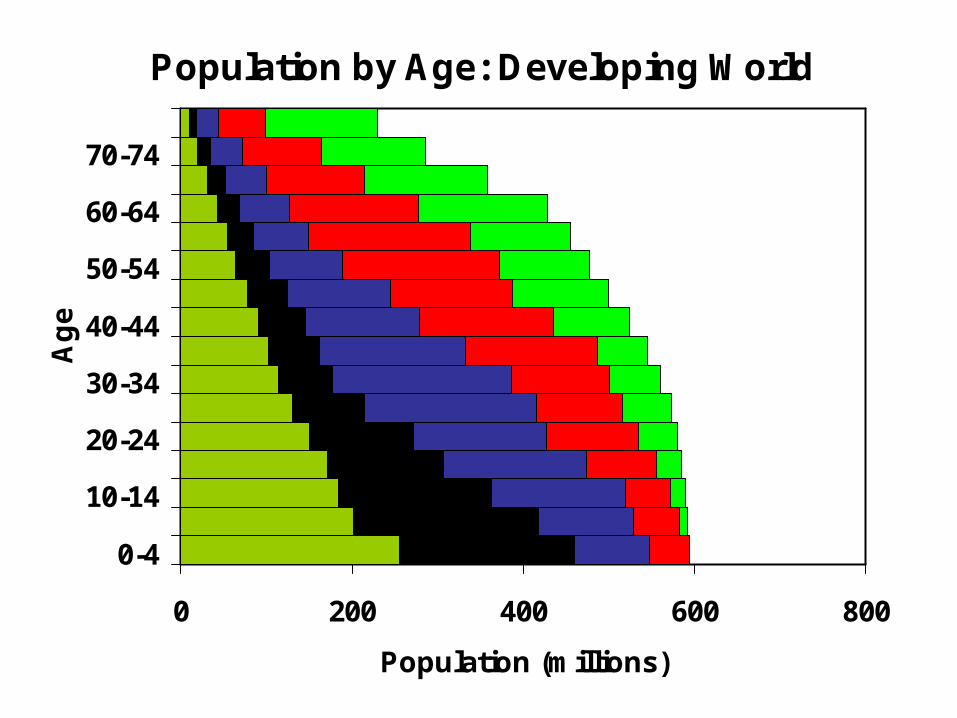
Population by Age: Developing World
0 200 400 600 800
0-4
10-14
20-24
30-34
40-44
50-54
60-64
70-74
Ag
e
Population (millions)Source: United Nations 2001
1950 1975 2000 2025 2050

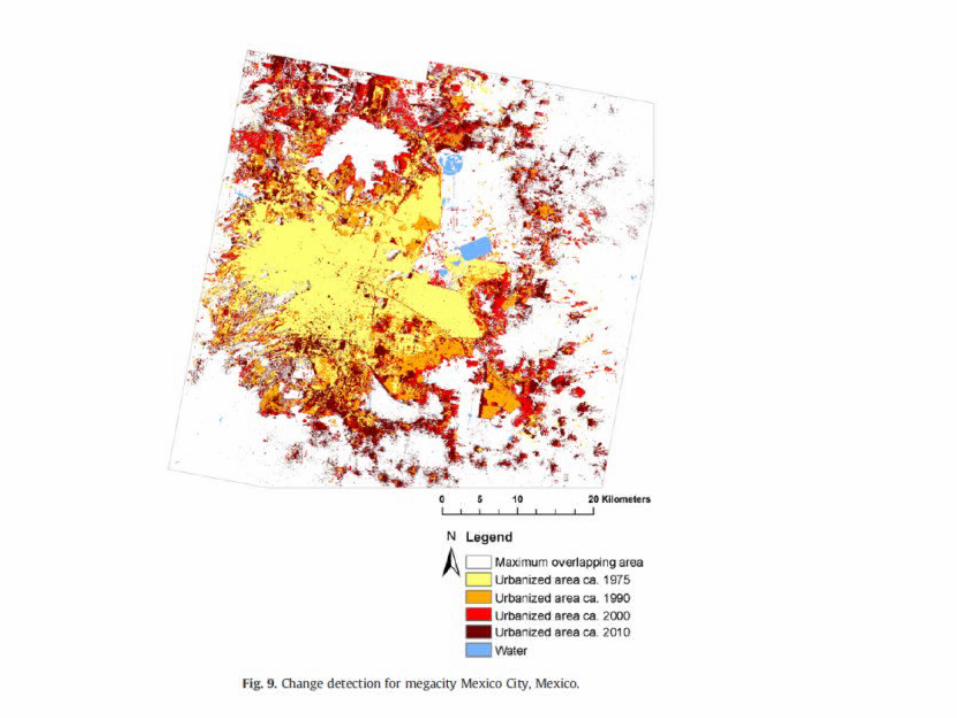
Urbanization

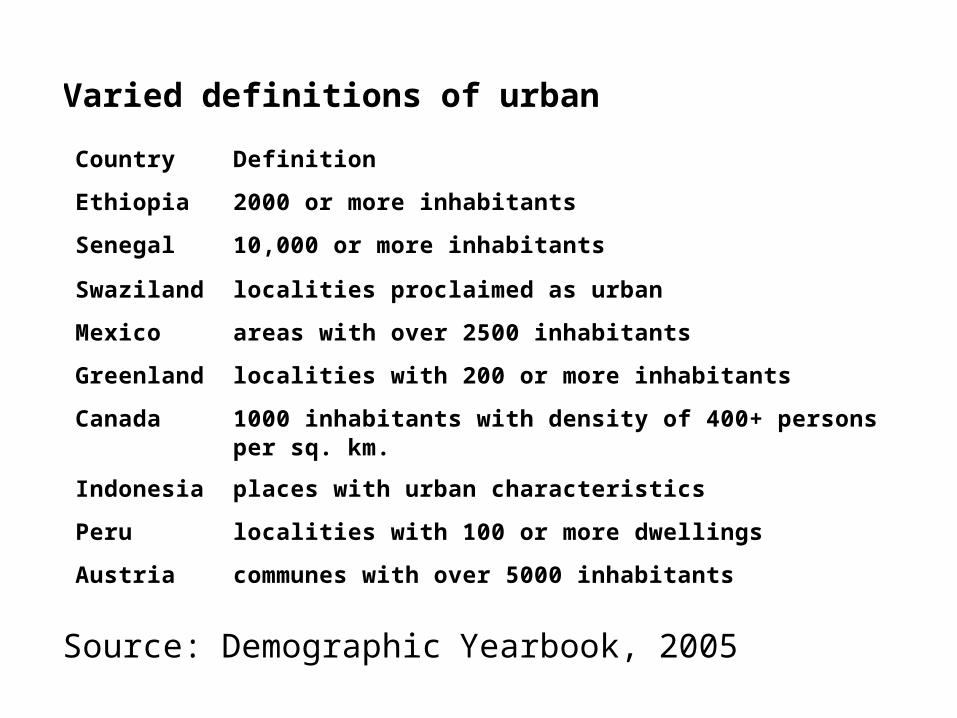
Varied definitions of urban
Country Definition
Ethiopia 2000 or more inhabitants
Senegal 10,000 or more inhabitants
Swaziland localities proclaimed as urban
Mexico areas with over 2500 inhabitants
Greenland localities with 200 or more inhabitants
Canada 1000 inhabitants with density of 400+ personsper sq. km.
Indonesia places with urban characteristics
Peru localities with 100 or more dwellings
Austria communes with over 5000 inhabitants
Source: Demographic Yearbook, 2005

Can you name the 5 largest urban agglomerations:
In 1950?In 2015?
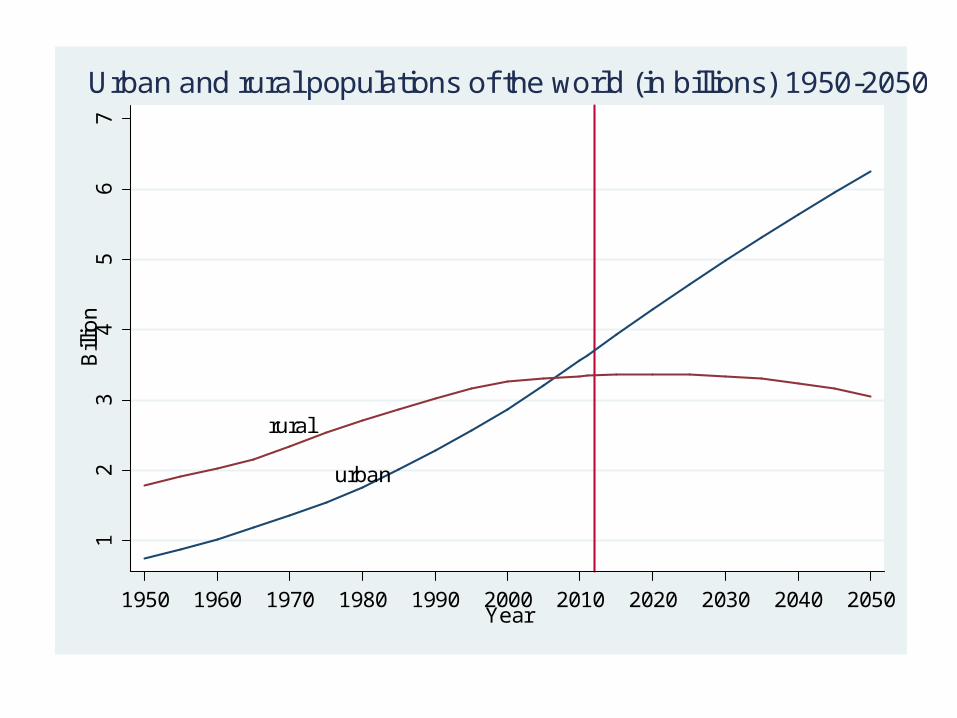
urban
rural
12
34
56
7B
illio
n
1950 1960 1970 1980 1990 2000 2010 2020 2030 2040 2050Year
Urban and rural populations of the world (in billions) 1950-2050
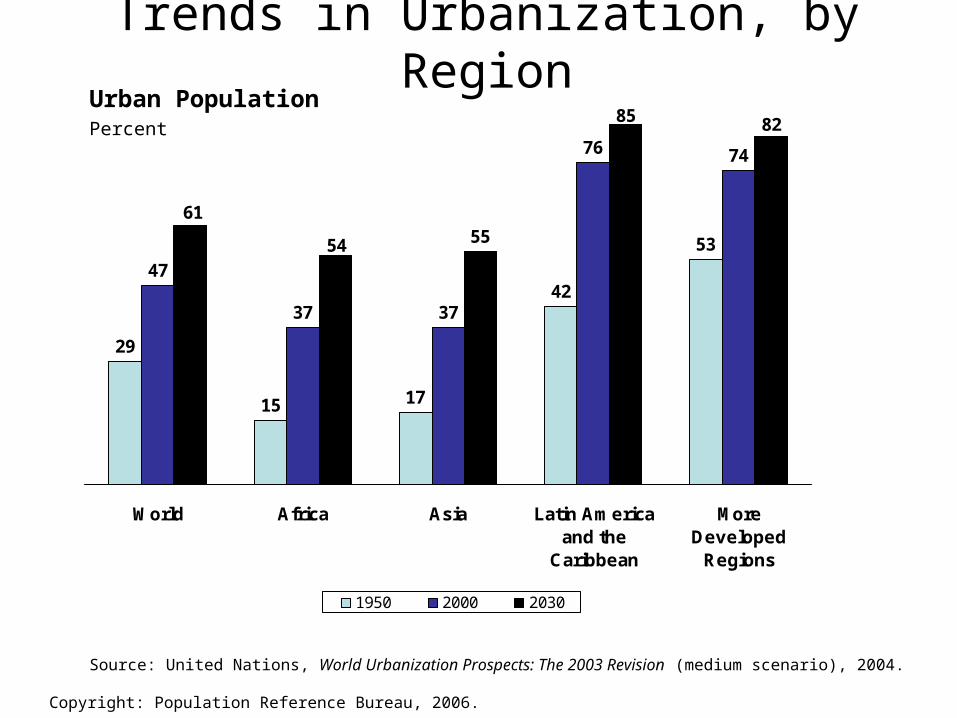
Urban PopulationPercent
29
15 17
53
47
37 37
76
55
42
74
85
54
61
82
World Africa Asia Latin Americaand the
Caribbean
MoreDeveloped
Regions
1950 2000 2030
Source: United Nations, World Urbanization Prospects: The 2003 Revision (medium scenario), 2004.
Trends in Urbanization, by Region
Copyright: Population Reference Bureau, 2006.
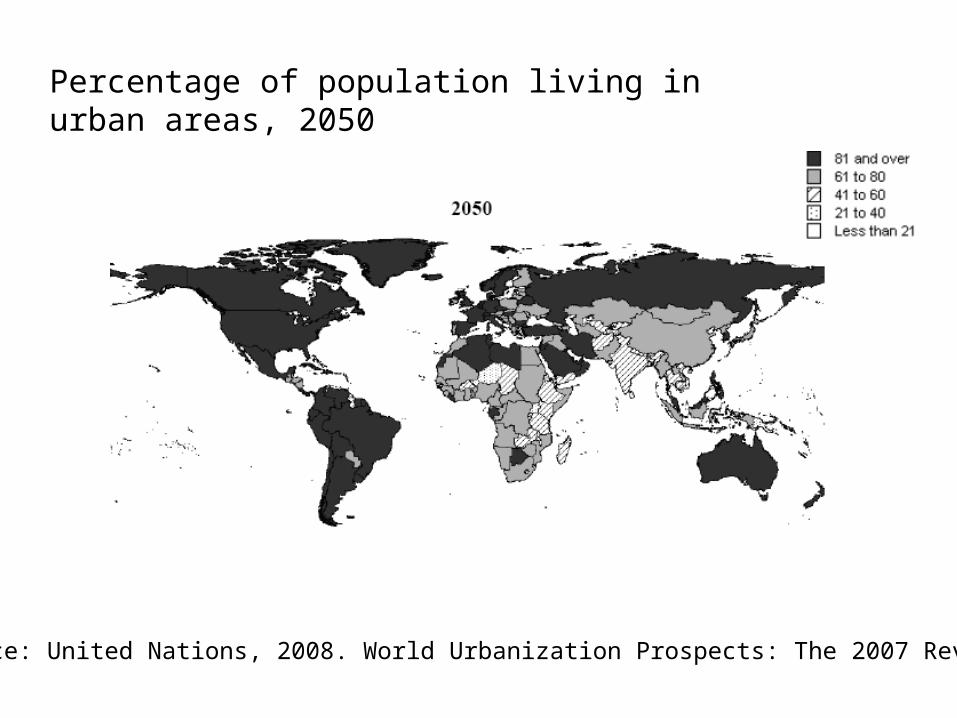
Source: United Nations, 2008. World Urbanization Prospects: The 2007 Revision
Percentage of population living in urban areas, 2050

Population and Development
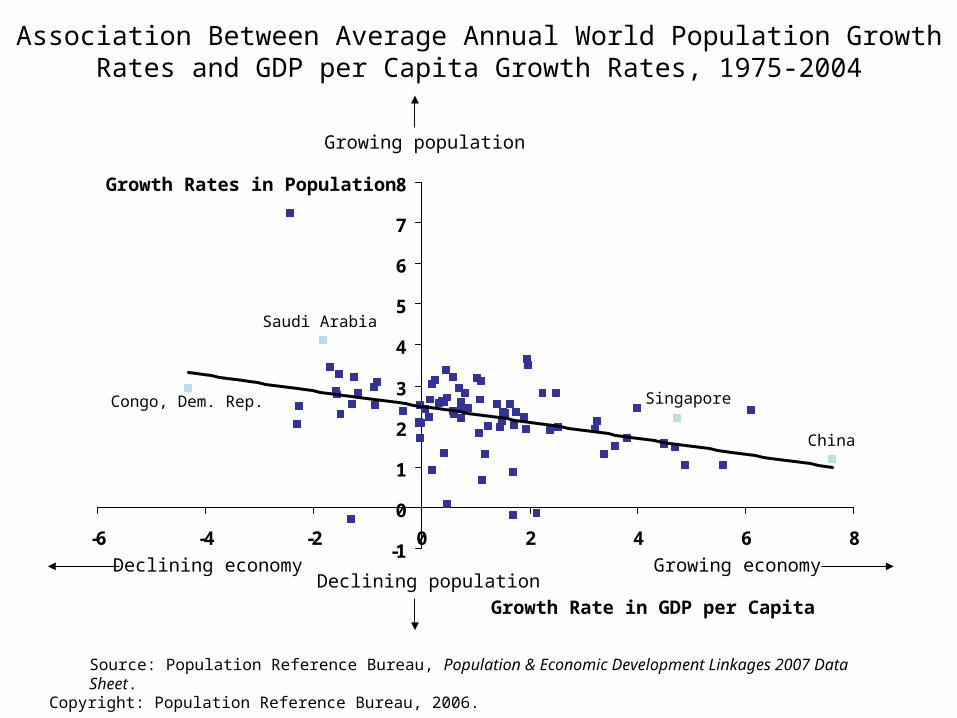
Association Between Average Annual World Population Growth Rates and GDP per Capita Growth Rates, 1975-2004
-1
0
1
2
3
4
5
6
7
8
-6 -4 -2 0 2 4 6 8
Growth Rates in Population
Source: Population Reference Bureau, Population & Economic Development Linkages 2007 Data Sheet.
Growth Rate in GDP per Capita
Growing population
Growing economyDeclining population
Declining economy
China
SingaporeCongo, Dem. Rep.
Saudi Arabia
Copyright: Population Reference Bureau, 2006.
• Globally, a higher rate of population growth is associated with a lower rate of economic growth, but the association varies across regions and income levels and it was the reverse association in the 1970s and 1980s.
Copyright: Population Reference Bureau, 2006.
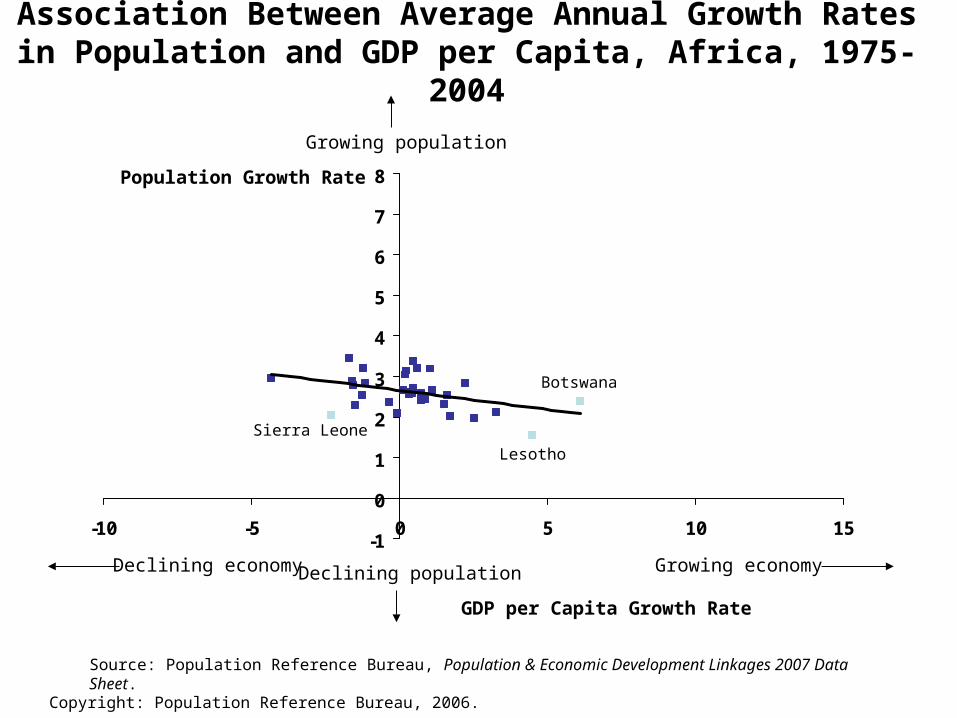
Association Between Average Annual Growth Rates in Population and GDP per Capita, Africa, 1975-2004
-1
0
1
2
3
4
5
6
7
8
-10 -5 0 5 10 15
Population Growth Rate
Source: Population Reference Bureau, Population & Economic Development Linkages 2007 Data Sheet.
GDP per Capita Growth Rate
Growing population
Growing economyDeclining populationDeclining economy
Botswana
Lesotho
Sierra Leone
Copyright: Population Reference Bureau, 2006.
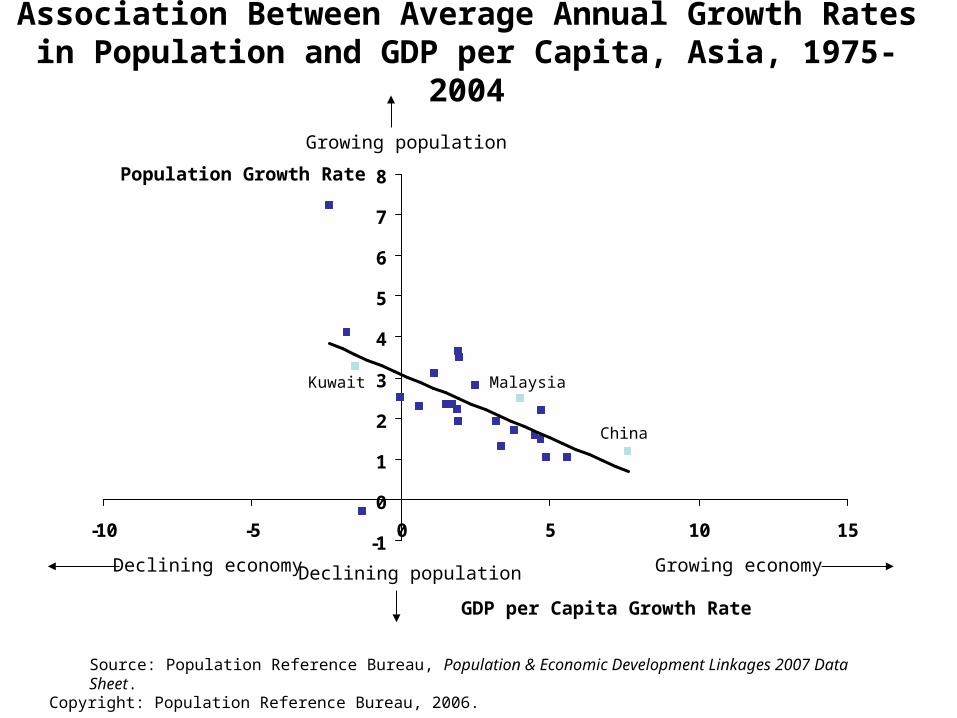
Association Between Average Annual Growth Rates in Population and GDP per Capita, Asia, 1975-2004
-1
0
1
2
3
4
5
6
7
8
-10 -5 0 5 10 15
Population Growth Rate
Source: Population Reference Bureau, Population & Economic Development Linkages 2007 Data Sheet.
GDP per Capita Growth Rate
Growing population
Growing economyDeclining populationDeclining economy
China
Kuwait Malaysia
Copyright: Population Reference Bureau, 2006.
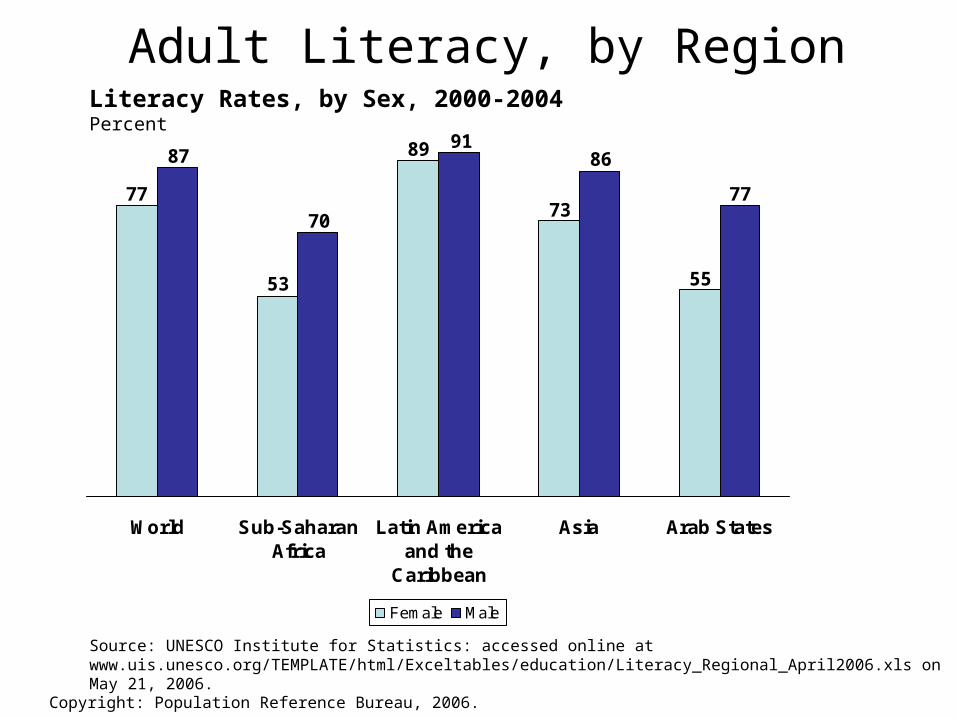
Literacy Rates, by Sex, 2000-2004Percent
77
53
89
73
55
87
70
9186
77
World Sub-SaharanAfrica
Latin Americaand the
Caribbean
Asia Arab States
Female Male
Source: UNESCO Institute for Statistics: accessed online at www.uis.unesco.org/TEMPLATE/html/Exceltables/education/Literacy_Regional_April2006.xls on May 21, 2006.
Adult Literacy, by Region
Copyright: Population Reference Bureau, 2006.
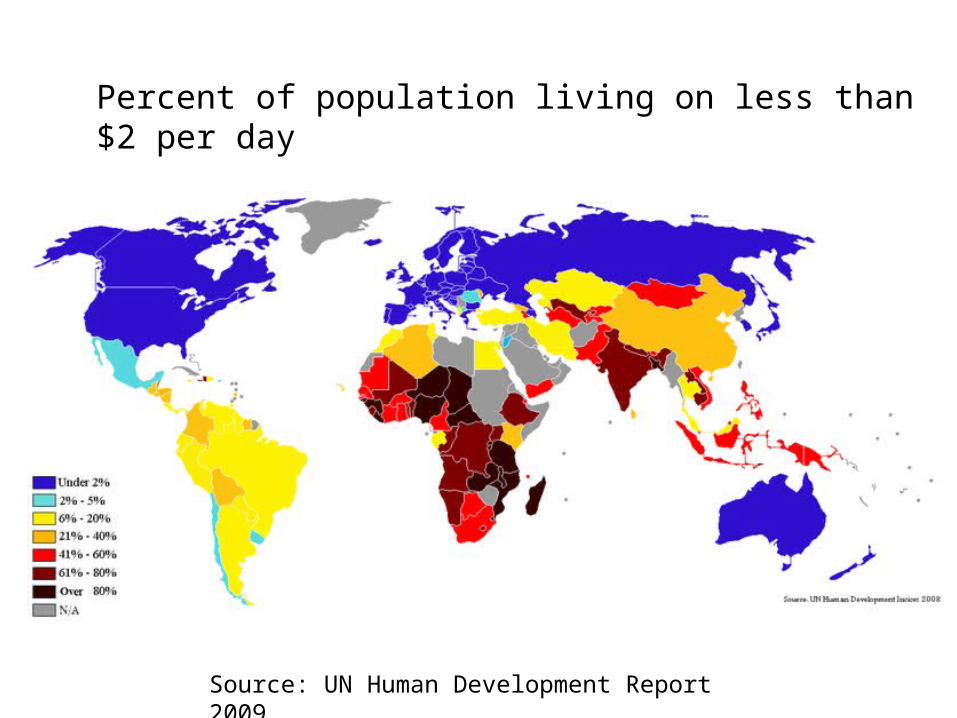
Percent of population living on less than $2 per day
Source: UN Human Development Report 2009
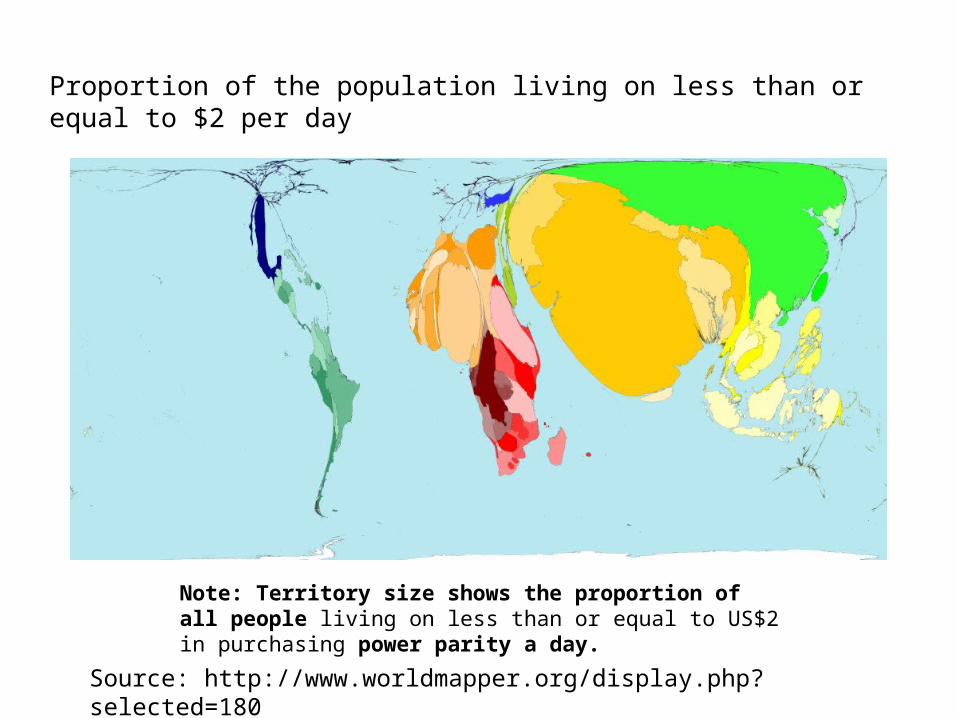
Note: Territory size shows the proportion of all people living on less than or equal to US$2 in purchasing power parity a day.
Proportion of the population living on less than or equal to $2 per day
Source: http://www.worldmapper.org/display.php?selected=180
Questions/Things to know
In what region do most of the people of the world live?
Which region has the highest population growth rate?
What is the world population size in 2014?About how many people are added to the
planet each year?What is the bookkeeping equation of
population change?
Questions (cont.)
What is the simple rule to find doubling time given the rate of growth?
Name two countries in the top 5 with highest rate of natural increase
Name two countries in the top 5 with lowest rate of natural increase
Approximately how much is the US population growing each year?
About what proportion of US growth is due to immigration?
Questions (cont.)
What are the 4 stages of the demographic transition?
Why is population momentum an important concept for countries concerned about population growth in the future?
Name two of the largest cities (urban agglomerations) in the world in 1950. In 2010?
Recommended