Learning from the Stroke
PathwayPrinciples for Success
Damian Jenkinson

30 Day Stroke Mortality Over Time
SINAP = Stroke Improvement National Audit ProgrammeSSNAP = Sentinel Stroke National Audit Programme
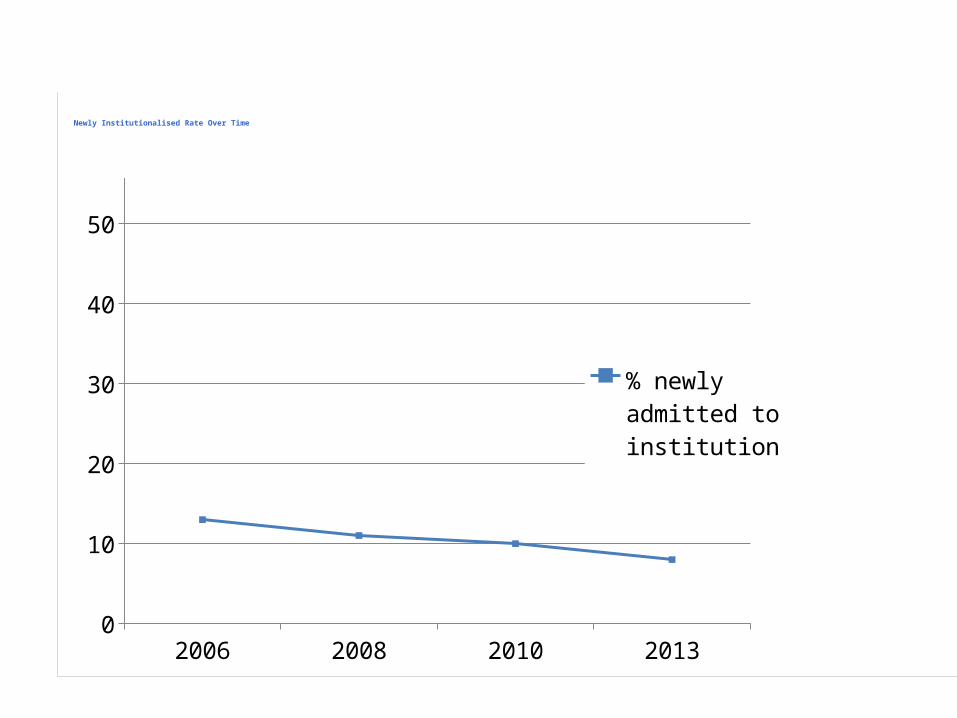
2006 2008 2010 20130
10
20
30
40
50
60
70
80
90
100 % newly admitted to institution
% newly admit-ted to institution
Newly Institutionalised Rate Over Time
BbbbbbbbbbbbbbbbbbbbbbbbbbbbbbbbbbbbbbbbbbbbbbbbbbbbbbbbbNnnnnnnnnnnnnnnnbbbbbbbbbbbbbb

2004 2006 2008 2010 2013 20140
10
20
30
40
50
60
70
80
90
100
% admitted SUSU within 4h90% on SUBrain scan <24h
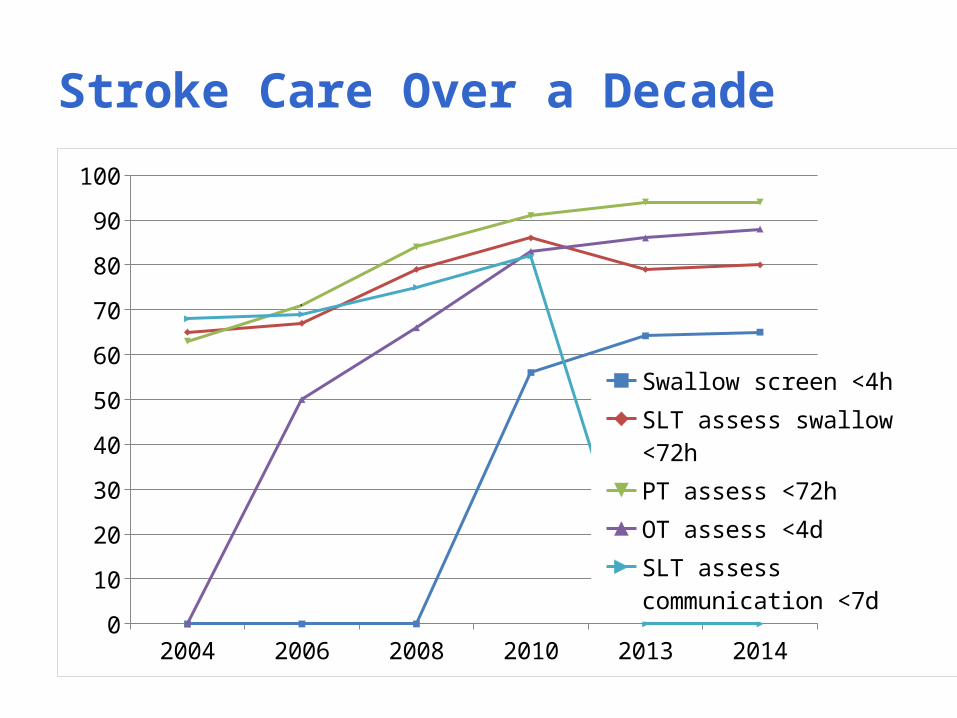
Stroke Care Over a Decade
2004 2006 2008 2010 2013 20140
10
20
30
40
50
60
70
80
90
100
Swallow screen <4h
SLT assess swallow <72h
PT assess <72h
OT assess <4d
SLT assess communication <7d
Stroke Care Over a Decade
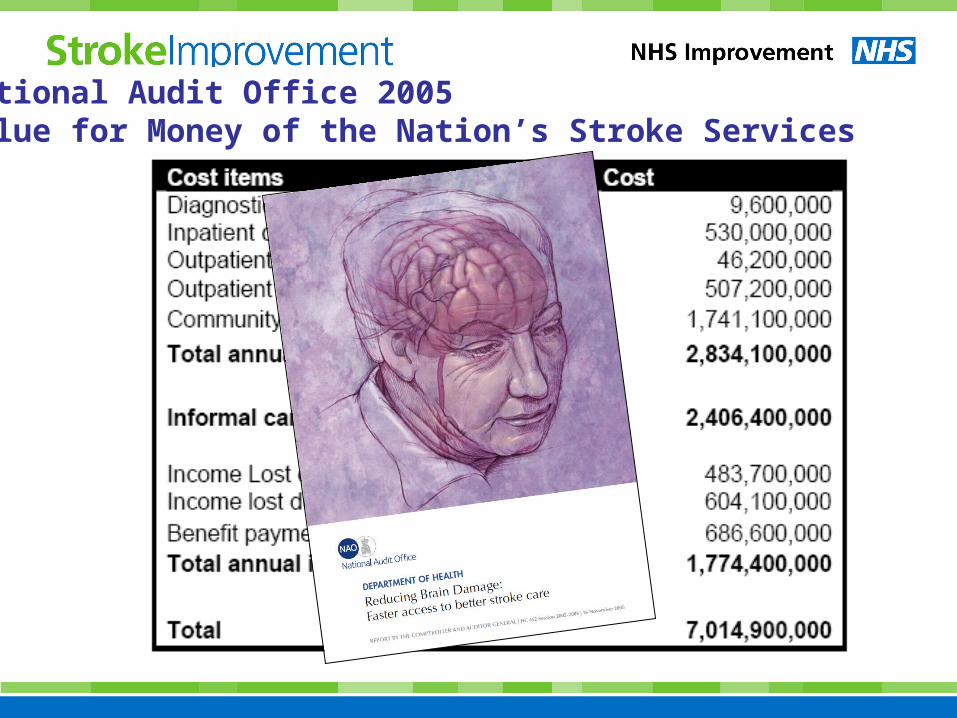
National Audit Office 2005Value for Money of the Nation’s Stroke Services

A Comprehensive Stroke Service
C) Includes:i. Hyper-acute servicesii. Acute services (including in-
hospital rehabilitation)iii. TIA servicesiv. Tertiary care services e.g.
Vascular and neuro-surgery
D) Includes:i. Early Supported
Discharge (ESD)ii. Stroke specialist
community rehabilitation
E) Includes:i. Follow up
i. 6 weeksii. 6 monthsiii. Annually
ii. Integrated health and social care team plan
Research
Information
Patient, public and carer involvement
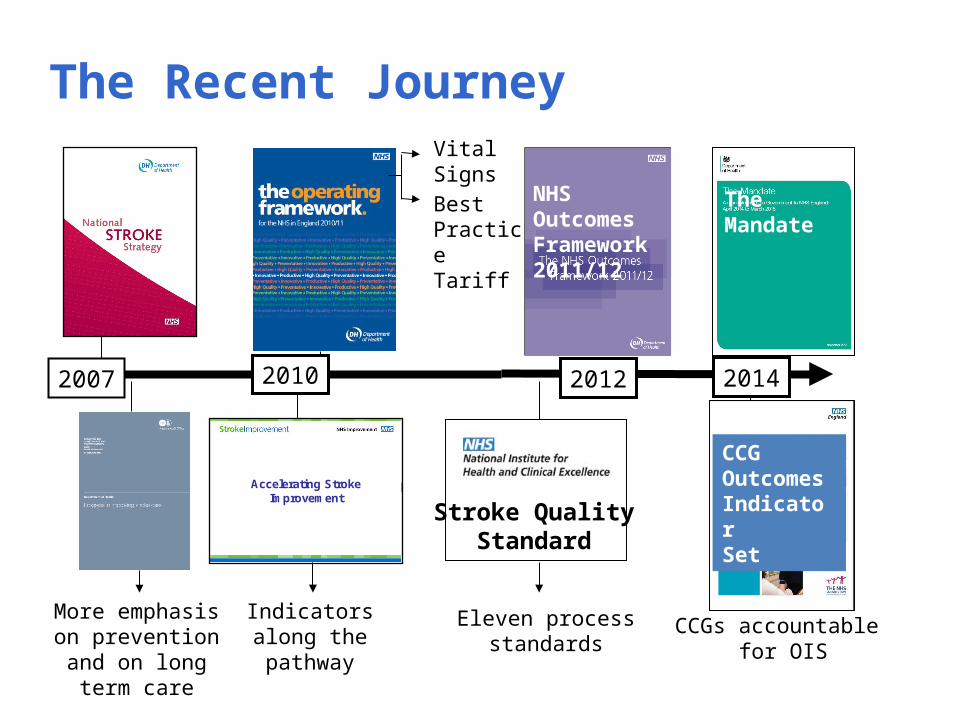
The Recent Journey
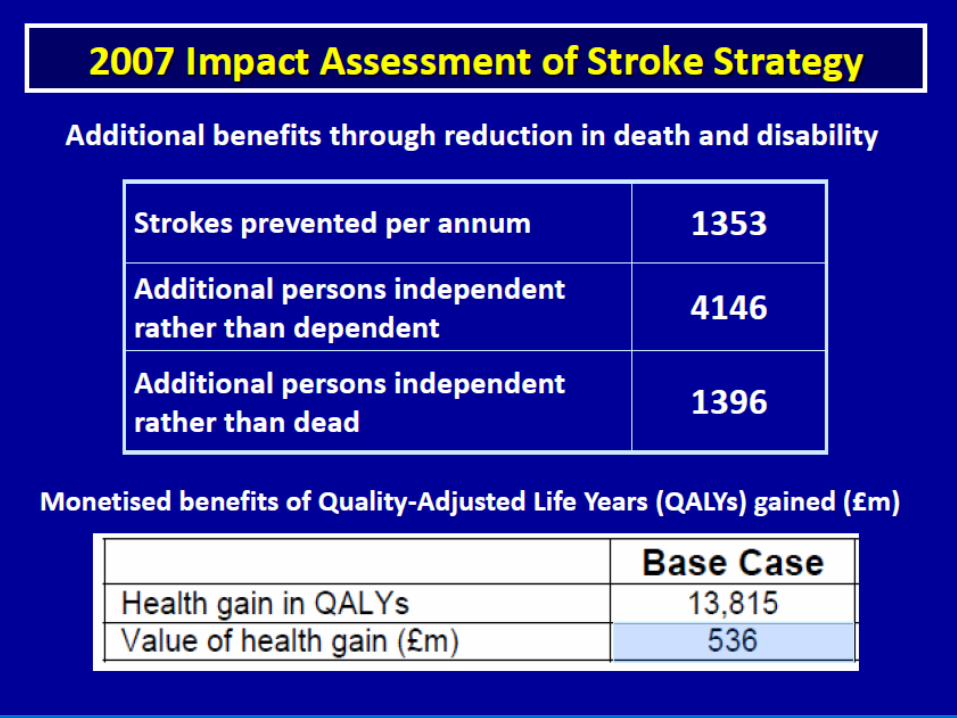
2007
Accelerating Stroke Improvement
Stroke QualityStandard
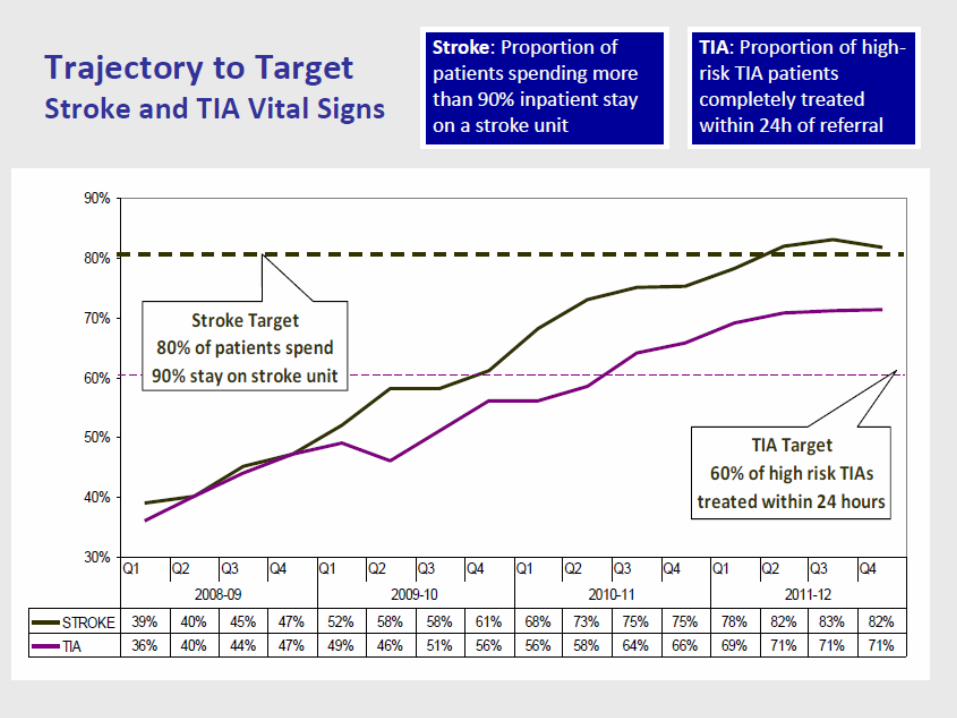
Vital Signs
Best Practice Tariff
Eleven processstandards
Indicators along the pathway
More emphasis on prevention and on long term care
2010 20142012
CCGs accountable for OIS
NHSOutcomes Framework 2011/12
TheMandate
CCG Outcomes Indicator Set

CCG Outcome Indicators 2014/15


Knowing Where You AreSSNAP
Case ascertainment Audit compliance

In first year• 9864 more people reached hospital faster• 642 had reduced disability through thrombolysis• Payback of £3.16 for each £1 spent
FAST Public Awareness Campaign
Significant increase in those intending to call 999:• 87% seeing weak face• 46% seeing weak arm• 74% hearing abnormal speech

Thrombolysis Provision
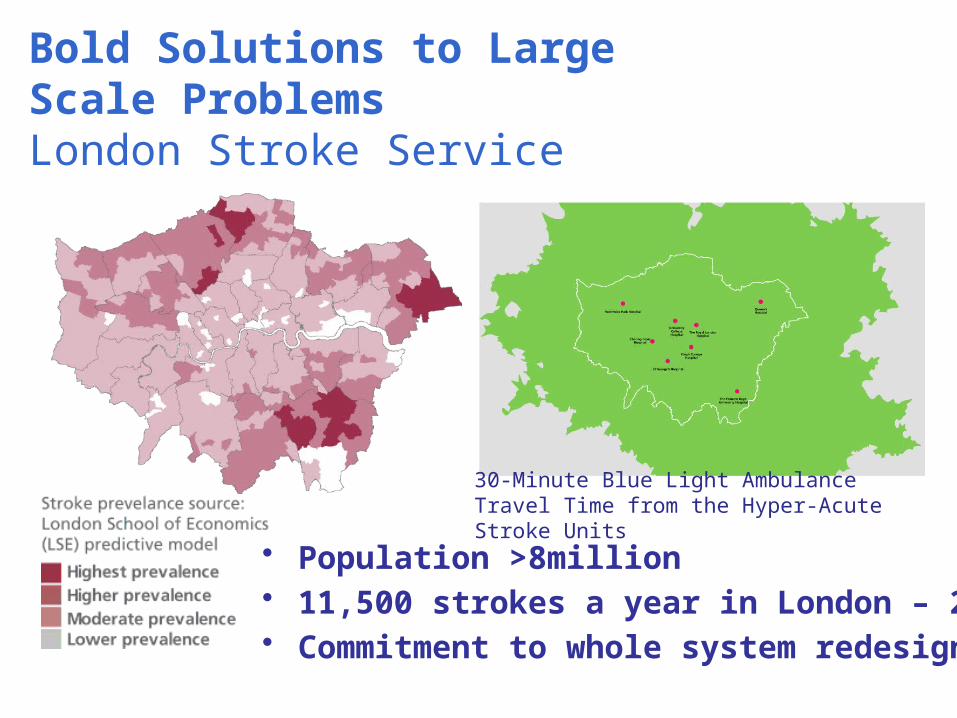
Bold Solutions to Large Scale ProblemsLondon Stroke Service
30-Minute Blue Light Ambulance Travel Time from the Hyper-Acute Stroke Units
• Population >8million• 11,500 strokes a year in London – 2,000 deaths• Commitment to whole system redesign

London Stroke Survival is Higher Than Rest of England
Hazard ratio for survival in London 0.72 95%CI 0.67-0.77 p<0.001

Reconfiguring Acute Care
Financial viability
Travel timesVolumes
• 600-1500 stroke admissions per year
• 45 minute travel time• 6 - 7 consultants with stroke
expertise on rota• Daily specialist ward rounds• HASU-grade staffing levels• 100% patients continuous
physiological monitoring• 95% patients admitted directly to
HASU from A&E• 100% urgent patients scanned
next slot and all within 24 hours• 50% appropriate patients
thrombolysed within 30 mins; 90% within 45 mins of arrival
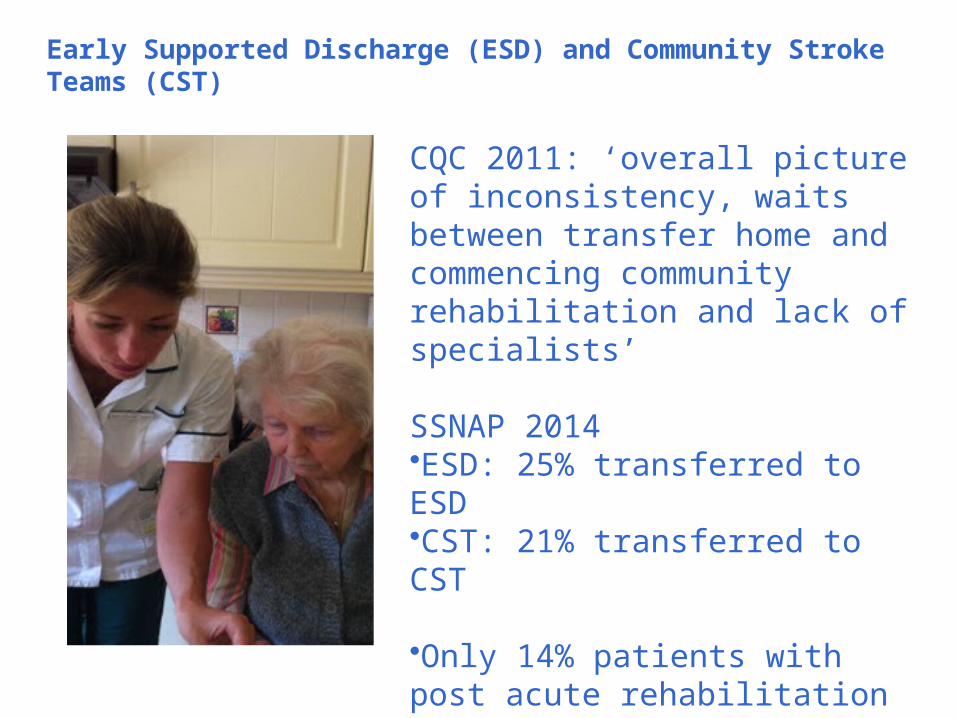
Early Supported Discharge (ESD) and Community Stroke Teams (CST)
CQC 2011: ‘overall picture of inconsistency, waits between transfer home and commencing community rehabilitation and lack of specialists’
SSNAP 2014•ESD: 25% transferred to ESD•CST: 21% transferred to CST
•Only 14% patients with post acute rehabilitation registered on SSNAP
• Fear of costs of ‘double running’
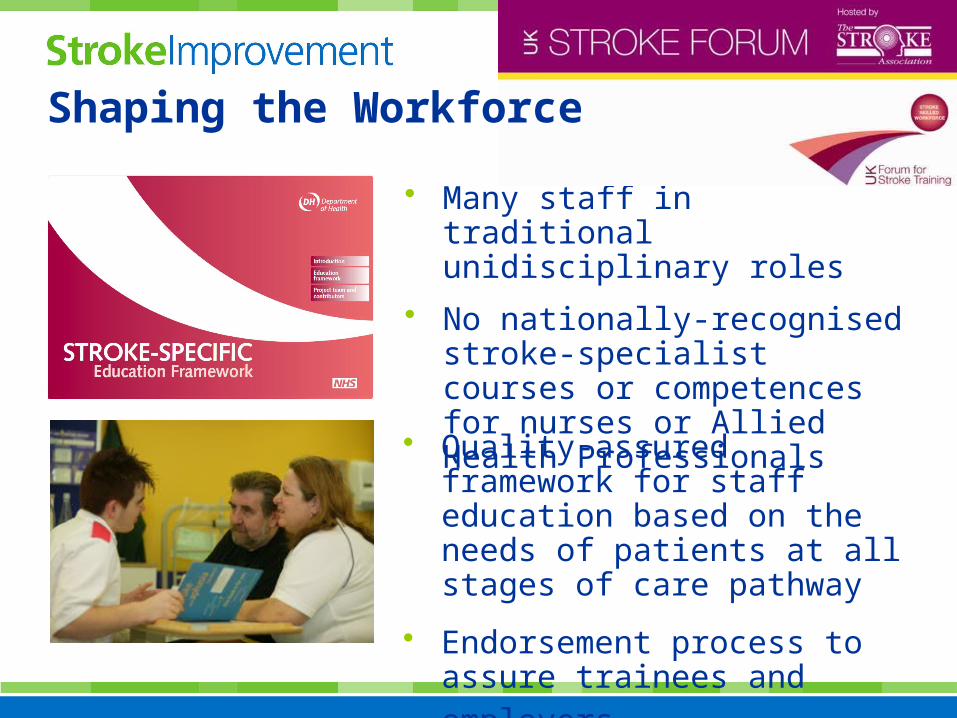
• Many staff in traditional unidisciplinary roles
• No nationally-recognised stroke-specialist courses or competences for nurses or Allied Health Professionals
• Quality-assured framework for staff education based on the needs of patients at all stages of care pathway
• Endorsement process to assure trainees and employers
Shaping the Workforce

Stroke Research Network Patient Recruitment
Qu 1
Qu 2
Qu 3
Qu 4
Qu 1
Qu 2
Qu 3
Qu 4
Qu 1
Qu 2
Qu 3
Qu 4
Qu 1
Qu 2
Qu 3
Qu 4
Qu 1
Qu 2
2006-07 2007-08 2008-09 2009-10 2010-11
0
500
1000
1500
2000
2500
3000
Non-randomisedRandomised
RCT Target
Target
Building Stroke Research Capacity
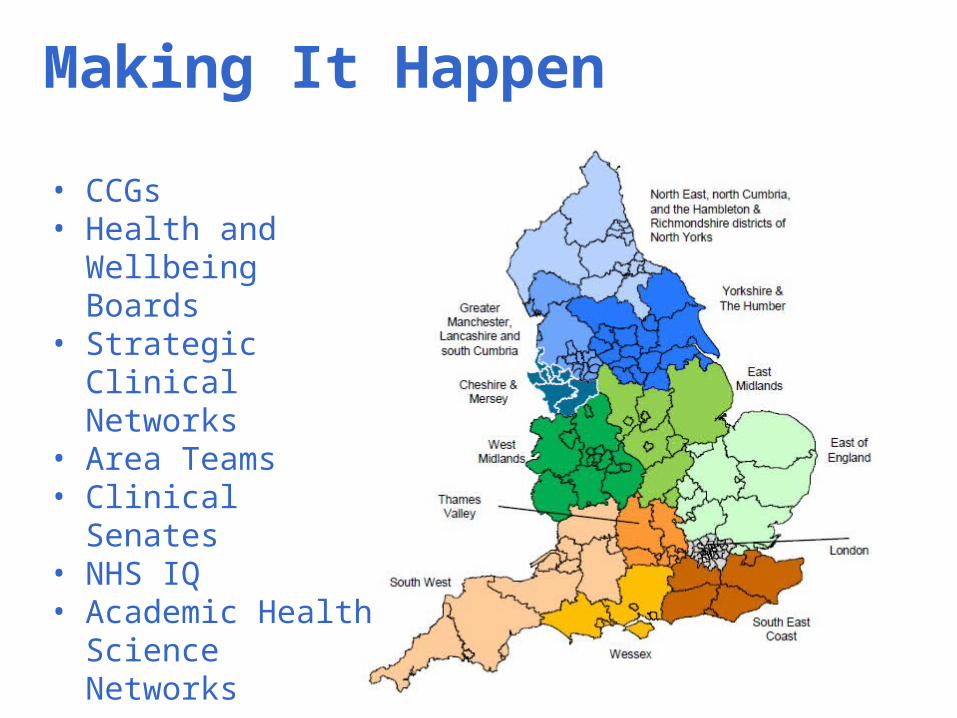
Making It Happen
• CCGs• Health and
Wellbeing Boards• Strategic Clinical
Networks• Area Teams• Clinical Senates• NHS IQ• Academic Health
Science Networks
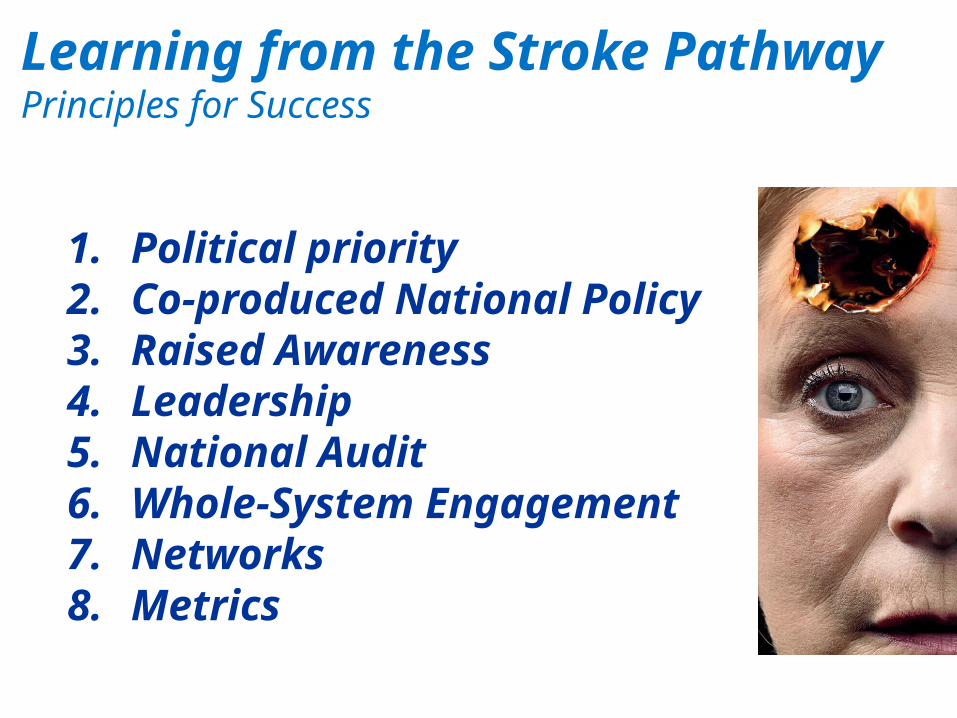
1. Political priority2. Co-produced National Policy3. Raised Awareness4. Leadership5. National Audit6. Whole-System Engagement7. Networks8. Metrics
Learning from the Stroke PathwayPrinciples for Success
Recommended