Lay-up Moulding of a Carbon Fiber Reinforced Polymer
Composite on a Cold Sprayed Metallic Layer
By
Guillaume Archambault
Thesis submitted to the Department of Mechanical Engineering in conformity with the requirements for
the degree of M.A. Science in Mechanical Engineering
University of Ottawa
Ottawa, Ontario, Canada
December 10, 2014
©Guillaume Archambault, Ottawa, Canada, 2015

ii
Abstract
The aerospace industry is incessantly investigating innovative techniques to increase aircraft fuel
efficiency. As a consequence of innovative efforts, the cost of flying is continuously reduced and the
aircraft’s mechanical performance improved. To achieve an important weight reduction, the fuselage of
aircrafts like the Boeing 787 ‘‘Dreamliner’’ is mainly made of carbon fiber based composites. Having a
high material specific strength-to-weight ratio, carbon fiber reinforced composites are state of the art
materials in the aerospace industry.
The in-flight concern of having the aircraft subjected to lightning is an ongoing safety issue. In the event
of a lightning striking the fuselage, localized melting of the composite will commonly occur, as carbon
fiber reinforced composites are highly resistive materials. A current design solution to prevent the
fuselage from extended damaging/melting is to integrate an embedded metallic mesh between the
carbon fiber composite plies. Upon lightning strike on the external skin of the composite material, the
electrical current dissipates through the metallic mesh, thus minimizing damages of the composite part
to localized melting. In addition to the integrated mesh, another solution to minimize/prevent localized
melting of the composite is to rivet relatively thick and heavy metallic protective plates over the
components prone to lightning such as the nose and wing tips of the aircraft.
To resolve weight issues arising from heavy riveted plates, it would be advantageous to deposit thin
layers of conductive material on the carbon fiber based composite surface. Unfortunately, high
operating temperatures of conventional thermal spray processes used to apply a metallic overlay would
degrade the carbon fiber based composites. For the purpose of producing metallic coated carbon fiber
based composites, a new innovative technique which combines Cold Gas Dynamic Spray and lay-up
moulding of composites is envisioned.
This current study presents a detailed description of the experimental approach developed to produce
metallic coated composites and demonstrates the manufacturability of such components at the
commercial scale. Technical prerequisites, such as obtaining a low resistivity metallized composite and
producing an easily removable metallic layer from the mould during lay-up moulding, are essential for
the production of such aerospace materials. The thesis results obtained at the University of Ottawa Cold
Spray Laboratory show that highly conductive and dense metallized composites could be produced.

iii
Acknowledgement
Throughout this fulfilling journey, I have had the luck of being surrounded by helpful friends and
colleagues. These amazing people enabled me to grow as a person and to innovate in various ways. First,
I would like to thank my thesis supervisor, Dr. Bertrand Jodoin, who was always there to provide
constructive feedback. With his busy schedule, as the mechanical engineering faculty chair and director,
his numerous contributions and positive attitude towards my work gave me the will to innovate. Thanks
for your support.
Also, my laboratory colleagues and friends such as Antoine Bacciochini, Daniel Cormier, Yannick Cormier,
Philippe Dupuis, Aslan Farjam, Ruben Fernandez, Deliang Guo, Samuel Leblanc-Robert, Daniel
MacDonald, Aleksandra Nastic, Tyler Samson, Patrick Trahan and Mohammed Yandouzi were of help
during my technical training with the required Cold Spray machinery. Let us not forget, of course, the
great laughs and camaraderie in the team. The work atmosphere in the office was nothing related to a
stereotypical office but was stimulating and enjoyable.
I would like to specially mention and thank Stan, Paul, Leo, John and all the machining crew in the
machine shop. You guys were always passionate and supported my research by efficiently machining my
designed components with speed and precision. A special thanks to Dr. François Robitaille and Simon
Baril-Gosselin for their expertise in composite manufacturing and for providing the required process
material. In addition, the funding from The Boeing Company, Mitacs, NSERC and OGS were deeply
needed in order to pursue my study.
Un dernier remerciement à mes parents Josée et Louis. Vous avez toujours su me motiver et me pousser
à poursuivre mes études. C’est grâce à vos bons repas, votre encouragement et votre vision de la vie
que je suis qui je suis aujourd’hui. Je souhaite féliciter mon frère Étienne et sa persistance. J’en ai encore
beaucoup à apprendre de toi. Cependant, ce que j’ai appris jusqu’à présent est que peu importe
l’ampleur des buts, ils seront tous atteignable si on s’y met et on y croit. Bonne chance en tant que futur
médecin et grand homme.
iv
Table of Content
Abstract ......................................................................................................................................................... ii Acknowledgement ....................................................................................................................................... iii Table of Content ......................................................................................................................................... iiv List of Tables ............................................................................................................................................... vii List of Figures .............................................................................................................................................viii List of Symbols ............................................................................................................................................xiii Chapter 1 – Introduction ............................................................................................................................... 1
1.1 Subject Background ...................................................................................................................... 1 1.2 Motivation of Research and General Objectives .......................................................................... 3 1.3 Outline of Thesis ........................................................................................................................... 4
Chapter 2 –Literature Review ....................................................................................................................... 6 2.1 Lightning on Aircrafts .................................................................................................................... 6
2.1.1 Overview ............................................................................................................................... 6 2.1.2 Lightning Strike Physical Mechanism .................................................................................... 7 2.1.3 Protective Methods .............................................................................................................. 8 2.1.4 Consequence and Damages from Lightning Strike ............................................................... 9
2.2 Carbon Fiber Reinforced Composites (CFRC) .............................................................................. 10 2.2.1 Properties and Application ................................................................................................. 10 2.2.2 Manufacturing..................................................................................................................... 11 2.2.3 Coatings on CFRC ................................................................................................................ 12 2.2.4 Surface Electrical Resistivity ................................................................................................ 18 2.2.5 Corrosion ............................................................................................................................. 21
2.3 Thermal Spray Processes ............................................................................................................ 21 2.3.1 Plasma Spray ....................................................................................................................... 22 2.3.2 Electric Arc Spray ................................................................................................................ 23 2.3.3 Combustion Spray ............................................................................................................... 24 2.3.4 Kinetic Spray ........................................................................................................................ 25 2.3.5 Summary and Comparison of Thermal Spray Processes..................................................... 26
2.4 Cold Gas Dynamic Spray ............................................................................................................. 28 2.4.1 Historical Background ......................................................................................................... 28 2.4.2 Process Overview ................................................................................................................ 28 2.4.3 Gas Dynamic Principles in CGDS ......................................................................................... 30 2.4.4 Concept of Deposition Efficiency and Particle Critical Velocity .......................................... 34 2.4.5 Bonding Mechanisms .......................................................................................................... 36 2.4.6 CGDS Parameters ................................................................................................................ 45 2.4.7 CGDS Advantages and Limitations ...................................................................................... 52
Chapter 3 – Research Objectives ................................................................................................................ 54 3.1 Feasibility .................................................................................................................................... 54 3.2 Coating, Composite and Mould Properties ................................................................................. 55
3.2.1 Powder and Substrate Roughness Selection ...................................................................... 55 3.2.2 Spray Parameter Optimization............................................................................................ 56 3.2.3 Metallized Composite Characterisation .............................................................................. 56 3.2.4 Invar Mould Characterisation ............................................................................................. 56
3.3 Production ................................................................................................................................... 57
v
Chapter 4 – Experimental Equipment, Measurement Methods and Procedures ...................................... 58 4.1 Feedstock Powders Characterization .......................................................................................... 58
4.1.1 Centerline Pure Aluminum (SST-A5001) ............................................................................. 58 4.1.2 Centerline Pure Copper (SST-C5003) .................................................................................. 60 4.1.3 Praxair Surface Technologies Pure Copper (Cu-159) .......................................................... 61
4.2 Invar Surface Preparation ........................................................................................................... 62 4.2.1 Cutting and Surface Grinding Procedure ............................................................................ 62 4.2.2 Grit Blasting Procedure ....................................................................................................... 63 4.2.3 Surface Cleaning .................................................................................................................. 66
4.3 CGDS Equipment ......................................................................................................................... 67 4.3.1 System Overview ................................................................................................................. 67 4.3.2 Powder Feeder .................................................................................................................... 69 4.3.3 De Laval Nozzle ................................................................................................................... 71 4.3.4 Swing Mechanism ............................................................................................................... 73
4.4 Composite Manufacturing .......................................................................................................... 73 4.4.1 CFRC Production and Vacuum Bagging ............................................................................... 73 4.4.2 Curing .................................................................................................................................. 76 4.4.3 Metallized Composite Removal from Mould ...................................................................... 77
4.5 Sample Preparation for Analysis/Testing .................................................................................... 78 4.6 Sample Analysis/Testing ............................................................................................................. 80
4.6.1 Coating Thickness ................................................................................................................ 80 4.6.2 Microstructure .................................................................................................................... 81 4.6.3 Substrate Surface Roughness.............................................................................................. 83 4.6.4 Particles on Substrate ......................................................................................................... 84 4.6.5 Coating Adhesion Strength ................................................................................................. 84 4.6.6 Four Point Bending .............................................................................................................. 85 4.6.7 Electrical Resistivity ............................................................................................................. 86 4.6.8 Micro Hardness ................................................................................................................... 87 4.6.9 Salt Fog Corrosion Spray Test ............................................................................................. 88
Chapter 5 – Results ..................................................................................................................................... 90 5.1 Substrate Roughness Prior to CGDS ............................................................................................ 90 5.2 Powder and Spray Parameter Optimization ............................................................................... 92
5.2.1 Coating Production ............................................................................................................. 93 5.2.2 Coating Adhesion to Substrate ........................................................................................... 98 5.2.3 Taguchi Optimization ........................................................................................................ 106 5.2.4 Gun Traverse Speed and Powder Feed Rate Selection ..................................................... 110
5.3 Metallized CFRC Properties Tests ............................................................................................. 112 5.3.1 Coating Adhesion to CFRC ................................................................................................. 112 5.3.2 Coating Surface Electrical Resistivity ................................................................................ 115 5.3.3 Salt Fog Corrosion Spray ................................................................................................... 116 5.3.4 Micro-hardness ................................................................................................................. 119
5.4 Spray Final Products .................................................................................................................. 121 5.4.1 Flat Samples ...................................................................................................................... 121 5.4.2 Curved Samples ................................................................................................................. 122 5.4.3 Angled Samples ................................................................................................................. 125 5.4.4 Large Samples ................................................................................................................... 125 5.4.5 Pattern .............................................................................................................................. 126
5.5 Invar Mould Properties Tests .................................................................................................... 127

vi
5.5.1 Post-spray Surface Roughness and Percentage of Substrate Surface Covered by Remaining Spray Particles ................................................................................................................................... 128 5.5.2 Multiple Sprays on Mould Surface Characterization ........................................................ 133 5.5.3 Removal Treatment of Embedded Particles in Substrate ................................................. 135
5.6 Summary of Selection of Spray Parameters and Powder ......................................................... 138 Chapter 6 – Conclusion ............................................................................................................................. 141 References ................................................................................................................................................ 145
vii
List of Tables
Table 1: Spray Technique Comparison [7], [46], [47], [52] ......................................................................... 27 Table 2: SST-A5001 Impurity Constituents [108] ........................................................................................ 59 Table 3: SST-C5003 Sieve Analysis .............................................................................................................. 61 Table 4: Praxair Cu-159 Sieve Analysis ........................................................................................................ 62 Table 5: Abrasive Grit Weight Composition [109], [110] ............................................................................ 65 Table 6: Invar Surface Preparation and Properties ..................................................................................... 90 Table 7: Spray Parameters for Pure Aluminum (SST-A5001) ...................................................................... 93 Table 8: Spray Parameters for Pure Copper (SST-C5003) ........................................................................... 94 Table 9: Spray Parameters for Pure Copper (Praxair Cu-159) .................................................................... 94 Table 10: Achieved Coating Matrix ............................................................................................................. 96 Table 11: Spray parameters for Copper (SST-C5003) ............................................................................... 106 Table 12: Taguchi Test Plan ....................................................................................................................... 106 Table 13: Effect of Mechanical or Chemical Treatment on Copper Particles or Invar Mould .................. 137 Table 14: Selection of Powder and Substrate Preparation Based on Criteria .......................................... 139 Table 15: Selection of Spray Parameters, Powder and Substrate Preparation Method Based on Criteria .................................................................................................................................................................. 139 Table 16: Suitable Spray Parameters for Copper (SST-C5003) ................................................................. 140
viii
List of Figures
Figure 1: Lightning Striking an Aircraft at the Nose Tip and Exiting at the Tail [14] ..................................... 7 Figure 2: Schematic of Lightning Entering or Exiting Aircraft [2] .................................................................. 8 Figure 3: Electrostatic Discharge Rod [15] .................................................................................................... 8 Figure 4: Copper Wire Mesh Embedded in Composite after Lightning Strike [16] ...................................... 9 Figure 5: Damage Resulting from Lightning Strike for a (a) Horizontal Stabilizer, (b) Antenna and (c) Riveted Composite Trailing Edge [5] ............................................................................................................. 9 Figure 6: Schematic of a General CFRC Composition [18] .......................................................................... 11 Figure 7: Stacking Process for CFRC with a) Prepreg Stacking Plies with Mid Plane Symmetry and b) Compacted Prepreg Stack [24] ................................................................................................................... 11 Figure 8: Vacuum Bagging Method for Manufacturing Metallized CFRC [24] ............................................ 12 Figure 9: Electron Beam PVD Process [26] .................................................................................................. 12 Figure 10: Hot Foil Stamping Process [27] .................................................................................................. 13 Figure 11: Electroplating Process [28] ........................................................................................................ 13 Figure 12: Discontinuous Copper Coating on HDPE where (a) Surface Melting Occurs and (b) Particles Deeply Penetrated [30] ............................................................................................................................... 14 Figure 13: Copper Coating at 0.5 MPa on (a) PC/ABS Polymer and (b) Glass Fiber Composite [31] .......... 14 Figure 14: Cross-section of Copper Coating at 0.5 MPa on (a) Polycarbonate (PC)/ABS Polymer and (b) Glass Fiber Composite [31] ......................................................................................................................... 15 Figure 15: Cold Spray Process Characterization Chart for Polymer Substrates [31] .................................. 15 Figure 16: Delaminated Zone on Polyamide 6,6 Substrate [32] ................................................................. 16 Figure 17: Delaminated Aluminum on Polyamide 6,6 Substrate using (a) Tgas=150°C (b) Tgas=300°C and (c) Pgas=3 MPa [32] ........................................................................................................................................... 16 Figure 18: Aluminum on Polyamide 6,6 Substrate [32] .............................................................................. 17 Figure 19: Copper Coating on Polymer Substrate with (a) Dendritic Copper on PVC Using Spherical Copper Interlayer and (b) Dendritic Copper on Epoxy Using Tin Interlayer [20] ........................................ 17 Figure 20: Metallic Composite Manufacturing Process with a) Spray of Metal in Mould and b) Composite Mounting [18] ............................................................................................................................................. 18 Figure 21: Copper Coating on CFRC [18] ..................................................................................................... 18 Figure 22: Copper Coating Morphology (a) As-sprayed, (b) Annealed at 300°C and (c) Annealed at 600°C [36] .............................................................................................................................................................. 19 Figure 23: Conductivity of Copper Coatings by CS, HVOF and As-sprayed (AS). Annealed Bulk Copper Serves as a Reference Material [37] ........................................................................................................... 20 Figure 24: In Plane and Through Thickness Electrical Resistivity of CS Al Coatings – Adapted from [41] .. 20 Figure 25: Diagram of a Thermal Sprayed Metal Coating – Adapted from [45] ......................................... 22 Figure 26: Thermal Spraying Process Categories – Adapted from [7] ........................................................ 22 Figure 27: Schematic Diagram of a Plasma Spray Gun [49] ........................................................................ 23 Figure 28: Schematic Diagram of a Twin-wire Spray Gun [49] ................................................................... 23 Figure 29: Schematic Diagram of the HVOF Spraying Process [56] ............................................................ 24 Figure 30: Schematic Diagram of the Wire Flame Spraying Process [57] ................................................... 25 Figure 31: Schematic Diagram of the D-Gun Spraying Process [32] ........................................................... 25 Figure 32: Schematic Diagram of the Kinetic Spraying Process (Cold Spray) [59] ...................................... 26 Figure 33: Cross-section of Ni-Al Coatings Manufactured Using Different Spray Techniques – Adapted from [60] ..................................................................................................................................................... 27 Figure 34: Schematic of a Typical CGDS System [70] .................................................................................. 29

ix
Figure 35: Gas Temperature and Particle Velocity for Various Thermal Spray Processes [49] .................. 30 Figure 36: Flow Behavior in a Converging/diverging Nozzle as a Function of the Pressure Ratio Po/PB – Adapted from [55] ...................................................................................................................................... 33 Figure 37: Diagram of the Supersonic Impingement Zone at the Substrate [75] ....................................... 34 Figure 38: Measured Critical Velocity Range (Black Bar) of Feedstock Materials with an Average Particle Diameter of 25 µm [79] .............................................................................................................................. 35 Figure 39: Deposition Efficiency vs. Particle Velocity for Aluminum, Copper and Nicked Powders [49] ... 35 Figure 40: Comparison of Critical Velocity with Experimental Results [78] ............................................... 36 Figure 41: Copper Particle Sprayed onto a Copper Substrate using CGDS [87] ......................................... 38 Figure 42: Particle Temperature vs. Friction Coefficient between Substrate and Particle [32] ................. 38 Figure 43: Roll-ups at the Particle and Substrate Interface of a CGDS Coating [88] .................................. 39 Figure 44: Mechanical Anchoring of Copper Particle on Aluminum Substrate [90] ................................... 39 Figure 45: Titanium Particles on Laser Roughened TIA6 Substrate with (a) Large Particles and (b) Small Particles [32] ............................................................................................................................................... 40 Figure 46: Imbedded Alumina Grit Particles at Coating to Substrate Interface [92] .................................. 41 Figure 47: Pre-heated Substrate Surface Topography [97] ........................................................................ 42 Figure 48: Evidence of Metallurgical Bonding in Ti-6Al-V Coating [98] ...................................................... 43 Figure 49: Deformed Particle from the Peening and Rebounding of Subsequent Impacting Particles [32] .................................................................................................................................................................... 44 Figure 50: Copper Particle Conditions at Nozzle Exit [102] ........................................................................ 45 Figure 51: Aluminum on Polyamide 6,6 Splat Morphology at Different Propellant Gas Temperatures [32] .................................................................................................................................................................... 46 Figure 52: Splat Shape of Cu Particles Impacting a 25°C Substrate at 290 m/s with Particle Temperatures of (a) 50°C, (b) 500°C, and (c) 700°C – Adapted from [76] ......................................................................... 46 Figure 53: Magnification of Particles with a (a) Dendritic Shape (SST-C5003), and (b) Spherical Shape (Praxair Cu-159) .......................................................................................................................................... 47 Figure 54: Simulated Spherical Titanium Particle Temperature (K) vs. Particle Diameter (µm) [32] ......... 48 Figure 55: Spray Pattern [71] ...................................................................................................................... 49 Figure 56: Traverse Speed (mm/s) vs. Substrate Temperature (°C) on Polyamide 6,6 [32] ....................... 49 Figure 57: Effect of Spray Angles on the Deposition Efficiency of Copper [82] .......................................... 50 Figure 58: Effect of SOD (mm) on Substrate Mass Gain (g/m2) (Aluminum on Polyamide 6,6) [32].......... 51 Figure 59: Morphologies of Al Particles at Room Temperature on Preheated Substrates of (a) 373 K, (b) 473 K, (c) 573 K and (d) 673 K – Adapted from [101] ................................................................................. 51 Figure 60: Splat Shape of 25°C Cu Particles Impacting at 290 m/s Preheated Substrate at Temperatures of (a) 50°C, (b) 500°C, and (c) 700°C – Adapted from [76] ......................................................................... 52 Figure 61: Project Spray Plan Using Three Substrate Preparation Methods and Three Feedstock Powders .................................................................................................................................................................... 56 Figure 62: Research Objectives Test Plan ................................................................................................... 57 Figure 63: SEM Image of Centerline SST-A5001 Pure Aluminum Powder .................................................. 59 Figure 64: SST-A5001 Microtrac Particle Size Distribution ......................................................................... 60 Figure 65: SEM Image of Centerline SST-C5003 Pure Copper Powder ....................................................... 60 Figure 66: SEM Image of Praxair Cu-159 Pure Copper Powder .................................................................. 61 Figure 67: Wire EDM ................................................................................................................................... 62 Figure 68: Curved Invar Substrate .............................................................................................................. 63 Figure 69: Churchill Model NB Surface Grinder (Left) and Grinding Head with Wheel (Right) .................. 63 Figure 70: Dedicated Grit Blasting Chamber ............................................................................................... 64 Figure 71: SEM Image of 80 Grit Aluminum Oxide ..................................................................................... 65 Figure 72: SEM Image of 20 Grit Iron Oxide ............................................................................................... 65

x
Figure 73: Ultrasonic Acetone Substrate Cleaning Bath ............................................................................. 66 Figure 74: Pre-spray Invar Surfaces ............................................................................................................ 66 Figure 75: Centerline SST-EP-LPCS System ................................................................................................. 67 Figure 76: Centerline SST-EP-LPCS System Control Unit ............................................................................. 68 Figure 77: Nitrogen Gas Bottle Packs .......................................................................................................... 69 Figure 78: Praxair Powder Feeder ............................................................................................................... 70 Figure 79: Praxair Powder Feeder Detailed View ....................................................................................... 71 Figure 80 Disassembled de Laval Metal Nozzle Showing, From Left to Right, Stainless Steel Nozzle, Tightening Nut, Tightening Collet, Brass Orifice and Heater Nut [111] ...................................................... 71 Figure 81: Disassembled de Laval Plastic Nozzle Showing, From Left to Right, Plastic Nozzle, Quick Connect Cap, Spring, Orifice and Heater Nut [111] .................................................................................... 72 Figure 82: Nozzle Assembly Setup .............................................................................................................. 72 Figure 83: Rocking Apparatus ..................................................................................................................... 73 Figure 84: Stacking Process for CFRC with a) Prepreg Stacking Plies with Mid Plane Symmetry and b) Compacted Prepreg Stack [24] ................................................................................................................... 74 Figure 85: Vacuum Bagging Method for Manufacturing Metallized CFRC [24] .......................................... 75 Figure 86: CFRC Processing Through Vacuum Bagging in an Oven ............................................................. 75 Figure 87: Gast DAA-V715A-EB Diaphragm Vacuum Pump ........................................................................ 76 Figure 88: Carbolite PF120 Curing Oven ..................................................................................................... 76 Figure 89: Mould/Metallic Composite Assembly ........................................................................................ 77 Figure 90: Metallic CFRC Removal Method ................................................................................................ 77 Figure 91: Removed Metallic Composite from Mould................................................................................ 77 Figure 92: Struers Secotom-10 Cutting Saw ............................................................................................... 78 Figure 93: Struers LaboPress-3 Mounting Press ......................................................................................... 79 Figure 94: Embedded Sample in Polymeric Resin ....................................................................................... 79 Figure 95: Struers TegraPol-31 Polishing Machine ..................................................................................... 80 Figure 96: Elcometer Model 456 Coating Thickness Gauge ....................................................................... 81 Figure 97: Parker Denton Vacuum Desk IV Gold Sputter Machine ............................................................ 81 Figure 98: Zeiss EVO MA 10 SEM Microscope ............................................................................................ 82 Figure 99: Kingdak NMM-800TRF Optical Microscope ............................................................................... 82 Figure 100: Keyence VHX Digital Three Dimension Microscope ................................................................. 83 Figure 101: DeFelsko PosiTest AT-A Adhesion Test Apparatus .................................................................. 85 Figure 102: Pull-stub Glued to Coating ....................................................................................................... 85 Figure 103: Four Point Bending Rig ............................................................................................................. 85 Figure 104: Instron Series 4482 Machine ................................................................................................... 86 Figure 105: Keithley Model 2100 Digital Multimeter (Left) and Four Point Probe (Right) ......................... 87 Figure 106: Struers Duramin-1 Micro-hardness Tester (Left) and Indenter Close-up View (Right) ........... 87 Figure 107: Image of a micro-hardness Indentation in an Al-Co-Ce Coating [84] ...................................... 88 Figure 108: Salt Spray Apparatus ................................................................................................................ 89 Figure 109: Invar Mould Substrate Surface for Testing Produced from the Grit Blasting and Grinding Process ........................................................................................................................................................ 91 Figure 110: Oblique View (left) and Normal View (right) of Invar Substrate Top Surface Profile taken with Three Dimension Microscope ..................................................................................................................... 92 Figure 111: Typical Aluminum and Copper Coating (No Visual Difference between Set 1 and Set 2) ....... 95 Figure 112: Inconsistent Copper Coating on Ground Invar Substrate, (a) Praxair Cu-159 and (b) SST-C5003 .......................................................................................................................................................... 95 Figure 113: Cross-section of SST-A5001 Aluminum Coatings on (a) Ground Substrate, (b) 80 Grit Blasted Substrate and (c) 20 Grit Blasted Substrate ................................................................................................ 96

xi
Figure 114: Removed Copper Coating from Substrate after Cooling (Set 1) .............................................. 97 Figure 115: Cross-section of SST-C5003 Coatings for (a) Set 1, 20 Grit Substrate and (b) Set 2, 20 Grit Substrate ..................................................................................................................................................... 97 Figure 116: Cross-section of Praxair Cu-159 Coatings for (a) Set 1, 80 Grit Substrate and (b) Set 2, 20 Grit Substrate ..................................................................................................................................................... 98 Figure 117: Substrate and Pull-stub after Adhesion Test ........................................................................... 99 Figure 118: SST-A5001 Aluminum Coating Adhesion Strength (MPa) vs. Substrate Surface Roughness (Ra in μm) ........................................................................................................................................................ 100 Figure 119: Cross-sectional View of Aluminum Coating and Invar Substrate (Set 2) ............................... 101 Figure 120: Aluminum Particle Contact on Invar Surface Schematic ....................................................... 101 Figure 121: SST-C5003 Copper Coating Adhesion Strength (MPa) vs. Substrate Surface Roughness (Ra in μm) ............................................................................................................................................................ 102 Figure 122: Cross-sectional View of SST-C5003 Copper Coating and Invar Substrate Interface (Set 1)... 103 Figure 123: Praxair Cu-159 Copper Coating Adhesion Strength (MPa) vs. Substrate Surface Roughness (Ra in μm) ........................................................................................................................................................ 104 Figure 124: Cross-sectional View of Praxair Cu-159 Copper Coating and Invar Substrate Interface (Set 1) .................................................................................................................................................................. 105 Figure 125: Taguchi Mean Signal to Noise Ratio vs. Level of Parameter .................................................. 107 Figure 126: SST-C5003 Copper Coating Adhesion Strength (MPa) vs. Spray Parameters ........................ 108 Figure 127: Cross-sectional View of SST-C5003 Copper Coating at Different Spray Parameters ............. 109 Figure 128: Traverse Velocity (mm/s) vs. Powder Feed Rate (RPM) for Constant SST-C5003 Copper Coating Thickness (100 µm) ...................................................................................................................... 110 Figure 129: SST-C5003 Copper Coating Adhesion Strength (MPa) vs. Powder Feed Rate (RPM) ............ 111 Figure 130: Cross-sectional View of SST-C5003 Copper Coatings at Different Powder Feed Rates: (a) 2 RPM, (b) 8 RPM and (c) 16 RPM ............................................................................................................... 112 Figure 131: Failure of Carbon Fiber/copper Composite from a Four Point Bend Test ............................. 113 Figure 132: Carbon Fiber/Copper Composite Surface after Pull Test for: (a) Composite Cohesive Failure, (b) Coating Cohesive Failure ..................................................................................................................... 113 Figure 133: Carbon Fiber/copper Composite Cross-section after Pull Test for (a) Composite Cohesive Failure and (b) Coating Cohesive Failure .................................................................................................. 114 Figure 134: Metallized Composite Strength (MPa) vs. Failure Mode ....................................................... 115 Figure 135: Coating Electrical Resistivity .................................................................................................. 116 Figure 136: Corrosion Behavior and Products of (a) Polished Copper Composite and (b) As-sprayed Copper Composite .................................................................................................................................... 117 Figure 137: Corrosion Behavior and Products of (a) Polished Copper Sheet and (b) Grit Blasted Copper Sheet ......................................................................................................................................................... 117 Figure 138: Corrosion Behavior and Products of (a) Grit Blasted Copper Sheet Mounted on Composite (b) Copper Tape Mounted on Composite ...................................................................................................... 118 Figure 139: Microstructure of Corroded (a) As-sprayed Copper CFRC and (b) Polished Surface Copper CFRC .......................................................................................................................................................... 119 Figure 140: Coating Vickers Micro-hardness (HV0.05) vs. Spray Parameters and Powder Material .......... 120 Figure 141: Coating Vickers Micro-hardness (HV0.05) vs. Powder Feed Rate (RPM) (SST-C5003 Deposited at 2.2 MPa and 300°C) .............................................................................................................................. 120 Figure 142: (a) Invar Substrate, (b) Substrate with Copper Coating, (c) Composite, (d) Coating/composite Removed from Substrate .......................................................................................................................... 121 Figure 143: Cross-sectional View of Carbon Fiber/copper Composite ..................................................... 122 Figure 144: Concave and Convex Invar Substrate Machined from Invar Flat Plate ................................. 122 Figure 145: Sprayed Concave and Convex Invar Substrate ...................................................................... 123

xii
Figure 146: Concave and Convex Carbon Fiber/copper Composite ......................................................... 123 Figure 147: Convex Carbon Fiber/copper Composite with Shaved Edges ................................................ 123 Figure 148: Coated Concave Airfoil Mould ............................................................................................... 124 Figure 149: Carbon Fiber/copper Composite Airfoil ................................................................................. 124 Figure 150: Angled Carbon Fiber/copper Composite ............................................................................... 125 Figure 151: Large Plate of Carbon Fiber/copper Composite .................................................................... 126 Figure 152: Invar Mould (Top) and CFRC with Copper Pattern on Surface (Bottom) ............................... 127 Figure 153: Post-spray Invar Surface Morphology (SST-5001 Aluminum, Set 1) on Three Dimension Topographical Mould Surface (left) and Top View of Mould Surface (right)............................................ 129 Figure 154: Post-spray Invar Surface Morphology (SST-C5003 Copper, Set 1) on Three Dimension Topographical Mould Surface (left) and Top View of Mould Surface (right)............................................ 129 Figure 155: Post-spray Invar Surface Morphology (Praxair Cu-159 Copper, Set 1) on Three Dimension Topographical Mould Surface (left) and Top View of Mould Surface (right)............................................ 130 Figure 156: Percentage Area of Substrate Covered by Adhered Powder Particles after the Composite Removal .................................................................................................................................................... 131 Figure 157: Substrate Roughness (Ra in μm) before and after Spray ....................................................... 132 Figure 158: Post-spray and Post Composite Removal Invar Surface Morphology ................................... 132 Figure 159: Pre to Post-spray Absolute Change in Substrate Surface Roughness (Ra in µm) vs. Powder Feed Rate (RPM) ....................................................................................................................................... 133 Figure 160: Pre-spray and Post Composite Removal Invar Mould Surface Morphology ......................... 133 Figure 161: Coating Adhesion Strength (MPa) and Delta Roughness (µm) vs. Frequency of Mould Use.134 Figure 162: Post-spray Invar Surface Morphology vs. Frequency of Mould Use ...................................... 135 Figure 163: Invar Mould Surface after Mechanical or Chemical Treatment ............................................ 136 Figure 164: Cross-sectional View of Copper Coating on Invar Mould Pre-treated with Nitric Acid. ........ 138

xiii
List of Symbols
Abbreviations
ABS: Acrylonitrile Butadiene Styrene
Al-BMG: Aluminum Bulk Material Glasses
APS: Air Plasma Spray
AS: Arc Spray
BSE: Back-scattered Electron
CFRC: Carbon Fiber Reinforced Composite
CGDS: Cold Gas Dynamic Spray
CS: Cold Spray
CT: Compute Tomography
CVD: Chemical Vapor Deposition
DE: Deposition Efficiency
D-Gun: Detonation Gun
EBSD: Electron Back-scatter Diffraction
EDM: Electric Discharge Machining
EDS: Electro Dispersive Spectroscopy
EP: Extra Pressure
HPCS: High Pressure Cold Spray
HTPMC: High Temperature Polymer Matrix Composite
HVOF: High Velocity Oxygen Fuel
LPCS: Low Pressure Cold Spray
PATTI: Portable Adhesion Tensile Testing Instrument
PBI: Polybenzimidazole
PC: Poly-carbonate
PGDS: Pulsed Gas Dynamic Spray
Prepreg: Pre-impregnated
PVC: Polyvinyl Chloride
PVD: Physical Vapor Deposition

xiv
SCFM: Standard Cubic Feet per Minute
SE: Secondary Electron
SEM: Scanning Electron Microscopy
SN: Signal to Noise Ratio
SOD: Stand-off Distance
Nomenclature
a: Acceleration
A: Cross-section Area
c: Speed of Sound
C: Coefficient
cp: Heat Capacity
d: Average Length of Diagonal Indent
F: Force
HV: Vickers Micro-hardness
L: Length
M: Mach Number
m: Mass
P: Gas Pressure
R: Molar Gas Constant or Electrical Resistance
Ra: Roughness (Arithmetic average of absolute values)
T:Temperature
t: Specimen Thickness
U: Gas Velocity
w: Specimen Width
y: Deviation from Mean Value
γ: Gas Specific Heat Ratio
ρ: Density (Specific Weight)
σ: Stress
θ: Electrical Surface Resistivity

xv
Subscripts and Superscripts
1: Initial (Used in temperature)
B: Back (Used in back pressure)
D: Drag (Used in drag coefficient)
i: Item in Summation (Used in Ra roughness)
in: Inner Length (Used in four point beam bending)
m: Melting (Used in temperature)
o: Stagnation (Used in stagnation pressure or temperature)
out: Outer Length (Used in four point beam bending)
p: Particle (Used in area or mass)
R: Impact (Used in temperature)
TS: Particle at Impact Temperature (Used in stress)
*: Throat (Used in area)
1
Chapter 1 – Introduction
1.1 Subject Background
In this new age of technology and innovation, the aerospace industry must constantly adapt to offer
safer and more reliable products to consumers in a cost effective way. In the aerospace sector,
technological breakthroughs enable companies to integrate components which can offer weight
reductions, leading to essential fuel cost savings that are beneficial for the airline, passengers and
environment. To ensure safer flights and obtain a competitive advantage over their competitors,
aerospace companies are seeking novel ways to achieve this goal.
The fuselage of the airplane is constantly being redesigned to offer weight reduction without
encumbering its structural integrity. Initially made of aluminum alloys, the aircraft’s skin is being
redesigned by the leaders from the industry who are incorporating in it a greater proportion of polymer
matrix composites; more specifically carbon fiber reinforced composites (CFRC). As an example, the
fuselage of the Boeing 787 ‘‘Dreamliner’’ is almost entirely composed of carbon laminate and CFRC [1].
The strength-to-weight ratio and resistance to mechanical stress of the aircraft skin is improving when
using this new technology but issues concerning the electrical conductivity of the material are arising. As
intense climatic conditions are relatively common, a commercial aircraft can be struck by lightning once
every year or approximately every 1000 flight hours [2]–[4]. An important problem with CFRC on
airplanes is in the case where a component is struck by lightning. The fuselage’s high electrical resistivity
will not permit full current dissipation and grounding. Lightning prone areas such as the turbine intake,
wing tips and tail edges could melt from the heat caused by the electrical discharge. Due to damages
requiring extensive repairs, the plane can be out of service for an extended period of time, causing
costly delays and service interruptions [5].
Current protective solutions improving the electrical conductivity of the fuselage are to rivet aluminum
based conductive plates to critical areas and/or to insert a thin conductive copper mesh under the
composite. Riveting plates is a labor intensive and costly procedure. The high cost and weight of these
rivets and plates is in opposition to the weight reduction objective of aircraft manufacturers [6]. For the
copper mesh, it is a tedious process to lay down the material and its application will not protect against

2
surface melting of the composite. That is to say that it will only dissipate the current once the composite
top layer has melted.
Thermal spray processes, such as High Velocity Oxygen Fuel (HVOF), are often used to deposit thin
layers of material on a substrate. To promote conductivity, one could use thermal spray techniques to
deposit thin conductive coatings over the CFRC of airplane skins. Unfortunately, the sprayed particles
from the conventional thermal spray processes possess high temperatures since they are in the semi-
molten or molten state [7]. Impinging molten particles against CFRC would result in a degradation of the
substrate due to thermal effects and erosion. Besides, the in-flight oxidation of the molten particles
would result in changing the powder material properties in the metallic coating. Oxidation would
increase the electrical resistivity of the coating and decrease the dissipation of electricity from lightning.
Colder spray techniques like cold gas dynamic spray (CGDS) could solve the extreme temperature issue
given that the sprayed particles remain in the solid state. Coatings produced from the CGDS technique
can be characterized as oxide free due to the nature of the carrier gas (N2 or He) and the relatively low
process gas temperature. The material composition and microstructure of CGDS coatings are similar to
the feedstock powder used. In this process, once the operating parameters such as gas pressure and
temperature are adjusted for a given powder, the powder is fed through a converging-diverging nozzle
and accelerated to a critical velocity. As the particles in the gas stream reach the substrate, they can
adhere to it by various bonding mechanisms, typically mechanical anchoring, metallurgical bonding
and/or van der Walls electrostatic forces. The adhesion strength of the coating to the substrate is a
function of the spray parameters, powder properties (size, shape, chemical composition, temperature
and velocity) and substrate properties (roughness, surface temperature and chemical composition) [8].
The numerous differences of the CGDS process with other thermal spray techniques make it a process
used to possibly produce thin conductive metallic layers over composites. Unfortunately, composite
erosion/degradation caused by the velocity, temperature and hardness of impinging particles is a
potential drawback of this technique [9]. In solution to this drawback, the method of lay-up moulding a
CFRC over a pre-existing coating could solve the composite erosion/degradation issue. An investigation
will be conducted on producing a low adhesive coating on a metallic mould, then moulding a composite
over the coating. By removing the coating (bonded to the composite) from the mould, a conductive
composite component would be produced. Depending on the mould shape and geometry, many
geometric profiles could be cold sprayed (CS) on the mould. Moreover, with the mould surface
3
roughness, feedstock powder properties and CS parameters used to produce the coating, the surface
adhesion of the coating to the mould could be tailored to favor coating debonding. While closely linked
to the spray parameters, the coating properties such as porosity, resistivity, hardness and thickness can
vary based on the variables used to manufacture the coating.
In the industry, Invar alloy (36% nickel and 64% iron) is used as a mould for CFRC manufacturing due to
the similarity in its thermal expansion coefficient with respect to CFRC. This prevents the development
of internal stresses during curing of the composite in the oven. The similarity of thermal behavior of
both mould and composite, results in a low degree of component distortion [10], [11].
1.2 Motivation of Research and General Objectives
This current research was motivated by the need to develop a method for applying thin conductive
metallic coatings over key aircraft composite components. Parts predisposed to lightning such as wing
tips and tail edges are currently protected with heavy metallic plates riveted to the skin. Weight and cost
of the current practice lead to requiring an improved solution to ensure flight safety and efficiency.
Regrettably, CGDS cannot directly produce a coating on airplane CFRC components due to the erosive
nature of the high velocity and hardness of the feedstock powder. Instead, in order to solve this issue,
an Invar mould can be used as a substrate material for the metallic coating. In collaboration with The
Boeing Company, CGDS and lay-up moulding methods will be investigated to develop a metallic coated
CFRC. This thin metallic layer (75 µm to 125 µm) should ensure minimum electrical resistivity (8.40 x 10⁻⁸
Ωm) to help reduce local heating or melting caused by lightning. From the mould geometry, coatings of
many curvatures and shapes can be deposited on the mould. A CFRC can then be layered over the
coating surface and cured in an industrial oven. After curing, the metallic coated composite is to be
removed from the Invar mould.
In order to easily remove the coated composite from the mould, the coating to mould interfacial
adhesion strength needs to be minimized. Granted that the adhesion magnitude is highly correlated
with the surface profile of the mould, possible modifications of the mould surface roughness will ensure
the ease of coating delamination. In addition, the CGDS parameters such as gas pressure and
temperature as well coating thickness can highly influence the state of residual stress within the coating,

4
the adhesion strength and the coating electrical resistivity. To accomplish the task, the listed procedure
will be followed:
Explore the potential of CGDS to produce coatings on an Invar mould, from which a metallic
composite could be lay-up moulded.
Determine the mould surface finish, feedstock powder and CGDS spray parameters to obtain
adequately low adhesion strength between the mould and coating.
Ensure the feasibility to produce metallized composites of various morphology (curved and
angled) and sizes.
Verify the mould surface is not altered from multiple re-uses (multiple coating applications and
removals). If the Invar surface properties change from multiples sprays, develop a method tore-
establish the mould properties.
Characterize the metallized CFRC for coating adhesion strength, as well as mechanical, electrical
and corrosion properties.
1.3 Outline of Thesis
The content of this thesis is divided into six chapters. Chapter 1 briefly introduces the research subject
and rationale of the work. It underlines current related industry issues and proposes a potential solution
to improve the actual technology which will be investigated through the current work. As well, in order
make the solution feasible, essential objectives to accomplish are listed.
Chapter 2 contains a detailed review of the relevant work found in the literature. It also covers what is
currently being done by the industry to solve the issues arising from the impact of lightning on aircraft
components. Information is stated regarding composites and their implication in this project. Also,
various pertinent thermal spray processes with their advantages and drawbacks are introduced. A brief
comparison is made between the mentioned methods. To finalize the chapter, CGDS is deeply explored.
Subjects such as the process dynamics, the spray parameters, the bonding mechanisms, the advantages
and limitations of the process are covered.

5
In Chapter 3, the tasks necessary to manufacture metallized composites are explained. Some of the
listed objectives in Chapter 1 contain multiple sub-objectives which are needed to maintain scope. A
justification of the procedure and further detail related to the objectives is disclosed.
Chapter 4 explains the approach taken to solve the objective presented in Chapter 3. As this research is
production oriented, essential apparatus are needed to accomplish the prescribed tasks. For instance,
the CGDS system, the relevant material characterization tools and other consumable materials are
presented.
In Chapter 5, the obtained experimental results are presented. This chapter will also give the obtained
results from the predetermined characterization tests. For example, the results from adhesion strength,
electrical resistivity, corrosion, hardness and surface tests are given. Accordingly, after describing the
implication of the attained results, a thorough scientific analysis of the results is made.
Finally, the conclusion (Chapter6) summarizes the findings reported in this thesis. With the specifics
from Chapter 5, the industrial feasibility of the new technology is evaluated and commented. In addition,
suggestions for future work are listed.

6
Chapter 2 –Literature Review
The following chapter presents an in-depth review of the literature pertinent to this research project.
First, the consequence of lightning hitting the aircraft and its protection methods will be explained. After,
general information on the manufacturing and properties of CFRC will be stated. Then, the difficulty to
coat CFRC with a conductive and corrosion resistant metallic layer will be exposed. Subsequently,
various thermal spray processes used will be introduced. A brief comparison will be made between
them. Afterwards, starting with some historical background notes, CGDS will be introduced in detail. To
finalize, explanations regarding the CGDS process, its influential parameters and the gas dynamic physics
supporting the procedure as well as a detailed analysis of the particle to substrate bonding behavior will
be given.
2.1 Lightning on Aircrafts
This section will explain why lightning strikes aircrafts and what happens at the physical level.
Afterwards, it will cover the various protection methods used to protect metallic or composite fuselages.
Finally, the consequences of lightning strikes will be detailed.
2.1.1 Overview
The aerospace industry must constantly adapt to environmental dangers such as strong winds, rain or
lightning by planning the trajectory of an aircraft with the use of weather radars [12]. As hazardous
climatic conditions are relatively common, a commercial aircraft can be struck once every year or every
1000 flight hours [2]–[4]. Due to damages requiring extensive repairs, the plane can be out of service for
an extended period of time, causing costly delays and service interruptions [5].
Lightning occurrence hitting the aircraft is dependent on geographic location and altitude. They occur
more frequently near the equator, 90% while in clouds and mostly between altitudes of 8000 feet to
14000 feet (near freezing temperatures) [2], [4], [5]. In general, even if aircrafts do not incur significant
damage from them, a few reported cases leading to crashes were documented. The last confirmed
American accident attributed to lightning occurred in 1967, when the strike caused sparking leading to
the explosion of the fuel tank [13]. More recently in 2010, one person died when a Boeing 737 flying
7
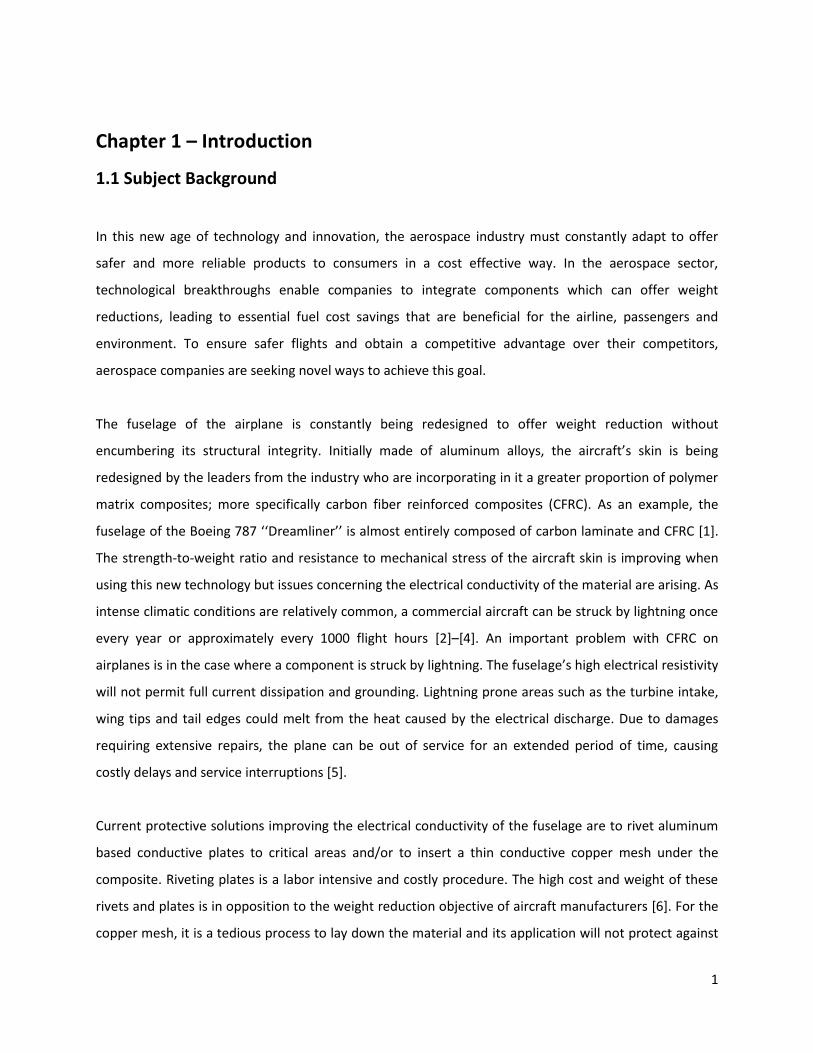
from Colombia was hit and was split into pieces as it landed [3]. In total, 58 documented incidents
resulted in 202 deaths and 46 injuries [4]. The future occurrences for incidents will increase in the years
to come because leaders in the industry will manufacture commercial aircrafts (Boeing 787 and Airbus
A350) with composite parts which are more susceptible to lightning strikes and less conductive than
aluminum [2].
Figure 1: Lightning Striking an Aircraft at the Nose Tip and Exiting at the Tail [14]
2.1.2 Lightning Strike Physical Mechanism
When a lightning discharge carrying 1 million volts or 30000 amperes at 30000°C strikes the nose or
wing tip of an aircraft, a glow and loud noise can be heard or seen by passengers. The sound and flash is
caused by the ionization of the surrounding air and increase in the electromagnetic field density [3], [5],
[13]. Due to the low resistance between the clouds and aircraft in comparison to the clouds and the
ground, the electrical discharge occurs between the clouds and aircraft. As shown in Figure 2, the energy
enters the airframe at the edge of the cockpit window or wing leading edge and is conducted by the
fuselage conductive exterior skin/structure, seeking an opposite polarity location (tail or winglets) to exit
[2]. The dense electromagnetic field from the strike can cause the flickering of lights, interference with
instruments, pressurization losses or even permanent damage to electrical components such as
controlled fuel valves, generators and power feeders [5].

8
Figure 2: Schematic of Lightning Entering or Exiting Aircraft [2]
2.1.3 Protective Methods
In order to ensure safety of flight operations, appropriate shielding and grounding must be implemented.
Wire bundle shields and overvoltage arresters protect the avionics electronic system by accumulating
the charges, thus preventing a systemic overload [5]. For the body, electrostatic dischargers are housed
in fiberglass rods, insulating them from the frame (Figure 3). These thin sticks collect atmospheric
friction as well as lightning charges and provide an easy exit for the extra energy. This extra energy
leaves the apparatus by dissipation [2], [12]. Also, around the fuel tanks, the fuselage skin must have an
appropriate thickness to prevent a burn through of the surrounding metal, structural joints, access
doors, vents and fuel filler caps [3], [4], [13].
Figure 3: Electrostatic Discharge Rod [15]
For composite structures; expanded foils, wire mesh, embedded metallic wire, diverter strips, coated
glass fabric and bonded aluminum foils currently serve as a conductive medium for lighting [5]. For the

9
expanded foils, wire mesh and metallic wire, they are embedded or layered over the composite on
which is later layered a thin adhesive film to smooth the texture of the mesh (Figure 4) [13]. The
assembly is then painted to smooth the texture of the fuselage [14].
Figure 4: Copper Wire Mesh Embedded in Composite after Lightning Strike [16]
2.1.4 Consequence and Damages from Lightning Strike
Burned or discolored skin with pits and circular holes result from a lightning strike. In the case of
composite components, the damages can extend to fiber rupture, ply delamination, resin melt through;
hence weaken the structure. Burn indications are often seen around metallic fasteners as charges
accumulate in the composite around the fastener. Typical failures are illustrated in Figure 5. Often
unnoticed by the airborne crew, damage from lightning incidents is discovered with the visual inspection
procedure as specified in the aircraft's maintenance manual. The ultimate step is to replace or restore
the component [2], [5].
Figure 5: Damage Resulting from Lightning Strike for a (a) Horizontal Stabilizer, (b) Antenna and (c) Riveted Composite Trailing Edge [5]

10
2.2 Carbon Fiber Reinforced Composites (CFRC)
In this section the importance of obtaining coatings on CFRC will be detailed. To begin, the desired
mechanical properties of CFRC for aerospace applications will be presented. Subsequently, the
manufacturing technique typically used to produce CFRC will be described. Afterwards, an exhaustive
literature review of the attempts to obtain metallic coated composites will be looked at. Finally,
information pertinent to this study regarding the importance of having a low surface electrical resistivity
and high corrosion resistance for aerospace components will be given.
2.2.1 Properties and Application
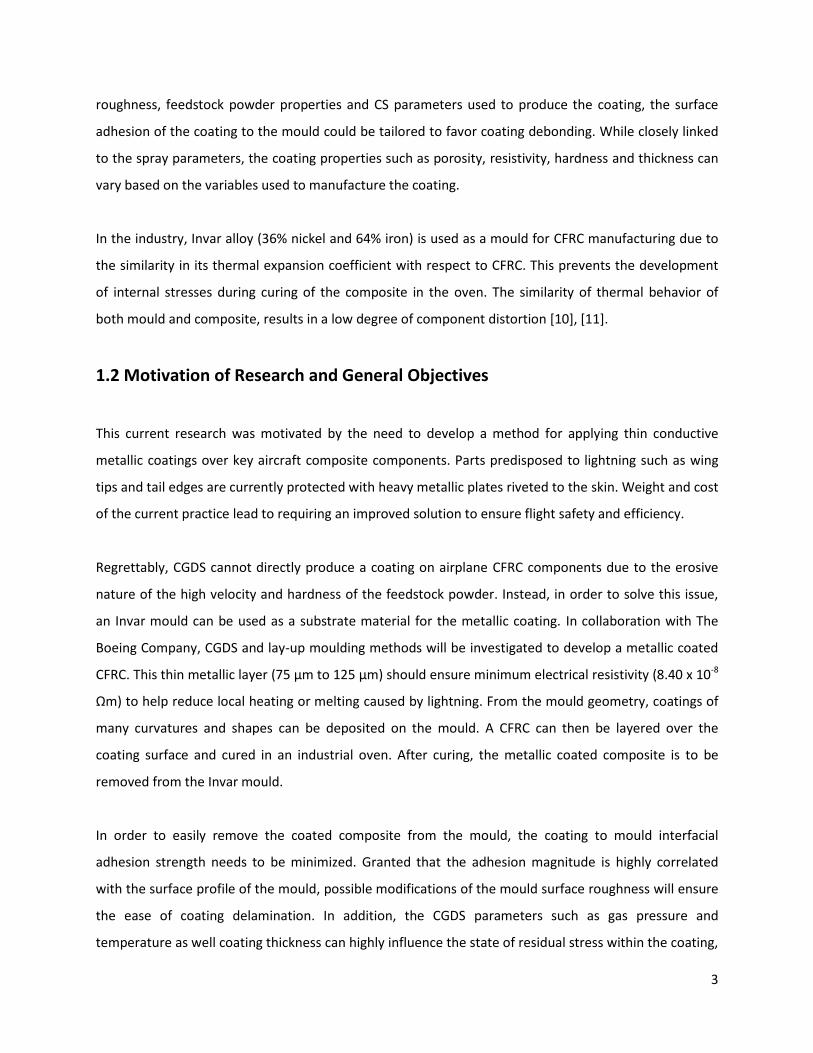
Composites are a broad category of materials characterized as the specific combination of two or more
classes of materials (ie: carbon fiber and epoxy as in Figure 6). More specifically, CFRC possess a high
strength to weight ratio, in conjunction with good fatigue, torsional and bending performance [17], [18].
Important mechanical properties are reached due to the fact that the hardener (ie: epoxy) offers
resilience and can tolerate large mechanical deformations while the carbon fibers support high stresses
due to their high tensile modulus. In contrast to metals, their ease of formation and machining reflect
their current use in the aerospace industry [9], [19]. However, CFRC have poor erosion resistance due to
the low strength of the intermolecular bond in the epoxy resin, and cannot operate at high
temperatures due to their low degradation temperature (between 100°C to 400°C). When subjected to
its glass transition temperature, a strong drop in the Young’s modulus (ie: from 3.5 GPa to 0.5 GPa) is
observed in polymers. At this threshold, the polymers acquire enough internal energy to enable the
mobility of its polymeric chains [47]. Also, they are sensitive to high ultra-violet rays. Any source of
energy (ie: thermal, mechanical or radiation) absorbed through the resin component of the CFRC can
cause denaturation of the intra and inter molecular bonds giving it its structural integrity. Moreover,
their high electrical resistivity cannot ensure conduction of electricity from lightning [20], [21].
Although regular CFRC cannot withstand harsh environments, high temperature polymer matrix
composites (HTPMC) are resilient enough to withstand harsh loading conditions. They are often used in
aerospace components such as tails, wings, fuselage, ducts and propellers on which impact of erosive
particles combined with environmental oxidation frequently occurs. The wings and fuselage of the
Boeing 787 “Dreamliner” are almost entirely composed of HTPMC [19]. Additionally, as a consequence
11
of their low weight (60% weight reduction compared to metals) and mechanical properties, metallic
coated CFRC are of value for the automotive and cryogenic storage tank industries [18].
Figure 6: Schematic of a General CFRC Composition[18]
2.2.2 Manufacturing
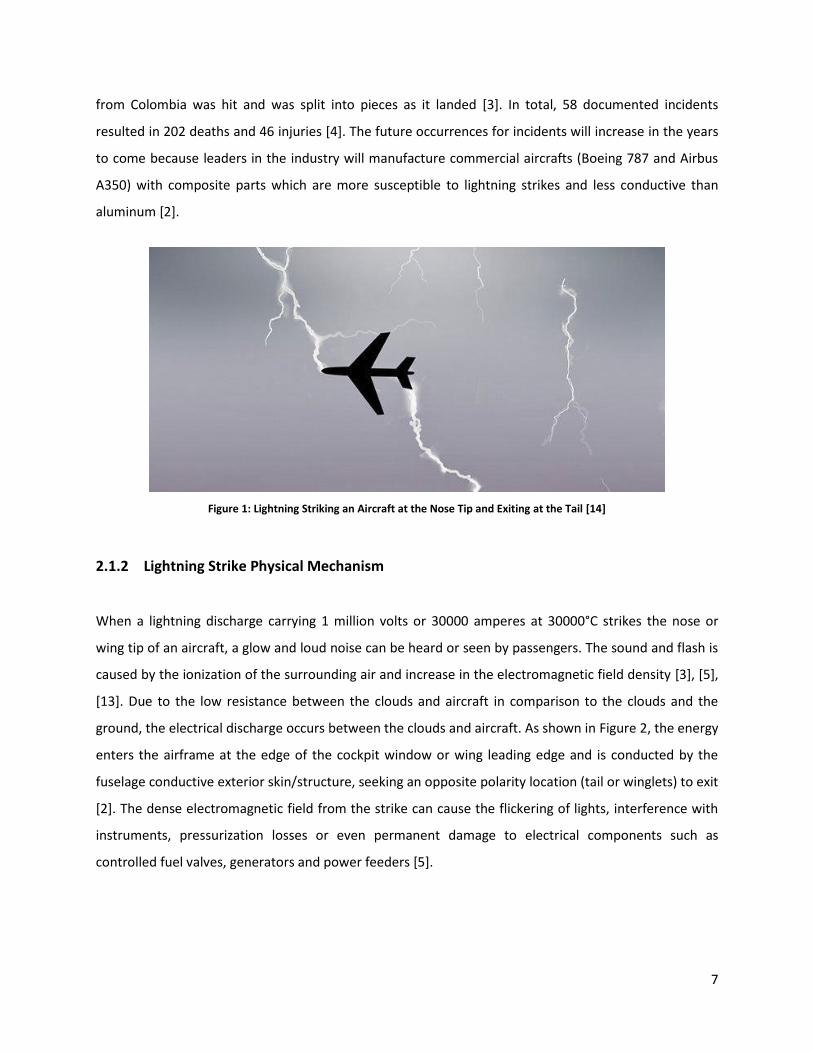
Manufacturing CFRC requires heat from an oven to cross link the semi-solid epoxy resin and its hardener
[22]. Pre-impregnated (prepreg) layers of unidirectional carbon fibers with epoxy resin are piled and
pressed at various orientations to create the desired structure (Figure 7). Before curing in an industrial
oven, the prepreg is compacted under vacuum (Figure 8) to ensure the evacuation of all possible voids
between the plies [10]. To obtain the desired curvature or shape, the composite is set to shape on an
Invar alloy mould. Having a thermal expansion coefficient of 1.6x10⁻⁶ K-1, this alloy is explicitly used as it
closely matches the composite’s expansion coefficient; thus minimising stress initiated during curing.
Thermally developed stress during curing can influence the mechanical properties of the structure by
means of crack initiation or ply delamination [10], [11]. Invar is commonly used in the industry due to its
good durability and smooth surface finish, despite of its high manufacturing cost [23].
Figure 7: Stacking Process for CFRC with a) Prepreg Stacking Plies with Mid Plane Symmetry and b) Compacted Prepreg Stack [24]

12
Figure 8: Vacuum Bagging Method for Manufacturing Metallized CFRC [24]
2.2.3 Coatings on CFRC
As of today, various ways exist to obtain CFRC with a metallized surface. Namely, physical or chemical
vapor deposition (PVD or CVD), hot foil stamping, electroplating, electroless deposition, electroforming
and thermal spraying can be used. In PVD or CVD, metallic species are evaporated and then condensate
on the CFRC component (Figure 9). This process needs to be done in a vacuum which increases the
production time and sets a limit in the dimension of the produced components. Hot foil stamping is a
cheap approach but only permits the application of a two dimensional (no curved profiles) metal layer
by simultaneously heating the metal and pressing it against the composite (Figure 10) [17], [25].
Figure 9: Electron Beam PVD Process [26]
13
Figure 10: Hot Foil Stamping Process[27]
For electroplating and electroless deposition, the process occurs at low temperatures and is capable of
producing uniform coatings over the substrate area. As shown in Figure 11 for electroplating, the
process uses the principles of hydrolysis where a direct current from a power source enable ions from
the anode to be dissolved in the plating solution and to coat a cathode. However, the coatings produced
have low adhesion strengths [17], [25]. Also, the process generates pollutants and long cycle times are
required to obtain the desired coating thickness [20]. A method to increase adhesion of the coating is to
engineer the polymer surface, thus increasing its polarity and wettability. Various chemical treatments
can be used but can lead to fiber damage and degradation of the composite [65].
Figure 11: Electroplating Process [28]
Although thermal spray techniques look promising for the production of metallic coatings on CFRC, the
high temperatures used in these techniques distort or melt thermoplastic polymer-based substrates
which are highly sensitive to temperature [9]. Despite the use of bond coats, the bond strength to the
composite is quite low. In order to ensure a high degree of bonding between the substrate and the
feedstock powder, local melting in the substrate to coating interface needs to occur. This local melting,
provoked by high velocity powder particles, promotes mechanical anchoring of the particles on the

14
substrate. Unfortunately, in the case of coating composites with thermal spray processes, due to the
high kinetic energy stored in the feedstock particles and high thermal energy in the propellant gas, the
substrate can be become too soft to permit lodging of the incoming high velocity particles [19].
Significant oxidation of the substrate was observed in thermal spray (plasma) processes when aluminum,
zinc, copper and nickel alloys were sprayed on a carbon fiber and polyimide composite [29].
Attempts at producing CGDS coatings directly on polymer-based composites have revealed that brittle
thermosetting polymer substrates erode since they cannot plastically deform to mechanically interlock
metallic particles. Important fiber damage, surface swelling and surface cracking was seen as a result of
the rebounding particles on the brittle substrate surface and high spraying temperatures [17], [30]–[32].
Figure 12 demonstrates that the deposition of a copper coating on a high density polyethylene (HDPE)
surface resulted in surface melting and a discontinuous coating.
Figure 12: Discontinuous Copper Coating on HDPE where (a) Surface Melting Occurs and (b) Particles Deeply Penetrated [30]
Lupoi et al. [31] tried to spray aluminum and copper on acrylonitrile butadiene styrene (ABS) and glass
fiber composites. Coating microstructures (Figure 13 and Figure 14) show that the coatings produced
were one particle thick and discontinuous. The majority of particles impacted the substrate without
bonding. A similar behavior was observed with titanium [33].
Figure 13: Copper Coating at 0.5 MPa on (a) PC/ABS Polymer and (b) Glass Fiber Composite [31]
15
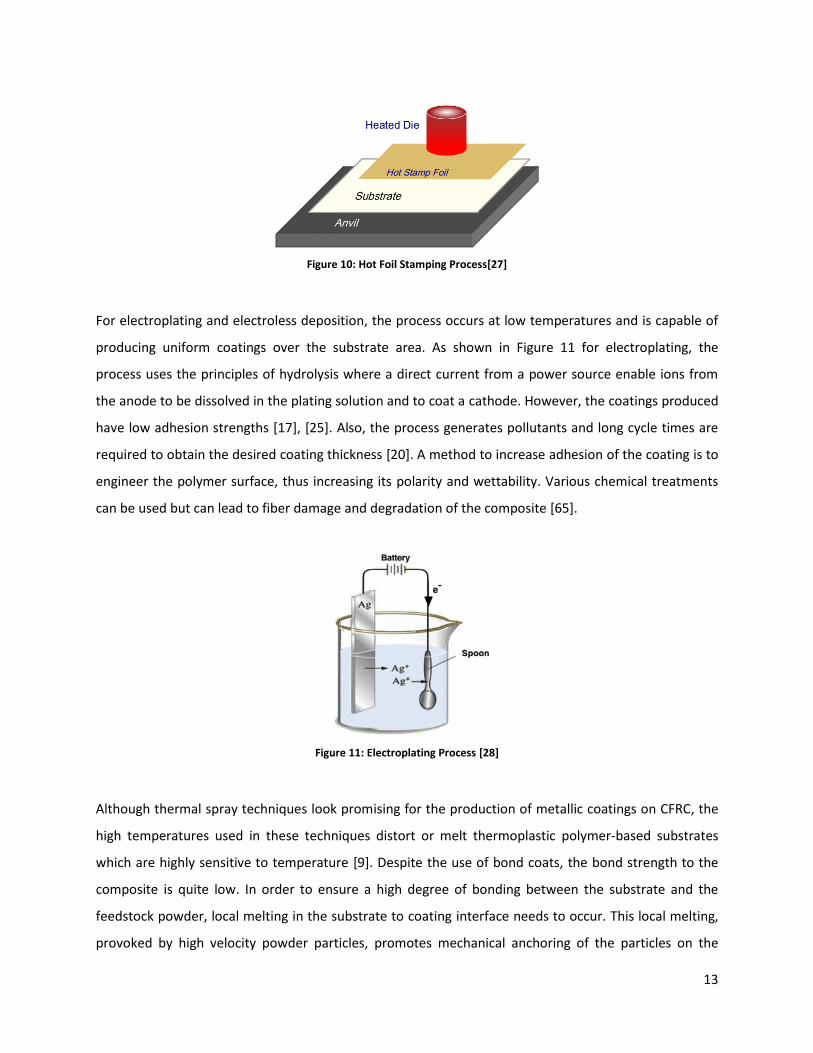
Figure 14: Cross-section of Copper Coating at 0.5 MPa on (a) Polycarbonate (PC)/ABS Polymer and (b) Glass Fiber Composite [31]
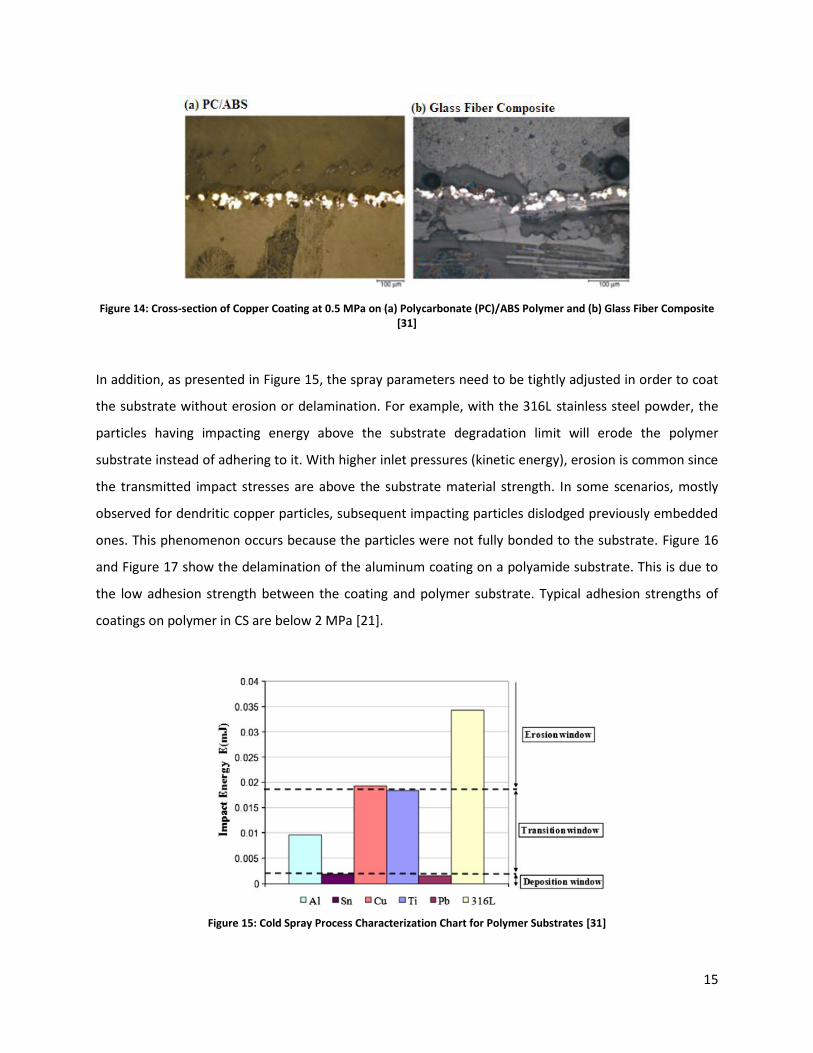
In addition, as presented in Figure 15, the spray parameters need to be tightly adjusted in order to coat
the substrate without erosion or delamination. For example, with the 316L stainless steel powder, the
particles having impacting energy above the substrate degradation limit will erode the polymer
substrate instead of adhering to it. With higher inlet pressures (kinetic energy), erosion is common since
the transmitted impact stresses are above the substrate material strength. In some scenarios, mostly
observed for dendritic copper particles, subsequent impacting particles dislodged previously embedded
ones. This phenomenon occurs because the particles were not fully bonded to the substrate. Figure 16
and Figure 17 show the delamination of the aluminum coating on a polyamide substrate. This is due to
the low adhesion strength between the coating and polymer substrate. Typical adhesion strengths of
coatings on polymer in CS are below 2 MPa [21].
Figure 15: Cold Spray Process Characterization Chart for Polymer Substrates [31]
16
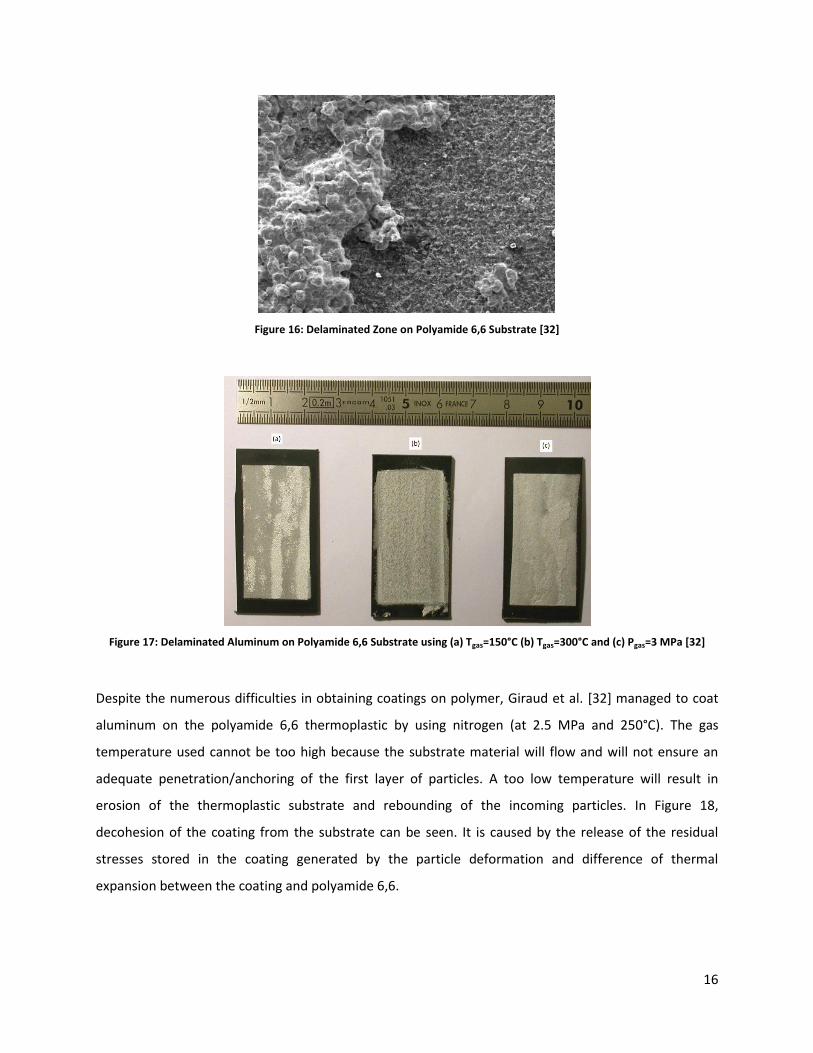
Figure 16: Delaminated Zone on Polyamide 6,6 Substrate [32]
Figure 17: Delaminated Aluminum on Polyamide 6,6 Substrate using (a) Tgas=150°C (b) Tgas=300°C and (c) Pgas=3 MPa [32]
Despite the numerous difficulties in obtaining coatings on polymer, Giraud et al. [32] managed to coat
aluminum on the polyamide 6,6 thermoplastic by using nitrogen (at 2.5 MPa and 250°C). The gas
temperature used cannot be too high because the substrate material will flow and will not ensure an
adequate penetration/anchoring of the first layer of particles. A too low temperature will result in
erosion of the thermoplastic substrate and rebounding of the incoming particles. In Figure 18,
decohesion of the coating from the substrate can be seen. It is caused by the release of the residual
stresses stored in the coating generated by the particle deformation and difference of thermal
expansion between the coating and polyamide 6,6.
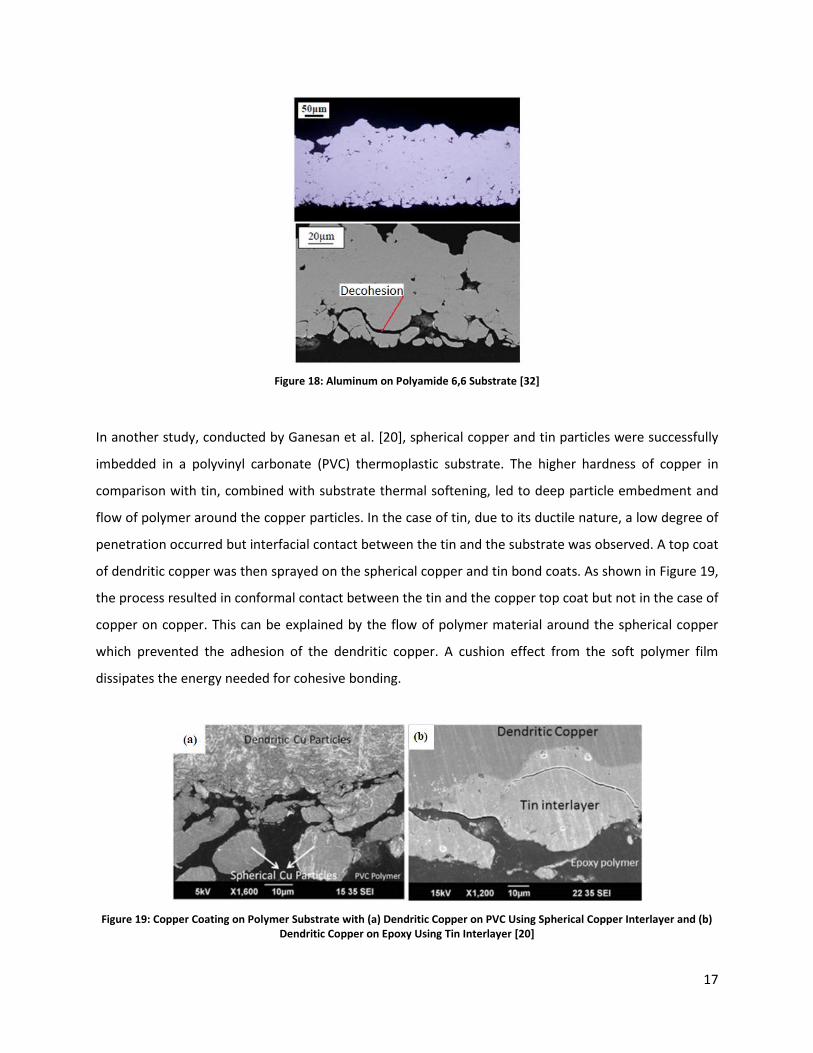
17
Figure 18: Aluminum on Polyamide 6,6 Substrate [32]
In another study, conducted by Ganesan et al. [20], spherical copper and tin particles were successfully
imbedded in a polyvinyl carbonate (PVC) thermoplastic substrate. The higher hardness of copper in
comparison with tin, combined with substrate thermal softening, led to deep particle embedment and
flow of polymer around the copper particles. In the case of tin, due to its ductile nature, a low degree of
penetration occurred but interfacial contact between the tin and the substrate was observed. A top coat
of dendritic copper was then sprayed on the spherical copper and tin bond coats. As shown in Figure 19,
the process resulted in conformal contact between the tin and the copper top coat but not in the case of
copper on copper. This can be explained by the flow of polymer material around the spherical copper
which prevented the adhesion of the dendritic copper. A cushion effect from the soft polymer film
dissipates the energy needed for cohesive bonding.
Figure 19: Copper Coating on Polymer Substrate with (a) Dendritic Copper on PVC Using Spherical Copper Interlayer and (b) Dendritic Copper on Epoxy Using Tin Interlayer [20]
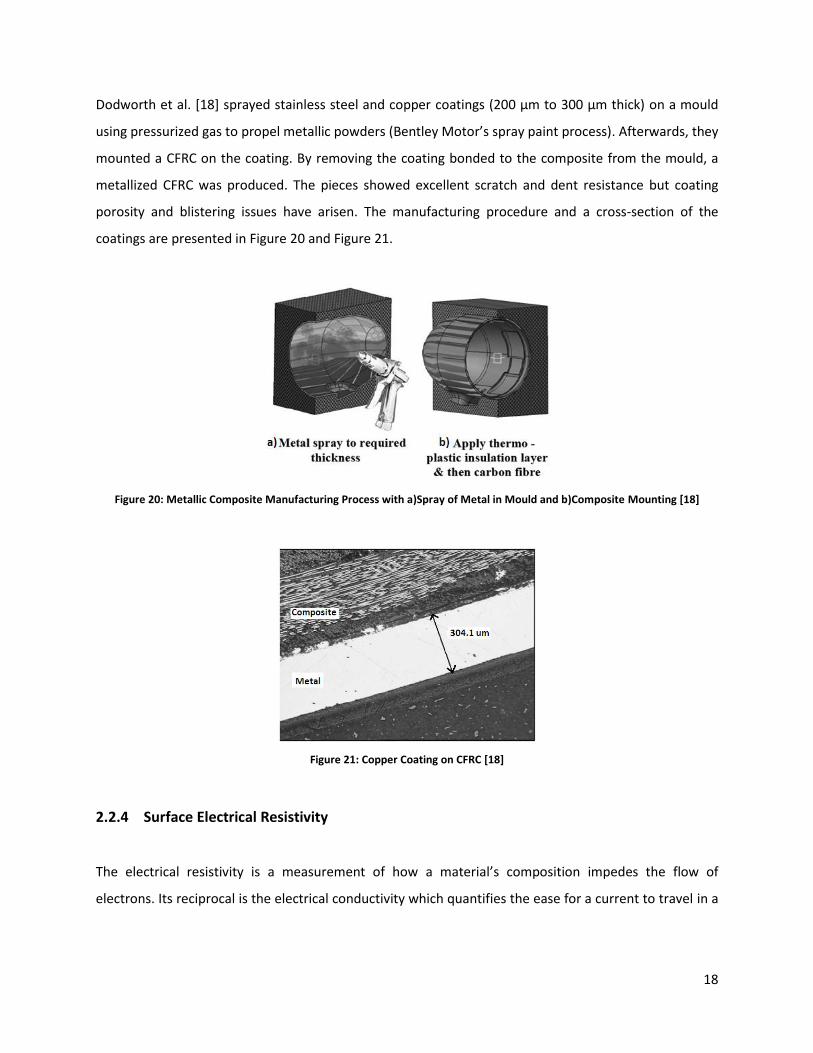
18
Dodworth et al. [18] sprayed stainless steel and copper coatings (200 μm to 300 μm thick) on a mould
using pressurized gas to propel metallic powders (Bentley Motor’s spray paint process). Afterwards, they
mounted a CFRC on the coating. By removing the coating bonded to the composite from the mould, a
metallized CFRC was produced. The pieces showed excellent scratch and dent resistance but coating
porosity and blistering issues have arisen. The manufacturing procedure and a cross-section of the
coatings are presented in Figure 20 and Figure 21.
Figure 20: Metallic Composite Manufacturing Process with a)Spray of Metal in Mould and b)Composite Mounting [18]
Figure 21: Copper Coating on CFRC [18]
2.2.4 Surface Electrical Resistivity
The electrical resistivity is a measurement of how a material’s composition impedes the flow of
electrons. Its reciprocal is the electrical conductivity which quantifies the ease for a current to travel in a

19
medium. The resistivity θ (Ωm) can be calculated with Equation 1, where R (Ω) is the resistance, A (m2) is
the cross section area and L (m) is the length where the current flows [34], [35]:
𝜃 = 𝑅𝐴
𝐿 (1)
The resistivity of a material is strongly correlated with its temperature, porosity level and degree of
molecular bonding. For example, if the microstructure of a component is composed of metallic grains
which are not well bonded to each other, the resistivity will be higher than well bonded grains. More
contact area and pressure between grains result in a low void content and material dislocations density.
In consequence, a shorter mean free electronic path is available for electrons to travel freely through
the microstructure [36], [37]. From a study conducted by Seo et al. [36], annealing a coating under
vacuum can lead to more contact surface area between the particles, enabling electron flow. Micro
voids, residual stresses and dislocations are healed through this diffusive process (Figure 22). As the
annealing temperature increases, the micro voids in the coating close and completely disappear at
600°C.
Figure 22: Copper Coating Morphology (a) As-sprayed, (b) Annealed at 300°C and (c) Annealed at 600°C [36]
Many components such as bearings, induction heaters, guide rolls and electromagnetic shielding
components require conductive coatings and can be coated with conductive metals [9], [38]. The high
thermal and electrical conductivity of copper makes it attractive for some of these applications [36]. CS
copper layers typically have a higher resistivity than the bulk material. As mentioned previously, this is
partially due to the many interfacial defects, dislocations and higher porosity content in the sprayed
coatings [21],[30],[37], [38]. Typical resistivity values of copper for bulk, plasma sprayed, CS and wire arc
copper coatings respectively range from 1.7 Ωµm, 5.5 Ωµm, 2.4 Ωµm and 6.4 Ωµm. CS has the closest

20
resistivity in comparison to the bulk material because of its dense and low oxide content microstructure
[39], [40]. Figure 23 illustrates how the spray processes and heat treatments affect conductivity.
Figure 23: Conductivity of Copper Coatings by CS, HVOF and As-sprayed (AS). Annealed Bulk Copper Serves as a Reference Material [37]
The coating thickness also influences its resistive properties [41]. The porosity and dislocation density
through the coating thickness confines the electron path, thus leading to higher resistivity compare to
the surface resistivity. This anisotropic behavior is more significant in thicker coatings. As shown in
Figure 24, spherical and globular particles exhibit similar surface and through thickness resistivity values.
Figure 24: In Plane and Through Thickness Electrical Resistivity of CS Al Coatings – Adapted from [41]
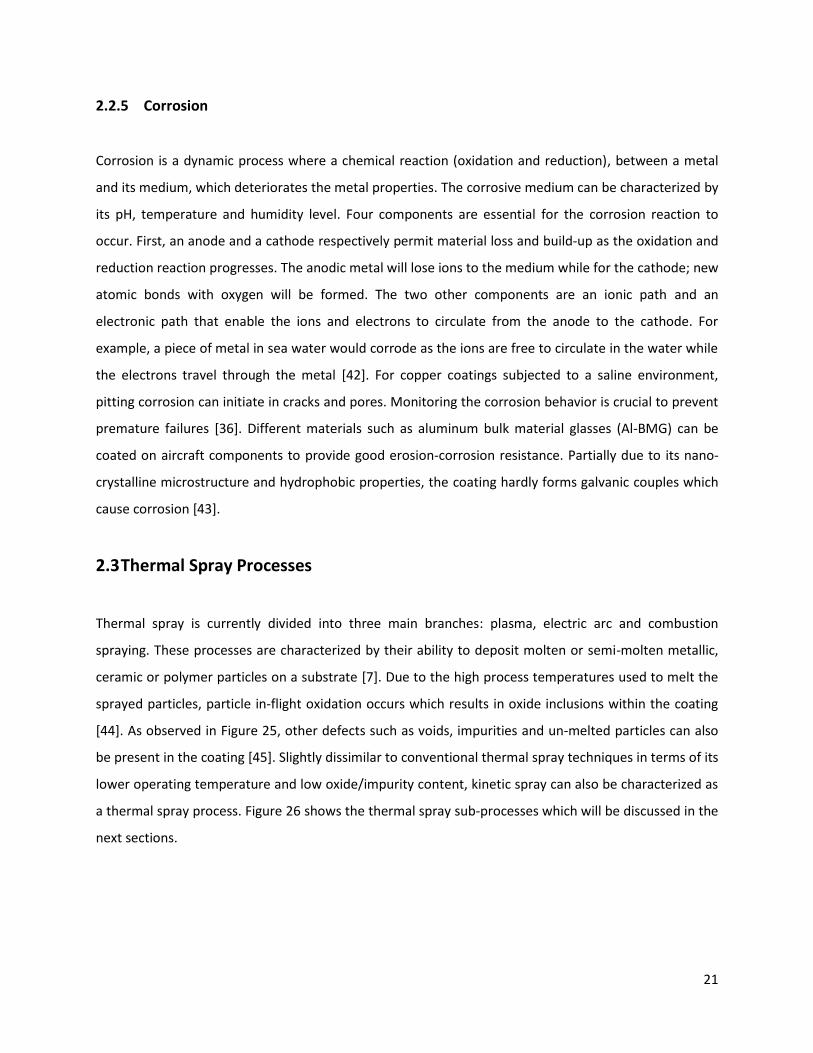
21
2.2.5 Corrosion
Corrosion is a dynamic process where a chemical reaction (oxidation and reduction), between a metal
and its medium, which deteriorates the metal properties. The corrosive medium can be characterized by
its pH, temperature and humidity level. Four components are essential for the corrosion reaction to
occur. First, an anode and a cathode respectively permit material loss and build-up as the oxidation and
reduction reaction progresses. The anodic metal will lose ions to the medium while for the cathode; new
atomic bonds with oxygen will be formed. The two other components are an ionic path and an
electronic path that enable the ions and electrons to circulate from the anode to the cathode. For
example, a piece of metal in sea water would corrode as the ions are free to circulate in the water while
the electrons travel through the metal [42]. For copper coatings subjected to a saline environment,
pitting corrosion can initiate in cracks and pores. Monitoring the corrosion behavior is crucial to prevent
premature failures [36]. Different materials such as aluminum bulk material glasses (Al-BMG) can be
coated on aircraft components to provide good erosion-corrosion resistance. Partially due to its nano-
crystalline microstructure and hydrophobic properties, the coating hardly forms galvanic couples which
cause corrosion [43].
2.3 Thermal Spray Processes
Thermal spray is currently divided into three main branches: plasma, electric arc and combustion
spraying. These processes are characterized by their ability to deposit molten or semi-molten metallic,
ceramic or polymer particles on a substrate [7]. Due to the high process temperatures used to melt the
sprayed particles, particle in-flight oxidation occurs which results in oxide inclusions within the coating
[44]. As observed in Figure 25, other defects such as voids, impurities and un-melted particles can also
be present in the coating [45]. Slightly dissimilar to conventional thermal spray techniques in terms of its
lower operating temperature and low oxide/impurity content, kinetic spray can also be characterized as
a thermal spray process. Figure 26 shows the thermal spray sub-processes which will be discussed in the
next sections.
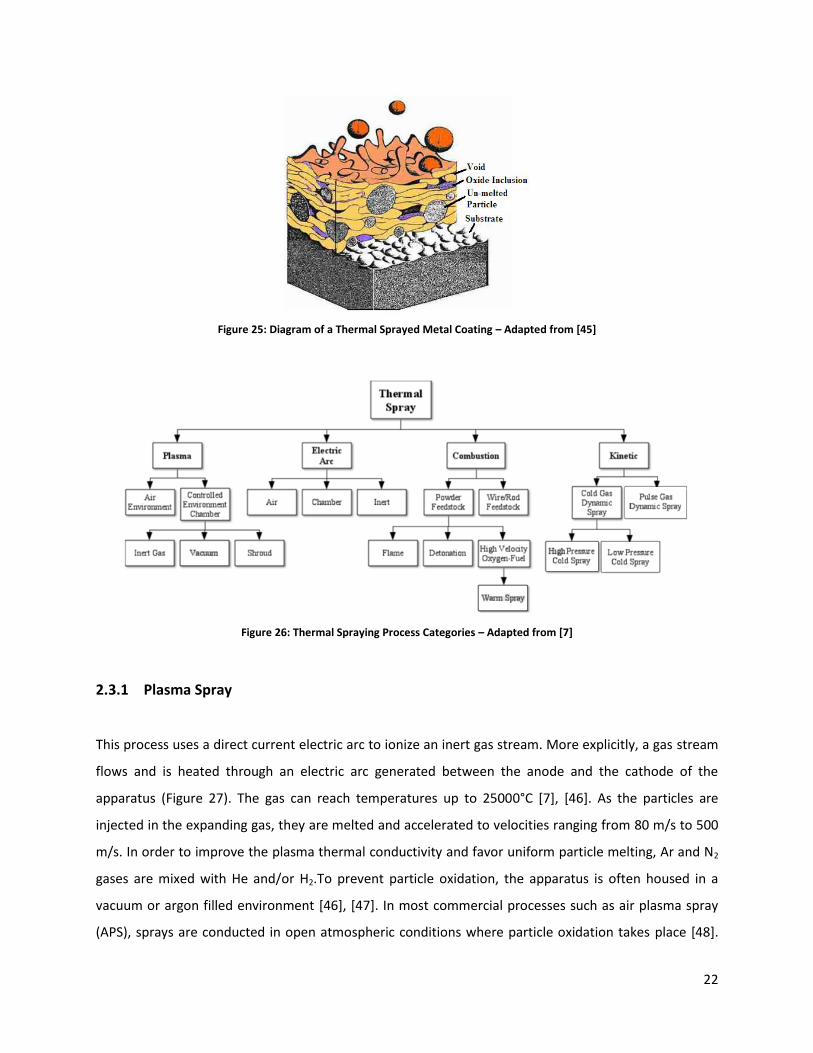
22
Figure 25: Diagram of a Thermal Sprayed Metal Coating – Adapted from [45]
Figure 26: Thermal Spraying Process Categories – Adapted from [7]
2.3.1 Plasma Spray
This process uses a direct current electric arc to ionize an inert gas stream. More explicitly, a gas stream
flows and is heated through an electric arc generated between the anode and the cathode of the
apparatus (Figure 27). The gas can reach temperatures up to 25000°C [7], [46]. As the particles are
injected in the expanding gas, they are melted and accelerated to velocities ranging from 80 m/s to 500
m/s. In order to improve the plasma thermal conductivity and favor uniform particle melting, Ar and N2
gases are mixed with He and/or H2.To prevent particle oxidation, the apparatus is often housed in a
vacuum or argon filled environment [46], [47]. In most commercial processes such as air plasma spray
(APS), sprays are conducted in open atmospheric conditions where particle oxidation takes place [48].

23
Based on the spay conditions and parameters, a coating with porosity levels varying from 1% to 40% can
be achieved. Some of the drawbacks of this technique include the non-uniform melting of the particles,
the introduction of thermal stresses and oxides in the coating in addition to the high costs associated
with its complexity [7].
Figure 27: Schematic Diagram of a Plasma Spray Gun [49]
2.3.2 Electric Arc Spray
This technique employs a direct electric current through consumable metallic feedstock electrodes to be
melted (Figure 28). The resulting molten metallic droplets are atomized and propelled through air or
other inert compressed gas. Unlike plasma spray, the arc temperature ranges from 3000°C to 6000°C
while the sprayed particles can reach velocities from 50 m/s to 150 m/s before solidifying on the
substrate material [7], [50]. By directly heating the feedstock material, 100% of the input energy is
utilized to melt the wires without the requirement of an intermediary heated gas [7].
Figure 28: Schematic Diagram of a Twin-wire Spray Gun [49]

24
2.3.3 Combustion Spray
Combustion spraying is divided in three categories which are high velocity oxygen fuel (HVOF),
detonation gun (D-Gun) and flame spraying [7]. These all include oxidizing fuels such as propane,
propylene, hydrogen, acetylene or kerosene to create 3000°C flames [51]. During the feedstock powder
exposure in the hot combustion gases, less than 10% of the generated energy is effectively used for
melting the material to be sprayed [7]. Small particles, in comparison to large particles, can be easily
melted and accelerated in the flow due to their high surface to volume ratio [47]. Then, the molten
particles are accelerated through an axial nozzle and reach velocities of up to 750 m/s [52]. Such high
velocities enhance the effect of splat formation and plastic deformation to create dense coatings which
have important compressive residual stresses. HVOF coatings have multiples defects such as un-molten
particles which form stress concentrators within the coating [53], [54]. Lower velocities are observed in
wire flame spray since air is used to project the particles instead of the combustion mixture and the
nozzle is not a de Laval type. While HVOF (Figure 29), and wire flame (Figure 30) are continuous
processes which have the feedstock continuously introduced in the combusting flow, D-Gun (Figure 31)
uses periodic controlled explosions in a barrel to heat and accelerate discrete quantities of powder onto
the substrate [7]. From the detonation initiated by the spark plug, the temperature and velocity of the
particles can reach up to 4500°C and 1000 m/s [51]. To a lesser degree than plasma and electric arc
spray, the melting of particles can negatively affect the coating properties by altering the coating
microstructure and particle grain size. Essentially, if the powder is heat sensitive and a desired coating
metallurgical phase is required, kinetic spray processes should be used [55].
Figure 29: Schematic Diagram of the HVOF Spraying Process [56]

25
Figure 30: Schematic Diagram of the Wire Flame Spraying Process [57]
Figure 31: Schematic Diagram of the D-Gun Spraying Process [32]
2.3.4 Kinetic Spray
This category is distinctive from other thermal spray methods by the fact that the propellant gas
temperature remains relatively low. The feedstock powder is injected in an air, N2 or He pre-heated gas
stream (up to 1100°C) [7]. Dominated by the particle material, morphology and size as well as gas nature,
heat transfer between the particles and the propellant gas determines the particle impact temperature.
For CGDS (shown in Figure 32), gas flows through a de Laval type nozzle to reach supersonic velocities.
This flow induces a drag force on the injected feedstock particles, accelerating them to velocities ranging
from 200 m/s to 1200 m/s [58]. CGDS can be divided into low pressure cold spray (LPCS), where the
feedstock powder is injected in the diverging section of the nozzle, and high pressure cold spray (HPCS)
where the feedstock powder is injected in the converging section of the nozzle. Differences in particle
temperatures and velocities result from these configurations as the particle time spent in the flow varies.
In HPCS, the particles are heated by the gas in the converging section but cool down as the gas
temperature decreases in the diverging section of the nozzle. For LPCS, the particles are only in contact

26
with the carrier gas as it cools down in the diverging portion of the nozzle. Due to the nature of the
powder to gas interaction, the feedstock particles remain in solid state throughout their flight prior
impacting the substrate. In some cases, when high enough particle impact velocity and temperatures
are reached, a nanometric layer surrounding the particle can melt [32]. The absence of complete
melting minimizes oxidation and prevents microstructure changes in the coating [39]. In the event that
enough kinetic energy is imparted to the particles, particle bonding to substrate occurs. Upon impact
with the substrate, the kinetic energy of the in-flight particles is transferred into interfacial heat through
highly localized pressures zones that promotes deformation and bonding [7].
Figure 32: Schematic Diagram of the Kinetic Spraying Process (Cold Spray) [59]
2.3.5 Summary and Comparison of Thermal Spray Processes
Application specific coatings can be produced by employing diverse thermal spray techniques.
Depending on the operating temperature and particle velocity, coating properties such as corrosion
behavior, porosity and residual stress state can vary. For high temperature processes resulting in particle
melting (ie: plasma spray), the coating is porous in nature, contains fragmented particles and has a high
oxide content [46]. In kinetic spraying, where lower gas temperatures are used, the adhered particles
are deformed through heavy plastic strain which leads to coating compressive residual stresses. Table 1
compares the various spray processes based on their operating temperatures, possible sprayed
materials and by the resulting coating properties. The numerical figures provided are common values
and do not account for every coating scenarios. The numbers can vary based on the particle size, particle
chemical composition, nozzle geometry and other influential variables.

27
Table 1: Spray Technique Comparison [7], [46], [47], [52]
Spray Technique Plasma (APS) Combustion Kinetic
(CGDS)
Gas Temperature (°C) 5000 to 25000 3000 to 4500 20 to 1100
Particle Velocity (m/s) 80 to 500 750 to 1000 200 to 1200
Materials Ceramics and
metals
Metals, cermets and low melting
point ceramics
Metals
Porosity (%) 1 to 40 0.5 to 5 below 5
Oxide Content Moderate to high Moderate Low
Residual Stresses Tensile Compressive Compressive
Adhesion Strength
(MPa)
<68 68 to 82 70
To emphasize the important variation in coating porosity and residual stress state listed in the previous
table, S. Sampath et al. [60] investigated the microstructure change in Ni-5 wt.% Al coatings produced by
diverse methods. As shown in Figure 33, it was concluded that the lower porosity of CGDS in comparison
with APS and HVOF was due to the impingement and compaction effect of CGDS. Also, the residual
stress profile through the coating demonstrated that compressive stress dominates when the incoming
particles are at lower temperature (semi-molten or solid state). Meanwhile, tensile residual stress was
observed in APS coatings. This is caused by the contraction of the molten droplet during the
solidification phase [7], [46], [60].
Figure 33: Cross-section of Ni-Al Coatings Manufactured Using Different Spray Techniques – Adapted from [60]

28
2.4 Cold Gas Dynamic Spray
The following section will give details about the CGDS process. More specifically, the technique’s
historical background and process will be discussed. In addition, the critical parameters influencing
coating properties will be listed and explained. Afterwards, the governing gas dynamic principles and the
particle to substrate bonding mechanism will be presented.
2.4.1 Historical Background
CGDS was discovered by coincidence in the mid 1980’s in Novosibirsk; at the Institute of Theoretical and
Applied Mechanics of the Siberian Branch of the Russian Academy when a team of researchers observed
the deposition of fine aluminum particles (1 μm to 40 μm) while conducting experiments on two-phase
flows around immersed objects. Rather than eroding the test body, the particles flowing in the unheated
supersonic (400 m/s to 450 m/s) gas flow adhered to the surface of the tested component. Afterwards,
in 1994, Papyrin’s work lead to the first United States patent for a CGDS system [61]–[63]. Since the
development of this technology, multiple in-house or commercial CGDS systems were designed and are
being currently used for many industrial and research and development applications. Current uses of
CGDS coatings include damage repair, corrosion protection and building of conducting films/joints for
the aerospace industry. This cost effective technique also opens the possibility in designing erosion
protective layers on the leading edge of missiles or airplanes which fly through dusty erosive mediums
[64], [65].
2.4.2 Process Overview
As portrayed in Figure 34, a CGDS setup is composed of a pressurized gas source (air, N2 or He) attached
to a converging/diverging (de Laval) nozzle. As the gas flows and is accelerated through the nozzle, a
powder feeder loads a predetermined amount of powder (sized from 1 μm to 50 μm) in the diverging
(LPCS) or converging (HPCS) portion of the nozzle. The velocity differential between the powder particles
and propellant gas creates an immediate acceleration on the particle for it to reach high velocities (500
m/s to 1000 m/s) [63], [66], [67]. The gas velocity at the nozzle exit is governed by the gas type, nozzle
geometry along with gas stagnation pressure and temperature. A solution to increase the stream
velocity is to use an electric resistive coil heater to pre-heat the carrier gas before it is injected in the
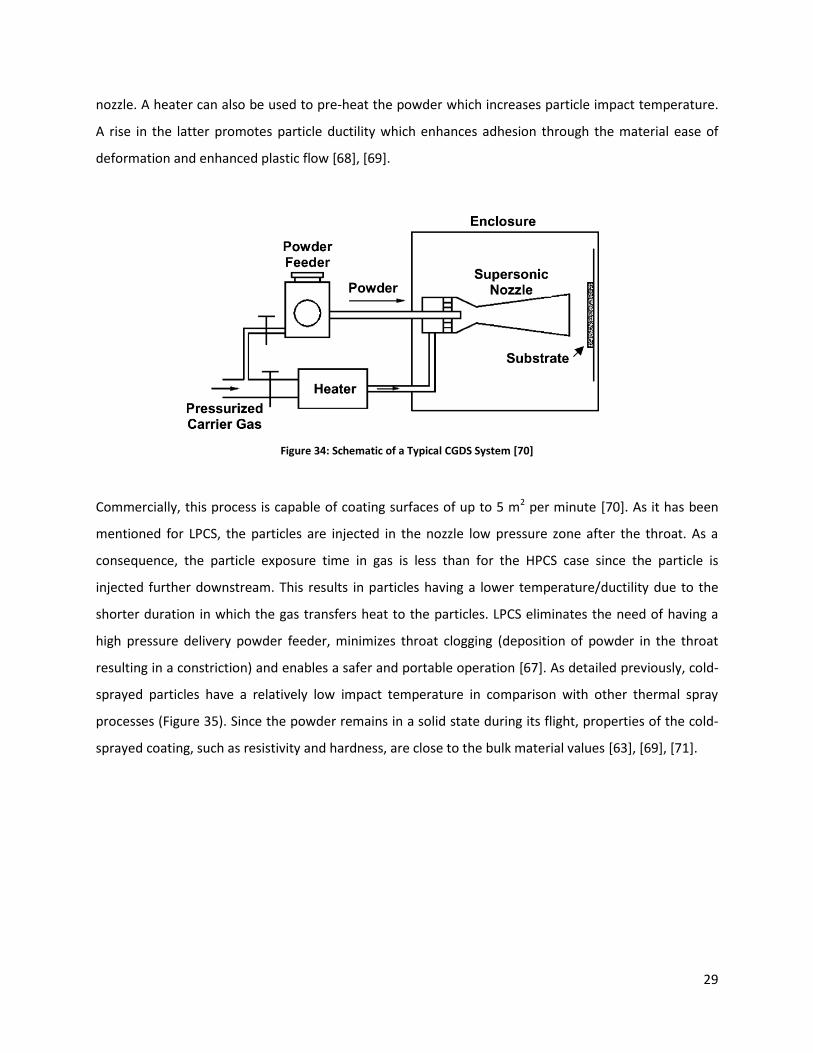
29
nozzle. A heater can also be used to pre-heat the powder which increases particle impact temperature.
A rise in the latter promotes particle ductility which enhances adhesion through the material ease of
deformation and enhanced plastic flow [68], [69].
Figure 34: Schematic of a Typical CGDS System [70]
Commercially, this process is capable of coating surfaces of up to 5 m2 per minute [70]. As it has been
mentioned for LPCS, the particles are injected in the nozzle low pressure zone after the throat. As a
consequence, the particle exposure time in gas is less than for the HPCS case since the particle is
injected further downstream. This results in particles having a lower temperature/ductility due to the
shorter duration in which the gas transfers heat to the particles. LPCS eliminates the need of having a
high pressure delivery powder feeder, minimizes throat clogging (deposition of powder in the throat
resulting in a constriction) and enables a safer and portable operation [67]. As detailed previously, cold-
sprayed particles have a relatively low impact temperature in comparison with other thermal spray
processes (Figure 35). Since the powder remains in a solid state during its flight, properties of the cold-
sprayed coating, such as resistivity and hardness, are close to the bulk material values [63], [69], [71].

30
Figure 35: Gas Temperature and Particle Velocity for Various Thermal Spray Processes [49]
2.4.3 Gas Dynamic Principles in CGDS
This section will cover the gas dynamic principles in a converging/diverging nozzle. Equations dictating
the temperature and pressure in function of the cross-sectional area of a nozzle will be listed. In addition,
particle acceleration and particle drag force equations will be included.
First, sound is defined as an infinitesimal pressure wave causing pressure (P in Pa), density (ρ in kg/m3)
and velocity (U in m/s) disturbances as it travels through a medium at sound speed (c in m/s). The
velocity of sound, travelling in a calorically perfect fluid which undergoes an isentropic evolution,
depends on the fluid properties as dictated by:
𝑐 = 𝛾𝑅𝑇 (2)
Where γ, R (J/mol/K) and T (K) are respectively the gas specific heat ratio, the molar gas constant and
the absolute gas temperature. The Mach number (M), relative flow velocity to the speed of sound, can
then be computed based on the actual flow velocity U by:
𝑀 = 𝑈
𝑐 (3)

31
Based on M, four different flow regimes can be characterized. At low velocities (M<0.3) the flow is said
to be incompressible. When 0.3<M<1, compressibility effects can be observed as the density of the flow
changes in the same order of magnitude as velocity. At sonic (M=1) or supersonic (M>1) velocities, slight
changes in velocity affect the density of the gas.
For the case of a converging/diverging nozzle, where supersonic gas velocities can be reached as the gas
expands in the diverging section of the nozzle, we can analyse an infinitesimal section of the flow as it
travels through the nozzle length. To simplify the analysis, assumptions will be made. First, let us assume
that the gases flowing are calorically perfect. This statement is valid because CGDS uses inert gases such
as N2 and He which are chemically inert and where only weak interactions take place between
molecules. Such gases also obey the ideal gas law while having constant specific heat. Second, the flow
is assumed to have reached steady-state and to be one dimensional. The steady-state assumption is
suitable because the gases in the CGDS apparatus are continuously flowing and the process has reached
equilibrium. For the one dimension approximation, the flow properties can be assumed constant around
the nozzle at a given radius. To simplify the analysis, any changes in fluid properties in the radial
direction are neglected. Only the centerline fluid properties for any axial cross-section are considered
despite a gradient between the wall of the nozzle and its centerline. Finally, the flow follows an
isentropic evolution. Isentropic is defined as the absence of viscous effects in the nozzle and any heat
losses (adiabatic) by the fluid with the environment. Heat losses through the nozzle are assumed to be
minimal. By applying theses simplifications to conservation laws (mass, momentum and energy), simple
expressions defining the flow can be obtained:
𝑇𝑜
𝑇 = 1 +
𝛾−1
2𝑀2 (4)
𝑃𝑜
𝑃 = 1 +
𝛾−1
2𝑀2
𝛾
𝛾−1 (5)
𝐴
𝐴∗ = 1
𝑀
2
𝛾+1 × 1 +
𝛾−1
2𝑀
𝛾+1
2 𝛾−1 (6)
The subscript o represents the gas stagnation condition defined at zero velocity. The A/A* ratio denotes
the nozzle area (A in m2) with respect to the throat area (A* in m2). From equation 4 and 5, we can

32
establish the local gas temperature or pressure knowing the stagnation conditions and local Mach
number. Higher stagnation conditions (higher pressure and/or temperature) provide more energy (in
the form of enthalpy) available to be converted into kinetic energy along the nozzle [72]. In equation 6,
the Mach number can be calculated for a given throat area ratio or the area ratio of the nozzle can be
designed to provide a given Mach number. By using equations 4 to 6, we can obtain the local gas
velocity, pressure and temperature along the nozzle for given stagnation properties and nozzle
geometry.
Typical gas pressure profiles along the nozzle are presented in Figure 36. Depending on the back
pressure (PB) of the environment where the flow discharges, many flow possibilities can occur through
the nozzle. If the ratio of Po/PB is too low, the flow will not have sufficient energy to be choked (M=1) at
the throat and will decelerate in the diverging portion of the nozzle (case a and case b). For case c, the
ratio is high enough to choke the flow at the throat, but infinitesimally too low to ensure acceleration
through the diverging portion of the nozzle. However, if the ratio is optimal, the gas will further expand
in the diverging section and reach supersonic velocities (case d). For case d, e and f, the pressure ratio is
large enough to sustain an expansion and acceleration of the flow through the whole diverging portion
of the nozzle. For case d, the ideal isentropic evolution is represented as the flow exits the nozzle
without any flow adjusting disturbances. For case e, the pressure ratio is too low and the gas has been
overly expanded. To reach the back pressure equilibrium state, the flow encounters a series of oblique
shocks and expansion waves. Similarly in case f, as the stagnation pressure to back pressure ratio is too
high and the fluid is under expanded, shockwaves are generated in the flow [73].
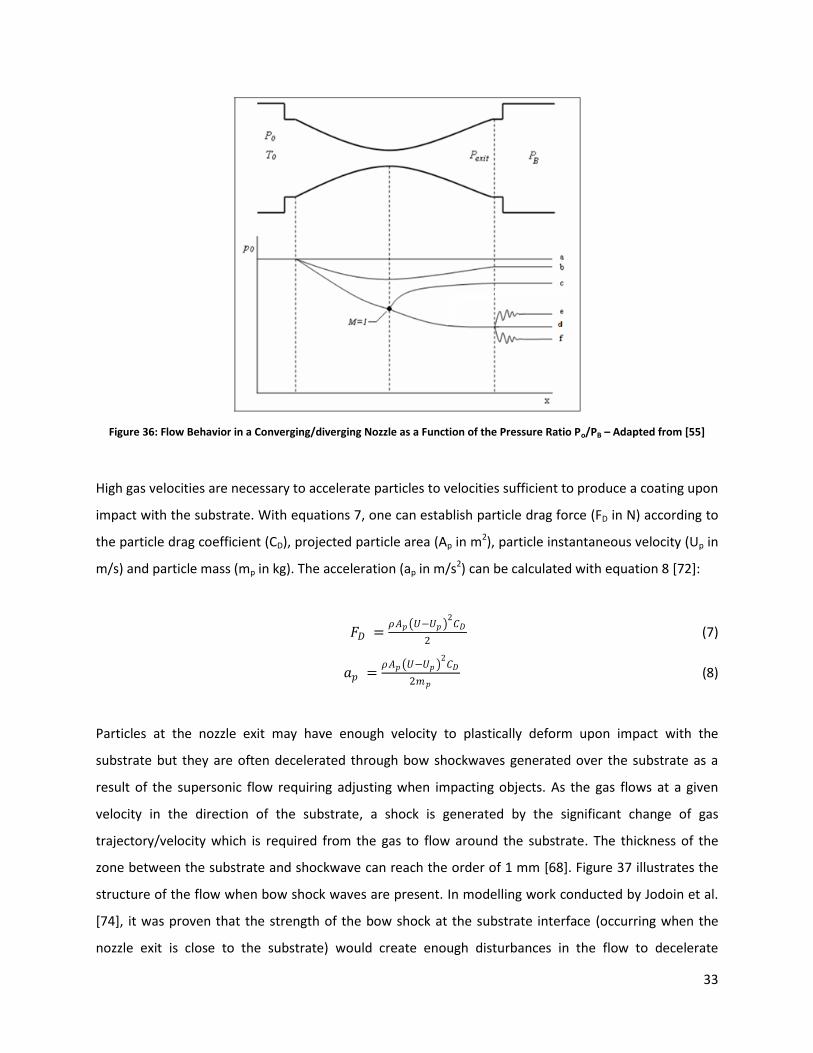
33
Figure 36: Flow Behavior in a Converging/diverging Nozzle as a Function of the Pressure Ratio Po/PB – Adapted from [55]
High gas velocities are necessary to accelerate particles to velocities sufficient to produce a coating upon
impact with the substrate. With equations 7, one can establish particle drag force (FD in N) according to
the particle drag coefficient (CD), projected particle area (Ap in m2), particle instantaneous velocity (Up in
m/s) and particle mass (mp in kg). The acceleration (ap in m/s2) can be calculated with equation 8 [72]:
𝐹𝐷 =𝜌𝐴𝑝 𝑈−𝑈𝑝
2𝐶𝐷
2 (7)
𝑎𝑝 =𝜌𝐴𝑝 𝑈−𝑈𝑝
2𝐶𝐷
2𝑚𝑝 (8)
Particles at the nozzle exit may have enough velocity to plastically deform upon impact with the
substrate but they are often decelerated through bow shockwaves generated over the substrate as a
result of the supersonic flow requiring adjusting when impacting objects. As the gas flows at a given
velocity in the direction of the substrate, a shock is generated by the significant change of gas
trajectory/velocity which is required from the gas to flow around the substrate. The thickness of the
zone between the substrate and shockwave can reach the order of 1 mm [68]. Figure 37 illustrates the
structure of the flow when bow shock waves are present. In modelling work conducted by Jodoin et al.
[74], it was proven that the strength of the bow shock at the substrate interface (occurring when the
nozzle exit is close to the substrate) would create enough disturbances in the flow to decelerate

34
particles with small inertias, thus reducing the proportion of successfully deposited particles on the
substrate [24]. The magnitude of the deceleration force acting on a particle through the series of normal
and oblique shock waves can be up to 70 times the normal drag force from ambient gas [75].
Figure 37: Diagram of the Supersonic Impingement Zone at the Substrate [75]
2.4.4 Concept of Deposition Efficiency and Particle Critical Velocity
Deposition efficiency (DE) is defined as the ratio of the mass of the particles adhering on the substrate
to the total mass of injected particles in the nozzle. In order to attain a notable increase in DE, a
threshold particle velocity (the critical velocity) at impact must be reached [8]. Once the critical velocity
has been reached, the particle deformation frequency is extremely fast [32]. As shown in Figure 38 and
Figure 39, the critical velocity is a function of powder chemical composition.DE is also function of
particle diameter and particle impact temperature. The illustrated curves show that the DE plateaus as
the particle velocity is increased beyond the critical velocity inflection point. At this point, all the
particles having the possibility to stick will form a coating. However, an excessive increase in particle
velocity can lead to substrate erosion and to the degradation of the previously coated particles. Too
much kinetic energy would be imparted on the coating which would dislodge adhered particles. Many
other factors such as powder oxide content, stiffness, melting temperature and substrate material will
have incidence on critical velocity [58], [76], [77]. The critical velocity can be computed with equation 9
where σTS is the yield stress of the particle at the impact temperature TR. The material density, heat
capacity, particle initial temperature and melting temperature are respectively denoted by ρ, cp,T1 and
Tm [78].
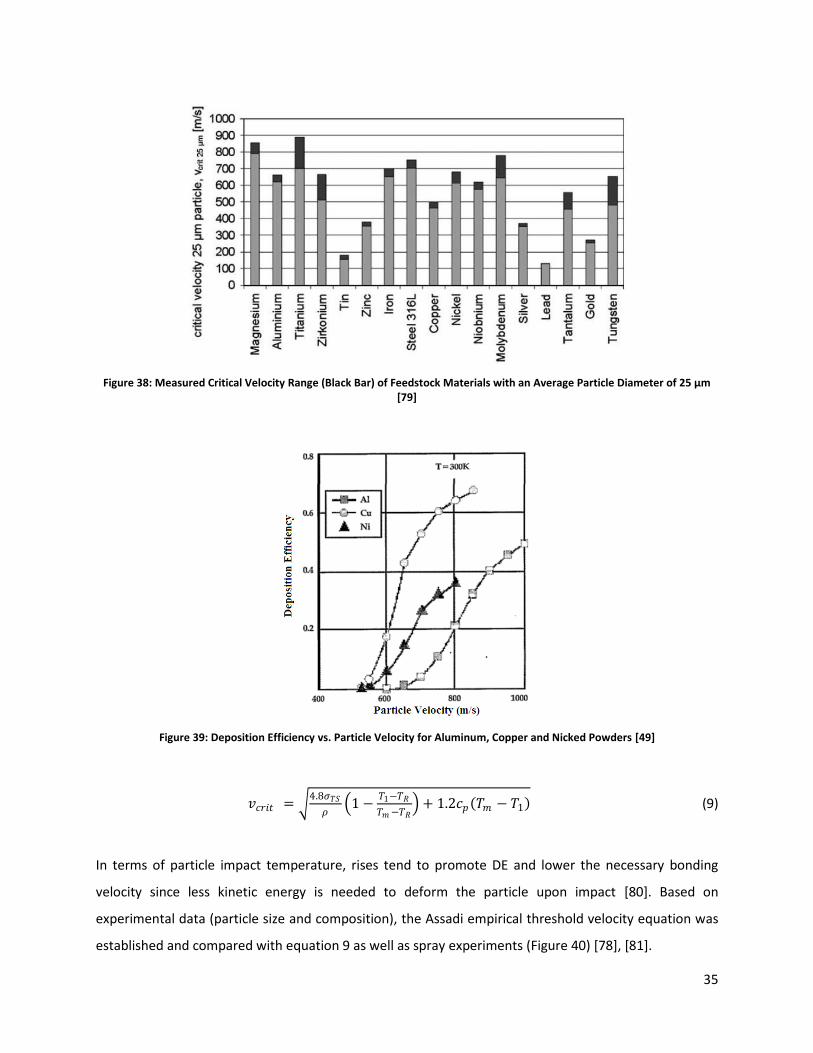
35
Figure 38: Measured Critical Velocity Range (Black Bar) of Feedstock Materials with an Average Particle Diameter of 25 µm [79]
Figure 39: Deposition Efficiency vs. Particle Velocity for Aluminum, Copper and Nicked Powders [49]
𝑣𝑐𝑟𝑖𝑡 = 4.8𝜎𝑇𝑆
𝜌 1 −
𝑇1−𝑇𝑅
𝑇𝑚 −𝑇𝑅 + 1.2𝑐𝑝 𝑇𝑚 − 𝑇1 (9)
In terms of particle impact temperature, rises tend to promote DE and lower the necessary bonding
velocity since less kinetic energy is needed to deform the particle upon impact [80]. Based on
experimental data (particle size and composition), the Assadi empirical threshold velocity equation was
established and compared with equation 9 as well as spray experiments (Figure 40) [78], [81].
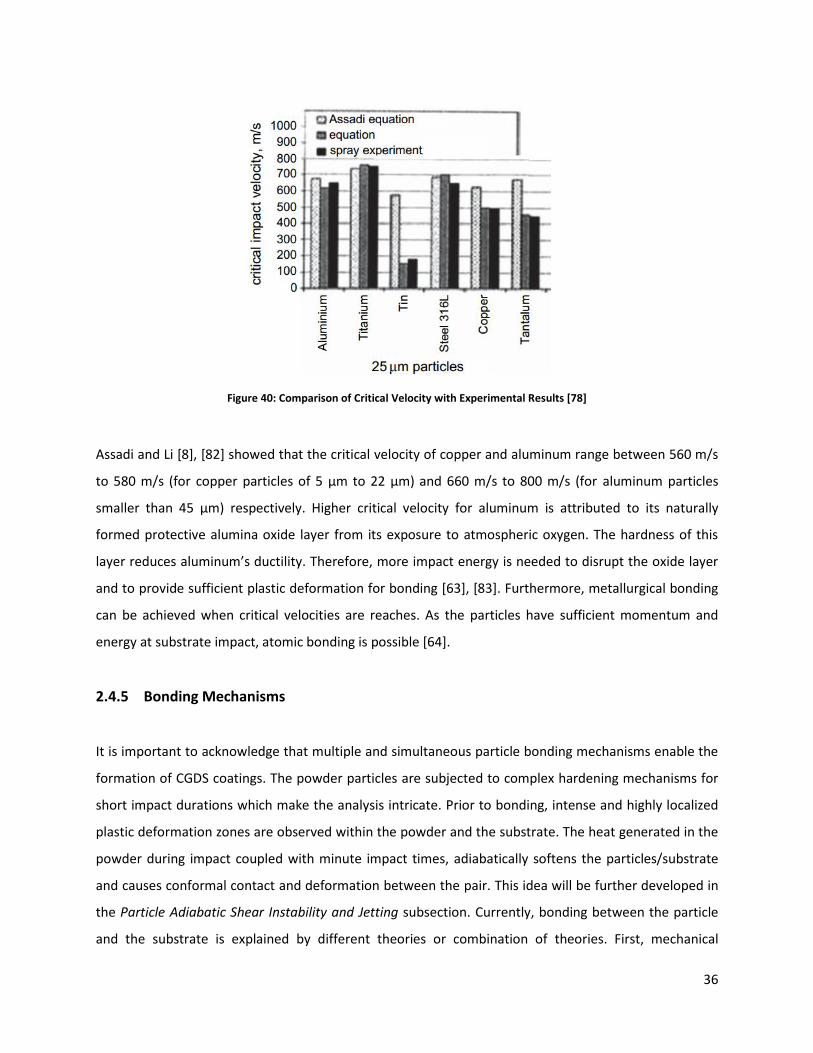
36
Figure 40: Comparison of Critical Velocity with Experimental Results [78]
Assadi and Li [8], [82] showed that the critical velocity of copper and aluminum range between 560 m/s
to 580 m/s (for copper particles of 5 µm to 22 µm) and 660 m/s to 800 m/s (for aluminum particles
smaller than 45 µm) respectively. Higher critical velocity for aluminum is attributed to its naturally
formed protective alumina oxide layer from its exposure to atmospheric oxygen. The hardness of this
layer reduces aluminum’s ductility. Therefore, more impact energy is needed to disrupt the oxide layer
and to provide sufficient plastic deformation for bonding [63], [83]. Furthermore, metallurgical bonding
can be achieved when critical velocities are reaches. As the particles have sufficient momentum and
energy at substrate impact, atomic bonding is possible [64].
2.4.5 Bonding Mechanisms
It is important to acknowledge that multiple and simultaneous particle bonding mechanisms enable the
formation of CGDS coatings. The powder particles are subjected to complex hardening mechanisms for
short impact durations which make the analysis intricate. Prior to bonding, intense and highly localized
plastic deformation zones are observed within the powder and the substrate. The heat generated in the
powder during impact coupled with minute impact times, adiabatically softens the particles/substrate
and causes conformal contact and deformation between the pair. This idea will be further developed in
the Particle Adiabatic Shear Instability and Jetting subsection. Currently, bonding between the particle
and the substrate is explained by different theories or combination of theories. First, mechanical
37
interlocking of the particle with the substrate surface can cause adhesion. This will be elaborated in
detail in the Particle Mechanical Anchoring subsection. Secondly, for metallurgical bonding, a chemical
diffusion process between the high temperature powder and substrate can occur and permit particle
bonding [84]. More of this topic will be presented in the Metallurgical Bonding subsection. As a final
point, particle to substrate adhesion can be caused by Van der Wall forces. The attractive/repulsive
behavior of materials plays an important role in their adhesion [70].
Particle Adiabatic Shear Instability and Jetting
To illustrate the particle adiabatic shear instability phenomenon, we can allude to the deformation
mechanism seen in explosive welding. From the high velocity imparted to a metal sheet with respect to
another, two metal sheets can fuse. The chemical explosion causes local softening and heat dissipation
at the impact points (shear instabilities). Bonding of the two metals by ways of mechanical anchoring
and/or metallurgical bonding occurs between the soften areas of the sheets [85].
Similarly in CGDS, adiabatic shear instability happens when enough energy is imparted to the particles to
promote local heating [21]. Due to the short time scale of particle-substrate impact, the material
behavior is dominated by softening at the impact point. As the kinetic energy is transferred to heat, the
surrounding material around the particle flows away from the impact point and is cold work hardened
[63], [70]. From an energy stand point, the kinetic energy imparted by the gas can be stored plastically
or elastically in the particle. Upon impact with the substrate, the elastic portion of the energy can
generate a rebound of the particle on the substrate after impact. If the energy is such that plastic
deformation occurs, compressive residual stresses will be stored in the particle [32]. Higher particle
velocities (500 m/s to 1000 m/s) and softer substrates have led to more jetting. This phenomenon can
be explained by the fact that the particles behave like fluids since enough energy is provided to exceed
the material yield strength [68], [86]. As observed in Figure 41, important plastic deformation and
material viscous flow (jetting) of the particle-substrate result from the impact.

38
Figure 41: Copper Particle Sprayed onto a Copper Substrate using CGDS [87]
The jetting behavior can also be linked with the friction coefficient between the impacting particle and
the substrate as the particle flows along the substrate direction. If the friction couple increases, the
materials will reach higher temperatures by means of viscous dissipation of heat. This leads to a more
ductile behavior and contributes in removing the particle oxide layer (Figure 42) [32].
Figure 42: Particle Temperature vs. Friction Coefficient between Substrate and Particle [32]
In addition, as shown in Figure 43, shear instabilities and jetting can form vortexes interlinking the
particle and the substrate. The available contact area is drastically increased; therefore allowing for
material mixing, metallurgical bonding and interlocking [70].

39
Figure 43: Roll-ups at the Particle and Substrate Interface of a CGDS Coating [88]
Particle Mechanical Anchoring
Mechanical anchoring can play a crucial role in bonding the first layer of particles to the substrate as
well as subsequent particle layers to previously deposited layers. Given a rough surface composed of
valleys and peaks, the high kinetic energy of the particle leads to its deformation upon impact with the
substrate and enables it to get locked in the crevices (Figure 44). As the process progresses, more
particles impinge the initial locked layer and further plastically deforms it. The impingement mechanism
further compacts the particles in the substrate craters. The compression elastic energy applies pressure
on the substrate crater walls as the particles wants to expand to counter that compressive stress state
[37], [70],[89].
Figure 44: Mechanical Anchoring of Copper Particle on Aluminum Substrate [90]
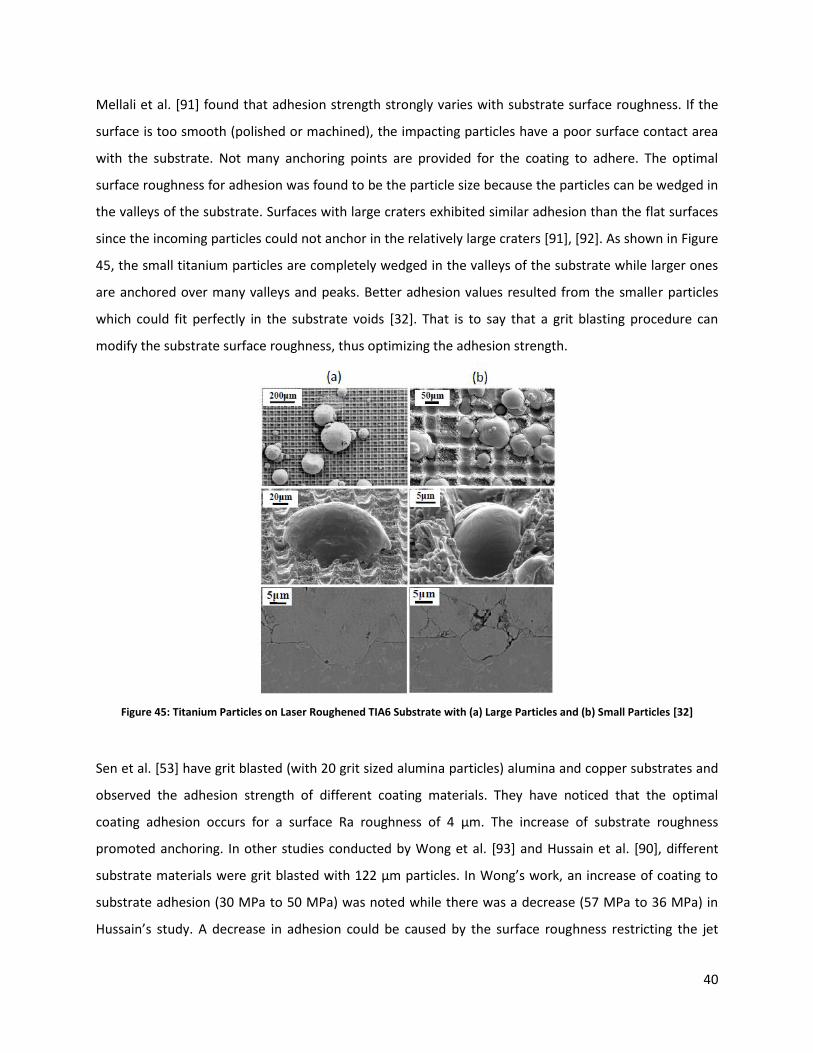
40
Mellali et al. [91] found that adhesion strength strongly varies with substrate surface roughness. If the
surface is too smooth (polished or machined), the impacting particles have a poor surface contact area
with the substrate. Not many anchoring points are provided for the coating to adhere. The optimal
surface roughness for adhesion was found to be the particle size because the particles can be wedged in
the valleys of the substrate. Surfaces with large craters exhibited similar adhesion than the flat surfaces
since the incoming particles could not anchor in the relatively large craters [91], [92]. As shown in Figure
45, the small titanium particles are completely wedged in the valleys of the substrate while larger ones
are anchored over many valleys and peaks. Better adhesion values resulted from the smaller particles
which could fit perfectly in the substrate voids [32]. That is to say that a grit blasting procedure can
modify the substrate surface roughness, thus optimizing the adhesion strength.
Figure 45: Titanium Particles on Laser Roughened TIA6 Substrate with (a) Large Particles and (b) Small Particles [32]
Sen et al. [53] have grit blasted (with 20 grit sized alumina particles) alumina and copper substrates and
observed the adhesion strength of different coating materials. They have noticed that the optimal
coating adhesion occurs for a surface Ra roughness of 4 µm. The increase of substrate roughness
promoted anchoring. In other studies conducted by Wong et al. [93] and Hussain et al. [90], different
substrate materials were grit blasted with 122 µm particles. In Wong’s work, an increase of coating to
substrate adhesion (30 MPa to 50 MPa) was noted while there was a decrease (57 MPa to 36 MPa) in
Hussain’s study. A decrease in adhesion could be caused by the surface roughness restricting the jet
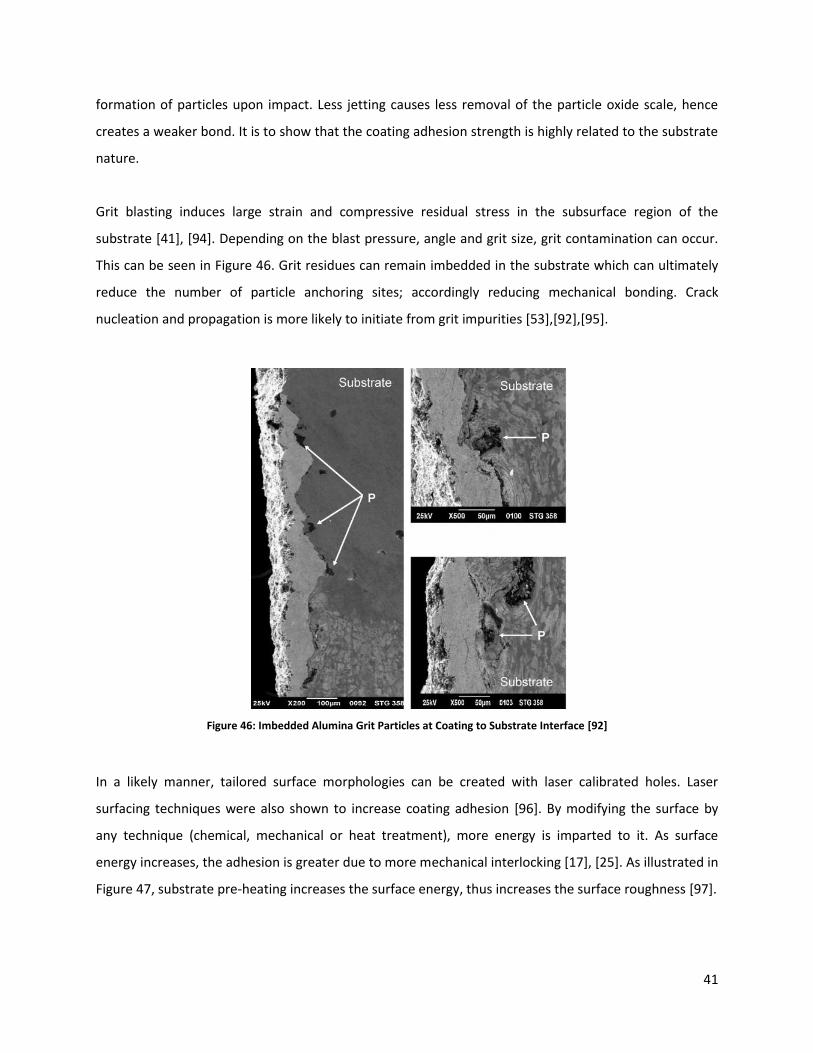
41
formation of particles upon impact. Less jetting causes less removal of the particle oxide scale, hence
creates a weaker bond. It is to show that the coating adhesion strength is highly related to the substrate
nature.
Grit blasting induces large strain and compressive residual stress in the subsurface region of the
substrate [41], [94]. Depending on the blast pressure, angle and grit size, grit contamination can occur.
This can be seen in Figure 46. Grit residues can remain imbedded in the substrate which can ultimately
reduce the number of particle anchoring sites; accordingly reducing mechanical bonding. Crack
nucleation and propagation is more likely to initiate from grit impurities [53],[92],[95].
Figure 46: Imbedded Alumina Grit Particles at Coating to Substrate Interface [92]
In a likely manner, tailored surface morphologies can be created with laser calibrated holes. Laser
surfacing techniques were also shown to increase coating adhesion [96]. By modifying the surface by
any technique (chemical, mechanical or heat treatment), more energy is imparted to it. As surface
energy increases, the adhesion is greater due to more mechanical interlocking [17], [25]. As illustrated in
Figure 47, substrate pre-heating increases the surface energy, thus increases the surface roughness [97].

42
Figure 47: Pre-heated Substrate Surface Topography [97]
The coating adhesion strength is highly affected by the shape of the incoming particles. Ganesan et al.
[20] observed that even if the velocity of dendritic copper particles is faster than spherical ones, their
adhesion on the substrate is less significant. The multiple dendrites of the copper particle caused a
dissipation of impact energy. This distributed energy through many contact points causes weak
mechanical anchoring points. Spherical particles tend to be more bonded due to a greater concentration
of plastic deformation. One large bonding zone (greater surface area) for spherical particles in
comparison to many small points in dendritic particles, causes better mechanical anchoring [20], [21],
[71]. The opposite was observed by Giraud et al. [32] with aluminum particles on polymer substrates.
Irregular shaped particles would anchor to a greater extend because the lower impacting energy
(distributed within the dendrites) was optimal for the substrate. The energy magnitude would not erode
the substrate but soften it enough to promote substrate deformation and the anchoring of the dendrites.
As a final point, mechanical anchoring is more prone to happen on softer substrates. Measurement of
the bond strength of copper coatings on steel or aluminum substrates showed that the hardness of the
substrate had effects on particles anchoring. Due to the greater hardness of steel in comparison to
aluminum, the bond strength was respectively reduced from 40 MPa to 10 MPa. The hardness
difference between the substrate materials limited substrate deformation and impeded mechanical
interlocking [37], [86]. Softer substrates like polymers, if not eroded by incoming particles, flow easily
and facilitate mechanical anchoring [30].

43
Metallurgical Bonding
This type of bonding is described by an inter-atomic diffusion and re-alloying between the powder and
substrate. Due to the minute impact time of a particle hitting the substrate (approximately 20 ns for
copper particles travelling at speed ranging from 400 m/s to 1000 m/s), diffusion occurs rapidly and
generates atomic bonds between the impacting metals [24], [70]. As the particles impact the substrate,
the high kinetic energy creates a pressure field capable of breaking the oxide layer; thus allowing
diffusion along the shear bands [63], [70], [75]. This was previously explained in the Particle Adiabatic
Shear Instability and Jetting subsection. The oxygen from the oxide layer can either be broken and
expelled on the substrate or be absorbed by the metals if local fusion is reached [32]. Conformal contact
with the two freshly exposed metals promotes atomic. Occurrences of this phenomenon were observed
as depicted in Figure 48.
Figure 48: Evidence of Metallurgical Bonding in Ti-6Al-V Coating [98]
Papyrin et al. [99] demonstrated that local melting, leading to metallurgical bonding, could occur
between aluminum particles and hard substrates. It is suggested that the heat generated between the
particles and substrate during impact, locally melted the bonded zones [90]. Even fused, the metals
revealed weaker mechanical properties than their bulk material constituents [8].
Coating Residual Stress
From the many powder particles impacting a substrate location per unit time, compressive stress from
impingement is stored in the coating. The plastic energy stored in the particles after they deformed and
the thermal expansion of the coating relative to substrate lead to residual stress. First, impingement
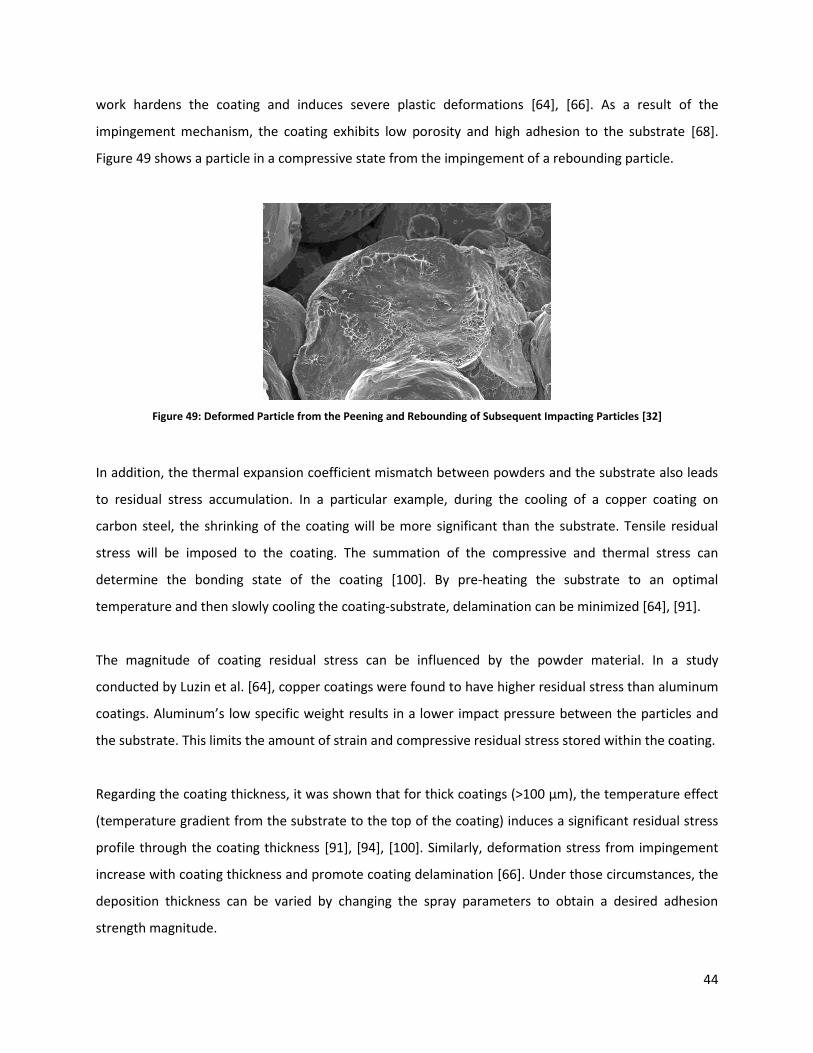
44
work hardens the coating and induces severe plastic deformations [64], [66]. As a result of the
impingement mechanism, the coating exhibits low porosity and high adhesion to the substrate [68].
Figure 49 shows a particle in a compressive state from the impingement of a rebounding particle.
Figure 49: Deformed Particle from the Peening and Rebounding of Subsequent Impacting Particles [32]
In addition, the thermal expansion coefficient mismatch between powders and the substrate also leads
to residual stress accumulation. In a particular example, during the cooling of a copper coating on
carbon steel, the shrinking of the coating will be more significant than the substrate. Tensile residual
stress will be imposed to the coating. The summation of the compressive and thermal stress can
determine the bonding state of the coating [100]. By pre-heating the substrate to an optimal
temperature and then slowly cooling the coating-substrate, delamination can be minimized [64], [91].
The magnitude of coating residual stress can be influenced by the powder material. In a study
conducted by Luzin et al. [64], copper coatings were found to have higher residual stress than aluminum
coatings. Aluminum’s low specific weight results in a lower impact pressure between the particles and
the substrate. This limits the amount of strain and compressive residual stress stored within the coating.
Regarding the coating thickness, it was shown that for thick coatings (>100 µm), the temperature effect
(temperature gradient from the substrate to the top of the coating) induces a significant residual stress
profile through the coating thickness [91], [94], [100]. Similarly, deformation stress from impingement
increase with coating thickness and promote coating delamination [66]. Under those circumstances, the
deposition thickness can be varied by changing the spray parameters to obtain a desired adhesion
strength magnitude.

45
2.4.6 CGDS Parameters
Many CGDS parameters influence the gas flow and coating properties. A thorough review of the main
parameters is presented. Among those variables are the ones related to the process gas type, the
feedstock powder, the nozzle and the substrate.
Process Gas Type, Pressure and Temperature
In CGDS, particle impact velocity is the leading factor for coating formation [101]. Parameters such as
gas type, pressure and temperature tightly govern the particle impacting velocity. In fact, predominance
is given to gas temperature in comparison to pressure for obtaining greater velocities [32], [58].The
choice of gas between N2 and He increased the particle velocity of a given 20 μm copper particle from
500 m/s in N2 to 890 m/s in He (Figure 50) [102].
Figure 50: Copper Particle Conditions at Nozzle Exit [102]
Assadi et al. [8] demonstrated that a higher powder velocity leads to greater flattening and plastic
deformation in copper particles. Deformation ratios (comparison of height and width of deformed
spherical particles) varying from 0.4 to 0.7 were measured following an increase of particle impact
velocity of 400 m/s to 700 m/s [32]. Higher gas pressures and temperatures are correlated to higher gas
velocity and a higher particle impact velocity. More velocity promotes particle penetration in the
substrate. A study of the effect of particle-substrate deformation with propellant gas temperature is
demonstrated in Figure 51. Higher propellant gas temperatures are shown to soften the powder
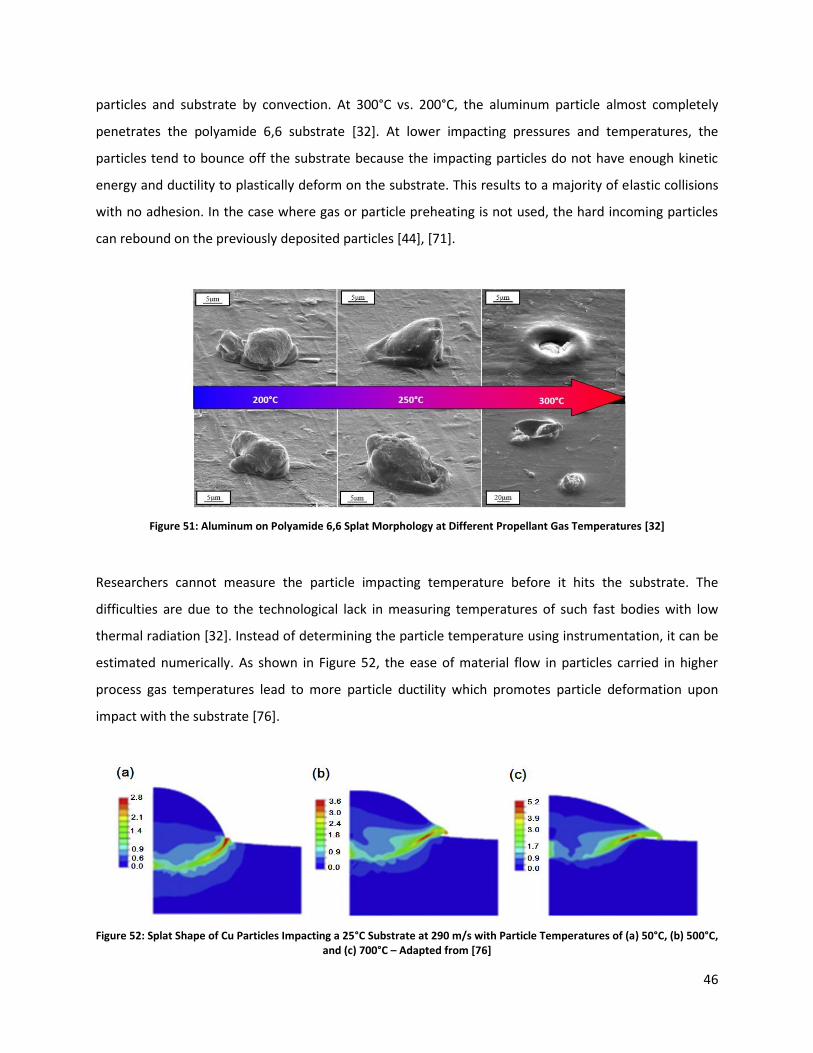
46
particles and substrate by convection. At 300°C vs. 200°C, the aluminum particle almost completely
penetrates the polyamide 6,6 substrate [32]. At lower impacting pressures and temperatures, the
particles tend to bounce off the substrate because the impacting particles do not have enough kinetic
energy and ductility to plastically deform on the substrate. This results to a majority of elastic collisions
with no adhesion. In the case where gas or particle preheating is not used, the hard incoming particles
can rebound on the previously deposited particles [44], [71].
Figure 51: Aluminum on Polyamide 6,6 Splat Morphology at Different Propellant Gas Temperatures [32]
Researchers cannot measure the particle impacting temperature before it hits the substrate. The
difficulties are due to the technological lack in measuring temperatures of such fast bodies with low
thermal radiation [32]. Instead of determining the particle temperature using instrumentation, it can be
estimated numerically. As shown in Figure 52, the ease of material flow in particles carried in higher
process gas temperatures lead to more particle ductility which promotes particle deformation upon
impact with the substrate [76].
Figure 52: Splat Shape of Cu Particles Impacting a 25°C Substrate at 290 m/s with Particle Temperatures of (a) 50°C, (b) 500°C, and (c) 700°C – Adapted from [76]

47
Powder
The size, shape and constituting metallic phases of powder are dominant factors for determining coating
properties. CGDS typically uses sizes of particles between 10 µm to 100 µm of various morphologies
(spherical, dendritic or other) [68]. Images of spherical and dendritic particles are shown in Figure 53.
Figure 53: Magnification of Particles with a (a) Dendritic Shape (SST-C5003), and (b) Spherical Shape (Praxair Cu-159)
Gilmore et al. [103], [104] have shown that particles having a large size and mass will suffer from low
acceleration; leading to a slower velocity. In consequence, this will cause a longer particle exposure in
the propellant gas. With longer exposure times, more heat is transferred to the slower particles. An
adverse effect of having large particles, despite more heat transferred, is they require more heat to
become ductile versus smaller particles [66]. The effect of particle diameter was later confirmed when
titanium particle impact temperatures in function of the particle diameter were numerically calculated
using the Carlson-Hoglund (CH) and Clift (CGW) equations (Figure 54). Larger particles reached lower
temperatures in comparison to smaller particles [32]. Jodoin et al. [103], [105] conducted experiments
with spherical and irregular (dendritic) shaped aluminum particles. They concluded that irregular shaped
particles have a higher drag and presented an increase of 6% to 11% in velocity at the nozzle exit. A
greater possibility of anchoring to the substrate was observed with dendritic particles in comparison
with spherical particles [75], [86]. Despite this, spherical particles can create denser coatings due to
closer contacts possible between spheres in comparison with the voids created between the multiple
dendrites of dendritic particles [32], [36], [68].

48
Figure 54: Simulated Spherical Titanium Particle Temperature (K) vs. Particle Diameter (µm) [32]
The choice of powder material is also critical for obtaining desired coating properties such as electrical
conductivity [95]. For example, copper powders which require more force to accelerate are easily
sprayed because of their high ductility in comparison with harder powders such as nickel [66].
Nozzle
Traverse Speed/Powder Feed Rate
Nozzle traverse speed is the velocity of the nozzle with respect to the substrate. At lower traverse
speeds, more incoming particles are striking a given substrate area per unit time. Increasing the powder
feed rate has similar effect. Generally, the effect of having more incoming particles increases the coating
thickness. Depending on the nature of the incoming particles, impingement effects that promote a
lower coating porosity (more compaction) can be observed [84]. For example, if the incoming material is
hard, as it impacts the surface and possibly bounces back, it will cold work and plastically deform the
previously deposited layer of particles. It is important to understand that at excessive powder feed rates,
the particles in the nozzle flow will not properly fluidize (particle loading effect or saturation) and will
disturb the flow dynamics. In consequence, momentum from the gas will not be sufficient to fully
accelerate the particles to the desired velocity [55]. Additionally, as depicted in Figure 55, the spray
pattern can affect impingement and coating porosity. By overlapping on previously coated areas (grid
and shift pattern) more impinging particles increase coating density in the first deposited layer. In these
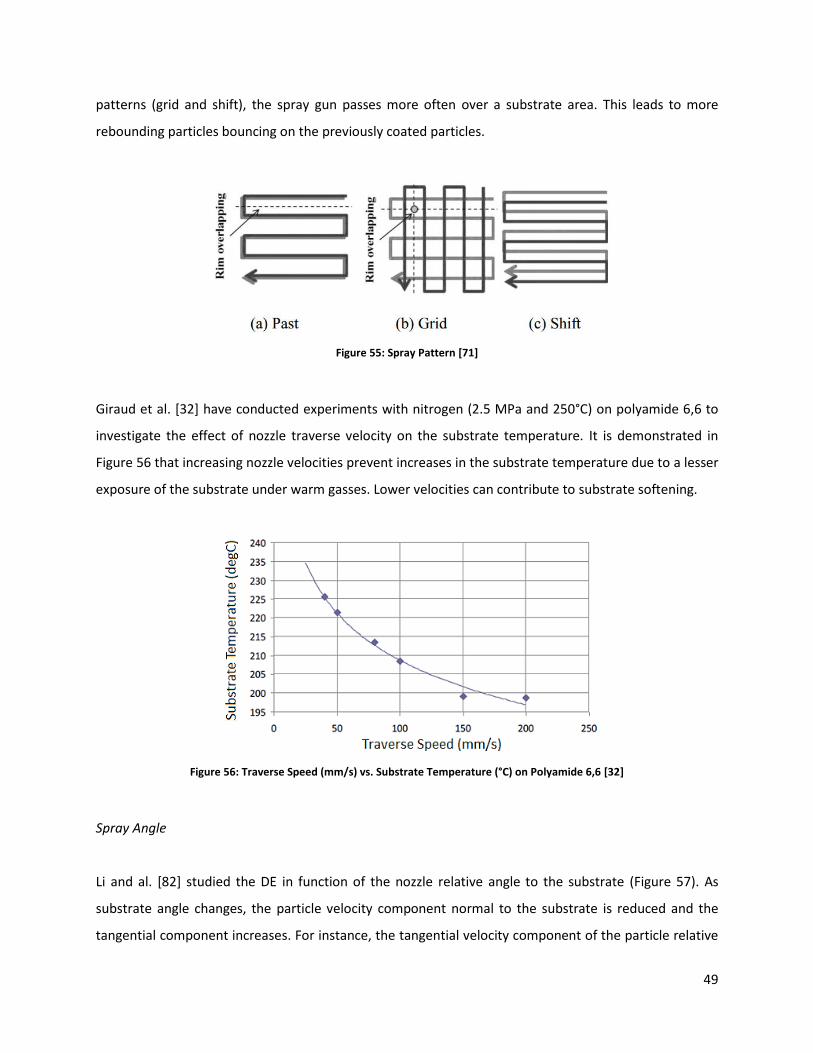
49
patterns (grid and shift), the spray gun passes more often over a substrate area. This leads to more
rebounding particles bouncing on the previously coated particles.
Figure 55: Spray Pattern [71]
Giraud et al. [32] have conducted experiments with nitrogen (2.5 MPa and 250°C) on polyamide 6,6 to
investigate the effect of nozzle traverse velocity on the substrate temperature. It is demonstrated in
Figure 56 that increasing nozzle velocities prevent increases in the substrate temperature due to a lesser
exposure of the substrate under warm gasses. Lower velocities can contribute to substrate softening.
Figure 56: Traverse Speed (mm/s) vs. Substrate Temperature (°C) on Polyamide 6,6 [32]
Spray Angle
Li and al. [82] studied the DE in function of the nozzle relative angle to the substrate (Figure 57). As
substrate angle changes, the particle velocity component normal to the substrate is reduced and the
tangential component increases. For instance, the tangential velocity component of the particle relative

50
to the substrate generates a higher substrate temperature rise due to friction. As the particles move
along the substrate surface, the frictional heat is dissipated in the particle and substrate (promoting
ductility and plastic deformation). On the other hand, even if heat is generated, the tangential velocity
of the particle relative to the substrate prevents the particle to adhere to the substrate. The low normal
component of velocity and the tension generated by the tangential momentum dominate. In
consequence, this results in lower DE for increasing impact angles [8].
Figure 57: Effect of Spray Angles on the Deposition Efficiency of Copper [82]
Stand-off Distance
Stand-off distance (SOD) represents the distance from the nozzle exit to the substrate surface. The DE
decreases with increasing SOD (Figure 58). This can be explained from the fact that the incoming
particles have a longer dwell time in which they can decelerate from the viscous effect of ambient gas
[55]. In a study conducted by Pattison et al. [75], the link between SOD and the particles interaction with
the bow shock for various distances was analysed. For a short SOD, the velocity of small particles is
strongly affected by the bow shock. The high pressure gradient and important gas density increase
through the bow shock led to significant particle deceleration. By increasing the SOD, the bow shock
effect is reduced until it is completely unapparent at a SOD of 60 mm.
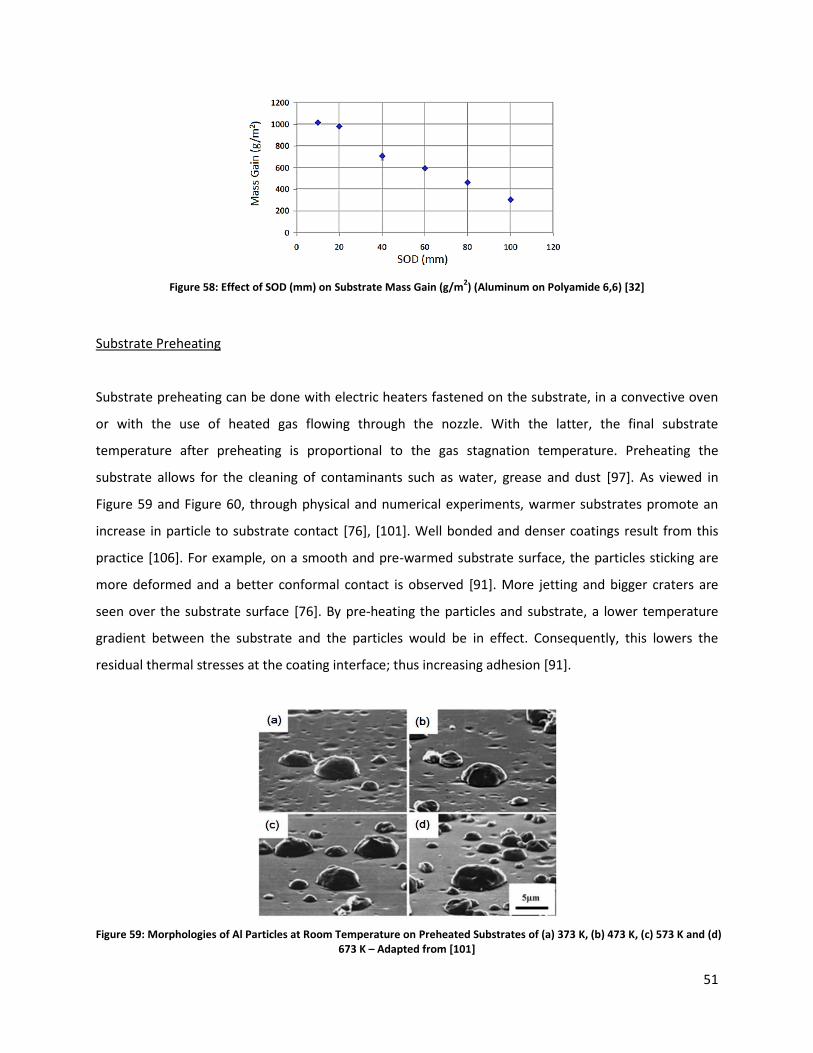
51
Figure 58: Effect of SOD (mm) on Substrate Mass Gain (g/m2) (Aluminum on Polyamide 6,6) [32]
Substrate Preheating
Substrate preheating can be done with electric heaters fastened on the substrate, in a convective oven
or with the use of heated gas flowing through the nozzle. With the latter, the final substrate
temperature after preheating is proportional to the gas stagnation temperature. Preheating the
substrate allows for the cleaning of contaminants such as water, grease and dust [97]. As viewed in
Figure 59 and Figure 60, through physical and numerical experiments, warmer substrates promote an
increase in particle to substrate contact [76], [101]. Well bonded and denser coatings result from this
practice [106]. For example, on a smooth and pre-warmed substrate surface, the particles sticking are
more deformed and a better conformal contact is observed [91]. More jetting and bigger craters are
seen over the substrate surface [76]. By pre-heating the particles and substrate, a lower temperature
gradient between the substrate and the particles would be in effect. Consequently, this lowers the
residual thermal stresses at the coating interface; thus increasing adhesion [91].
Figure 59: Morphologies of Al Particles at Room Temperature on Preheated Substrates of (a) 373 K, (b) 473 K, (c) 573 K and (d) 673 K – Adapted from [101]

52
Figure 60: Splat Shape of 25°C Cu Particles Impacting at 290 m/s Preheated Substrate at Temperatures of (a) 50°C, (b) 500°C, and (c) 700°C – Adapted from [76]
2.4.7 CGDS Advantages and Limitations
As it has been specified previously, CGDS is an advantageous coating process which empowers the user
to tailor a coating’s mechanical properties by varying the spray parameters. In this section, the
advantages and drawbacks of CGDS will be enumerated and explained.
Advantages
CGDS can produce coatings with little to no in-flight oxidation with heat sensitive powders such
as copper. Consequently, the powder’s core microstructure remains intact and similar to the
bulk material. No segregation of the particle alloying elements, grain growth nor the formation
of brittle phases occurs in the particle except in the nanometric layer surrounding the particle.
The low process temperatures used in CGDS in comparison with other warmer techniques result
in minimal coating thermal shrinkage leading to delamination [63], [64], [70], [80].
The process is said to be safe as well as portable because of the low operating temperatures
used. Higher temperature processes generate more thermal radiation and metal vapors [21].
Compared to electroplating, CGDS enables large production rates and is highly efficient. Its low
energy consumption and absence of combustion products make it an environmentally friendly
technique [63].
The powder particles that have not deposited can be recuperated for subsequent coating cycles.
The peening action of impinging particles causes high deformation and increases the density of
the already deposited particles. Cold work and compressive residual stresses in the coating
prevent crack initiation [36].

53
Compared to plasma spray, CGDS coatings are strain hardened and denser [37].
The controlled linear flow in the nozzle permits a material deposition restricted to the exit area
of the nozzle. Unlike other thermal spray processes, no masking is required to coat a small area
of the substrate.
Drawbacks
CGDS does not permit the coating of confined geometries such as small bores.
Hard ceramic material cannot be efficiently deposited due to the low temperatures used in the
process. To obtain reasonable DE, they need to be sprayed with a ductile matrix (ie: alumina
with pure aluminum) so that the hard phases are trapped within the ductile matrix [107].
To increase deposition rates, a large amount of powder needs to be injected in the nozzle. This
quantity of powder can disturb the flow since not all the volume of powder is fluidized with the
carrier gas. As a consequence, the final coating can be porous. Also, nozzle clogging can occur;
specifically at the throat of HPCS systems because the injection point is before the diverging
portion of the nozzle [107].
54
Chapter 3 – Research Objectives
In Chapter 1, it was mentioned that there was a need to manufacture CFRC with a metallic surface.
Developing new metallized composite materials will enable the aerospace industry to save costs through
fuel savings from the overall aircraft weight reduction. Also, it will permit safer flying by dissipating the
electrical current from lightning striking the aircraft skin. This chapter lists the required objectives to
reach in order to produce a high quality metallized composite.
In order to produce a metallized composite for the aerospace industry, CGDS will be used. Other
techniques such as PVD/CVD, hot foil stamping and electroplating/electroless deposition are not
convenient because they are either time consuming, only developed for small two dimension
components or result in low coating to substrate adhesion. Also, since it is impractical to produce CGDS
metallic coatings on CFRC due to the low coating adhesion strength and substrate erosion, the reverse
moulding technique will be developed and used to produce metallic coatings on CFRC. The procedure is
to coat a metallic substrate acting as a mould. Subsequently, the coating will be transferred on a CFRC
during its manufacturing process. More specifically, the main objective is to produce a 75 µm to 125 µm
dense coating on an Invar mould. A CFRC will then be built over the coating. The coating shall be easily
removed from the mould and have a surface resistivity of at most 3 to 5 times the value of pure bulk
copper (1.68 x 10⁻⁸ Ωm) [34].
The following section is divided in three parts. In the first, the likelihood of producing metallized
composites on Invar with different metal powders will be explored. In the second part, with the selected
powder, the CGDS parameters will be optimized to produce a coating with the desired mechanical and
electrical properties. Finally in the last section, the production of components of varying geometry will
be considered.
3.1 Feasibility
The primary phase consists in evaluating the possibility of producing coatings on Invar. Various metallic
powders such as irregular aluminum, spherical copper and dendritic copper will be sprayed on an Invar
substrate. Afterwards, a CFRC will be mounted over the coating and cured in the oven. The achievability

55
to remove the coating/CFRC from the small scaled mould will be evaluated. Once the proof of concept
has been demonstrated, an optimization of the process and an evaluation of the coating properties will
be done.
3.2 Coating, Composite and Mould Properties
In this section, a selection of metallic powder, Invar substrate roughness, coating thickness and CGDS
spray parameters will be made to obtain adequately low adhesion strength between the mould and
coating. Once the parameters are found, the coating properties such as electrical resistivity and
hardness as well as the impact on the mould from coating will be looked at.
3.2.1 Powder and Substrate Roughness Selection
In order to select the desired metallic powder to coat the Invar mould, substrate to coating adhesion
tests for varying substrate roughness will be carried. Three powders (irregular aluminum, spherical
copper and dendritic copper) will be CS on as machined and grit blasted (with 80 grit alumina and 20 grit
silicon oxide particles) substrates (Figure 61). The coating thickness will remain constant for all sprays.
Based on the lowest adhesion strength between the substrate and coating, a single powder and surface
roughness will be chosen. Subsequently, coating electrical resistivity and hardness measurements will be
taken. The resistivity value obtained from the coating obtained by the selected powder needs to be in
the range specified by The Boeing Company (5.04 x 10⁻⁸ Ωm to 8.40 x 10⁻⁸ Ωm). In addition, an
investigation of the mould surface after removal of the coating will be done. With microscopy and
imaging techniques, a value will be computed for the fraction of the mould covered by imbedded
powder particles that have remained on the mould after the removal of the coating. Post-coating
removal substrate roughness measurements will also be taken.

56
Figure 61: Project Spray Plan Using Three Substrate Preparation Methods and Three Feedstock Powders
3.2.2 Spray Parameter Optimization
A Taguchi parametric analysis will be conducted to obtain the optimal spray parameters and coating
thickness to minimize coating to mould adhesion. Sprays will be conducted at various gas stagnation
temperatures and pressures for different coating thicknesses. After obtaining the desired gas pressure,
gas temperature and coating thickness, parameters such as gun traverse velocity and powder feed rate
will be compared to coating properties. Once again, the percentage of the surface covered by wedged
powder particles will be calculated.
3.2.3 Metallized Composite Characterisation
With the optimized spray parameters, metallized composite samples will be produced in order to be
tested mechanically and chemically. A four point bending test and a composite to metal bond test will
mechanically define the adhesion between the metal coating and the CFRC. In parallel, a salt fog
corrosion test and hardness test will be conducted on the produced metallized composite samples.
These tests will qualitatively define the corrosion and mechanical behavior of the components.
3.2.4 Invar Mould Characterisation
Under the circumstance that adequate metallized components can be produced, the mould to coating
behavior from the production of multiple components with the same mould will be investigated. For the

57
mould, the change of surface roughness and the accumulation of wedged particles from various usage
will be monitored. The change in mould surface finish will be investigated to ensure consistent coatings
can be produced after multiple uses of the mould. Moreover, the adhesion strength between the mould
and the coating will be evaluated as the mould is reused. If the Invar surface properties change from
multiple sprays, a method to re-establish the mould surface finish will be developed. Either with
chemical or mechanical techniques, imbedded particles in the mould will be removed without further
damaging it.
3.3 Production
Once the feasibility and production of small scale components is demonstrated, larger and more
complex parts will be manufactured. Alternate mould geometries such as concave/convex shapes and
angled profiles will be used to produce metallized composites. As well, linear spray patterns on the Invar
mould enabling the production of metallized patterns on the CFRC will be tested. Figure 62 outlines the
project’s work phases before the production of metallized composite patterned and shaped
components.
Figure 62: Research Objectives Test Plan

58
Chapter 4 – Experimental Equipment, Measurement Methods and
Procedures
The University of Ottawa Cold Spray Laboratory is equipped with state of the art CGDS coating
production equipment and material characterization tools. This chapter will cover the general procedure
along with the necessary apparatus required to produce and characterize metallized CFRC. More
specifically, in the first part, the feedstock powders used and substrate preparation methods will be
presented. The CGDS system and de Laval nozzle assembly will then be described. Subsequently,
manufacturing method used to produce metallized CFRC will be detailed. Finally, various analysis
techniques required for a full characterization of the produced components will be explained along with
details on the physical and chemical tests done on the coated CFRC.
4.1 Feedstock Powders Characterization
Three commercially available metallic feedstock powders, having different chemical composition and/or
shape, will be used to try producing coatings on the Invar mould. Based on the produced coating
properties, a single powder will be selected for further parameter optimization. Powders are stored in
sealed containers located in a fireproof cabinet. This cabinet keeps the powder at a constant
temperature (50°C) and at low humidity levels. In this section, the chemical content and morphology of
the particles will be discussed.
4.1.1 Centerline Pure Aluminum (SST-A5001)
This irregularly shaped aluminum powder is supplied by Centerline Ltd. under the product code SST-
A5001. It is produced by water atomization which results in elongated particle shapes. A nanometric
aluminum oxide scale, a consequence of the manufacturing process and oxygen exposure, surrounds the
particles. Despite of some oxide content, the production process quality control ensures a minimum
purity of 99.5wt%. From the powder chemical analysis performed by the vendor, the powder’s impurity
constituents are presented in Table 2 [108].

59
Table 2: SST-A5001 Impurity Constituents[108]
Constituent Content (wt%)
Silicon as Si 0.04
Iron as Fe 0.01
Gallium as Ga 0.02
An image of the as-received aluminum powder can be seen in Figure 63. The particle shape and size is
not uniform. By using a laser diffraction particle size analysis device (Model S3500 from Microtrac) a
powder size distribution was obtained (Figure 64). The analysis demonstrates that the size
approximately ranges from 8 µm to 124 µm for mean values (90% of mass) ranging from 22 µm to 31
µm.
Figure 63: SEM Image of Centerline SST-A5001 Pure Aluminum Powder

60
Figure 64: SST-A5001 Microtrac Particle Size Distribution
4.1.2 Centerline Pure Copper (SST-C5003)
This copper powder is supplied by Centerline Ltd. under the product name SST-C5003. Its dendritic
shape is an indicator that it was manufactured by electrolytic forming. Despite of some oxide content,
the production process quality control ensures a minimum purity of 99.7wt%. As seen in Figure 65, the
SEM observation shows that the powder is highly branched and has a rough outer surface. As per ASTM
B417 and ASTM B212, the density of the powder was measured by the distributor to be 2.07 g/cm3 [108].
To further characterize the powder, they conducted a size distribution test (ASTM B214). The sieve
results are presented in Table 3 and demonstrate that the majority (90% of mass) of the particle are
below 44 µm; confirming the range (5 µm to 45 µm) specified by the distributor.
Figure 65: SEM Image of Centerline SST-C5003 Pure Copper Powder

61
Table 3: SST-C5003 Sieve Analysis
Size (µm) Content (wt%)
Size<44 90.10
44<Size<74 8.50
74<Size<149 1.38
Size>149 0.00
4.1.3 Praxair Surface Technologies Pure Copper (Cu-159)
This spherical copper powder is supplied by Praxair Surface Technologies under the product name Cu-
159.It has a spherical shape and was produced using gas atomization. Despite some oxide content, the
production process quality control ensures a minimum purity of 99.8wt% with 0.03wt% of O2. As seen in
Figure 66, the SEM observation shows the round shape uniformity. In addition, the Microtrac analysis
(Table 4) revealed that the particle size ranges from 6 µm to 31 µm. The average particle diameter (90%
of mass) is 20 µm.
Figure 66: SEM Image of Praxair Cu-159 Pure Copper Powder

62
Table 4: Praxair Cu-159 Sieve Analysis
Size (µm) Content (wt%)
Size<6 <1
6<Size<31 98
Size>31 <1
4.2 Invar Surface Preparation
From the information gathered in the literature, the surface finish of a substrate has a critical
importance in coating adhesion [90], [91]. This current section lists the steps to obtain Invar substrates
of various shapes and surface roughness. In addition, the pre-spray Invar surface cleaning process will be
explained.
4.2.1 Cutting and Surface Grinding Procedure
Starting with 25 mm thick Invar plates, test samples needed to be cut to appropriate dimensions. Flat
substrates were cut with a water jet cutting machine while wire electric discharge machining (EDM) was
used to cut the curved pieces to shape. The apparatus shown in Figure 67 uses an electric current fed
through a wire to locally heat the plate, thus cutting it. Precise shapes and radii of curvatures can be
programmed in this automated machine. As an example, a curved piece cut by EDM is shown in Figure
68.
Figure 67: Wire EDM

63
Figure 68: Curved Invar Substrate
Once the samples are cut to the desired length and width, the surface is ground with a surface grinder
(Model NB from Churchill) (Figure 69). A magnetic table, on which Invar adheres, moves in the X-Y plane
below the rotating grinding wheel (SiC 46 grit AA60-N6-V10 from Carborundum).
Figure 69: Churchill Model NB Surface Grinder (Left) and Grinding Head with Wheel (Right)
4.2.2 Grit Blasting Procedure
If needed for the testing procedure, a grit blasting step is done to obtain a desired sample surface
roughness. By loading various sizes of abrasive grit in a blasting gun (Gravity Fed Sandblaster by Power
Fist) (Figure 70), a rough surface can be produced. Depending on the adjusted inlet gas pressure, the

64
degree of grit impingement can vary. The angle of the gun to the substrate and the exposure time under
impinging grit also affects the roughness. For this study, an angle between the gun and the substrate of
45° was maintained to reduce grit embedment.
Figure 70: Dedicated Grit Blasting Chamber
Grit Particle Characterization
Two grits were used to roughen the Invar surface. Both grits were observed under the SEM (Figure 71
and Figure 72). Table 5 details the grit composition of the 80 grit brown fused aluminum oxide (V-Blast
from GMA Industries) and 20 grit iron oxide (Ebonygrit from Opta Minerals).

65
Figure 71: SEM Image of 80 Grit Aluminum Oxide
Figure 72: SEM Image of 20 Grit Iron Oxide
Table 5: Abrasive Grit Weight Composition [109], [110]
V-Blast (80 grit) (wt%) Ebonygrit (20 grit) (wt%)
Fe2O3 0.1 to 1.5 53 to 60
SiO2 0.0 to 1.0 37
Al2O3 92.0 to 95.6 3 to 6
CaO - 1 to 3
MgO - 1 to 2
Zn - <1
TiO2 1.0 to 4.0 -
Quartz - 0
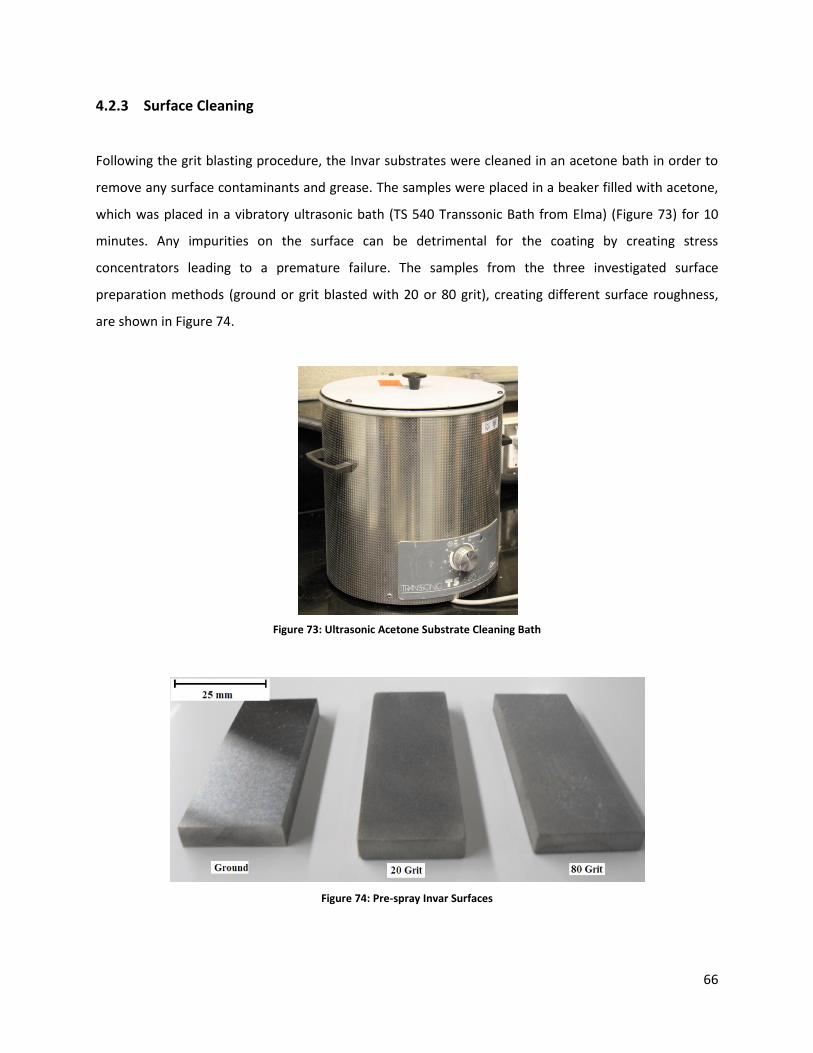
66
4.2.3 Surface Cleaning
Following the grit blasting procedure, the Invar substrates were cleaned in an acetone bath in order to
remove any surface contaminants and grease. The samples were placed in a beaker filled with acetone,
which was placed in a vibratory ultrasonic bath (TS 540 Transsonic Bath from Elma) (Figure 73) for 10
minutes. Any impurities on the surface can be detrimental for the coating by creating stress
concentrators leading to a premature failure. The samples from the three investigated surface
preparation methods (ground or grit blasted with 20 or 80 grit), creating different surface roughness,
are shown in Figure 74.
Figure 73: Ultrasonic Acetone Substrate Cleaning Bath
Figure 74: Pre-spray Invar Surfaces

67
4.3 CGDS Equipment
To produce metallic coatings over the mould surface, a commercially available CGDS system was
employed. The CGDS system is composed of a control cabinet, a gas pre-heater, a de Laval nozzle and an
enclosed cabinet. It will be described in detail. The following paragraphs will also explain the injection of
metallic powders in a de Laval nozzle using a powder feeder.
4.3.1 System Overview
The Centerline SST Extra Pressure (EP) LPCS system is shown in Figure 75. It is composed of a
pressure/temperature control cabinet, spraying area enclosure, water powder filter and controller. The
control cabinet (Figure 76) regulates the stagnation pressure and temperature of the gas flowing
through the nozzle.
Figure 75: Centerline SST-EP-LPCS System
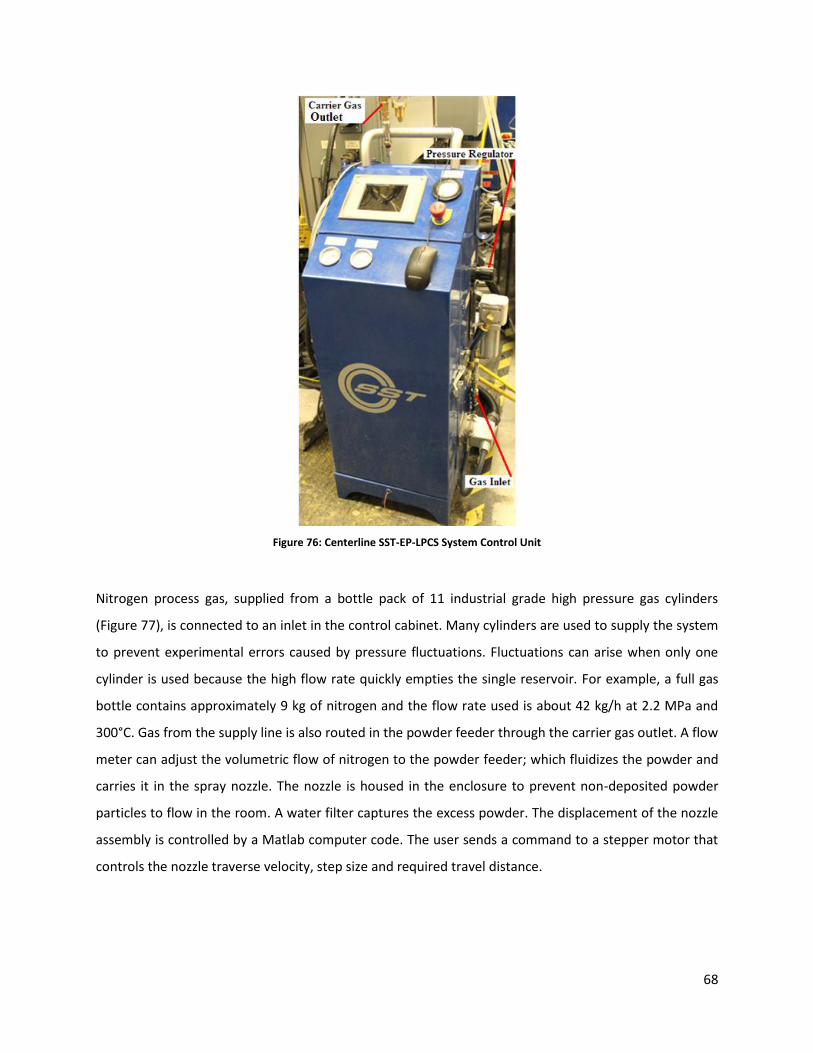
68
Figure 76: Centerline SST-EP-LPCS System Control Unit
Nitrogen process gas, supplied from a bottle pack of 11 industrial grade high pressure gas cylinders
(Figure 77), is connected to an inlet in the control cabinet. Many cylinders are used to supply the system
to prevent experimental errors caused by pressure fluctuations. Fluctuations can arise when only one
cylinder is used because the high flow rate quickly empties the single reservoir. For example, a full gas
bottle contains approximately 9 kg of nitrogen and the flow rate used is about 42 kg/h at 2.2 MPa and
300°C. Gas from the supply line is also routed in the powder feeder through the carrier gas outlet. A flow
meter can adjust the volumetric flow of nitrogen to the powder feeder; which fluidizes the powder and
carries it in the spray nozzle. The nozzle is housed in the enclosure to prevent non-deposited powder
particles to flow in the room. A water filter captures the excess powder. The displacement of the nozzle
assembly is controlled by a Matlab computer code. The user sends a command to a stepper motor that
controls the nozzle traverse velocity, step size and required travel distance.
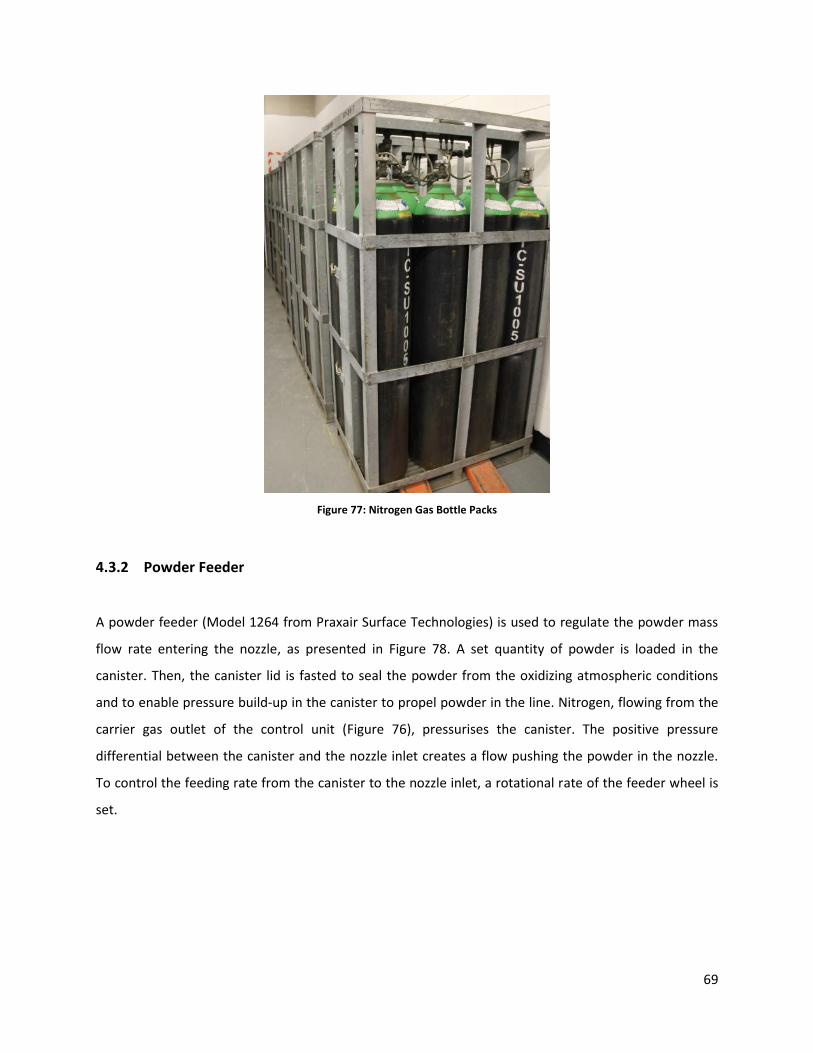
69
Figure 77: Nitrogen Gas Bottle Packs
4.3.2 Powder Feeder
A powder feeder (Model 1264 from Praxair Surface Technologies) is used to regulate the powder mass
flow rate entering the nozzle, as presented in Figure 78. A set quantity of powder is loaded in the
canister. Then, the canister lid is fasted to seal the powder from the oxidizing atmospheric conditions
and to enable pressure build-up in the canister to propel powder in the line. Nitrogen, flowing from the
carrier gas outlet of the control unit (Figure 76), pressurises the canister. The positive pressure
differential between the canister and the nozzle inlet creates a flow pushing the powder in the nozzle.
To control the feeding rate from the canister to the nozzle inlet, a rotational rate of the feeder wheel is
set.
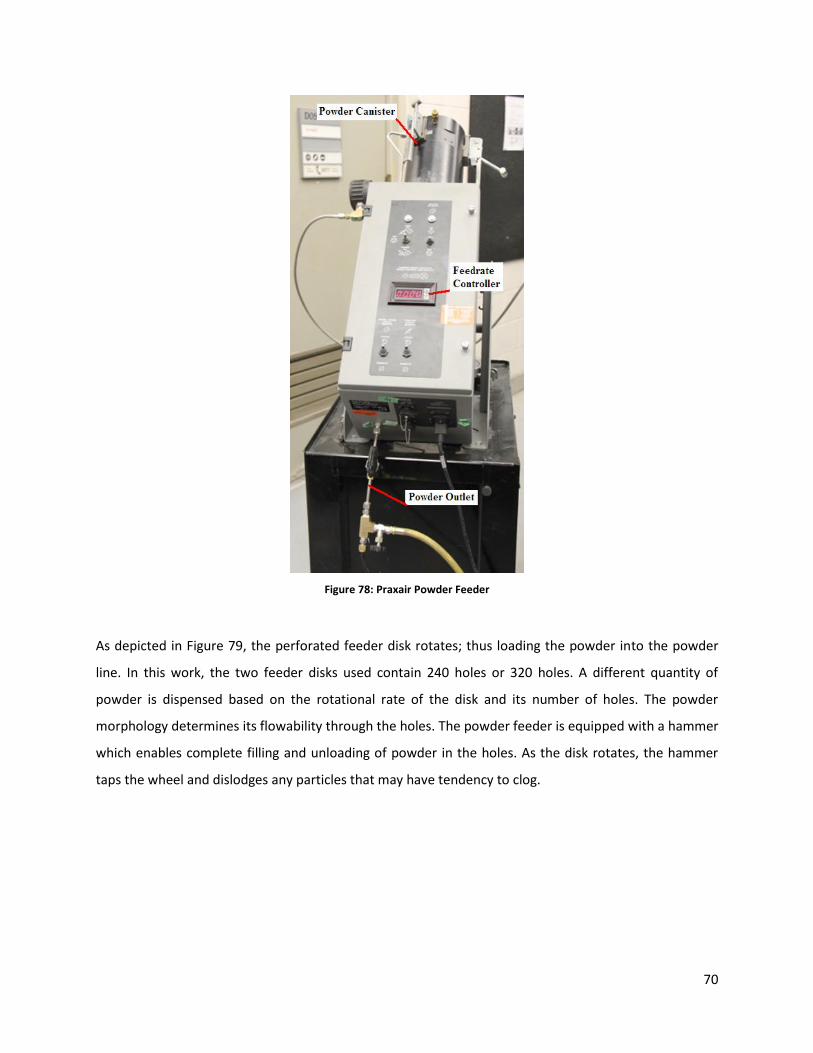
70
Figure 78: Praxair Powder Feeder
As depicted in Figure 79, the perforated feeder disk rotates; thus loading the powder into the powder
line. In this work, the two feeder disks used contain 240 holes or 320 holes. A different quantity of
powder is dispensed based on the rotational rate of the disk and its number of holes. The powder
morphology determines its flowability through the holes. The powder feeder is equipped with a hammer
which enables complete filling and unloading of powder in the holes. As the disk rotates, the hammer
taps the wheel and dislodges any particles that may have tendency to clog.

71
Figure 79: Praxair Powder Feeder Detailed View
4.3.3 De Laval Nozzle
Two nozzles of different geometric profile and material are used to produce coatings. For the copper
feedstock powder, a stainless steel nozzle with a 2 mm brass orifice was used (Figure 80). A Centerline
SST-UltiFlow polymer nozzle with a 2 mm orifice was employed for aluminum (Figure 81). As the powder
enters the nozzle orifice and is accelerated in the flow, it can bounce and erode the nozzle walls.
Stainless steel offers a better erosion resistance towards the harder copper powder in comparison with
polybenzimidazole (PBI) which is used for aluminum. PBI is used due to the ductile nature of aluminum
which leads to intra-nozzle particle deposition and clogging in the stainless steel nozzle.
Figure 80 Disassembled de Laval Metal Nozzle Showing, From Left to Right, Stainless Steel Nozzle, Tightening Nut, Tightening Collet, Brass Orifice and Heater Nut [111]

72
Figure 81: Disassembled de Laval Plastic Nozzle Showing, From Left to Right, Plastic Nozzle, Quick Connect Cap, Spring, Orifice and Heater Nut [111]
Both nozzles are simply screwed in the gas heater outlet (Figure 82) and fastened with the heater nut.
The gas heater, powder pre-heater and nozzle are mounted on a stepper motor which can control the
nozzle velocity, acceleration and X-Y plane spatial displacement. The powder pre-heater was not used in
this study. The carrier gas heater is comprised of an insulated tube in which electrical resistances heat
the supply high pressure gas to the desired stagnation temperature. The SOD is adjusted by elevating or
lowering a jack on which the substrate is fastened with a thermally insulted vise. With CFRC plates
surrounding the substrate in the vise, heat from the carrier gas will not be transferred to the vice/jack
assembly.
Figure 82: Nozzle Assembly Setup
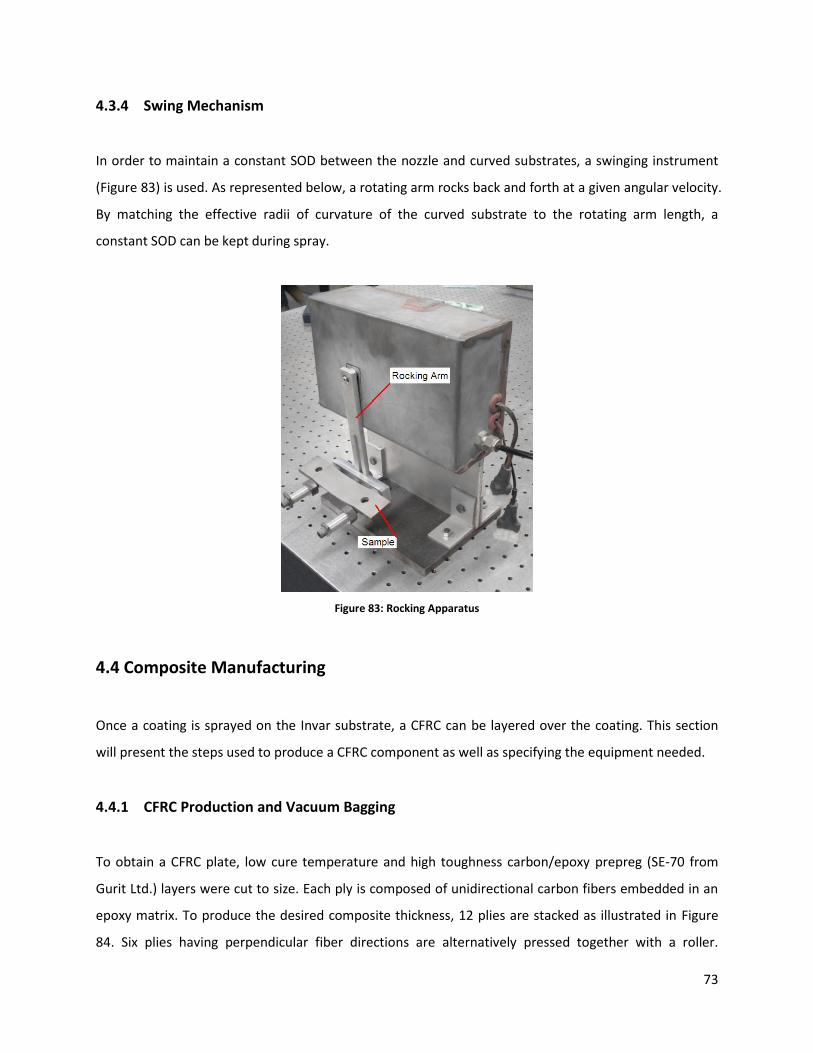
73
4.3.4 Swing Mechanism
In order to maintain a constant SOD between the nozzle and curved substrates, a swinging instrument
(Figure 83) is used. As represented below, a rotating arm rocks back and forth at a given angular velocity.
By matching the effective radii of curvature of the curved substrate to the rotating arm length, a
constant SOD can be kept during spray.
Figure 83: Rocking Apparatus
4.4 Composite Manufacturing
Once a coating is sprayed on the Invar substrate, a CFRC can be layered over the coating. This section
will present the steps used to produce a CFRC component as well as specifying the equipment needed.
4.4.1 CFRC Production and Vacuum Bagging
To obtain a CFRC plate, low cure temperature and high toughness carbon/epoxy prepreg (SE-70 from
Gurit Ltd.) layers were cut to size. Each ply is composed of unidirectional carbon fibers embedded in an
epoxy matrix. To produce the desired composite thickness, 12 plies are stacked as illustrated in Figure
84. Six plies having perpendicular fiber directions are alternatively pressed together with a roller.

74
Manual compaction with the roller ensures that entrapped air bubbles between the plies are eliminated.
It also ensures good adhesion. Two stacks of 6 plies are then pressed to one another with the middle
plies in the same fiber orientation. The symmetry within the stack equilibrates the thermal residual
stress developed between the plies during the curing phase. The stack of 12 plies is then glued to the
metallic coating using an adhesive glass fiber layer (SA-70 from Gurit Ltd.).
Figure 84: Stacking Process for CFRC with a) Prepreg Stacking Plies with Mid Plane Symmetry and b) Compacted Prepreg Stack [24]
The next step is to set the prepreg stack, bonded to the coated Invar mould, on an aluminum tool used
in the curing process. To ensure that no excess epoxy drips and adheres to the tool, the aluminum base
is protected with release film (polymer lining sheet). In addition, the composite is covered with a
perforated film and bleeder material. Both of the layers permit air to flow out of the bag (Dahlar release
bag 125 from Airtech International) and prevent the flow of impurities that could damage the
diaphragm vacuum pump (DAA-V715A-EB from Gast). As seen in Figure 85, the whole configuration is
covered by a film held by high temperature sealant tape (SM 5126 Tacky Tape from Schnee-Morehead
Inc.). Figure 86 illustrates the in-oven tool setup where a valve connected to the vacuum pump (Figure
87) removes any excess air within the bag.
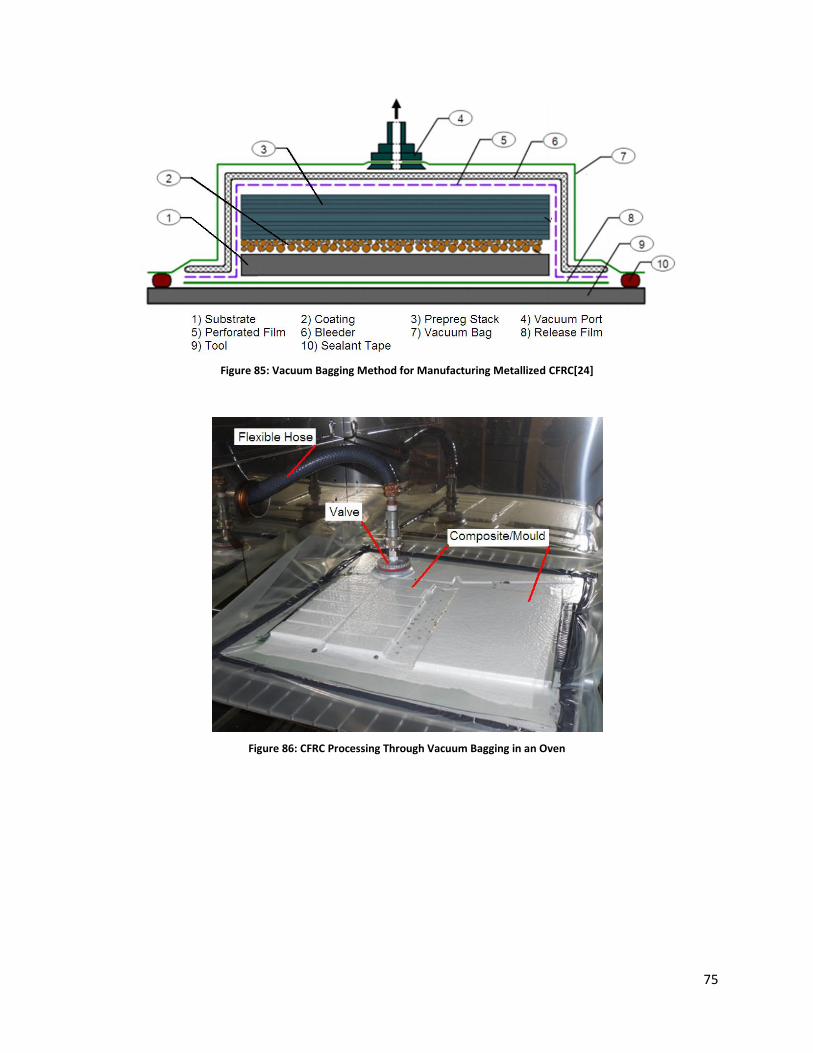
75
Figure 85: Vacuum Bagging Method for Manufacturing Metallized CFRC[24]
Figure 86: CFRC Processing Through Vacuum Bagging in an Oven

76
Figure 87: Gast DAA-V715A-EB Diaphragm Vacuum Pump
4.4.2 Curing
An oven (PF120 from Carbolite Inc.) (Figure 88) is used to reach the CFRC curing temperature. The
prepreg stack with Invar mould is heated at a rate of 2°C per minute until it reaches a dwelling
temperature of 120°C. The temperature is then kept constant for 1 hour and finally ramped down at a
rate of 5°C per minute until room temperature is reached.
Figure 88: Carbolite PF120 Curing Oven

77
4.4.3 Metallized Composite Removal from Mould
The metallized CFRC can easily be removed from the mould (Figure 89) by prying the coating and CFRC
with a screw driver. As shown in Figure 90, the mould it set in a vise and a flat head screw driver applies
a force required to detach the component (Figure 91) from the Invar substrate.
Figure 89: Mould/Metallic Composite Assembly
Figure 90: Metallic CFRC Removal Method
Figure 91: Removed Metallic Composite from Mould
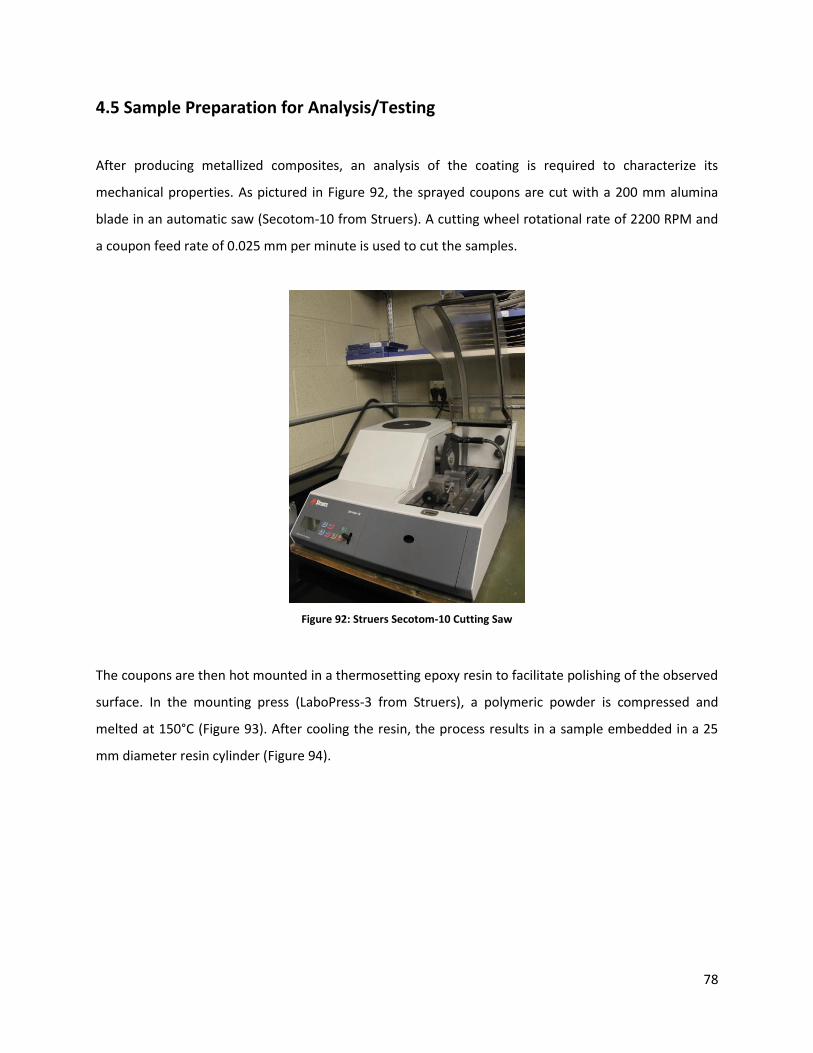
78
4.5 Sample Preparation for Analysis/Testing
After producing metallized composites, an analysis of the coating is required to characterize its
mechanical properties. As pictured in Figure 92, the sprayed coupons are cut with a 200 mm alumina
blade in an automatic saw (Secotom-10 from Struers). A cutting wheel rotational rate of 2200 RPM and
a coupon feed rate of 0.025 mm per minute is used to cut the samples.
Figure 92: Struers Secotom-10 Cutting Saw
The coupons are then hot mounted in a thermosetting epoxy resin to facilitate polishing of the observed
surface. In the mounting press (LaboPress-3 from Struers), a polymeric powder is compressed and
melted at 150°C (Figure 93). After cooling the resin, the process results in a sample embedded in a 25
mm diameter resin cylinder (Figure 94).

79
Figure 93: Struers LaboPress-3 Mounting Press
The finishing step, in which the produced puck is polished to allow microscopic inspection, is done with a
polishing machine (TegraPol-31, TegraForce-5, and TegraDoser-5 from Struers). As observed in Figure 95,
a rotating sample holder is held over a rotating polishing wheel. Depending on the coating material, the
polishing steps (wheels, time and solution) vary. The goal is to use progressively finer polishing wheels
and solution to obtain a smooth finish of the analysed surface. The ultimate step uses a solution (OPS
from Struers) containing 0.04 µm silica particles to polish the surface. Between each polishing step, a
typical good practice is to clean the polished surface with soapy water to remove impurities and to dry it
with compressed air. If the surface is not smooth enough for microscopic imaging, the polishing steps
can be re-done.
Figure 94: Embedded Sample in Polymeric Resin

80
Figure 95: Struers TegraPol-31 Polishing Machine
4.6 Sample Analysis/Testing
A series of tests such as coating thickness measuring, microstructure examination, substrate roughness
measurements, as well as coating adhesion, electrical resistivity, hardness and corrosion will be done.
4.6.1 Coating Thickness
An electronic gauge (Model 456 from Elcometer) (Figure 96) is employed to evaluate the coating
thickness of non-magnetic metals such as copper and aluminum on magnetic substrates like Invar.
Simply by pressing the probe on the coating surface at multiple locations, an average layer thickness can
be obtained. There is no need of observing the coated substrate with a microscope to determine the
coating thickness. It can be done immediately after coating production. As such, the spray parameters
influencing coating thickness can be varied in the same spray session in order to obtain the desired
thickness.

81
Figure 96: Elcometer Model 456 Coating Thickness Gauge
4.6.2 Microstructure
Optical and electron microscopy techniques are commonly used to observe coating porosity, defects
and cracks in addition to qualitatively examining particle to substrate bonding. Prior to using SEM, the
surface to be examined needs to be covered by a thin layer of gold using a gold sputter machine (Denton
Vacuum Desk IV from Parker) (Figure 97). The gold ensures a dissipation of the accumulating electric
charges of the incoming electrons in the SEM. A building of charges on the sample will distort the image
and make it unclear.
Figure 97: Parker Denton Vacuum Desk IV Gold Sputter Machine

82
Subsequently, the samples are observed in the SEM (EVO MA 10 from Zeiss) (Figure 98) equipped with
secondary electron (SE), back-scattered electron (BSE), energy dispersive spectroscopy (EDS), electron
backscatter diffraction (EBSD) and X-ray computer tomography (CT) detectors. In SEM, electrons are
used rather than light to reconstruct an image of the coating at various magnifications.
Figure 98: Zeiss EVO MA 10 SEM Microscope
For superficial visualisation, a regular optical microscope (NMM-800TRF from Kingdak) (Figure 99)
equipped with a user interface image analysis software (Vision Lite105 from Clemex) is frequently used.
The images resulting from the optical analysis are less magnified but can provide the required
information.
Figure 99: Kingdak NMM-800TRF Optical Microscope

83
4.6.3 Substrate Surface Roughness
In view of calculating the surface roughness of the Invar mould before CS and after the removal of the
coating, a digital three dimension microscope (VHX-2000 from Keyence) (Figure 100) is used. This
apparatus has a vertical and horizontal moving stage on which the sample rests. As the stage moves
vertically at increments of 1 µm, the microscope automatically focuses the image. With a magnification
of 500 times, a three dimensionnal image of the surface can be reconstructed. This technique is know as
‘‘depth from defocus image reconstruction’’. From the image, a software (Communication from Keyence)
generates a height mapping array of the surface to calculte the Ra roughness. In the following equation,
𝑅𝑎 =1
𝑛 |𝑛
1 yi| (10)
the Ra roughness (µm) is the sum of the absolute height deviation of data points from the surface mean
height [112]. A good average of the surface roughness can be obtained because an array of 1200 by
1200 data points can be sampled from 600 μm by 500 μm images. It is to note that due to the tilt (slope
of the X-Y plane) of the substrate surface from machining imperfections, the height data points need to
be adjusted accordingly. The slopes are factored for every column and row of data in the array;
corresponding to surface heights along vertical or horizontal traces on the substrate.
Figure 100: Keyence VHX Digital Three Dimension Microscope

84
4.6.4 Particles on Substrate
After removing the metallized CFRC from the mould, an analysis of the substrate surface composition is
needed. The analysis is conducted since embedded metallic particles dislodged from the coating can
remain embedded in the substrate. The percentage of the area of the substrate covered by embedded
particles can be determined in two ways. First, with SEM, an EDS surface composition analysis can
determine the metallic percentage of aluminum or copper left on Invar. EDS, being more time
consuming, will be used to quantify the substrate once all the coating parameter are set. The second
option, faster but less precise, is to obtain an image of the substrate surface at a magnification of 500
times with the three dimension microscope. Subsequently, with an imaging software (VHX-2000
Communication from Keyence), the color codes of copper or aluminum can be extracted from the image.
Based on the percentage of pixels of aluminum or copper in comparison with the number of pixel of the
whole surface (Invar), a surface coverage percentage of embedded particles can be determined.
4.6.5 Coating Adhesion Strength
In order to quantify the adhesion strength of a coating on Invar or CFRC, a portable adhesion tensile
testing instrument (PATTI) is used. With the PosiTest AT-A from DeFelsko, a tensile test is performed as
per ASTM D4541. A 20 mm diameter pull-stub is glued to the top surface of the coating. Any excess glue
or coating surrounding the pull-stub is removed with a boring drill bit. Glue or coating around the pull-
stub will falsify the tensile adhesion strength value because it will create a shear stress component as
the pull-stub is pulled away from the base. As captured in Figure 101 (right), the machine head clamps
around the pull-stub. Upon activation of the device, a mechanism in the head hydraulically pulls the pull-
stub at a rate of 0.3 MPa per second until delamination of the coating or glue failure. The setup prior to
testing is showed in Figure 102.

85
Figure 101: DeFelsko PosiTest AT-A Adhesion Test Apparatus
Figure 102: Pull-stub Glued to Coating
4.6.6 Four Point Bending
Beyond the PATTI adhesion test, a four point bending test allows to qualitatively investigate the degree
of bonding between the coating and CFRC. As depicted in Figure 103, a bending rig was placed in a
Series 4482 Instron (Figure 104) having a 100 kN load cell. The coupons to be tested were measured
(7.75 mm wide and 2.60 mm thick) and placed coating face down in the setup.
Figure 103: Four Point Bending Rig
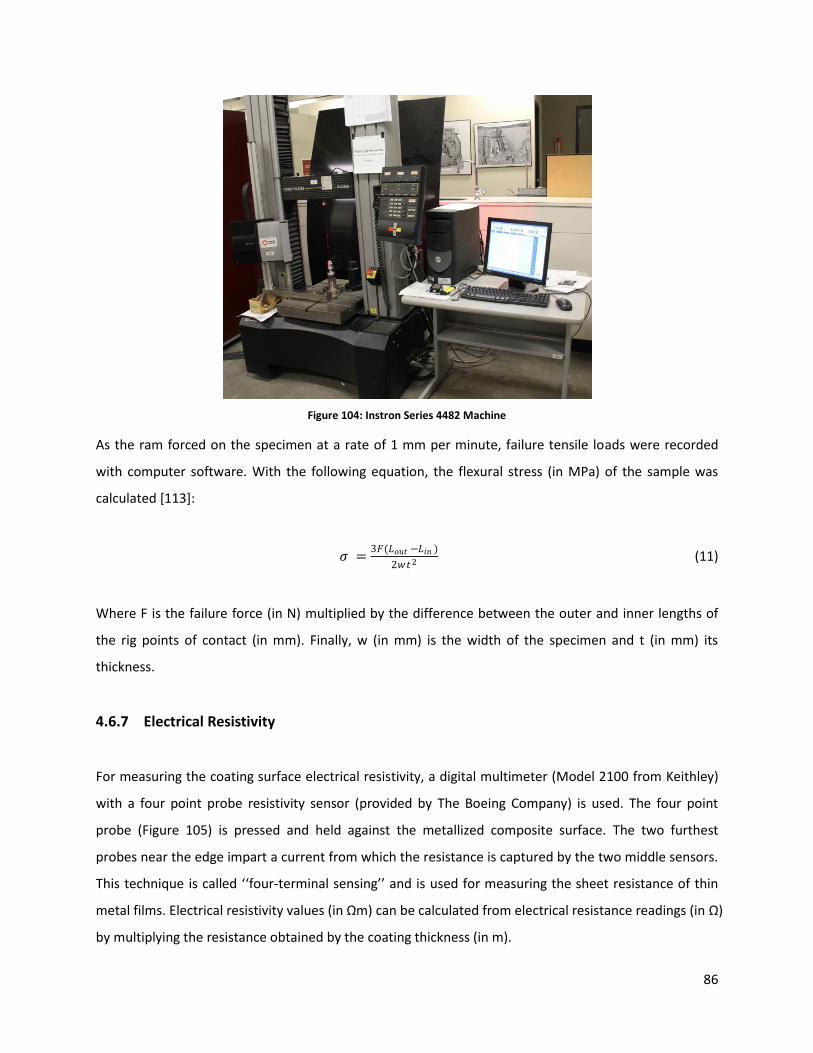
86
Figure 104: Instron Series 4482 Machine
As the ram forced on the specimen at a rate of 1 mm per minute, failure tensile loads were recorded
with computer software. With the following equation, the flexural stress (in MPa) of the sample was
calculated [113]:
𝜎 =3𝐹(𝐿𝑜𝑢𝑡 −𝐿𝑖𝑛 )
2𝑤𝑡2 (11)
Where F is the failure force (in N) multiplied by the difference between the outer and inner lengths of
the rig points of contact (in mm). Finally, w (in mm) is the width of the specimen and t (in mm) its
thickness.
4.6.7 Electrical Resistivity
For measuring the coating surface electrical resistivity, a digital multimeter (Model 2100 from Keithley)
with a four point probe resistivity sensor (provided by The Boeing Company) is used. The four point
probe (Figure 105) is pressed and held against the metallized composite surface. The two furthest
probes near the edge impart a current from which the resistance is captured by the two middle sensors.
This technique is called ‘‘four-terminal sensing’’ and is used for measuring the sheet resistance of thin
metal films. Electrical resistivity values (in Ωm) can be calculated from electrical resistance readings (in Ω)
by multiplying the resistance obtained by the coating thickness (in m).
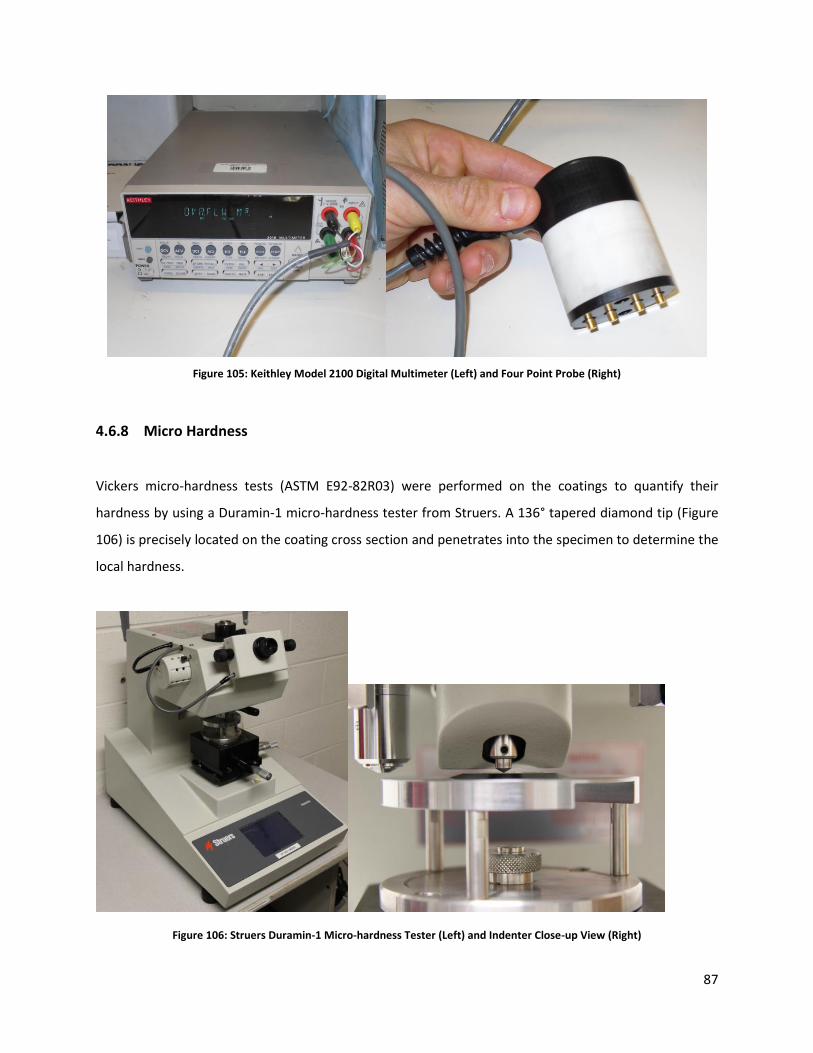
87
Figure 105: Keithley Model 2100 Digital Multimeter (Left) and Four Point Probe (Right)
4.6.8 Micro Hardness
Vickers micro-hardness tests (ASTM E92-82R03) were performed on the coatings to quantify their
hardness by using a Duramin-1 micro-hardness tester from Struers. A 136° tapered diamond tip (Figure
106) is precisely located on the coating cross section and penetrates into the specimen to determine the
local hardness.
Figure 106: Struers Duramin-1 Micro-hardness Tester (Left) and Indenter Close-up View (Right)
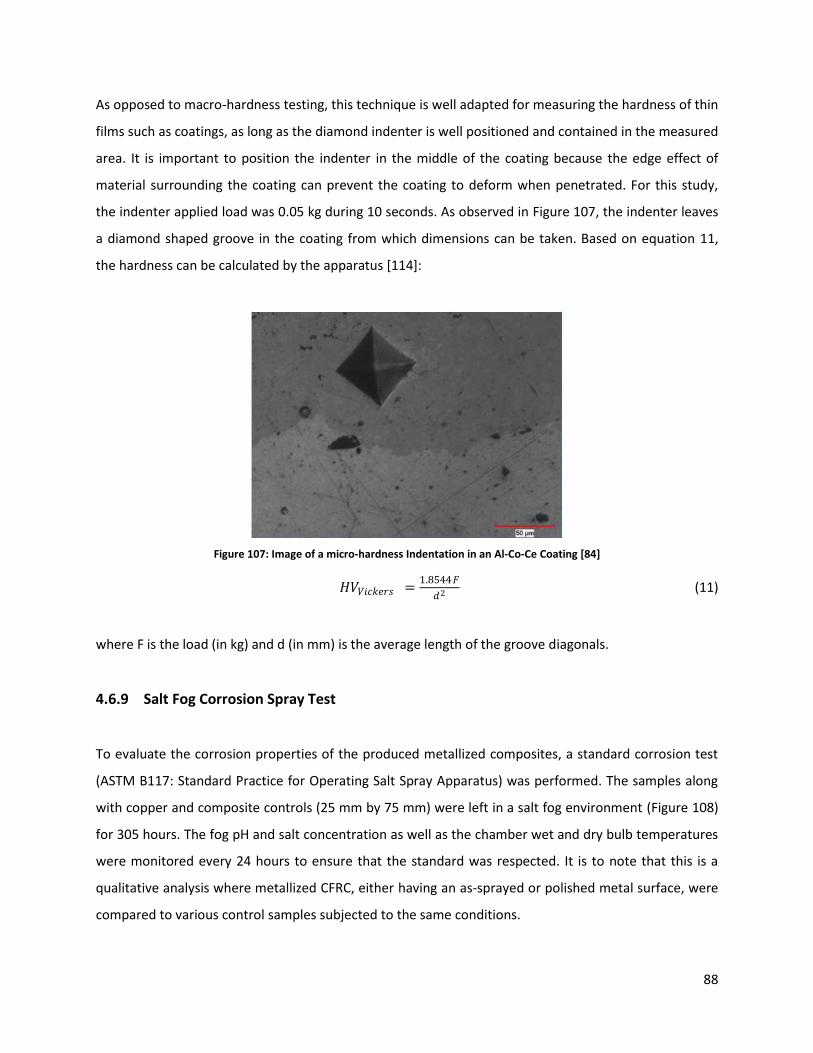
88
As opposed to macro-hardness testing, this technique is well adapted for measuring the hardness of thin
films such as coatings, as long as the diamond indenter is well positioned and contained in the measured
area. It is important to position the indenter in the middle of the coating because the edge effect of
material surrounding the coating can prevent the coating to deform when penetrated. For this study,
the indenter applied load was 0.05 kg during 10 seconds. As observed in Figure 107, the indenter leaves
a diamond shaped groove in the coating from which dimensions can be taken. Based on equation 11,
the hardness can be calculated by the apparatus [114]:
Figure 107: Image of a micro-hardness Indentation in an Al-Co-Ce Coating [84]
𝐻𝑉𝑉𝑖𝑐𝑘𝑒𝑟𝑠 =1.8544𝐹
𝑑2 (11)
where F is the load (in kg) and d (in mm) is the average length of the groove diagonals.
4.6.9 Salt Fog Corrosion Spray Test
To evaluate the corrosion properties of the produced metallized composites, a standard corrosion test
(ASTM B117: Standard Practice for Operating Salt Spray Apparatus) was performed. The samples along
with copper and composite controls (25 mm by 75 mm) were left in a salt fog environment (Figure 108)
for 305 hours. The fog pH and salt concentration as well as the chamber wet and dry bulb temperatures
were monitored every 24 hours to ensure that the standard was respected. It is to note that this is a
qualitative analysis where metallized CFRC, either having an as-sprayed or polished metal surface, were
compared to various control samples subjected to the same conditions.

89
Figure 108: Salt Spray Apparatus
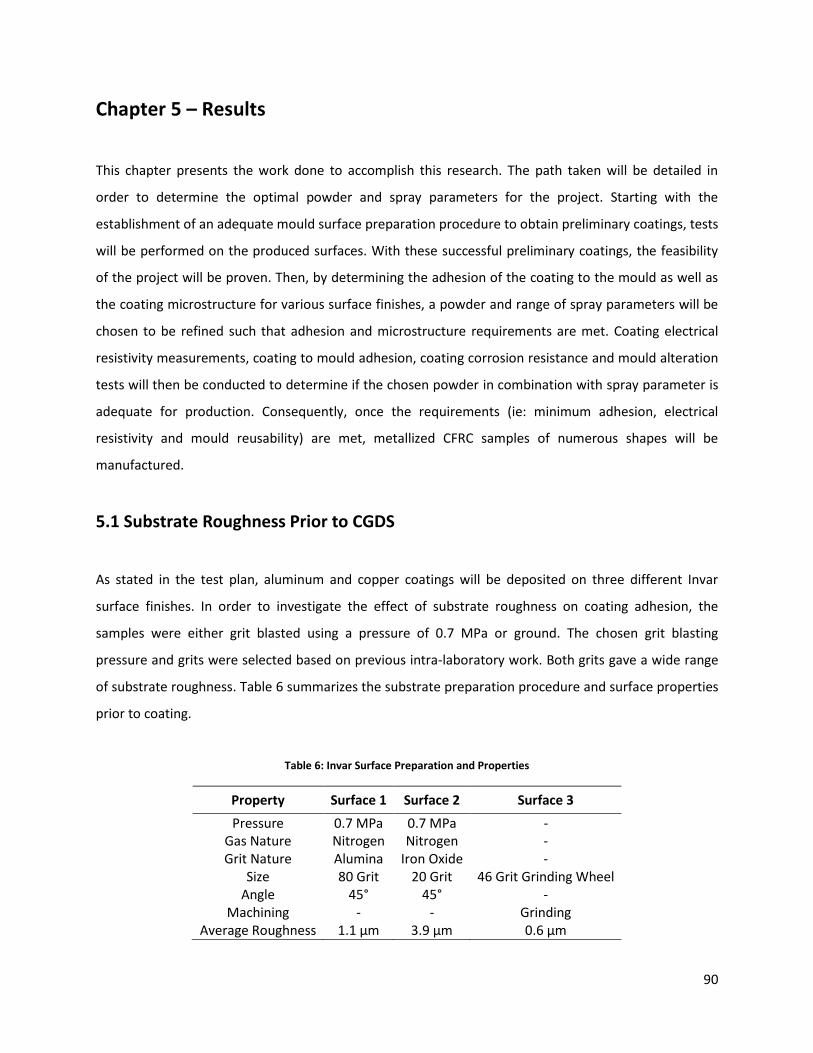
90
Chapter 5 – Results
This chapter presents the work done to accomplish this research. The path taken will be detailed in
order to determine the optimal powder and spray parameters for the project. Starting with the
establishment of an adequate mould surface preparation procedure to obtain preliminary coatings, tests
will be performed on the produced surfaces. With these successful preliminary coatings, the feasibility
of the project will be proven. Then, by determining the adhesion of the coating to the mould as well as
the coating microstructure for various surface finishes, a powder and range of spray parameters will be
chosen to be refined such that adhesion and microstructure requirements are met. Coating electrical
resistivity measurements, coating to mould adhesion, coating corrosion resistance and mould alteration
tests will then be conducted to determine if the chosen powder in combination with spray parameter is
adequate for production. Consequently, once the requirements (ie: minimum adhesion, electrical
resistivity and mould reusability) are met, metallized CFRC samples of numerous shapes will be
manufactured.
5.1 Substrate Roughness Prior to CGDS
As stated in the test plan, aluminum and copper coatings will be deposited on three different Invar
surface finishes. In order to investigate the effect of substrate roughness on coating adhesion, the
samples were either grit blasted using a pressure of 0.7 MPa or ground. The chosen grit blasting
pressure and grits were selected based on previous intra-laboratory work. Both grits gave a wide range
of substrate roughness. Table 6 summarizes the substrate preparation procedure and surface properties
prior to coating.
Table 6: Invar Surface Preparation and Properties
Property Surface 1 Surface 2 Surface 3
Pressure 0.7 MPa 0.7 MPa - Gas Nature Nitrogen Nitrogen - Grit Nature Alumina Iron Oxide -
Size 80 Grit 20 Grit 46 Grit Grinding Wheel Angle
Machining 45°
- 45°
- -
Grinding Average Roughness 1.1 µm 3.9 µm 0.6 µm
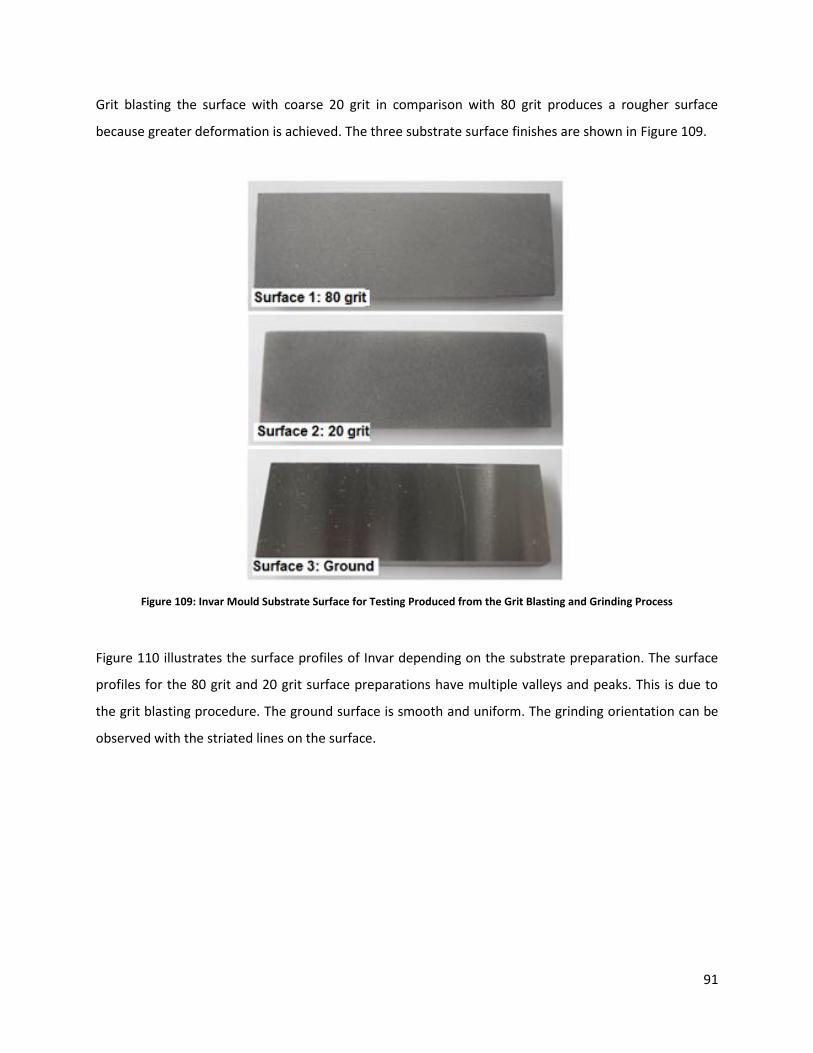
91
Grit blasting the surface with coarse 20 grit in comparison with 80 grit produces a rougher surface
because greater deformation is achieved. The three substrate surface finishes are shown in Figure 109.
Figure 109: Invar Mould Substrate Surface for Testing Produced from the Grit Blasting and Grinding Process
Figure 110 illustrates the surface profiles of Invar depending on the substrate preparation. The surface
profiles for the 80 grit and 20 grit surface preparations have multiple valleys and peaks. This is due to
the grit blasting procedure. The ground surface is smooth and uniform. The grinding orientation can be
observed with the striated lines on the surface.

92
Figure 110: Oblique View (left) and Normal View (right) of Invar Substrate Top Surface Profile taken with Three Dimension Microscope
5.2 Powder and Spray Parameter Optimization
The following section provides details regarding the powder selection process. It is to note that the
decisive factor for the coating material is its ability of being easily removable from the Invar mould.
From previous tests conducted in the laboratory and from the manufacturer’s powder specification,
spray parameters that enable coating production on Invar of various surface roughness were used. Once
a powder and surface finish couple is selected, based on adhesion strength, the spray parameters for
the given powder and surface finish couple will be optimized for minimum coating adhesion with a
Taguchi variance analysis scheme [119]. From this analysis, the spray pressure, temperature and coating
thickness will be determined. Afterwards, the gun traverse velocity and powder feed rate effect on
coating microstructure will be looked into.
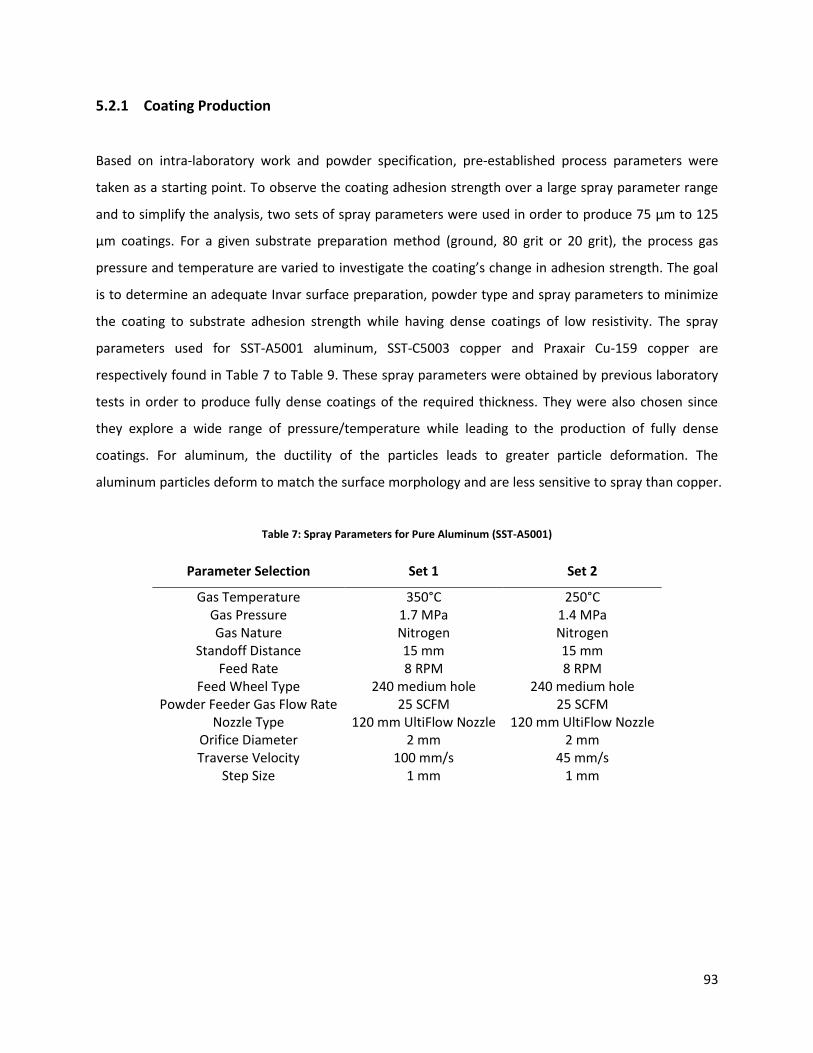
93
5.2.1 Coating Production
Based on intra-laboratory work and powder specification, pre-established process parameters were
taken as a starting point. To observe the coating adhesion strength over a large spray parameter range
and to simplify the analysis, two sets of spray parameters were used in order to produce 75 µm to 125
µm coatings. For a given substrate preparation method (ground, 80 grit or 20 grit), the process gas
pressure and temperature are varied to investigate the coating’s change in adhesion strength. The goal
is to determine an adequate Invar surface preparation, powder type and spray parameters to minimize
the coating to substrate adhesion strength while having dense coatings of low resistivity. The spray
parameters used for SST-A5001 aluminum, SST-C5003 copper and Praxair Cu-159 copper are
respectively found in Table 7 to Table 9. These spray parameters were obtained by previous laboratory
tests in order to produce fully dense coatings of the required thickness. They were also chosen since
they explore a wide range of pressure/temperature while leading to the production of fully dense
coatings. For aluminum, the ductility of the particles leads to greater particle deformation. The
aluminum particles deform to match the surface morphology and are less sensitive to spray than copper.
Table 7: Spray Parameters for Pure Aluminum (SST-A5001)
Parameter Selection Set 1 Set 2
Gas Temperature 350°C 250°C Gas Pressure 1.7 MPa 1.4 MPa Gas Nature Nitrogen Nitrogen
Standoff Distance 15 mm 15 mm Feed Rate 8 RPM 8 RPM
Feed Wheel Type 240 medium hole 240 medium hole Powder Feeder Gas Flow Rate 25 SCFM 25 SCFM
Nozzle Type 120 mm UltiFlow Nozzle 120 mm UltiFlow Nozzle Orifice Diameter 2 mm 2 mm Traverse Velocity 100 mm/s 45 mm/s
Step Size 1 mm 1 mm
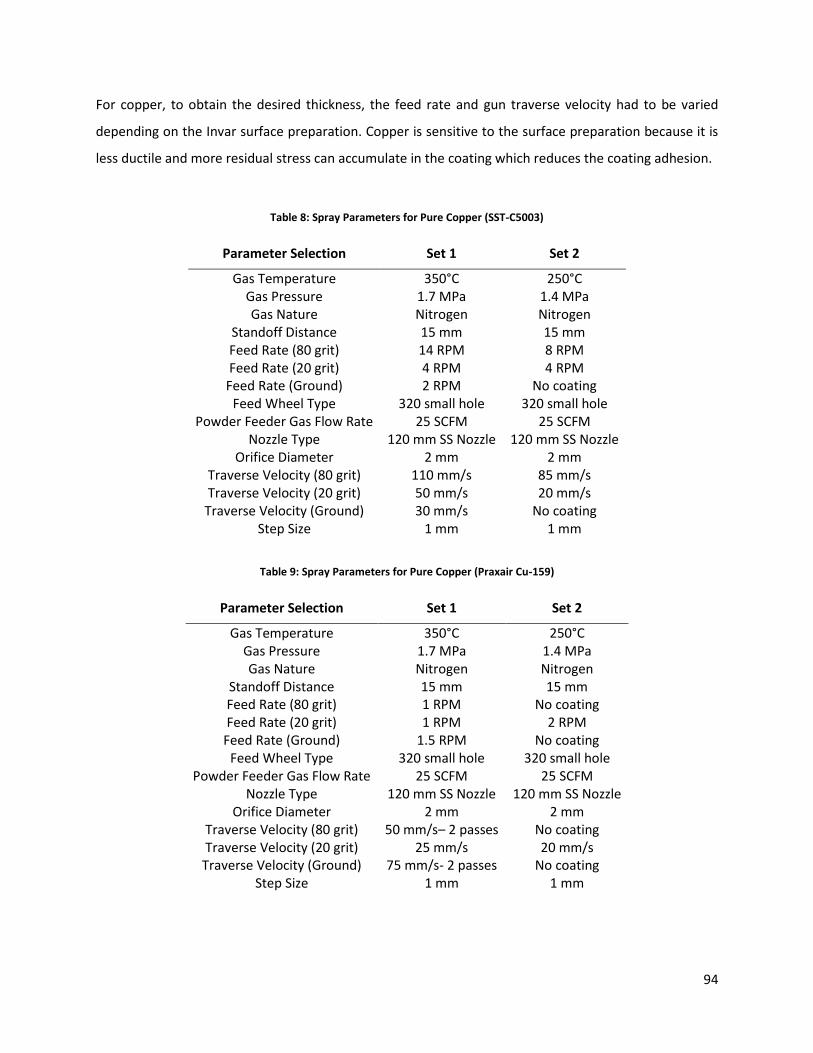
94
For copper, to obtain the desired thickness, the feed rate and gun traverse velocity had to be varied
depending on the Invar surface preparation. Copper is sensitive to the surface preparation because it is
less ductile and more residual stress can accumulate in the coating which reduces the coating adhesion.
Table 8: Spray Parameters for Pure Copper (SST-C5003)
Parameter Selection Set 1 Set 2
Gas Temperature 350°C 250°C Gas Pressure 1.7 MPa 1.4 MPa Gas Nature Nitrogen Nitrogen
Standoff Distance 15 mm 15 mm Feed Rate (80 grit) 14 RPM 8 RPM Feed Rate (20 grit) 4 RPM 4 RPM
Feed Rate (Ground) 2 RPM No coating Feed Wheel Type 320 small hole 320 small hole
Powder Feeder Gas Flow Rate 25 SCFM 25 SCFM Nozzle Type 120 mm SS Nozzle 120 mm SS Nozzle
Orifice Diameter 2 mm 2 mm Traverse Velocity (80 grit) 110 mm/s 85 mm/s Traverse Velocity (20 grit) 50 mm/s 20 mm/s
Traverse Velocity (Ground) 30 mm/s No coating Step Size 1 mm 1 mm
Table 9: Spray Parameters for Pure Copper (Praxair Cu-159)
Parameter Selection Set 1 Set 2
Gas Temperature 350°C 250°C Gas Pressure 1.7 MPa 1.4 MPa Gas Nature Nitrogen Nitrogen
Standoff Distance 15 mm 15 mm Feed Rate (80 grit) 1 RPM No coating Feed Rate (20 grit) 1 RPM 2 RPM
Feed Rate (Ground) 1.5 RPM No coating Feed Wheel Type 320 small hole 320 small hole
Powder Feeder Gas Flow Rate 25 SCFM 25 SCFM Nozzle Type 120 mm SS Nozzle 120 mm SS Nozzle
Orifice Diameter 2 mm 2 mm Traverse Velocity (80 grit) 50 mm/s– 2 passes No coating Traverse Velocity (20 grit) 25 mm/s 20 mm/s
Traverse Velocity (Ground) 75 mm/s- 2 passes No coating Step Size 1 mm 1 mm

95
Figure 111 shows typical successful aluminum and copper coatings on Invar substrates while Figure 112
depicts unsuccessful coatings. Table 10 summarizes the successful, inconsistent and unachievable
coatings for various spray parameters, surface preparation and powder. In the case of the inconsistent
coatings, the coating would delaminate from the substrate due to its low adhesion strength. This is
caused by the stress created at the coating/substrate interface due to the particle mechanical work,
temperature and plastic deformation as well as lacking anchoring sites. From Table 10,
powder/substrate couples can be eliminated from the selection based on the impossibility to produce
coatings.
Figure 111: Typical Aluminum and Copper Coating (No Visual Difference between Set 1 and Set 2)
Figure 112: Inconsistent Copper Coating on Ground Invar Substrate, (a) Praxair Cu-159 and (b) SST-C5003
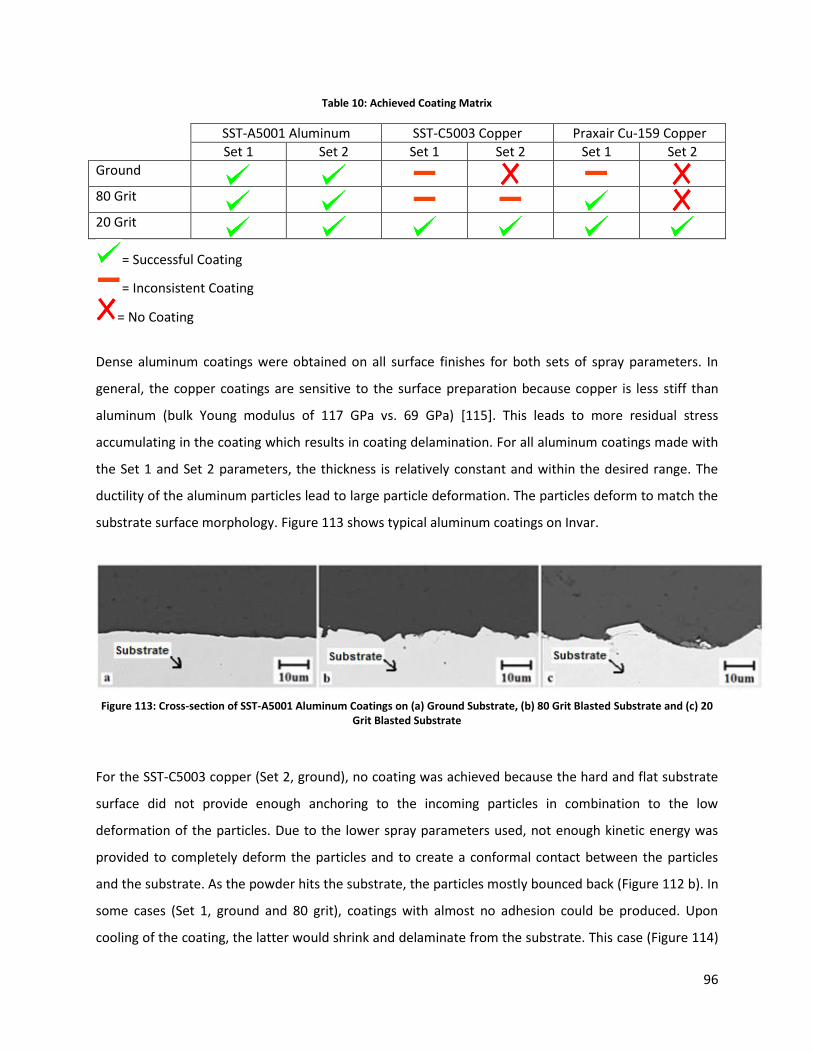
96
Table 10: Achieved Coating Matrix
SST-A5001 Aluminum SST-C5003 Copper Praxair Cu-159 Copper
Set 1 Set 2 Set 1 Set 2 Set 1 Set 2
Ground
80 Grit
20 Grit
= Successful Coating
= Inconsistent Coating
= No Coating
Dense aluminum coatings were obtained on all surface finishes for both sets of spray parameters. In
general, the copper coatings are sensitive to the surface preparation because copper is less stiff than
aluminum (bulk Young modulus of 117 GPa vs. 69 GPa) [115]. This leads to more residual stress
accumulating in the coating which results in coating delamination. For all aluminum coatings made with
the Set 1 and Set 2 parameters, the thickness is relatively constant and within the desired range. The
ductility of the aluminum particles lead to large particle deformation. The particles deform to match the
substrate surface morphology. Figure 113 shows typical aluminum coatings on Invar.
Figure 113: Cross-section of SST-A5001 Aluminum Coatings on (a) Ground Substrate, (b) 80 Grit Blasted Substrate and (c) 20 Grit Blasted Substrate
For the SST-C5003 copper (Set 2, ground), no coating was achieved because the hard and flat substrate
surface did not provide enough anchoring to the incoming particles in combination to the low
deformation of the particles. Due to the lower spray parameters used, not enough kinetic energy was
provided to completely deform the particles and to create a conformal contact between the particles
and the substrate. As the powder hits the substrate, the particles mostly bounced back (Figure 112 b). In
some cases (Set 1, ground and 80 grit), coatings with almost no adhesion could be produced. Upon
cooling of the coating, the latter would shrink and delaminate from the substrate. This case (Figure 114)

97
was characterized as inconsistent because the coating produced is impractical for industrial applications.
Some adhesion between the coating and substrate is needed in order to efficiently mount a composite
over the coating.
Figure 114: Removed Copper Coating from Substrate after Cooling (Set 1)
Figure 115 demonstrates the copper SST-C5003 coating microstructure as well as the interface between
the coating and the Invar substrate. A clear delamination of the coating from the rough Invar surface is
apparent. Voids are present at the interface.
Figure 115: Cross-section of SST-C5003 Coatings for (a) Set 1, 20 Grit Substrate and (b) Set 2, 20 Grit Substrate
For the Praxair Cu-159 copper (Set 2, ground and 80 grit), no coatings were achieved because the
particles did not have enough energy (low gas pressure and temperature) to plastically deform and
anchor to the substrate. Due to the low adhesion of the Praxair Cu-159 copper on ground surfaces for
Set 1, 2 passes were needed to obtain an adequate coating. Only a few particles from the first spray pass
adhered to the substrate. It is suspected that the copper particles in the first pass roughened the
substrate surface and enabled adhesion during the second pass. Particles from the second spray pass
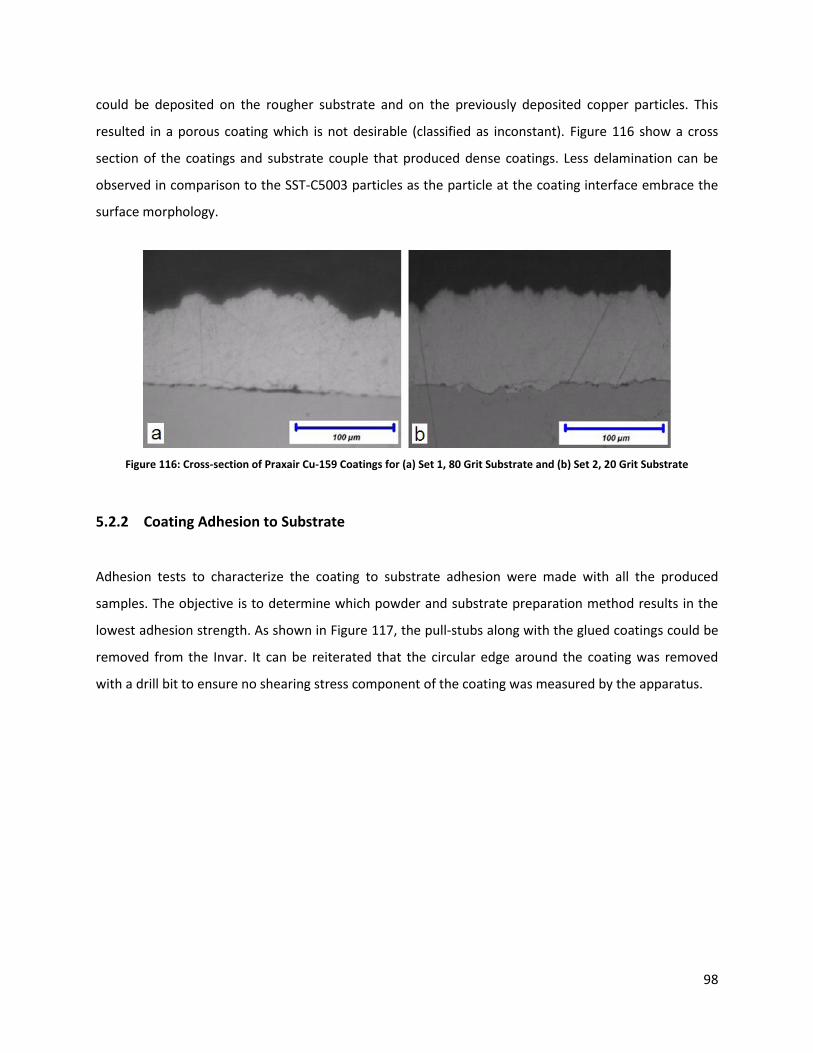
98
could be deposited on the rougher substrate and on the previously deposited copper particles. This
resulted in a porous coating which is not desirable (classified as inconstant). Figure 116 show a cross
section of the coatings and substrate couple that produced dense coatings. Less delamination can be
observed in comparison to the SST-C5003 particles as the particle at the coating interface embrace the
surface morphology.
Figure 116: Cross-section of Praxair Cu-159 Coatings for (a) Set 1, 80 Grit Substrate and (b) Set 2, 20 Grit Substrate
5.2.2 Coating Adhesion to Substrate
Adhesion tests to characterize the coating to substrate adhesion were made with all the produced
samples. The objective is to determine which powder and substrate preparation method results in the
lowest adhesion strength. As shown in Figure 117, the pull-stubs along with the glued coatings could be
removed from the Invar. It can be reiterated that the circular edge around the coating was removed
with a drill bit to ensure no shearing stress component of the coating was measured by the apparatus.

99
Figure 117: Substrate and Pull-stub after Adhesion Test
For the aluminum coatings, Figure 118 demonstrates that the ground Invar surface results in the highest
adhesion strength, for Set 1. This is likely due to the complete deformation and surface mechanical
bonding area of the particles on the ground surface (ie: powder particles are in full contact with the flat
substrate since they are fully deformed and compressed on the substrate). For the grit blasted surfaces,
due to the combination of particle size and substrate roughness (surface valleys and peaks), voids
between the particles and the substrate are created. This leads to a reduction of the total particle
mechanically anchoring on the substrate; thus lowering the adhesion strength. In general, for the range
of spray parameters used, the higher spraying pressures and temperatures result in lower adhesion
values. Particles having more kinetic energy will have more plastic deformation, thus residual stress
stored within the coating. Residual stress, in combination with the voids under the particles, which have
not fully deformed to penetrate in the substrate craters, result in a lower coating to substrate adhesion.
A lower pressure is believed to create less plastic deformation, therefore less compressive residual
stress in the coating. Residual stress contributes to coating delamination. This mechanism can be
explained by the compression stress stored intra and inter particles in the coating from their plastic
deformation. As the magnitude of the stress increases, the van der Walls/mechanical anchoring forces
cannot counteract the compressive forces within the coating. Therefore, the coating will delaminate
from the substrate.

100
Figure 118: SST-A5001 Aluminum Coating Adhesion Strength (MPa) vs. Substrate Surface Roughness (Ra in μm)
The adhesion mechanism is further explained and can be observed in Figure 119 and Figure 120. For the
80 grit surface finish, voids are present between the coating and substrate. For the 20 grit, due to the
surface morphology, particle anchoring points increase the coating adhesion. In the case of the ground
surface, the van der Walls forces maintain a full contact between the coating and substrate.

101
Figure 119: Cross-sectional View of Aluminum Coating and Invar Substrate (Set 2)
Figure 120: Aluminum Particle Contact on Invar Surface Schematic
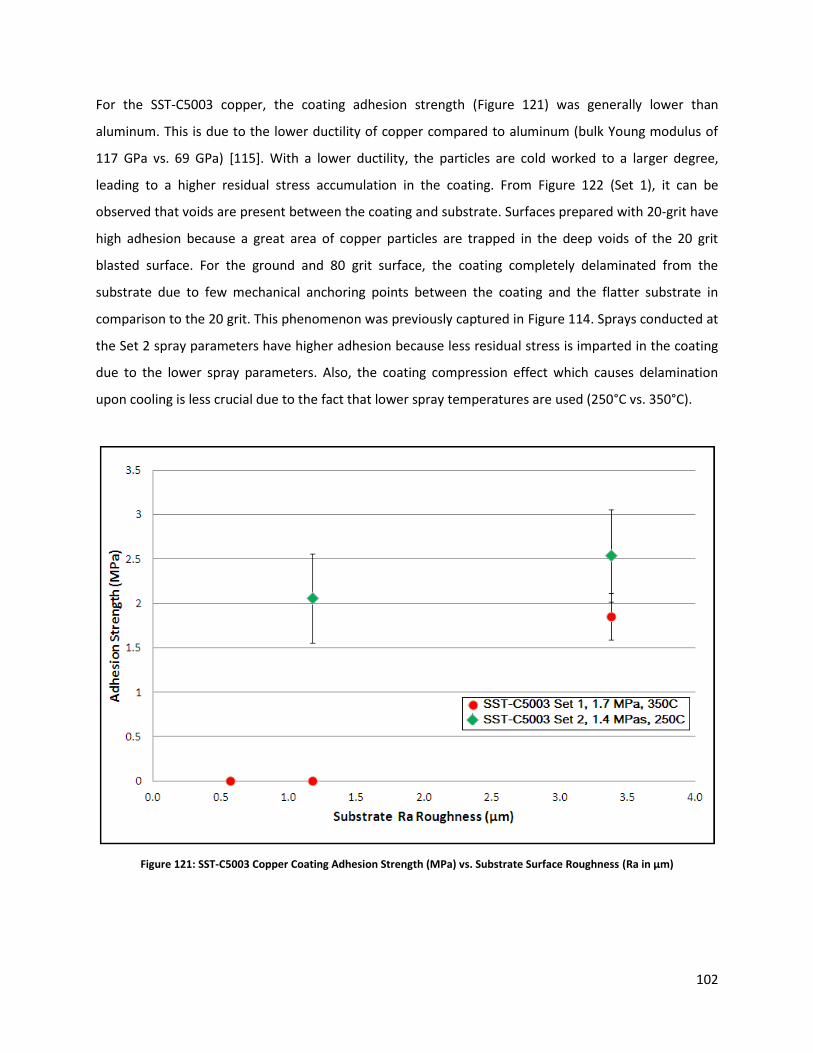
102
For the SST-C5003 copper, the coating adhesion strength (Figure 121) was generally lower than
aluminum. This is due to the lower ductility of copper compared to aluminum (bulk Young modulus of
117 GPa vs. 69 GPa) [115]. With a lower ductility, the particles are cold worked to a larger degree,
leading to a higher residual stress accumulation in the coating. From Figure 122 (Set 1), it can be
observed that voids are present between the coating and substrate. Surfaces prepared with 20-grit have
high adhesion because a great area of copper particles are trapped in the deep voids of the 20 grit
blasted surface. For the ground and 80 grit surface, the coating completely delaminated from the
substrate due to few mechanical anchoring points between the coating and the flatter substrate in
comparison to the 20 grit. This phenomenon was previously captured in Figure 114. Sprays conducted at
the Set 2 spray parameters have higher adhesion because less residual stress is imparted in the coating
due to the lower spray parameters. Also, the coating compression effect which causes delamination
upon cooling is less crucial due to the fact that lower spray temperatures are used (250°C vs. 350°C).
Figure 121: SST-C5003 Copper Coating Adhesion Strength (MPa) vs. Substrate Surface Roughness (Ra in μm)

103
Figure 122: Cross-sectional View of SST-C5003 Copper Coating and Invar Substrate Interface (Set 1)
Adhesion strength values for the Praxair Cu-159 copper are found in Figure 123. These values range
between the SST-A5001 aluminum and the SST-C5003 copper. No coatings were achieved for Set 2
ground and 80 grit surfaces because not enough kinetic energy was imparted to the particles to fully
anchoring the particles on the less rough surfaces. It is to note that on the ground surface preparation
(Figure 124), two passes were needed to obtain a coating of the desired thickness. Particles from the
first spray pass modified the substrate roughness by erosion. Only a few particles from the first spray
pass adhered to the substrate. Particles from the second spray pass could be deposited on the rougher
substrate and on the previously deposited copper particles. This results in an adhesive and porous
coating which is not desirable.
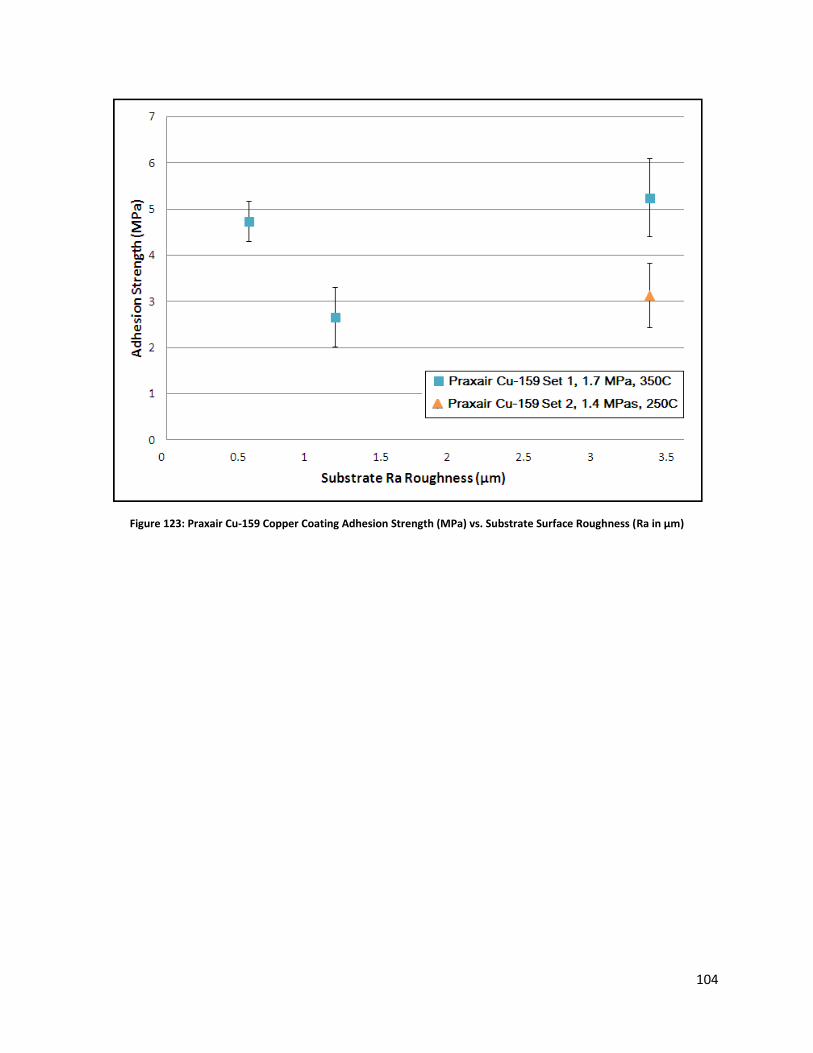
104
Figure 123: Praxair Cu-159 Copper Coating Adhesion Strength (MPa) vs. Substrate Surface Roughness (Ra in μm)
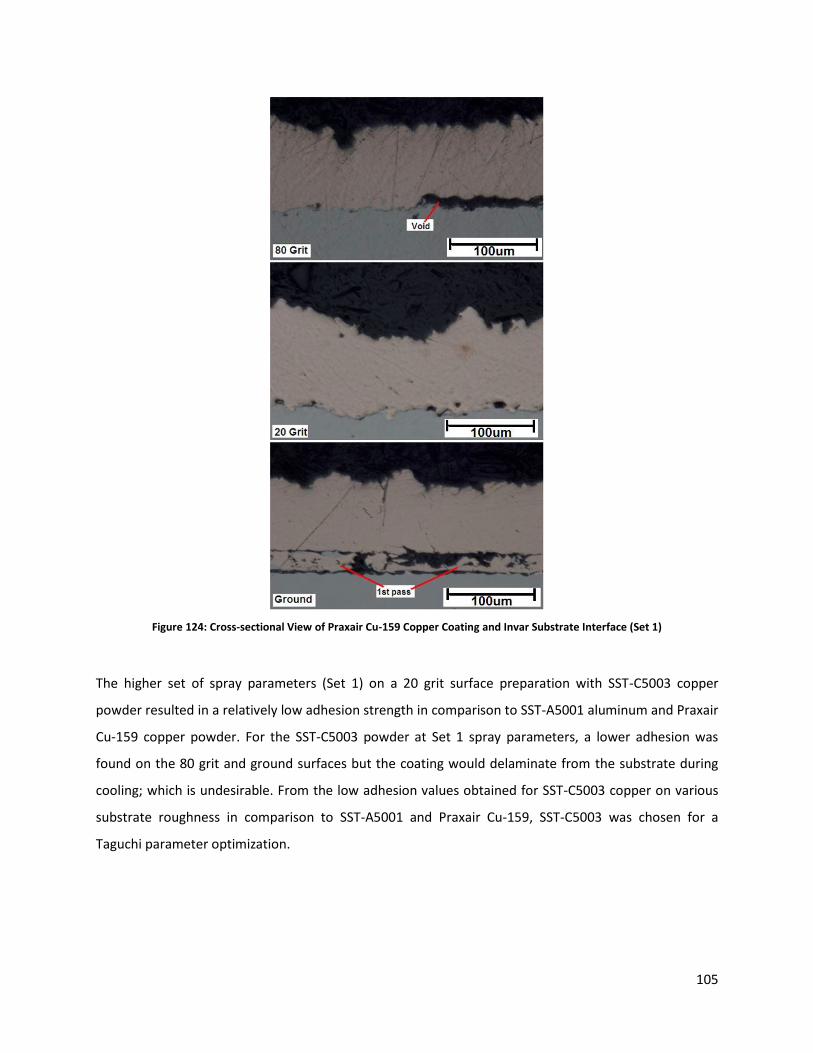
105
Figure 124: Cross-sectional View of Praxair Cu-159 Copper Coating and Invar Substrate Interface (Set 1)
The higher set of spray parameters (Set 1) on a 20 grit surface preparation with SST-C5003 copper
powder resulted in a relatively low adhesion strength in comparison to SST-A5001 aluminum and Praxair
Cu-159 copper powder. For the SST-C5003 powder at Set 1 spray parameters, a lower adhesion was
found on the 80 grit and ground surfaces but the coating would delaminate from the substrate during
cooling; which is undesirable. From the low adhesion values obtained for SST-C5003 copper on various
substrate roughness in comparison to SST-A5001 and Praxair Cu-159, SST-C5003 was chosen for a
Taguchi parameter optimization.
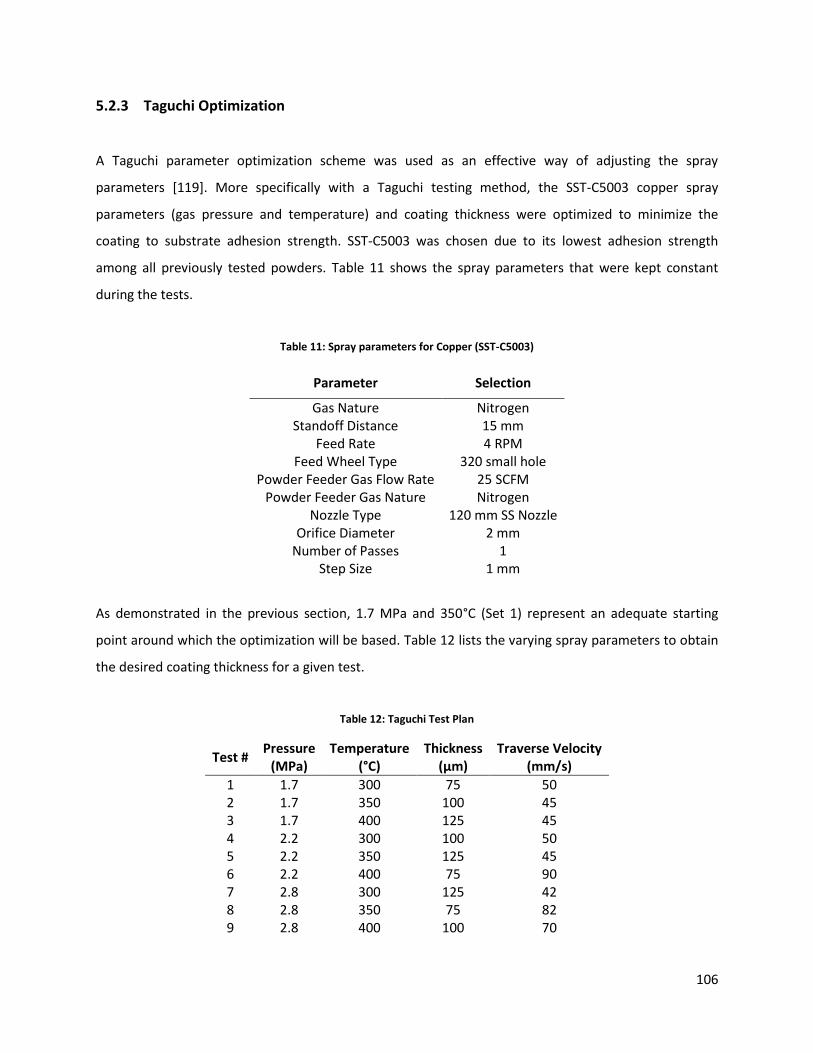
106
5.2.3 Taguchi Optimization
A Taguchi parameter optimization scheme was used as an effective way of adjusting the spray
parameters [119]. More specifically with a Taguchi testing method, the SST-C5003 copper spray
parameters (gas pressure and temperature) and coating thickness were optimized to minimize the
coating to substrate adhesion strength. SST-C5003 was chosen due to its lowest adhesion strength
among all previously tested powders. Table 11 shows the spray parameters that were kept constant
during the tests.
Table 11: Spray parameters for Copper (SST-C5003)
Parameter Selection
Gas Nature Nitrogen Standoff Distance 15 mm
Feed Rate 4 RPM Feed Wheel Type 320 small hole
Powder Feeder Gas Flow Rate 25 SCFM Powder Feeder Gas Nature Nitrogen
Nozzle Type 120 mm SS Nozzle Orifice Diameter 2 mm
Number of Passes 1 Step Size 1 mm
As demonstrated in the previous section, 1.7 MPa and 350°C (Set 1) represent an adequate starting
point around which the optimization will be based. Table 12 lists the varying spray parameters to obtain
the desired coating thickness for a given test.
Table 12: Taguchi Test Plan
Test # Pressure
(MPa) Temperature
(°C) Thickness
(µm) Traverse Velocity
(mm/s)
1 1.7 300 75 50 2 1.7 350 100 45 3 1.7 400 125 45 4 2.2 300 100 50 5 2.2 350 125 45 6 2.2 400 75 90 7 2.8 300 125 42 8 2.8 350 75 82 9 2.8 400 100 70
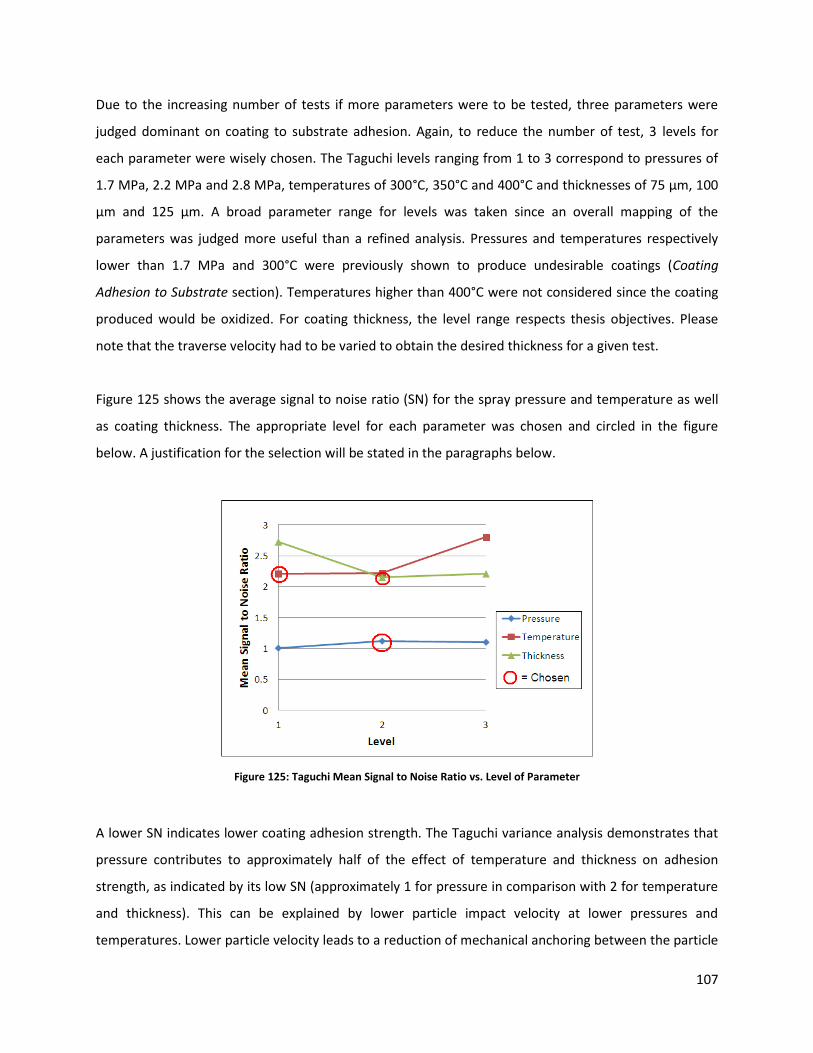
107
Due to the increasing number of tests if more parameters were to be tested, three parameters were
judged dominant on coating to substrate adhesion. Again, to reduce the number of test, 3 levels for
each parameter were wisely chosen. The Taguchi levels ranging from 1 to 3 correspond to pressures of
1.7 MPa, 2.2 MPa and 2.8 MPa, temperatures of 300°C, 350°C and 400°C and thicknesses of 75 µm, 100
µm and 125 µm. A broad parameter range for levels was taken since an overall mapping of the
parameters was judged more useful than a refined analysis. Pressures and temperatures respectively
lower than 1.7 MPa and 300°C were previously shown to produce undesirable coatings (Coating
Adhesion to Substrate section). Temperatures higher than 400°C were not considered since the coating
produced would be oxidized. For coating thickness, the level range respects thesis objectives. Please
note that the traverse velocity had to be varied to obtain the desired thickness for a given test.
Figure 125 shows the average signal to noise ratio (SN) for the spray pressure and temperature as well
as coating thickness. The appropriate level for each parameter was chosen and circled in the figure
below. A justification for the selection will be stated in the paragraphs below.
Figure 125: Taguchi Mean Signal to Noise Ratio vs. Level of Parameter
A lower SN indicates lower coating adhesion strength. The Taguchi variance analysis demonstrates that
pressure contributes to approximately half of the effect of temperature and thickness on adhesion
strength, as indicated by its low SN (approximately 1 for pressure in comparison with 2 for temperature
and thickness). This can be explained by lower particle impact velocity at lower pressures and
temperatures. Lower particle velocity leads to a reduction of mechanical anchoring between the particle
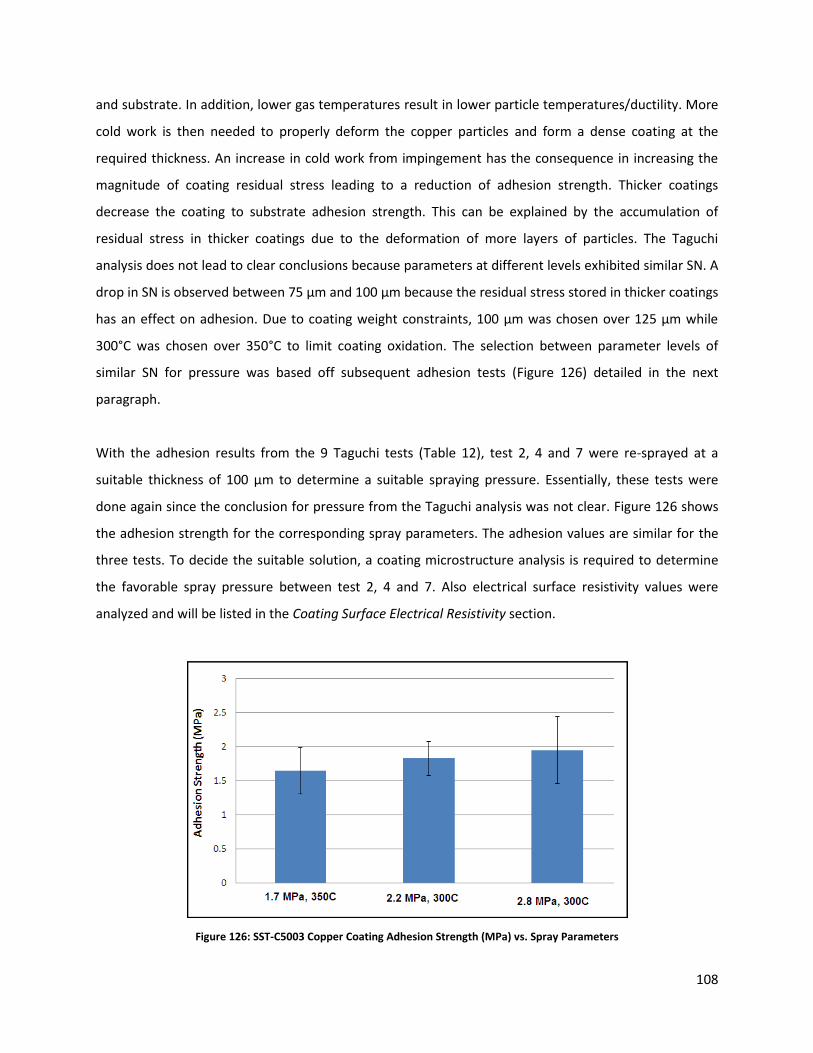
108
and substrate. In addition, lower gas temperatures result in lower particle temperatures/ductility. More
cold work is then needed to properly deform the copper particles and form a dense coating at the
required thickness. An increase in cold work from impingement has the consequence in increasing the
magnitude of coating residual stress leading to a reduction of adhesion strength. Thicker coatings
decrease the coating to substrate adhesion strength. This can be explained by the accumulation of
residual stress in thicker coatings due to the deformation of more layers of particles. The Taguchi
analysis does not lead to clear conclusions because parameters at different levels exhibited similar SN. A
drop in SN is observed between 75 µm and 100 µm because the residual stress stored in thicker coatings
has an effect on adhesion. Due to coating weight constraints, 100 µm was chosen over 125 µm while
300°C was chosen over 350°C to limit coating oxidation. The selection between parameter levels of
similar SN for pressure was based off subsequent adhesion tests (Figure 126) detailed in the next
paragraph.
With the adhesion results from the 9 Taguchi tests (Table 12), test 2, 4 and 7 were re-sprayed at a
suitable thickness of 100 µm to determine a suitable spraying pressure. Essentially, these tests were
done again since the conclusion for pressure from the Taguchi analysis was not clear. Figure 126 shows
the adhesion strength for the corresponding spray parameters. The adhesion values are similar for the
three tests. To decide the suitable solution, a coating microstructure analysis is required to determine
the favorable spray pressure between test 2, 4 and 7. Also electrical surface resistivity values were
analyzed and will be listed in the Coating Surface Electrical Resistivity section.
Figure 126: SST-C5003 Copper Coating Adhesion Strength (MPa) vs. Spray Parameters

109
Figure 127 presents the coating microstructure for the possible suitable spray parameters (Taguchi tests
2, 4 and 7). At 1.7 MPa/350°C, cracks are seen in the coating, probably due to the release of residual
stress caused by the greater particle plastic deformation from the higher spray temperature leading to
higher particle impact velocity. The mechanism to release the residual stress can be expressed in
cracking and/or coating to substrate delamination. In this case, residual stress is released through
cracking along the coating length. At 2.2 MPa and 300°C, the coating is fully dense and voids are seen at
the coating to substrate interface. The voids will facilitate the removal of the coating from the substrate
because there is less contact between the coating and substrate. Finally for the 2.8 MPa/300°C coating,
the increase of pressure generates cracking as in the 1.7 MPa/350°C coating but to a smaller degree.
Smaller cracks are observed in the 2.8 MPa/300°C coating in comparison to 1.7 MPa/350°C since it was
seen that higher pressures contribute to approximately half of the effect of higher temperatures on
adhesion; therefore residual stress. By having less residual stress in the 2.8 MPa/300°C coating, smaller
cracks generated by the release of residual stress are observed.
Figure 127: Cross-sectional View of SST-C5003 Copper Coating at Different Spray Parameters

110
Based on the results from the Taguchi analysis and the coating microstructure, a suitable solution is to
use the SST-C5003 copper powder, sprayed at 2.2 MPa and 300°C on a 20 grit blasted substrate at 0.7
MPa. A thickness of 100 µm was selected because of weight considerations. Note that no significant
adhesion strength differences were observed between the 100 µm and 125 µm coatings.
5.2.4 Gun Traverse Speed and Powder Feed Rate Selection
The spray gun traverse velocity and powder feed rate are also parameters that can be varied. In this
section, these parameters will be investigated to view their effect on adhesion strength. 100 µm thick
coatings will be produced for different combinations of traverse velocity and powder feeder rotational
rate (which translates into powder feed rate). Provided that coatings of equal quality can be produced at
greater traverse velocity, lower gas consumption would be achieved for the fact that the time required
to spray a given surface area would be reduced.
Traverse velocity and feeder RPM tests were conducted with SST-C5003 copper on Invar and are plotted
in Figure 128. They show that a linear relation exists between gun traverse velocity and the powder feed
rate required for obtaining a coating thickness of 100 µm.
Figure 128: Traverse Velocity (mm/s) vs. Powder Feed Rate (RPM) for Constant SST-C5003 Copper Coating Thickness (100 µm)
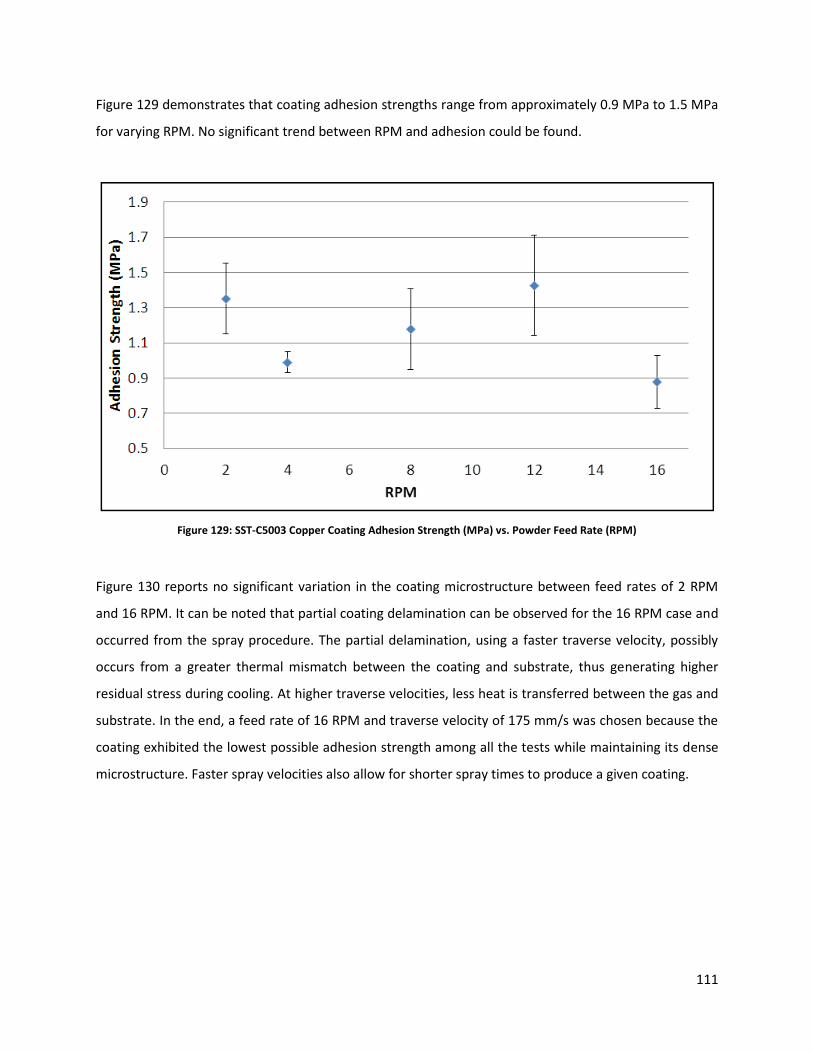
111
Figure 129 demonstrates that coating adhesion strengths range from approximately 0.9 MPa to 1.5 MPa
for varying RPM. No significant trend between RPM and adhesion could be found.
Figure 129: SST-C5003 Copper Coating Adhesion Strength (MPa) vs. Powder Feed Rate (RPM)
Figure 130 reports no significant variation in the coating microstructure between feed rates of 2 RPM
and 16 RPM. It can be noted that partial coating delamination can be observed for the 16 RPM case and
occurred from the spray procedure. The partial delamination, using a faster traverse velocity, possibly
occurs from a greater thermal mismatch between the coating and substrate, thus generating higher
residual stress during cooling. At higher traverse velocities, less heat is transferred between the gas and
substrate. In the end, a feed rate of 16 RPM and traverse velocity of 175 mm/s was chosen because the
coating exhibited the lowest possible adhesion strength among all the tests while maintaining its dense
microstructure. Faster spray velocities also allow for shorter spray times to produce a given coating.

112
Figure 130: Cross-sectional View of SST-C5003 Copper Coatings at Different Powder Feed Rates: (a) 2 RPM, (b) 8 RPM and (c) 16 RPM
5.3 Metallized CFRC Properties Tests
In view of analyzing the mechanical, electrical and chemical properties of the produced metallized CFRC,
coating to composite adhesion, surface electrical resistivity, corrosion and coating hardness tests will be
completed.
5.3.1 Coating Adhesion to CFRC
A four point bending and conventional adhesion tensile tests of the coating to composite will describe
how the metallized composite will perform under different loading conditions.
Four Point Bending Test
Four point beam bending tests were performed on metallized composite samples to analyse the
coatings behavior during composite failure. The failure stress measured was 633 MPa ± 49 MPa
averaged on 9 samples. The measured value does not indicate the resistance to tension of the coating
skin but shows the shearing resistance of the coating to the composite. When the beam bends, a tensile
stress will initiate a crack through the coating thickness; leading to failure. Simultaneously a shearing
stress of similar magnitude will be imposed at the coating to composite interface. The behavior of a
typical failure indicates a strong fiber to coating adhesion since the coating does not delaminate/shear
from the composite at any given location. The coating failed in cracking instead of being sheared from

113
the composite, proving it strongly remains adhered to the composite. Figure 131 shows a typical failure
of the composite.
Figure 131: Failure of Carbon Fiber/copper Composite from a Four Point Bend Test
Tensile Adhesion Test
Adhesion tests were conducted on the carbon fiber/copper composite. In a similar fashion to
coating/substrate adhesion tests, pull-stubs were glued on the coated surface of the CFRC. Imposing a
tensile stress to the coating will reveal its failure mechanism. Figure 132 shows that the failure can
either be (a) cohesive in the composite (in the resin layer between the carbon fiber and the composite)
or (b) only cohesive within the coating (intra-coating).
Figure 132: Carbon Fiber/Copper Composite Surface after Pull Test for: (a) Composite Cohesive Failure, (b) Coating Cohesive Failure

114
Figure 133 presents the cross sectional view of typical cohesive failures. For the intra-composite failures,
the composite resin layer failed and the copper coating was pulled off by the pull-stub along with some
resin. For the intra-coating failures, cracks initiated in the coating and the coating was separated along a
longitudinal crack.
Figure 133: Carbon Fiber/copper Composite Cross-section after Pull Test for (a) Composite Cohesive Failure and (b) Coating Cohesive Failure
Figure 134 lists the values obtained from the adhesion tests. In most tests, the coating failed in cohesion
due to crack propagation. From Figure 134, we can conclude that the composite and coating can
withstand average tensile stresses of 5.2 MPa± 0.7 MPa (2 samples). Composite failures are potentially
caused by imperfect manufacturing inducing defects in the adhesive layer bonding the coating to the
carbon fiber layer. In the majority of cases (13 samples), microscopic cracks in the coating propagated
under tensile stresses of 2.6 MPa± 0.8 MPa.

115
Figure 134: Metallized Composite Strength (MPa) vs. Failure Mode
5.3.2 Coating Surface Electrical Resistivity
Using a four-terminal sensor, electrical resistivity measurements were obtained for various coatings.
Despite the selection of the SST-C5003 powder for suitable adhesion, the SST-A5001 and Praxair Cu-159
coatings are analyzed for comparative reasons. All values measured are within the resistivity
requirement; that is at most 5 times the resistivity of bulk copper (5 x 1.68x10-8 Ωm = 8.40 x 10⁻⁸ Ωm).
From Figure 135, the resistance obtained for Praxair Cu-159 copper is lower compared to the SST-C5003
copper because of the particle morphology. More plastic deformation, leading to tighter inter-particle
bonding is possible with the spherical Cu-159 particles in comparison to the dendritic SST-C5003 powder.
It is easier to deform a spherical shape in comparison to a dendritic due to the compactness of the
spherical particle. Higher deformation leads to less electrical resistance since the current can travel
more efficiently through the deformed particle boundaries. For the dendritic particles, the energy
leading to particle plastic deformation is divided among the dendrites which reduced the deformation
concentration and the bonding between particles. More interfacial boundaries result from this poor
particle bonding which reduces the flow of electrons and therefore, conductivity. In the case of spherical
particles, by having less particle boundaries, an electrical current can flow easily through the coating.
Aluminum coatings, when removable from the Invar, generally had higher resistivity than copper due to
the higher resistivity of aluminum in comparison with copper. Unfortunately not all the resistivity of the

116
aluminum coated CFRC could be measured. The high adhesion between the Invar mould and aluminum
coating led to discontinuities in the coatings which impeded the current from the apparatus to flow. As
shown in Figure 135, the selection of SST-C5003 copper power respects the resistivity set by The Boeing
Company.
*Some samples could not be tested for electrical resistivity because the coating remained on the substrate during composite
removal (high adhesion strength) or the coatings could not be produced.
Figure 135: Coating Electrical Resistivity
5.3.3 Salt Fog Corrosion Spray
An ASTM-B117 salt spray test was conducted for 305 hours on copper/carbon fiber composites, copper
sheets and copper tapes. This test was arbitrarily stopped after 305 hours since the corrosion behavior
had plateaued. The copper tapes and grit blasted/polished sheets are used as a corrosion reference to
gauge how the metallized composites perform comparatively. Copper sheets were grit blasted with the
same parameters as the Invar mould to observe if the specific grit blasting surface roughness would
promote corrosion. The specimen type and the time subjected to corrosion are illustrated in Figure 136
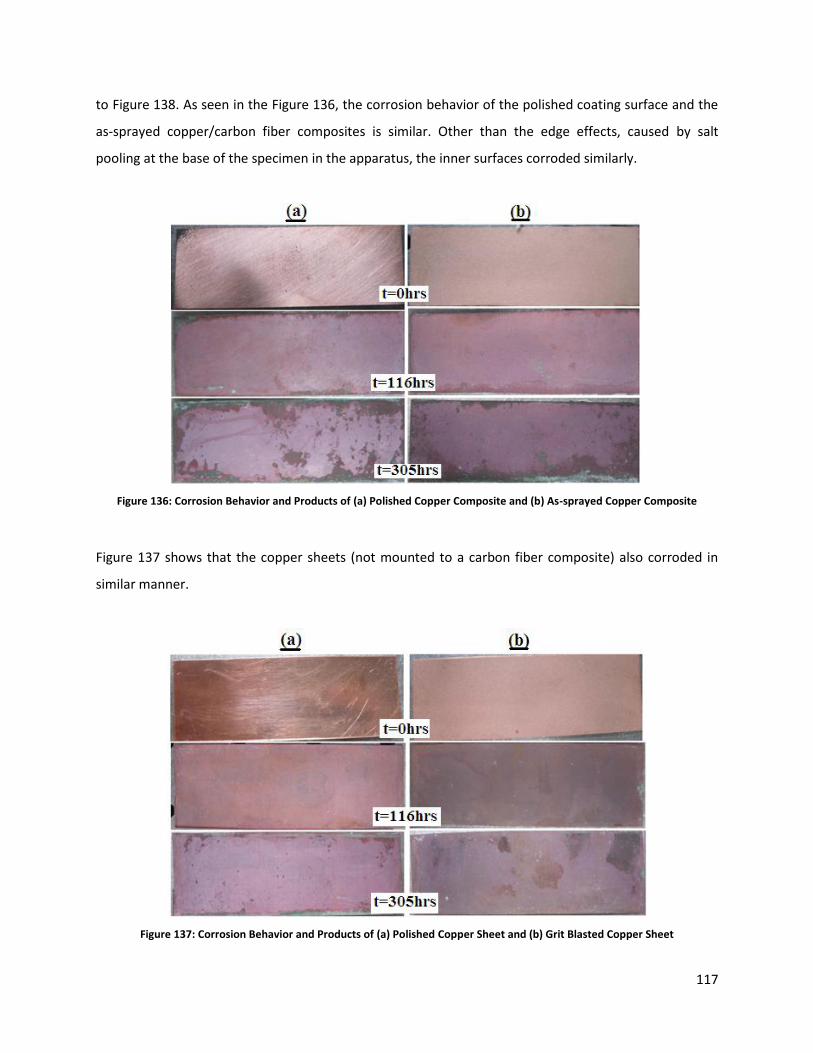
117
to Figure 138. As seen in the Figure 136, the corrosion behavior of the polished coating surface and the
as-sprayed copper/carbon fiber composites is similar. Other than the edge effects, caused by salt
pooling at the base of the specimen in the apparatus, the inner surfaces corroded similarly.
Figure 136: Corrosion Behavior and Products of (a) Polished Copper Composite and (b) As-sprayed Copper Composite
Figure 137 shows that the copper sheets (not mounted to a carbon fiber composite) also corroded in
similar manner.
Figure 137: Corrosion Behavior and Products of (a) Polished Copper Sheet and (b) Grit Blasted Copper Sheet
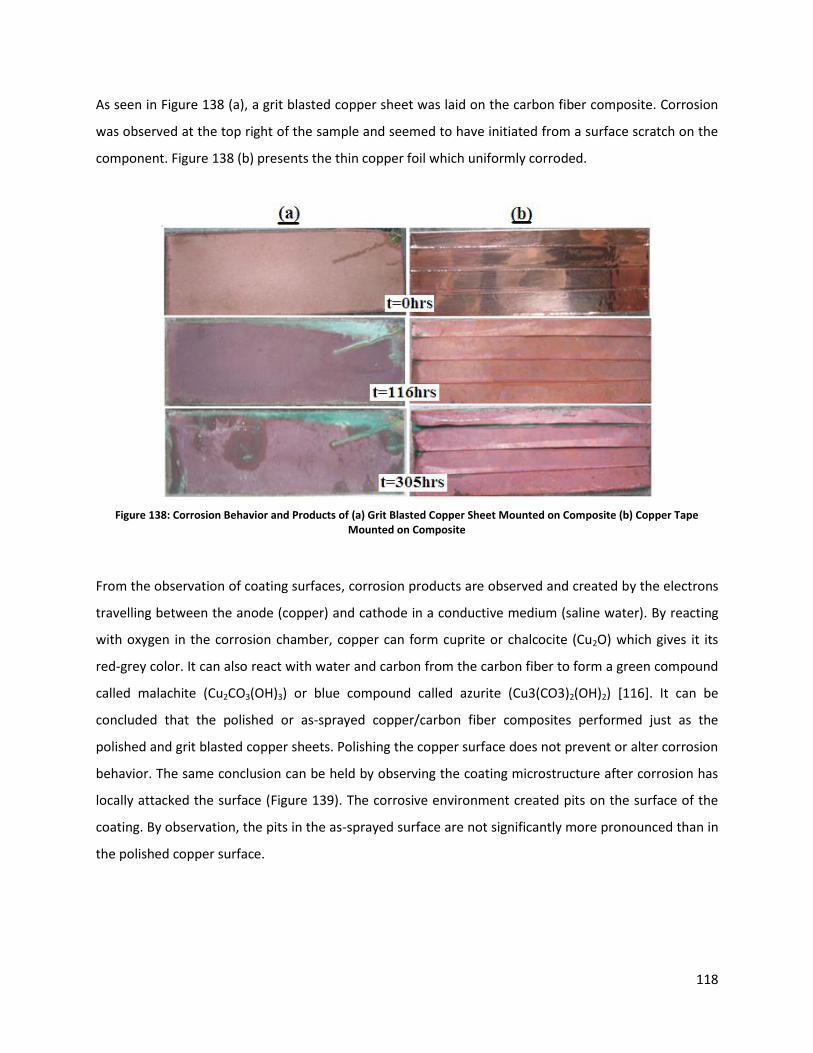
118
As seen in Figure 138 (a), a grit blasted copper sheet was laid on the carbon fiber composite. Corrosion
was observed at the top right of the sample and seemed to have initiated from a surface scratch on the
component. Figure 138 (b) presents the thin copper foil which uniformly corroded.
Figure 138: Corrosion Behavior and Products of (a) Grit Blasted Copper Sheet Mounted on Composite (b) Copper Tape Mounted on Composite
From the observation of coating surfaces, corrosion products are observed and created by the electrons
travelling between the anode (copper) and cathode in a conductive medium (saline water). By reacting
with oxygen in the corrosion chamber, copper can form cuprite or chalcocite (Cu2O) which gives it its
red-grey color. It can also react with water and carbon from the carbon fiber to form a green compound
called malachite (Cu2CO3(OH)3) or blue compound called azurite (Cu3(CO3)2(OH)2) [116]. It can be
concluded that the polished or as-sprayed copper/carbon fiber composites performed just as the
polished and grit blasted copper sheets. Polishing the copper surface does not prevent or alter corrosion
behavior. The same conclusion can be held by observing the coating microstructure after corrosion has
locally attacked the surface (Figure 139). The corrosive environment created pits on the surface of the
coating. By observation, the pits in the as-sprayed surface are not significantly more pronounced than in
the polished copper surface.

119
Figure 139: Microstructure of Corroded (a) As-sprayed Copper CFRC and (b) Polished Surface Copper CFRC
5.3.4 Micro-hardness
The Vickers micro-hardness (HV0.05) of aluminum and copper coatings was measured. Despite the
selection of the SST-C5003 powder for suitable adhesion, the SST-A5001 and Praxair Cu-159 coating are
analyzed for comparative reasons. Figure 140 and Figure 141 respectively show the hardness for various
spray parameters and powder materials as well as for different powder feeder rotational rates. Figure
140 shows that the hardness of copper coatings is greater than the hardness of aluminum coatings.
Similar values for the SST-C5003 copper and the Praxair Cu-159 copper were found. In general, the
values measured are significantly higher than the bulk values of aluminum (HV1kg = 25) and bulk copper
(HV1kg = 40) since the coating process (particle plastic deformation) as well as the powder manufacturing
process strain hardens the powder [117]. In Figure 141, for the suitable spray parameters (2.2 MPa and
300°C), the hardness of the produced copper coatings is not affected for a varying traverse velocity and
powder feed rate.

120
*Some samples could not be tested for micro-hardness because no coatings could be produced at the stated spray parameters.
Figure 140: Coating Vickers Micro-hardness (HV0.05) vs. Spray Parameters and Powder Material
Figure 141: Coating Vickers Micro-hardness (HV0.05) vs. Powder Feed Rate (RPM) (SST-C5003 Deposited at 2.2 MPa and 300°C)
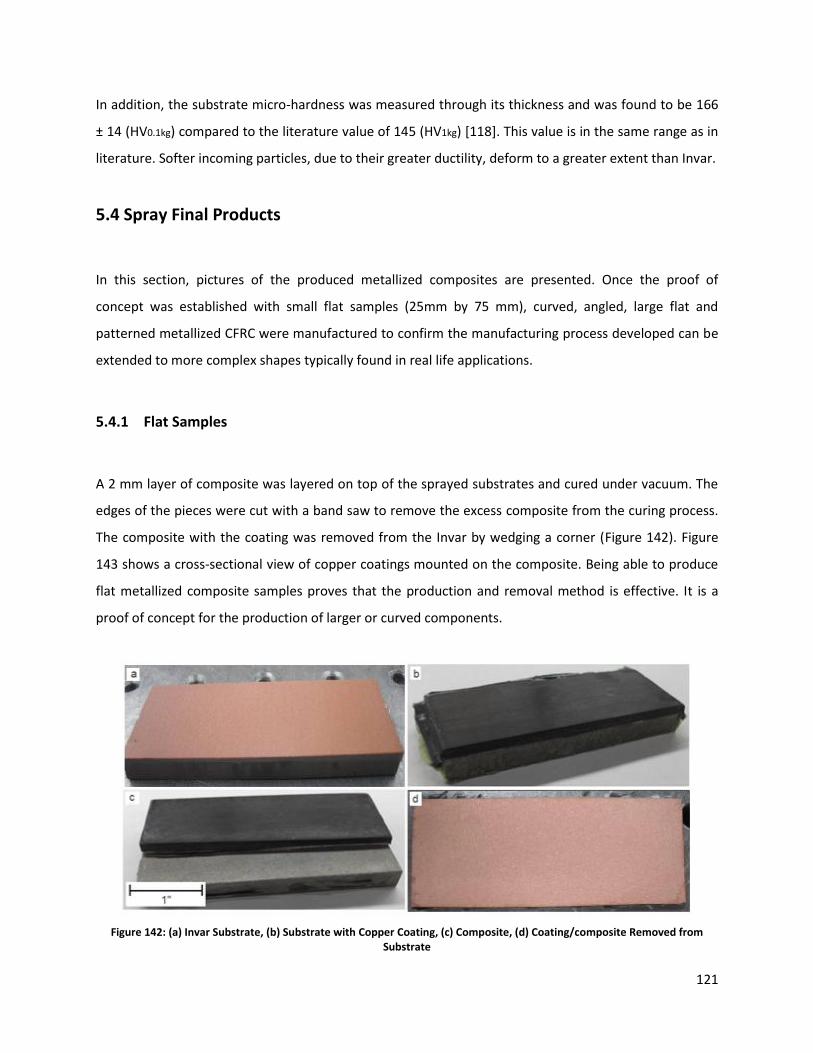
121
In addition, the substrate micro-hardness was measured through its thickness and was found to be 166
± 14 (HV0.1kg) compared to the literature value of 145 (HV1kg) [118]. This value is in the same range as in
literature. Softer incoming particles, due to their greater ductility, deform to a greater extent than Invar.
5.4 Spray Final Products
In this section, pictures of the produced metallized composites are presented. Once the proof of
concept was established with small flat samples (25mm by 75 mm), curved, angled, large flat and
patterned metallized CFRC were manufactured to confirm the manufacturing process developed can be
extended to more complex shapes typically found in real life applications.
5.4.1 Flat Samples
A 2 mm layer of composite was layered on top of the sprayed substrates and cured under vacuum. The
edges of the pieces were cut with a band saw to remove the excess composite from the curing process.
The composite with the coating was removed from the Invar by wedging a corner (Figure 142). Figure
143 shows a cross-sectional view of copper coatings mounted on the composite. Being able to produce
flat metallized composite samples proves that the production and removal method is effective. It is a
proof of concept for the production of larger or curved components.
Figure 142: (a) Invar Substrate, (b) Substrate with Copper Coating, (c) Composite, (d) Coating/composite Removed from Substrate

122
Figure 143: Cross-sectional View of Carbon Fiber/copper Composite
5.4.2 Curved Samples
As shown in Figure 144 to Figure 147, copper/carbon fiber composites were produced on curved Invar
substrates (concave and convex). Invar blanks having different radii of curvature (88 mm, 124 mm and
170 mm) were machined by wire EDM. The production of curves samples demonstrates that
components having various geometries can be produced.
Figure 144: Concave and Convex Invar Substrate Machined from Invar Flat Plate

123
Figure 145: Sprayed Concave and Convex Invar Substrate
Figure 146: Concave and Convex Carbon Fiber/copper Composite
Figure 147: Convex Carbon Fiber/copper Composite with Shaved Edges

124
As depicted in Figure 148, two concave airfoil shaped moulds were coated with a thin copper layer.
Subsequently, a carbon fiber composite was laid over the coating and cured in the oven. The airfoil
shaped copper/carbon fiber composite (Figure 149) was removed from the mould. The removal
technique of the metallized composite from the curved mould was as efficient as for the flat samples.
The only challenge while producing curved samples is to keep the SOD constant relative to the substrate
with the swing mechanism.
Figure 148: Coated Concave Airfoil Mould
Figure 149: Carbon Fiber/copper Composite Airfoil
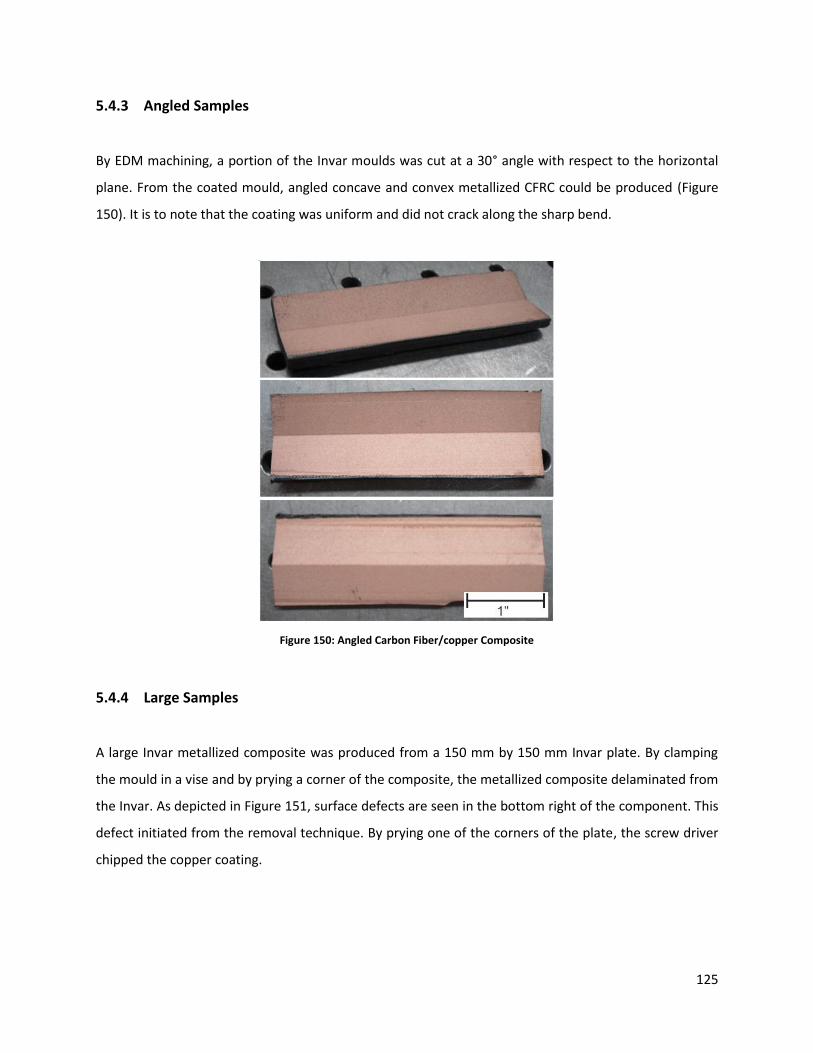
125
5.4.3 Angled Samples
By EDM machining, a portion of the Invar moulds was cut at a 30° angle with respect to the horizontal
plane. From the coated mould, angled concave and convex metallized CFRC could be produced (Figure
150). It is to note that the coating was uniform and did not crack along the sharp bend.
Figure 150: Angled Carbon Fiber/copper Composite
5.4.4 Large Samples
A large Invar metallized composite was produced from a 150 mm by 150 mm Invar plate. By clamping
the mould in a vise and by prying a corner of the composite, the metallized composite delaminated from
the Invar. As depicted in Figure 151, surface defects are seen in the bottom right of the component. This
defect initiated from the removal technique. By prying one of the corners of the plate, the screw driver
chipped the copper coating.
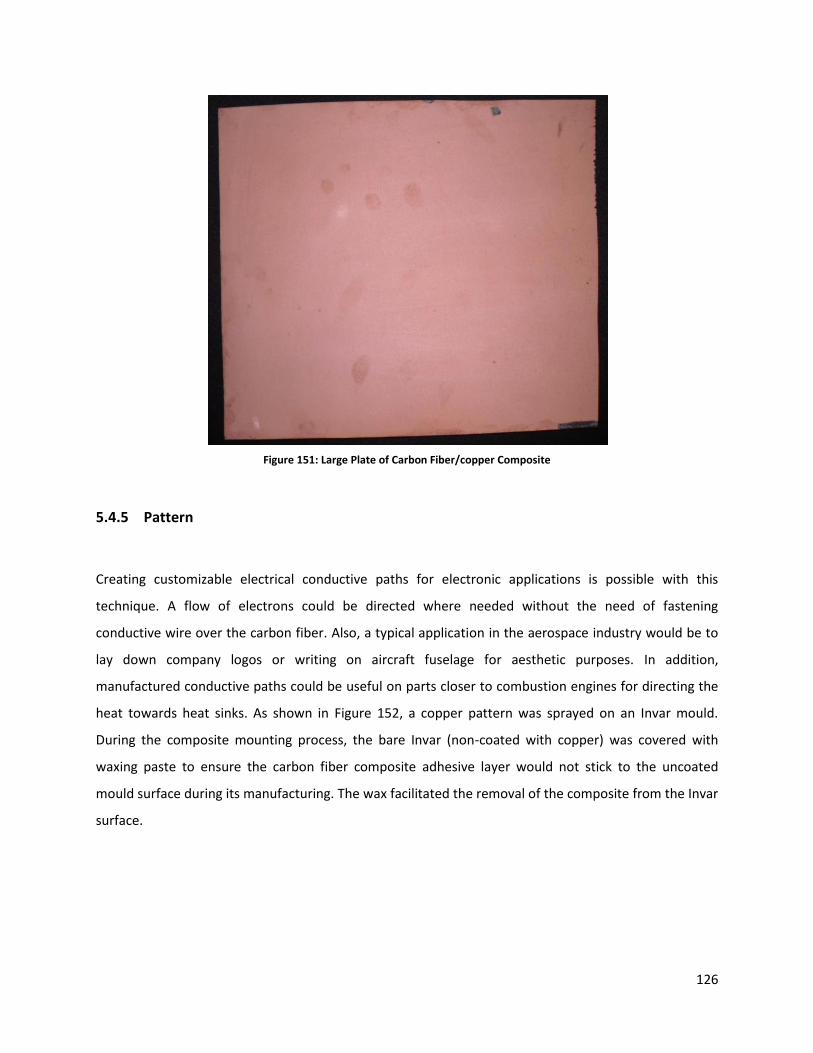
126
Figure 151: Large Plate of Carbon Fiber/copper Composite
5.4.5 Pattern
Creating customizable electrical conductive paths for electronic applications is possible with this
technique. A flow of electrons could be directed where needed without the need of fastening
conductive wire over the carbon fiber. Also, a typical application in the aerospace industry would be to
lay down company logos or writing on aircraft fuselage for aesthetic purposes. In addition,
manufactured conductive paths could be useful on parts closer to combustion engines for directing the
heat towards heat sinks. As shown in Figure 152, a copper pattern was sprayed on an Invar mould.
During the composite mounting process, the bare Invar (non-coated with copper) was covered with
waxing paste to ensure the carbon fiber composite adhesive layer would not stick to the uncoated
mould surface during its manufacturing. The wax facilitated the removal of the composite from the Invar
surface.
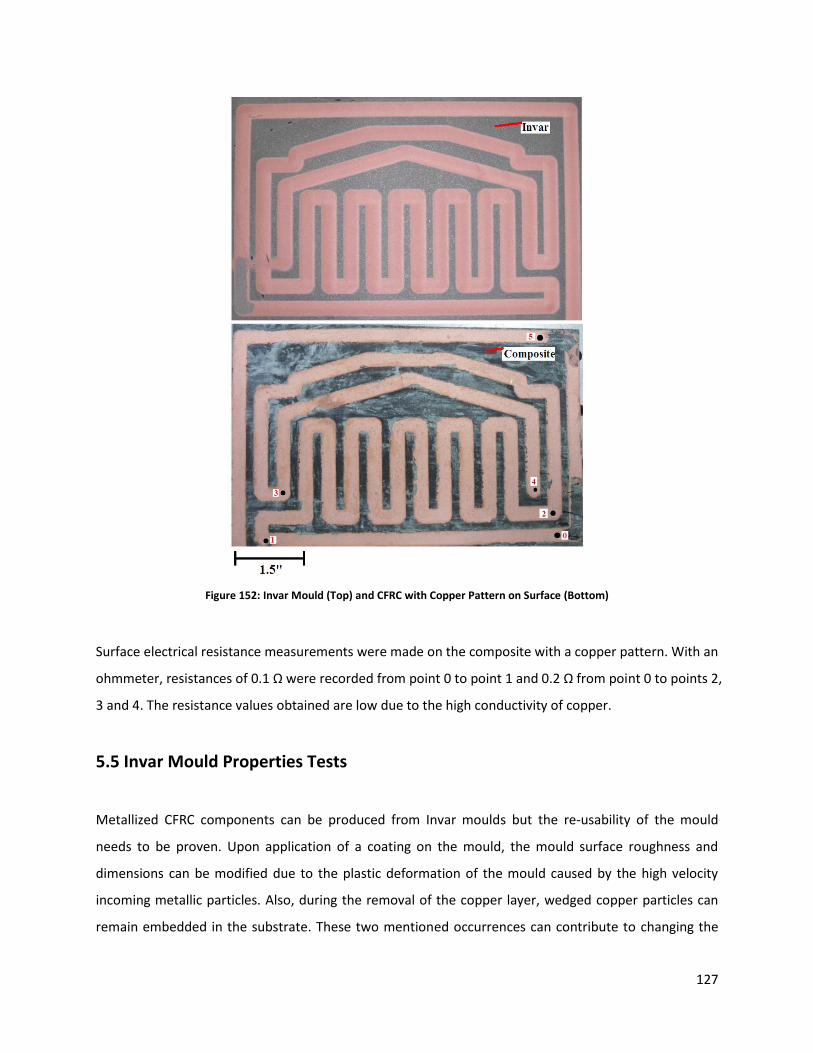
127
Figure 152: Invar Mould (Top) and CFRC with Copper Pattern on Surface (Bottom)
Surface electrical resistance measurements were made on the composite with a copper pattern. With an
ohmmeter, resistances of 0.1 Ω were recorded from point 0 to point 1 and 0.2 Ω from point 0 to points 2,
3 and 4. The resistance values obtained are low due to the high conductivity of copper.
5.5 Invar Mould Properties Tests
Metallized CFRC components can be produced from Invar moulds but the re-usability of the mould
needs to be proven. Upon application of a coating on the mould, the mould surface roughness and
dimensions can be modified due to the plastic deformation of the mould caused by the high velocity
incoming metallic particles. Also, during the removal of the copper layer, wedged copper particles can
remain embedded in the substrate. These two mentioned occurrences can contribute to changing the

128
surface morphology and roughness of the substrate; which are leading factors in coating to mould
adhesion. The following section will look at the temporal variation of mould properties with subsequent
coating applications. More specifically, properties such as surface roughness and the percentage of the
surface covered by embedded particles will be investigated. Finally, a strategy to remove the embedded
particles will be established. This strategy must remove the embedded particles without changing the
dimensional tolerances of the Invar mould.
5.5.1 Post-spray Surface Roughness and Percentage of Substrate Surface Covered by
Remaining Spray Particles
Despite the selection of the SST-C5003 powder for suitable adhesion, the substrates used for the SST-
A5001 and Praxair Cu-159 coatings are analyzed for comparative reasons. As shown in Figure 153 to
Figure 155, aluminum and copper particles remained on the Invar substrate after removal of the coating.
The images show the three dimension topography (left) and top (right) views of the mould surface after
removal of the coating along with the composite. These particles adhered to the substrate and were not
removed during the composite removal. For some particles, the fact that the adhesion of substrate to
particle is more significant than the cohesion of particle to particle in the coating results in the particle
adhering to the substrate rather than being removed with the coating.
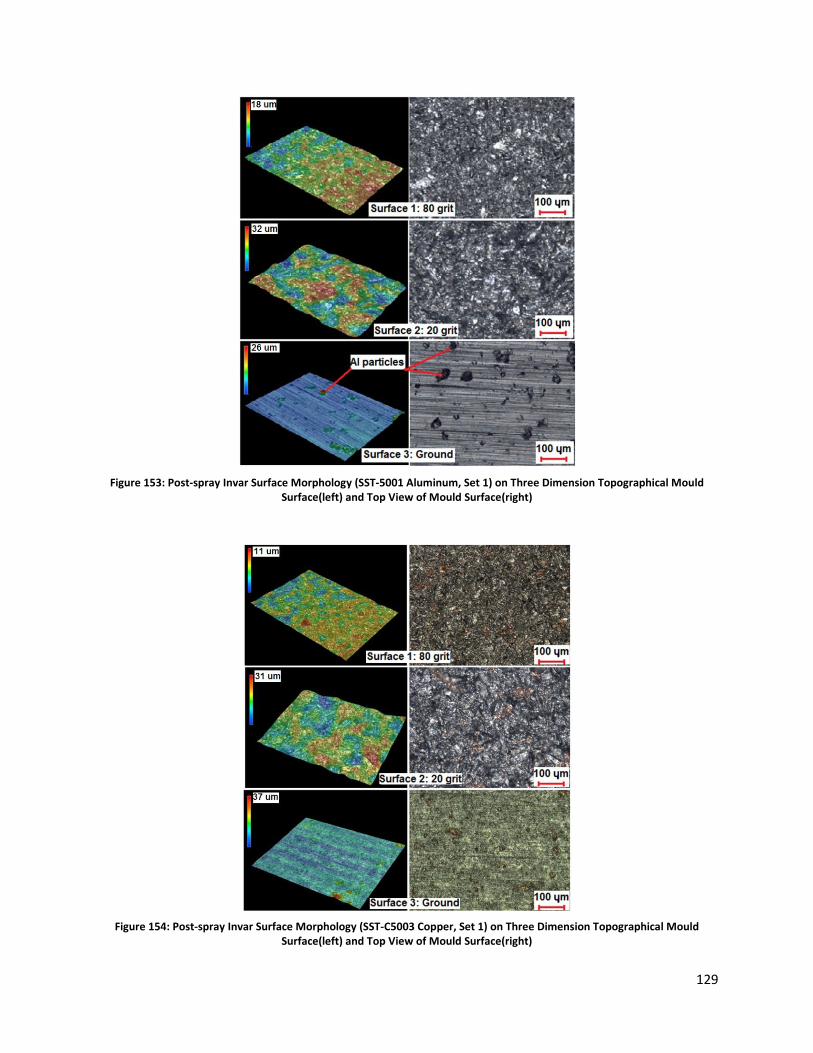
129
Figure 153: Post-spray Invar Surface Morphology (SST-5001 Aluminum, Set 1) on Three Dimension Topographical Mould Surface(left) and Top View of Mould Surface(right)
Figure 154: Post-spray Invar Surface Morphology (SST-C5003 Copper, Set 1) on Three Dimension Topographical Mould Surface(left) and Top View of Mould Surface(right)

130
Figure 155: Post-spray Invar Surface Morphology (Praxair Cu-159 Copper, Set 1) on Three Dimension Topographical Mould Surface(left) and Top View of Mould Surface(right)
Figure 156 shows the percentage area of substrate covered by adhered powder particles after removing
the composite. This percentage was calculated using optical microscope imaging (light contrast between
the substrate and the remaining particles). In general, as the surface roughness increases (from ground
to 20 grit), more particles remain on the substrate. This is due to more anchoring points for the particles
to adhere and bigger surface peaks/valleys on which particles can be wedged. For the aluminum
particles remaining on the substrate, the adhesion of substrate to particle is more significant than the
cohesion of particle to particle in the coating. This results in the adhesion of the aluminum particle to
the substrate rather than being removed with the coating. Also, SST-C5003 copper had more particles
remaining on the substrate than Praxair Cu-159 copper because the dendritic particles have an
increased probability of being wedged on the substrate due to their shape (more branches vs. spherical
shape).

131
*-The percentage of the aluminum particles on grit surfaces could not be evaluated due to the low contrast between the
surface and the particles.
**-The percentage of particles of the inconsistent copper coatings was not evaluated.
Figure 156: Percentage Area of Substrate Covered by Adhered Powder Particles after the Composite Removal
Figure 157 demonstrates that the change of Ra roughness from before to after spray is below 1 µm for
all sprays. In general, a greater change in roughness occurs with aluminum because the adhesion
strength of aluminum coatings is greater than copper coatings. This leads to a greater surface coverage
by aluminum particles causing more changes in roughness. More particles remain embedded in the
substrate. In Figure 157, the high change of roughness for the SST-C5003-Set 2 sprayed on a ground
surface can be attributed to the impacting particles partially depositing on the substrate during spray
without producing a coating. Many more particles remained on the substrate in comparison to other
sprays. To conclude, it was observed that more particles embedded in the substrate correlated with
greater changes in surface roughness.

132
Figure 157: Substrate Roughness (Ra in μm) before and after Spray
Apart from analyzing the behavior of spraying multiple metallic powders on Invar, the effect of the spray
traverse velocity and powder feeder rotational rate was investigated. With the chosen suitable
parameters (2.2 MPa and 300°C) and powder (SST-C5003), the area percent covered by copper was
qualitatively observed and the post-spray roughness was calculated. Figure 158 shows that all surfaces
look similar in terms of copper content. No significant observable differences can be distinguished
between a powder feed rate of 2 RPM to 16 RPM.
Figure 158: Post-spray and Post Composite Removal Invar Surface Morphology

133
In Figure 159, the change in roughness from before spray to after coating removal demonstrates that
the feed rate, correlated to gun traverse velocity, does not influence the surface roughness variation.
Figure 159: Pre to Post-spray Absolute Change in Substrate Surface Roughness (Ra in µm) vs. Powder Feed Rate (RPM)
5.5.2 Multiple Sprays on Mould Surface Characterization
Residual copper can be left on the Invar mould surface during the removal of the copper/carbon fiber
composite from the mould. The mould surface before and after metallized CFRC removal can be
observed in Figure 160.
Figure 160: Pre-spray and Post Composite Removal Invar Mould Surface Morphology
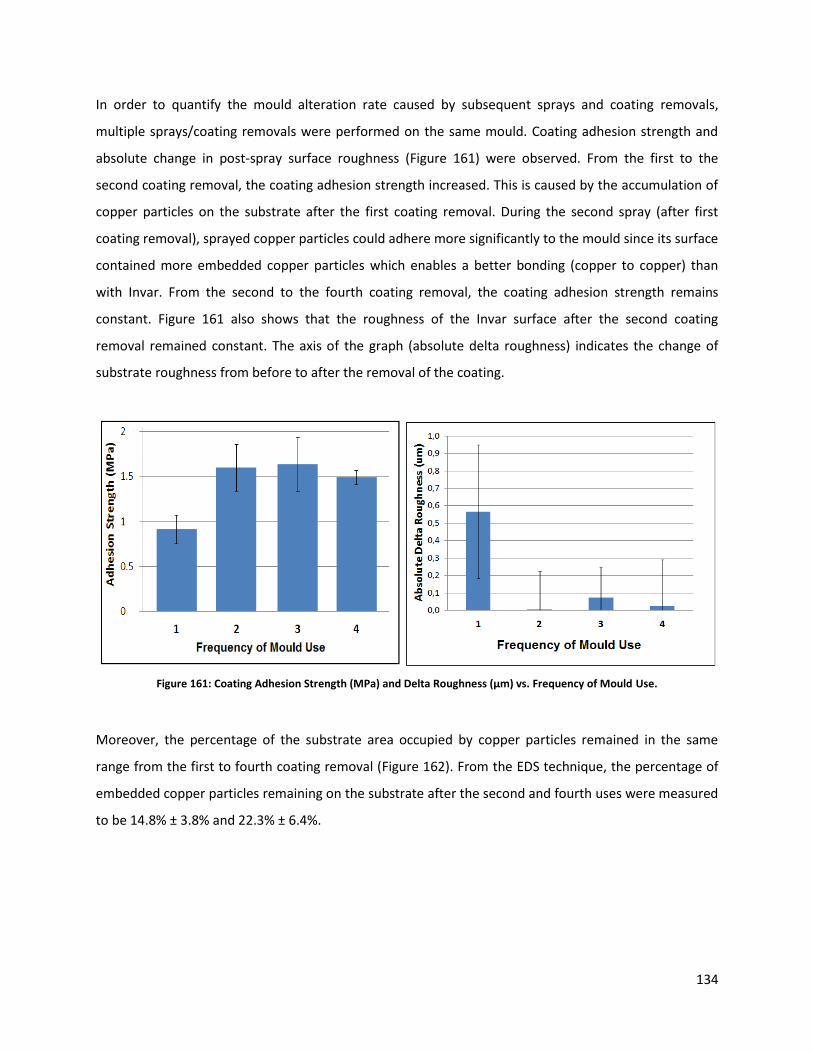
134
In order to quantify the mould alteration rate caused by subsequent sprays and coating removals,
multiple sprays/coating removals were performed on the same mould. Coating adhesion strength and
absolute change in post-spray surface roughness (Figure 161) were observed. From the first to the
second coating removal, the coating adhesion strength increased. This is caused by the accumulation of
copper particles on the substrate after the first coating removal. During the second spray (after first
coating removal), sprayed copper particles could adhere more significantly to the mould since its surface
contained more embedded copper particles which enables a better bonding (copper to copper) than
with Invar. From the second to the fourth coating removal, the coating adhesion strength remains
constant. Figure 161 also shows that the roughness of the Invar surface after the second coating
removal remained constant. The axis of the graph (absolute delta roughness) indicates the change of
substrate roughness from before to after the removal of the coating.
Figure 161: Coating Adhesion Strength (MPa) and Delta Roughness (µm) vs. Frequency of Mould Use.
Moreover, the percentage of the substrate area occupied by copper particles remained in the same
range from the first to fourth coating removal (Figure 162). From the EDS technique, the percentage of
embedded copper particles remaining on the substrate after the second and fourth uses were measured
to be 14.8% ± 3.8% and 22.3% ± 6.4%.

135
Figure 162: Post-spray Invar Surface Morphology vs. Frequency of Mould Use
Based on the results from the mould property alteration test, the mould is not significantly altered with
the spray frequency. Its adhesion strength, change of surface roughness and surface morphology
remains relatively constant with an increase in mould use. The adhesion strength and mould roughness
stabilizes because the valleys in the mould surface, where copper particles can remain anchored, are
now filled with copper particles. When particles from a subsequent spray impact the surface, the
problematic valleys, where previous copper particles are mechanically locked with the substrate,
prevent new incoming particles to be permanently anchored to the substrate.
5.5.3 Removal Treatment of Embedded Particles in Substrate
Even if the coating to mould adhesion strength, surface roughness and percentage of surface covered by
copper particles stabilizes with multiple sprays, it is interesting to develop a technique to remove the
excess copper. Various copper removal methods were investigated in order to reduce the post-spray
embedded copper on the mould surface. Figure 163 depicts the Invar surface after the corresponding

136
chemical or mechanical surface treatment was used. In view of dissolving copper, the post-spray
substrates were chemically treated by being submerged for 7 hours in either: methylene chloride,
hydrofluoric acid (HF), hydrogen peroxide (H2O2), acetone or nitric acid (HNO3). Mechanically, the
substrates were either grit blasted again (as they were initially prepared) or brushed with a steel brush
to dislodge the embedded copper particles. In addition, the surface roughness of the treated surfaced
was compared to the initial pre-spray mould surface roughness. It was found that neither the
mechanical or chemical surface treatments altered the surface roughness of the Invar. Table 13 lists the
process, its effectiveness for copper removal and the effect of the treatment on surface roughness.
Figure 163: Invar Mould Surface after Mechanical or Chemical Treatment

137
Table 13: Effect of Mechanical or Chemical Treatment on Copper Particles or Invar Mould
Removed Cu Changed Invar Ra
Steel Brush
Methylene Chloride – 7 hrs
HF – 7 hrs
H2O2 – 7 hrs
Acetone – 7 hrs
HNO3 – 7 hrs
HNO3–0.5 hr
Grit Blast
= Copper completely removed
= Some copper removed
= No change
From the mechanical or chemical copper removal tests, it was shown that the nitric acid and the grit
blasting methods succeeded without altering the surface properties of the Invar mould. With the nitric
acid technique, copper was completely removed in 0.5 hour and the substrate roughness before and
after treatment was 4.6 μm. Similarly with the grit blasting method, the roughness changed from 4.5 μm
to 4.3 μm. With the steel brush, not all the copper was removed from the substrate. From the
quantitative analysis (EDS) for the percentage of copper remaining from the brushing method, 7.2% of
the area was still covered by copper in comparison with 14.8% prior treatment. The roughness changed
from 4.6 μm to 4.8 μm. All variations in surface roughness are insignificant and well below the measured
standard deviations.
After treating the Invar substrate with nitric acid, copper was re-sprayed on the Invar substrate. The
samples were cut, mounted and polished to observe if the chemical treatment affected the spray
dynamics and the coating quality. Figure 164 illustrates that the coating quality is not altered by the
chemical treatment. In essence, the nitric acid chemical treatment on the substrate does not affect
subsequent spray dynamics and coating quality.
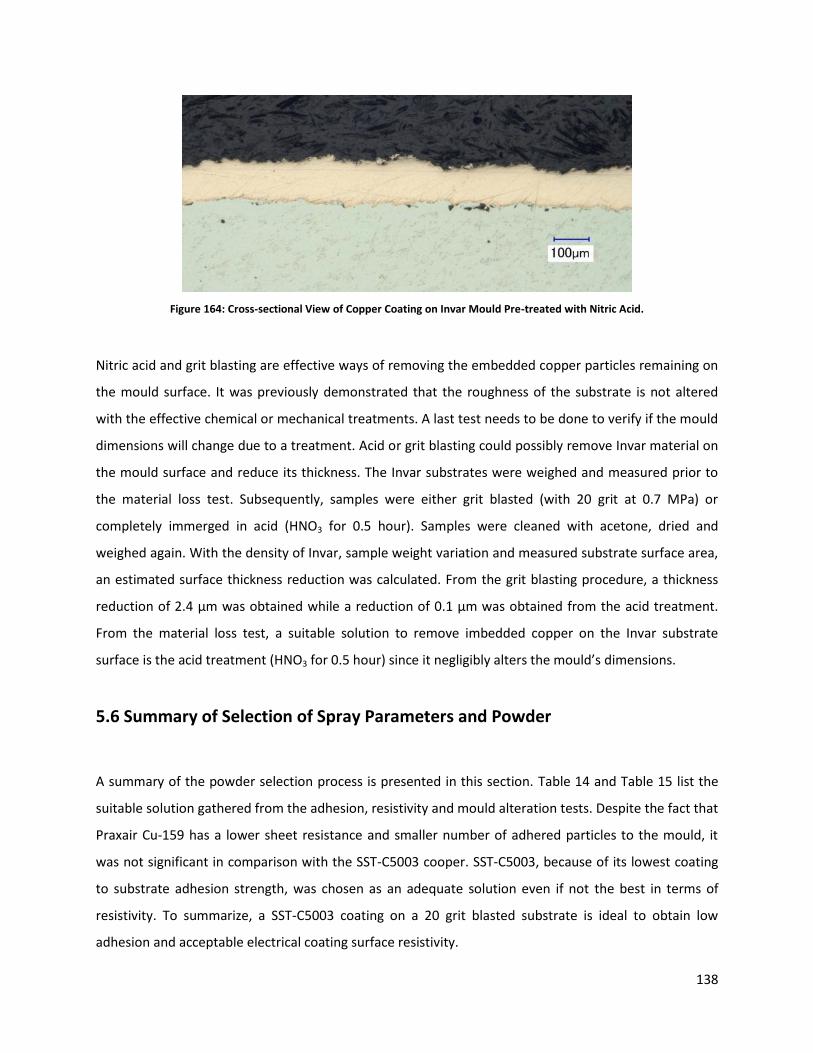
138
Figure 164: Cross-sectional View of Copper Coating on Invar Mould Pre-treated with Nitric Acid.
Nitric acid and grit blasting are effective ways of removing the embedded copper particles remaining on
the mould surface. It was previously demonstrated that the roughness of the substrate is not altered
with the effective chemical or mechanical treatments. A last test needs to be done to verify if the mould
dimensions will change due to a treatment. Acid or grit blasting could possibly remove Invar material on
the mould surface and reduce its thickness. The Invar substrates were weighed and measured prior to
the material loss test. Subsequently, samples were either grit blasted (with 20 grit at 0.7 MPa) or
completely immerged in acid (HNO3 for 0.5 hour). Samples were cleaned with acetone, dried and
weighed again. With the density of Invar, sample weight variation and measured substrate surface area,
an estimated surface thickness reduction was calculated. From the grit blasting procedure, a thickness
reduction of 2.4 µm was obtained while a reduction of 0.1 µm was obtained from the acid treatment.
From the material loss test, a suitable solution to remove imbedded copper on the Invar substrate
surface is the acid treatment (HNO3 for 0.5 hour) since it negligibly alters the mould’s dimensions.
5.6 Summary of Selection of Spray Parameters and Powder
A summary of the powder selection process is presented in this section. Table 14 and Table 15 list the
suitable solution gathered from the adhesion, resistivity and mould alteration tests. Despite the fact that
Praxair Cu-159 has a lower sheet resistance and smaller number of adhered particles to the mould, it
was not significant in comparison with the SST-C5003 cooper. SST-C5003, because of its lowest coating
to substrate adhesion strength, was chosen as an adequate solution even if not the best in terms of
resistivity. To summarize, a SST-C5003 coating on a 20 grit blasted substrate is ideal to obtain low
adhesion and acceptable electrical coating surface resistivity.

139
Table 14: Selection of Powder and Substrate Preparation Based on Criteria
Criteria Selection
Adhesion Strength SST-C5003 Copper – 20 Grit Sheet Resistance Praxair Cu-159 Copper
Change of Substrate Roughness SST-C5003 Copper – 20 Grit Percentage of Remaining Particles Praxair Cu-159 Copper – 20 Grit
Table 15: Selection of Spray Parameters, Powder and Substrate Preparation Method Based on Criteria
SST-A5001 Aluminum SST-C5003 Copper Praxair Cu-159 Copper
Set 1 Set 2 Set 1 Set 2 Set 1 Set 2
Ground
80 Grit
20 Grit
= Non suitable solution
= No coating achieved
= Optimal for adhesion strength
= Optimal for electrical resistivity
= Preliminary suitable solution
As demonstrated earlier, a Taguchi optimization scheme was done with the selected SST-C5003 powder
and preliminary suitable solution (1.7 MPa and 350°C on a 20 grit blasted substrate at 0.7 MPa). Table
16 reiterates the refined CS parameters employed to produce metallized CFRC.

140
Table 16: Suitable Spray Parameters for Copper (SST-C5003)
Parameter Selection Value
Gas Temperature 300 °C Gas Pressure 2.2 MPa Gas Nature Nitrogen
Standoff Distance 15 mm Feed Rate 16 rpm
Feed Wheel Type 320 small hole Powder Feeder Gas Flow Rate 25 SCFM
Powder Feeder Gas Nature Nitrogen Nozzle Type 120 mm SS Nozzle
Orifice Diameter 2 mm Traverse Velocity 175 mm/s Number of Passes 1
Step Size 1 mm (39.3 mil)

141
Chapter 6 – Conclusion
Working in collaboration with The Boeing Company, a research study was performed to explore the
possibility of covering a CFRC with a thin metallic layer. This conductive composite, used as an integral
component of an aircraft’s fuselage, will have the purpose of dissipating the current generated by
lightening striking the fuselage. As lightning hits the coated fuselage, local melting of the fuselage is
avoided because the conductive layer will conduct electricity to the airplane’s electrical grounding
system. By using CGDS techniques, a procedure was developed where a thin conductive layer of
material was sprayed on an Invar mould. Subsequently, a CFRC was built on the mould over the coating
and removed from the mould along with the coating. This resulted in a coated CFRC appropriate for the
application specified by The Boeing Company. The goals of this study were threefold: first to
demonstrate the feasibility of producing a metallized CFRC, then evaluating the properties of the
produced components as well as the mould and finally to show that pieces of various shapes and sizes
were possible to produce. It is important to acknowledge that The Boeing Company have specified that
the metallic layer covering the composite shall have a thickness of 75 µm to 125 µm and an electrical
resistivity lower than 8.40 x10⁻⁸ Ωm. Also, the coating layer shall be easily removable from the Invar
mould; therefore have low adhesion strength with the Invar substrate. Finally, the process should result
in minimum mould damage; as it would be efficient to reuse the mould to manufacture many metallized
CFRC components.
First, CGDS parameters were chosen to deposit aluminum or copper powders on flat Invar surfaces.
From these preliminary tests, a range of spray parameters from which coatings could be produced, was
recorded. A CFRC was mounted on the coating and removed from the mould. A considerable force was
needed to pry the corner of the metallized CFRC and to de-bond the component from the Invar. It was
noted that the substrate surface finish affected the force employed to separate the metallized
component from the mould. The feasibility of the manufacturing process was established since a coated
CFRC could be manufactured.
Secondly, a selection of coating powder, CGDS spray parameters and mould surface roughness was
captured as essential for the project to progress towards the goals set by The Boeing Company. With
two sets of spray parameters, found from the range of spray parameters which successfully produced
coatings on Invar, aluminum and two copper powders were separately deposited on Invar substrates

142
having three different surface finishes (ground, 80 grit blasted and 20 grit blasted). With a tensile
adhesion test to evaluate the coating to mould adhesion strength, a powder on a given Invar substrate
roughness for a set of spray parameters was chosen as adequate for this preliminary step. SST-C5003
copper sprayed at 1.7 MPa and 350°C on a 0.7 MPa 20 grit blasted substrate (Ra roughness of 3.94 µm)
resulted in the lowest adhesion strength among all other powders, spray parameters and substrate
preparation combinations. Once the solution was narrowed, a Taguchi optimization scheme was
performed around the discovered adequate spray parameters. With various tests at different spray
pressures and temperatures for coating thicknesses of 75 µm to 125 µm, a suitable solution was found.
A higher pressure (2.2 MPa) at a low temperature (300°C) for a 100 µm thick coatings led to the highest
amount of particle cold work; thus contributing to an increase of coating residual stress promoting
delamination. The next step was to establish the spray gun traverse velocity and powder feeder
rotational rate. It was shown that a higher velocity (175 mm/s) with a greater feed rate (16 RPM) would
not increase the coating adhesion strength.
Even if suitable coatings in terms of adhesion could be produced, a full characterization of the coating
and the mould was required. Here is a summary of the findings from the tests conducted on the coatings
and the mould:
The coating to mould adhesion strength is 1.2 MPa± 0.2 MPa (measured with the PATTI).
The coating to composite adhesion strength is 5.2 MPa± 0.7 MPa (measured with the PATTI).
The metallized composite failed at 633 MPa ± 49 MPa in a four point bending test performed
with the Instron. This proves that the composite to coating interface resists a shear stress of 633
MPa± 49 MPa since the coating did not shear from the composite.
The coating cohesion strength (particle to particle adhesion) is 2.6 MPa± 0.8 MPa (measured
with the PATTI). Since this value is greater than the coating to mould adhesion strength, the
coating will be able to be removed from the mould without failing.
The coating Vickers hardness (HV0.05) is 168 ± 17 (measured with the Vickers hardness machine).
The coating electrical resistivity is 3.6 x10⁻⁸ Ωm ± 0.3 x10⁻⁸ Ωm (measured with the ohmmeter
and the four point probe resistivity sensor). It passes the requirements set by The Boeing
Company.
The mould roughness change from the spray process is below 1 µm. It does not affect the
dynamics and properties of subsequent sprays.
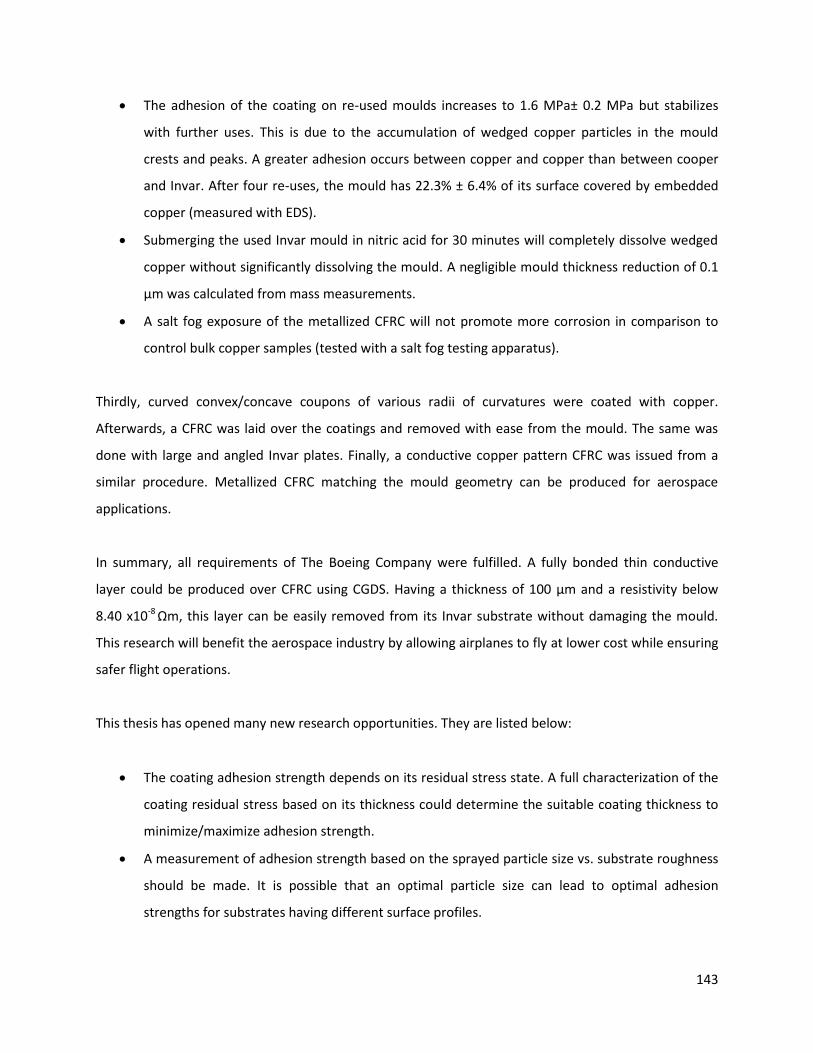
143
The adhesion of the coating on re-used moulds increases to 1.6 MPa± 0.2 MPa but stabilizes
with further uses. This is due to the accumulation of wedged copper particles in the mould
crests and peaks. A greater adhesion occurs between copper and copper than between cooper
and Invar. After four re-uses, the mould has 22.3% ± 6.4% of its surface covered by embedded
copper (measured with EDS).
Submerging the used Invar mould in nitric acid for 30 minutes will completely dissolve wedged
copper without significantly dissolving the mould. A negligible mould thickness reduction of 0.1
µm was calculated from mass measurements.
A salt fog exposure of the metallized CFRC will not promote more corrosion in comparison to
control bulk copper samples (tested with a salt fog testing apparatus).
Thirdly, curved convex/concave coupons of various radii of curvatures were coated with copper.
Afterwards, a CFRC was laid over the coatings and removed with ease from the mould. The same was
done with large and angled Invar plates. Finally, a conductive copper pattern CFRC was issued from a
similar procedure. Metallized CFRC matching the mould geometry can be produced for aerospace
applications.
In summary, all requirements of The Boeing Company were fulfilled. A fully bonded thin conductive
layer could be produced over CFRC using CGDS. Having a thickness of 100 µm and a resistivity below
8.40 x10⁻⁸ Ωm, this layer can be easily removed from its Invar substrate without damaging the mould.
This research will benefit the aerospace industry by allowing airplanes to fly at lower cost while ensuring
safer flight operations.
This thesis has opened many new research opportunities. They are listed below:
The coating adhesion strength depends on its residual stress state. A full characterization of the
coating residual stress based on its thickness could determine the suitable coating thickness to
minimize/maximize adhesion strength.
A measurement of adhesion strength based on the sprayed particle size vs. substrate roughness
should be made. It is possible that an optimal particle size can lead to optimal adhesion
strengths for substrates having different surface profiles.

144
The produced metallized components should be subjected to high currents and voltages which
will simulate lightning. The performance of the copper layer and CFRC should be monitored to
see if they perform according to aerospace standards.
Coating patterns on CFRC could be used to heat the CFRC moulds used in the composite
manufacturing industry. By inducing a current through the coating, heat can be generated.
Materials such as titanium can be sprayed on Invar and removed along with a CFRC. Based on
the metal properties, different functions such as wear resistance can be fulfilled.

145
References
[1] “787 Dreamliner Design Highlights - Boeing Commercial Airplanes,” Boeing’s New Airplane, http://www.newairplane.com/787/design_highlights/#/visionary-design/composites/advanced-composite-use. [Accessed: Apr-2014].
[2] “In Focus: No danger despite high voltage - Lufthansa Technik AG.”, http://www.lufthansa-technik.com/lightning-strikes. [Accessed: Nov-2014].
[3] “What happens when lightning hits an aeroplane? - Telegraph.”, http://www.telegraph.co.uk/travel/travelnews/travel-truths/10847640/What-happens-when-lightning-hits-an-aeroplane.html. [Accessed: Nov-2014].
[4] “When Lightning Strikes | Flight Safety Foundation.”, http://flightsafety.org/aerosafety-world-magazine/june-2010/when-lightning-strikes. [Accessed: Nov-2014].
[5] “Lightning Strikes: Protection, Inspection, and Repair.”, http://www.boeing.com/commercial/aeromagazine/articles/2012_q4/4/. [Accessed: Nov-2014].
[6] “Boeing Frontiers Online.”, http://www.boeing.com/news/frontiers/archive/2004/september/i_tt.html. [Accessed: Apr-2014].
[7] J. R. Davis, Handbook of Thermal Spray Technology. ASM International, 2004. [8] H. Assadi, F. Gärtner, T. Stoltenhoff, and H. Kreye, “Bonding mechanism in cold gas spraying,” Acta
Mater., vol. 51, no. 15, pp. 4379–4394, Sep-2003. [9] X. L. Zhou, A. F. Chen, J. C. Liu, X. K. Wu, and J. S. Zhang, “Preparation of metallic coatings on
polymer matrix composites by cold spray,” Surf. Coat. Technol., vol. 206, no. 1, pp. 132–136, Oct-2011.
[10] R. de Oliveira, S. Lavanchy, R. Chatton, D. Costantini, V. Michaud, R. Salathé, and J.-A. E. Manson, “Experimental investigation of the effect of the mould thermal expansion on the development of internal stresses during carbon fibre composite processing,” Compos. Part Appl. Sci. Manuf., vol. 39, no. 7, pp. 1083–1090, Jul-2008.
[11] Callister W, Materials Science And Engineering, 6th Edition, 2002. [12] “How is a plane protected from Lightning strikes?”,
http://www.physlink.com/Education/AskExperts/ae568.cfm. [Accessed: Nov-2014]. [13] “What happens when lightning strikes an airplane? - Scientific American.”,
http://www.scientificamerican.com/article/what-happens-when-lightni/. [Accessed: Nov-2014]. [14] “How Things Work: Lightning Protection | Flight Today | Air & Space Magazine.”,
http://www.airspacemag.com/flight-today/how-things-work-lightning-protection-161993347/?no-ist. [Accessed: Nov-2014].
[15] “SRI International.”, http://www.sri.com/sites/default/timeline/timeline.php?timeline=physical-world#!&innovation=electrostatic-discharge-rod. [Accessed: Nov-2014].
[16] “Dexmet Blog.”, http://blog.dexmet.com/. [Accessed: Nov-2014]. [17] A. Ganesan, M. Yamada, and M. Fukumoto, “The Effect of CFRP Surface Treatment on the Splat
Morphology and Coating Adhesion Strength,” J. Therm. Spray Technol., vol. 23, no. 1–2, pp. 236–244, Jan-2014.
[18] A. Dodworth and A. Feaver, “The metal with the dark side: Bentley develops a sprayed metal panel with a composite substructure,” Univ. Nottm., vol. 8th, International conference on textile composites; TEXCOMP-8, 2006.
[19]“Protective coatings for high temperature polymer composites,” Int. Therm. Spray Conf. - Spraytime, vol. 20, Number 1, no. 1st quarter, 2013.
[20] A. Ganesan, M. Yamada, and M. Fukumoto, “Cold Spray Coating Deposition Mechanism on the Thermoplastic and Thermosetting Polymer Substrates,” J. Therm. Spray Technol., vol. 22, no. 8, pp. 1275–1282, Dec-2013.
146
[21] A. Ganesan, J. Affi, M. Yamada, and M. Fukumoto, “Bonding behavior studies of cold sprayed copper coating on the PVC polymer substrate,” Surf. Coat. Technol., vol. 207, pp. 262–269, Aug-2012.
[22] A. A. Johnston, “An integrated model of the development of process-induced deformation in autoclave processing of composite structures,” 1997.
[23] D. I. Wimpenny and G. J. Gibbons, “Metal spray tooling for composite forming,” J. Mater. Process. Technol., vol. 138, no. 1–3, pp. 443–448, Jul-2003.
[24] S. Baril-Gosselin, “Improving Integrally Heated Composite Tooling Through Cold Sprayed Copper Coatings and Heat Transfer Simulations,” Master’s, Ottawa, 2013.
[25] E. Njuhovic, A. Witt, M. Kempf, F. Wolff-Fabris, S. Glöde, and V. Altstädt, “Influence of the composite surface structure on the peel strength of metallized carbon fibre-reinforced epoxy,” Surf. Coat. Technol., vol. 232, pp. 319–325, Oct-2013.
[26] “Coatings for high temperature applications::electron beam physical vapour deposition.”, http://thomas-sourmail.net/coatings/processes_ebpvd.html. [Accessed: Oct-2014].
[27] “Hot Stamping Article, hot stamping, rotary hot stamping, hot foil stamping, hot stamping equipment, hot stamping die, hot stamping machine.”, http://www.dmsdies.com/HSarticleDMS.html. [Accessed: Aug-2014].
[28] “Electroplating.”, http://www.sciencequiz.net/lcchemistry/01_atomic/mcq/electrolysis/images/electroplate_spoon1a.gif. [Accessed: Aug-2014].
[29] A. Liu, M. Guo, J. Gao, and M. Zhao, “Influence of bond coat on shear adhesion strength of erosion and thermal resistant coating for carbon fiber reinforced thermosetting polyimide,” Surf. Coat. Technol., vol. 201, no. 6, pp. 2696–2700.
[30] P. C. King, A. J. Poole, S. Horne, R. de Nys, S. Gulizia, and M. Z. Jahedi, “Embedment of copper particles into polymers by cold spray,” Surf. Coat. Technol., vol. 216, pp. 60–67, Feb-2013.
[31] R. Lupoi and W. O’Neill, “Deposition of metallic coatings on polymer surfaces using cold spray,” Surf. Coat. Technol., vol. 205, no. 7, pp. 2167–2173, Dec-2010.
[32] D. Giraud, “Study of the mechanical and metallurgical contributions to coating-substrate bonding in cold spray for Aluminium/Polyamide 66 and Titanium/Ti-6Al-4V,” PhD, École nationale supérieure des mines, Paris, 2014.
[33] S. H. Zahiri, C. I. Antonio, and M. Jahedi, “Elimination of porosity in directly fabricated titanium via cold gas dynamic spraying,” J. Mater. Process. Technol., vol. 209, no. 2, pp. 922–929.
[34] “Table of Resistivity.”, http://hyperphysics.phy-astr.gsu.edu/hbase/Tables/rstiv.html. [Accessed:Apr-2014].
[35] W. Lowrie, Fundamentals of Geophysics. Cambridge University Press, 2007. [36] D. Seo, K. Ogawa, K. Sakaguchi, N. Miyamoto, and Y. Tsuzuki, “Parameter study influencing thermal
conductivity of annealed pure copper coatings deposited by selective cold spray processes,” Surf. Coat. Technol., vol. 206, no. 8–9, pp. 2316–2324, Jan-2012.
[37] T. Stoltenhoff, C. Borchers, F. Gärtner, and H. Kreye, “Microstructures and key properties of cold-sprayed and thermally sprayed copper coatings,” Surf. Coat. Technol., vol. 200, no. 16–17, pp. 4947–4960, Apr-2006.
[38] T. Tosaki, Y. Kobayashi, and K. Ohta, “Comparable Study of Electrical and Mechanical Properties in Plasma Sprayed Alumina Coatings,” ASM Int., vol. Thermal Spray 2013: Proceedings of the International Thermal Spray Conference, pp. 312 – 317, May-2013.
[39] T. Stoltenhoff, H. Kreye, and H. J. Richter, “An analysis of the cold spray process and its coatings,” J. Therm. Spray Technol., vol. 11, no. 4, pp. 542–550, Dec-2002.
[40] R. C. McCune, W. T. Donlon, O. O. Popoola, and E. L. Cartwright, “Characterization of copper layers produced by cold gas-dynamic spraying,” J. Therm. Spray Technol., vol. 9, no. 1, pp. 73–82, Mar-2000.

147
[41] W. B. Choi, L. Li, V. Luzin, R. Neiser, T. Gnäupel-Herold, H. J. Prask, S. Sampath, and A. Gouldstone, “Integrated characterization of cold sprayed aluminum coatings,” Acta Mater., vol. 55, no. 3, pp. 857–866, Feb-2007.
[42] J. R. Davis, Corrosion: Understanding the Basics. ASM International, 2000. [43] D. Lahiri, P. K. Gill, S. Scudino, C. Zhang, V. Singh, J. Karthikeyan, N. Munroe, S. Seal, and A. Agarwal,
“Cold sprayed aluminum based glassy coating: Synthesis, wear and corrosion properties,” Surf. Coat. Technol., vol. 232, pp. 33–40, Oct-2013.
[44] H. Lee, H. Shin, S. Lee, and K. Ko, “Effect of gas pressure on Al coatings by cold gas dynamic spray,” Mater. Lett., vol. 62, no. 10–11, pp. 1579–1581, Apr-2008.
[45] “Nature of Thermal Spray Coatings.”, http://www.gordonengland.co.uk/tsc.htm. [Accessed: Apr-2014].
[46] H. Herman, S. Sampath, and R. McCune, “Thermal Spray: Current Status and Future Trends,” MRS Bull., vol. 25, no. 07, pp. 17–25, 2000.
[47] P. Fauchais, “Understanding plasma spraying,” J. Phys. Appl. Phys., vol. 37, no. 9, pp. R86–R108, May-2004.
[48] M. Shibata, S. Kuroda, H. Murakami, M. Ode, M. Watanabe, and Y. Sakamoto, “Comparison of Microstructure and Oxidation Behavior of CoNiCrAlY Bond Coatings Prepared by Different Thermal Spray Processes,” Mater. Trans., vol. 47, no. 7, pp. 1638–1642, 2006.
[49] V. K. Champagne, The Cold Spray Materials Deposition Process: Fundamentals and Applications. Woodhead Publishing Limited, 2007.
[50] M. R. Dorfman, “Thermal Spray Processes,” Adv. Mater. Process., pp. 47–49, Aug. 2002. [51] L. Pawlowski, The Science and Engineering of Thermal Spray Coatings. John Wiley & Sons, 2008. [52] M. L. Thorpe and H. J. Richter, “A pragmatic analysis and comparison of HVOF processes,” J. Therm.
Spray Technol., vol. 1, no. 2, pp. 161–170, Jun-1992. [53] D. Sen, N. M. Chavan, D. S. Rao, and G. Sundararajan, “Influence of Grit Blasting on the Roughness
and the Bond Strength of Detonation Sprayed Coating,” J. Therm. Spray Technol., vol. 19, no. 4, pp. 805–815, Jun-2010.
[54] M. Gupta, K. Skogsberg, and P. Nylén, “Influence of Topcoat-Bondcoat Interface Roughness on Stresses and Lifetime in Thermal Barrier Coatings,” J. Therm. Spray Technol., vol. 23, no. 1–2, pp. 170–181, Jan-2014.
[55] P. Richer, “Development of Conventional and Nanocrystalline Bond Coats by Cold Gas Dynamic Spraying for Aerospace Thermal Barrier Coatings,” PhD, Ottawa, 2010.
[56] S. Kuroda, J. Kawakita, M. Watanabe, and H. Katanoda, “Warm spraying—a novel coating process based on high-velocity impact of solid particles,” Sci. Technol. Adv. Mater., vol. 9, no. 3, p. 033002, Jul-2008.
[57] “Thermal Spray Services | Thermal Spray | Hayden Corporation.”, http://www.haydencorp.com/content.php?p=flame_spray. [Accessed: Aug-2014].
[58] T. Schmidt, H. Assadi, F. Gärtner, H. Richter, T. Stoltenhoff, H. Kreye, and T. Klassen, “From Particle Acceleration to Impact and Bonding in Cold Spraying,” J. Therm. Spray Technol., vol. 18, no. 5–6, pp. 794–808, Dec-2009.
[59]“Cold Spray Process - Thermal Spray coating technology & solutions.”, http://www.fst.nl/cold-spray/. [Accessed: Aug-2014].
[60] S. Sampath, X. Y. Jiang, J. Matejicek, L. Prchlik, A. Kulkarni, and A. Vaidya, “Role of thermal spray processing method on the microstructure, residual stress and properties of coatings: an integrated study for Ni–5 wt.%Al bond coats,” Mater. Sci. Eng. A, vol. 364, no. 1–2, pp. 216–231, Jan-2004.
[61] A. P. Alkhimov, V. F. Kosarev, N. I. Nesterovich, A. N. Papyrin, and M. M. Shushpanov, “Gas-dynamic spraying method for applying a coating,” US5302414 A, Apr-1994.

148
[62] E. Irissou, J.-G. Legoux, A. N. Ryabinin, B. Jodoin, and C. Moreau, “Review on Cold Spray Process and Technology: Part I—Intellectual Property,” J. Therm. Spray Technol., vol. 17, no. 4, pp. 495–516, Dec-2008.
[63] M. Grujicic, C. L. Zhao, W. S. DeRosset, and D. Helfritch, “Adiabatic shear instability based mechanism for particles/substrate bonding in the cold-gas dynamic-spray process,” Mater. Des., vol. 25, no. 8, pp. 681–688, Dec-2004.
[64] V. Luzin, K. Spencer, and M.-X. Zhang, “Residual stress and thermo-mechanical properties of cold spray metal coatings,” Acta Mater., vol. 59, no. 3, pp. 1259–1270, Feb-2011.
[65] S. V. Klinkov, V. F. Kosarev, and M. Rein, “Cold spray deposition: Significance of particle impact phenomena,” Aerosp. Sci. Technol., vol. 9, no. 7, pp. 582–591, Oct-2005.
[66] K. Spencer, V. Luzin, N. Matthews, and M.-X. Zhang, “Residual stresses in cold spray Al coatings: The effect of alloying and of process parameters,” Surf. Coat. Technol., vol. 206, no. 19–20, pp. 4249–4255, May-2012.
[67] T. Goyal, R. S. Walia, and T. S. Sidhu, “Multi-response optimization of low-pressure cold-sprayed coatings through Taguchi method and utility concept,” Int. J. Adv. Manuf. Technol., vol. 64, no. 5–8, pp. 903–914, Feb-2013.
[68] P. C. King and M. Jahedi, “Relationship between particle size and deformation in the cold spray process,” Appl. Surf. Sci., vol. 256, no. 6, pp. 1735–1738, Jan-2010.
[69] R. R. Chromik, D. Goldbaum, J. M. Shockley, S. Yue, E. Irissou, J.-G. Legoux, and N. X. Randall, “Modified ball bond shear test for determination of adhesion strength of cold spray splats,” Surf. Coat. Technol., vol. 205, no. 5, pp. 1409–1414, Nov-2010.
[70] M. Grujicic, J. R. Saylor, D. E. Beasley, W. S. DeRosset, and D. Helfritch, “Computational analysis of the interfacial bonding between feed-powder particles and the substrate in the cold-gas dynamic-spray process,” Appl. Surf. Sci., vol. 219, no. 3–4, pp. 211–227, Dec-2003.
[71] Y. Watanabe, K. Atsumi, M. Yamada, and M. Fukumoto, “Anisotropic Mechanical Properties of Cold Sprayed Copper Coatings,” presented at the International Thermal Spray Conference and Exposition (ITSC), 2013.
[72] R. W. Fox, Fox, Pritchard, and A. T. McDonald, Fox and McDonald’s introduction to fluid mechanics. Hoboken, NJ: John Wiley & Sons, Inc., 2011.
[73] G. C. Oates, D. T. Pratt, J. D. Mattingly, and American Institute of Aeronautics and Astronautics, “Aerothermodynamics of gas turbine and rocket propulsion software to accompany the AIAA textbook by Gordon C. Oates.” American Institute of Aeronautics and Astronautics, 1997.
[74] B. Jodoin, “Cold spray nozzle mach number limitation,” J. Therm. Spray Technol., vol. 11, no. 4, pp. 496–507, Dec-2002.
[75] J. Pattison, S. Celotto, A. Khan, and W. O’Neill, “Standoff distance and bow shock phenomena in the Cold Spray process,” Surf. Coat. Technol., vol. 202, no. 8, pp. 1443–1454, Jan-2008.
[76] M. Yu, W.-Y. Li, F. F. Wang, X. K. Suo, and H. L. Liao, “Effect of particle and substrate preheating on particle deformation behavior in cold spraying,” Surf. Coat. Technol., vol. 220, pp. 174–178, Apr-2013.
[77] C.-J. Li, W.-Y. Li, and H. Liao, “Examination of the critical velocity for deposition of particles in cold spraying,” J. Therm. Spray Technol., vol. 15, no. 2, pp. 212–222, Jun-2006.
[78] A. Papyrin, V. Kosarev, S. Klinkov, A. Alkhimov, and V. M. Fomin, Cold Spray Technology, 1 edition. Amsterdam ; London: Elsevier Science, 2006.
[79] A. P. Alkhimov, V. F. Kosarev, and A. N. Papyrin, “A method of ‘cold’ gas-dynamic deposition,” Sov. Phys. Dokl., vol. 35, p. 1047, Dec-1990.
[80] T. Schmidt, F. Gärtner, H. Assadi, and H. Kreye, “Development of a generalized parameter window for cold spray deposition,” Acta Mater., vol. 54, no. 3, pp. 729–742, Feb-2006.
149
[81] A. Sova, S. Klinkov, V. Kosarev, N. Ryashin, and I. Smurov, “Preliminary study on deposition of aluminium and copper powders by cold spray micronozzle using helium,” Surf. Coat. Technol., vol. 220, pp. 98–101, Apr-2013.
[82] C. J. Li, W. Y. Li, Y. Y. Wang, and H. Fukanuma, “Effect of spray angle on deposition characteristics in cold spraying,” vol. Thermal Spray 2003: Advancing the Science and Applying the Technology, pp. 5–8, 2003.
[83] J. R. Davis, Properties and selection: nonferrous alloys and special-purpose materials. ASM International, 1990.
[84] E. Sansoucy, “Development of Aluminum-Based Coatings Produced by Cold Gas Dynamic Spraying,” PhD, Ottawa, 2008.
[85] M. F. S. R. C. Dykhuizen, “Impact of high velocity cold spray particles,” vol. 8, no. 4, pp. 559–564, 1999.
[86] R. Huang and H. Fukanuma, “Study of the Influence of Particle Velocity on Adhesive Strength of Cold Spray Deposits,” J. Therm. Spray Technol., vol. 21, no. 3–4, pp. 541–549, Jun-2012.
[87] P. C. King, S. H. Zahiri, and M. Jahedi, “Microstructural refinement within a cold sprayed copper particle,” Metall. Mater. Trans. A, vol. 40, no. 9, pp. 2115–2123, 2009.
[88]H.-J. Kim, C.-H. Lee, and S.-Y. Hwang, “Fabrication of WC–Co coatings by cold spray deposition,” Surf. Coat. Technol., vol. 191, no. 2–3, pp. 335–340, Feb-2005.
[89] A. Moridi, S. M. H. Gangaraj, S. Vezzu, and M. Guagliano, “Number of Passes and Thickness Effect on Mechanical Characteristics of Cold Spray Coating,” Procedia Eng., vol. 74, pp. 449–459, 2014.
[90] M. Mellali, P. Fauchais, and A. Grimaud, “Influence of substrate roughness and temperature on the adhesion/cohesion of alumina coatings,” Surf. Coat. Technol., vol. 81, no. 2–3, pp. 275–286, Jun-1996.
[91] W. A. González-Hermosilla, D. Chicot, J. Lesage, J. G. La Barbera-Sosa, I. C. Gruescu, M. H. Staia, and E. S. Puchi-Cabrera, “Effect of substrate roughness on the fatigue behavior of a SAE 1045 steel coated with a WC–10Co–4Cr cermet, deposited by HVOF thermal spray,” Mater. Sci. Eng. A, vol. 527, no. 24–25, pp. 6551–6561, Sep-2010.
[92] W. Wong, E. Irissou, A. N. Ryabinin, J.-G. Legoux, and S. Yue, “Influence of Helium and Nitrogen Gases on the Properties of Cold Gas Dynamic Sprayed Pure Titanium Coatings,” J. Therm. Spray Technol., vol. 20, no. 1–2, pp. 213–226, Jan-2011.
[93] T. Hussain, D. G. McCartney, P. H. Shipway, and D. Zhang, “Bonding Mechanisms in Cold Spraying: The Contributions of Metallurgical and Mechanical Components,” J. Therm. Spray Technol., vol. 18, no. 3, pp. 364–379, Sep-2009.
[94] M. H. Staia, E. Ramos, A. Carrasquero, A. Roman, J. Lesage, D. Chicot, and G. Mesmacque, “Effect of substrate roughness induced by grit blasting upon adhesion of WC-17% Co thermal sprayed coatings,” Thin Solid Films, vol. 377–378, pp. 657–664, Dec-2000.
[95] S. Barradas, R. Molins, M. Jeandin, M. Arrigoni, M. Boustie, C. Bolis, L. Berthe, and M. Ducos, “Application of laser shock adhesion testing to the study of the interlamellar strength and coating–substrate adhesion in cold-sprayed copper coating of aluminum,” Surf. Coat. Technol., vol. 197, no. 1, pp. 18–27, Jul-2005.
[96] A. Lamraoui, S. Costil, and C. Langlade, “Influence of Surface Pre-Treatment on Aluminum Alloy Mechanical Behavior,” ASM Int., vol. Thermal Spray 2013: Proceedings of the International Thermal Spray Conference, pp. 499 – 505, May-2013.
[97] J. Cedelle, M. Vardelle, and P. Fauchais, “Influence of stainless steel substrate preheating on surface topography and on millimeter- and micrometer-sized splat formation,” Surf. Coat. Technol., vol. 201, no. 3–4, pp. 1373–1382, Oct-2006.
150
[98] W.-Y. Li, C. Zhang, H.-T. Wang, X. P. Guo, H. L. Liao, C.-J. Li, and C. Coddet, “Significant influences of metal reactivity and oxide films at particle surfaces on coating microstructure in cold spraying,” Appl. Surf. Sci., vol. 253, no. 7, pp. 3557–3562, Jan-2007.
[99] A. N. Papyrin, V. F. Kosarev, S. V. Klinkov, and A. P. Alkhimov, “On the interaction of high speed particles with a substrate under the cold spraying,” vol. Thermal Spray 2002: International Thermal Spray Conference (DVS-ASM), pp. 380 – 384, 2002.
[100] Z. Arabgol, H. Assadi, T. Schmidt, F. Gärtner, and T. Klassen, “Analysis of Thermal History and Residual Stress in Cold-Sprayed Coatings,” J. Therm. Spray Technol., vol. 23, no. 1–2, pp. 84–90, Jan-2014.
[101]M. Fukumoto, H. Wada, K. Tanabe, M. Yamada, E. Yamaguchi, A. Niwa, M. Sugimoto, and M. Izawa, “Effect of Substrate Temperature on Deposition Behavior of Copper Particles on Substrate Surfaces in the Cold Spray Process,” J. Therm. Spray Technol., vol. 16, no. 5–6, pp. 643–650, Dec-2007.
[102] V. Champagne, D. Helfritch, P. Leyman, R. Lempicki, and S. Grendahl, “The effects of gas and metal characteristics on sprayed metal coatings,” Model. Simul. Mater. Sci. Eng., vol. 13, no. 7, pp. 1119–1128, Oct-2005.
[103] X.-J. Ning, J.-H. Jang, and H.-J. Kim, “The effects of powder properties on in-flight particle velocity and deposition process during low pressure cold spray process,” Appl. Surf. Sci., vol. 253, no. 18, pp. 7449–7455, Jul-2007.
[104] D. L. Gilmore, R. C. Dykhuizen, R. A. Neiser, M. F. Smith, and T. J. Roemer, “Particle velocity and deposition efficiency in the cold spray process,” J. Therm. Spray Technol., vol. 8, no. 4, pp. 576–582, Dec-1999.
[105] B. Jodoin, L. Ajdelsztajn, E. Sansoucy, A. Zúñiga, P. Richer, and E. J. Lavernia, “Effect of particle size, morphology, and hardness on cold gas dynamic sprayed aluminum alloy coatings,” Surf. Coat. Technol., vol. 201, no. 6, pp. 3422–3429, 2006.
[106] A. N. Ryabinin, E. Irissou, A. McDonald, and J.-G. Legoux, “Simulation of gas-substrate heat exchange during cold-gas dynamic spraying,” Int. J. Therm. Sci., vol. 56, pp. 12–18, Jun-2012.
[107] K. Taylor, B. Jodoin, and J. Karov, “Particle Loading Effect in Cold Spray,” J. Therm. Spray Technol., vol. 15, no. 2, pp. 273–279, Jun-2006.
[108] “CenterLine Supersonic Spray Technology (SST)-Practical Cold Spray Solutions - Powders.”, http://www.supersonicspray.com/en/products_full?pg=SE45000&rp=14. [Accessed: Apr-2014].
[109] “55 lb Aluminum Oxide Blasting Abrasive | Princess Auto.”, http://www.princessauto.com/pal/en/Abrasive-Accessories/55-lb-Aluminum-Oxide-Blasting-Abrasive/8200578.p. [Accessed: Apr-2014].
[110] “Ebonygrit - Copper Slag Blasting Abrasive | Princess Auto.”, http://www.princessauto.com/pal/en/Abrasive-Accessories/Ebonygrit---Copper-Slag-Blasting-Abrasive/8200594.p. [Accessed: Apr-2014].
[111] P. Trahan, “Corrosion Protection of Friction Stir Welded Al 7075 Panel for use in Aerospace Applications using Cold Gas Dynamic Spray,” Master’s Thesis, Ottawa, 2013.
[112] E. P. DeGarmo, J. T. Black, and R. A. Kohser, Materials and Processes in Manufacturing, 9th Edition Update edition. Hoboken, N.J: Wiley, 2003.
[113] W. D. C. Jr and D. G. Rethwisch, Materials Science and Engineering: An Introduction, 8th edition. Hoboken, NJ: John Wiley and Sons, 2009.
[114] E28 Committee, “Test Method for Vickers Hardness of Metallic Materials,” ASTM International, 2004.
[115] “Modulus of Elasticity - Young Modulus for some common Materials.”, http://www.engineeringtoolbox.com/young-modulus-d_417.html. [Accessed: Oct-2014].
[116] “Why Does Copper Turn Green.”, http://www.corrosionist.com/why_does_copper_turn_green.htm. [Accessed: 04-Dec-2014].

151
[117] “Hardness.”, http://www.tf.uni-kiel.de/matwis/amat/mw1_ge/kap_8/advanced/t8_4_2.html. [Accessed: Apr-2014].
[118] “Invar M93,” http://www.aperam.com/alloysandspecialities/fileadmin/pdf/Aperam/Brochure/gastransportation.pdf [Accessed: Apr-2014].
[119] Rosa Jorge Luiz, Robin Alain, Silva M. B. and Baldan Carlos Alberto "Electrodeposition of copper on titanium wires: Taguchi experimental design approach". Journal of Materials Processing Technology 209: 1181–1188.
Recommended