Landmark / DecisionSpace Interpretation Software
Jack Holt Charles Brothers
University of Texas at Austin
SHARAD/MARSIS Data Users’ Workshop March 16, 2014

Seisware/Landmark
• Both programs are oil field focused, support is offered for “atypical” projects, but often special approaches are required
• Both use seg-y data
• Both have 3-D and 2-D interpretation environments
• Both often offer huge academic license discounts

Key differences: SeisWare vs. Landmark
• SeisWare strengths: – A mars ellipsoid!
– Single package
– Free 30 day trial
– Developed on windows for windows
• Landmark strengths: – Cutting edge, new features often added
– Windows and Linux supported
– DecisonSpace Desktop is a standalone package
– ArcGIS data support (you can import arc rasters etc.)
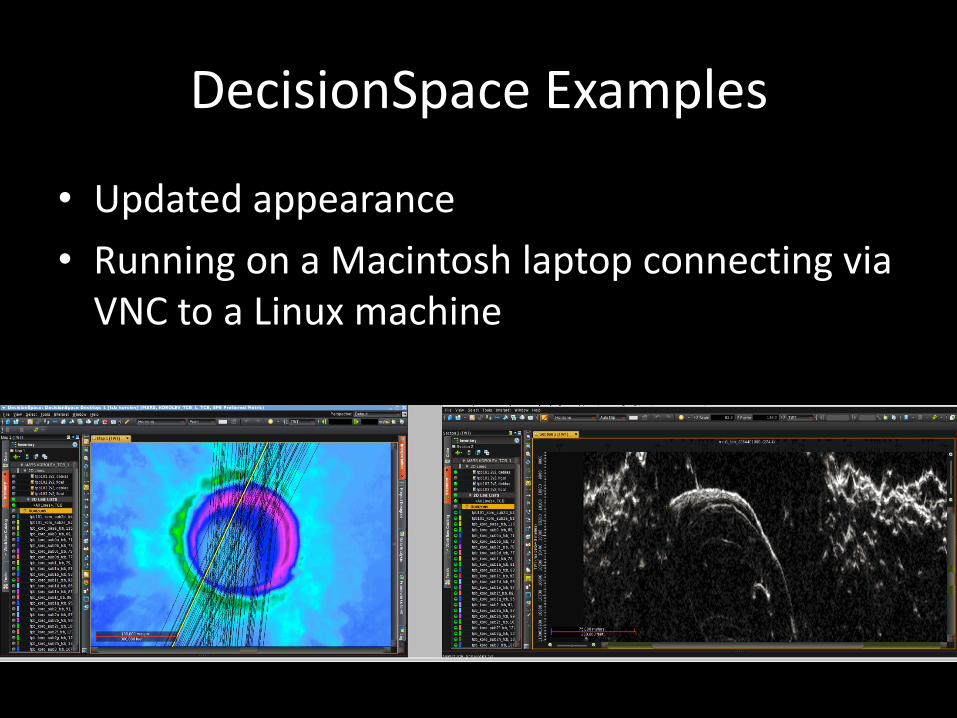
DecisionSpace Examples
• Updated appearance
• Running on a Macintosh laptop connecting via VNC to a Linux machine

Reflector picking parameters customizable
• Point, Auto-Track and Auto-Dip available for tracking radar reflectors – At UT we use auto-dip as it gives the
best results in our testing – Auto-Track and Auto-Dip give
reproducible results between sessions and interpreters
• Smoothing parameter extremely useful, as radar is noisy, a low value smooth aids interpretation

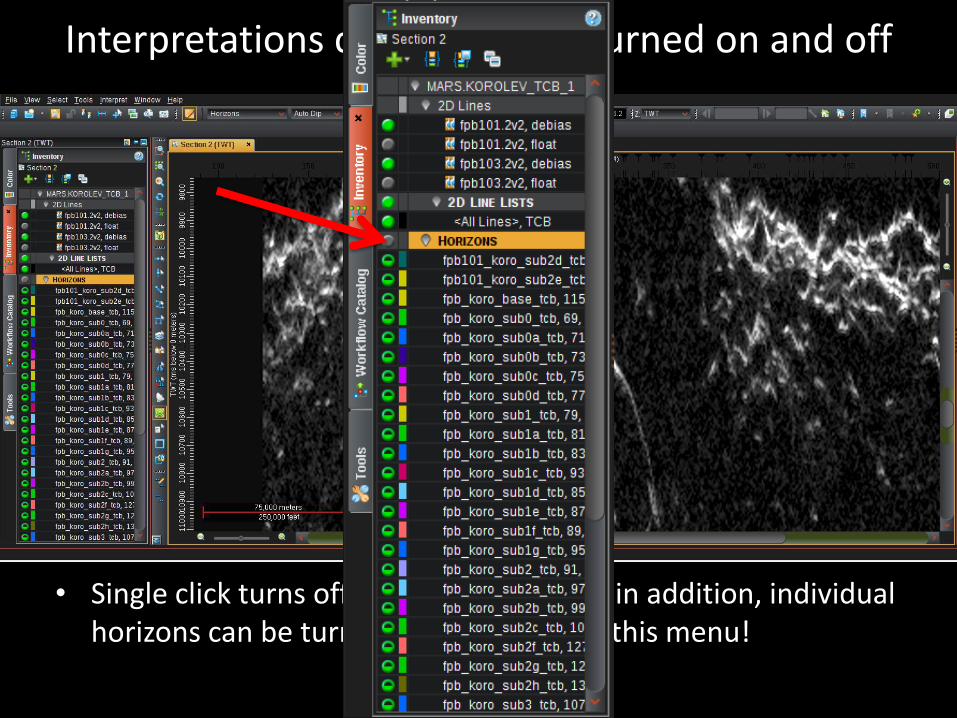
Interpretations can quickly be turned on and off

Interpretations can quickly be turned on and off
• Single click turns off and on all horizons, in addition, individual horizons can be turned off and on using this menu!
Interpretations can quickly be turned on and off
• Single click turns off and on all horizons, in addition, individual horizons can be turned off and on using this menu!

All windows can be combined as tabs
• You can open in “new window” or “new tab”
• When closing a window you can “dock” it as a tab in a different window!


Mis-tie correction for 2-D data
• SHARAD data doesn’t always “line-up”
• Mis-tie algorithm uses an interpreted surface to vertically shift radargrams

Mis-tie options, plentiful!

Post-mistie correction
• The surfaces line up!

Line ties, interpretation across radargrams
• Multiple orbits combined, can be interpreted across
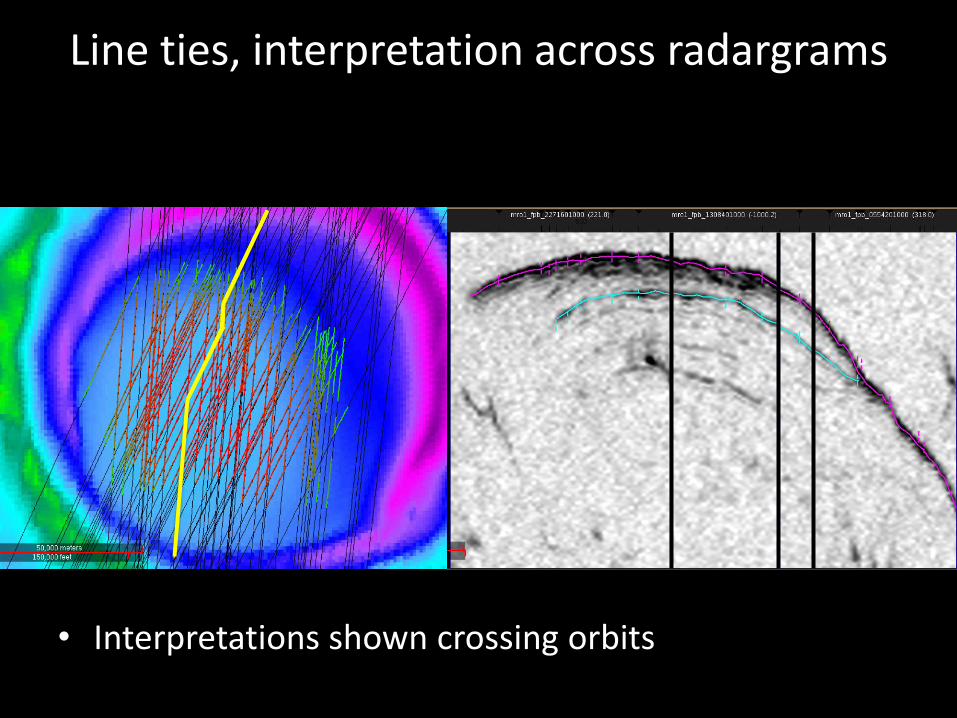
Line ties, interpretation across radargrams
• Interpretations shown crossing orbits

Post interpretation data options
• Data interpolation can be done in DecisionSpace, similar to SeisWare
• Data can be easily exported for use in other programs
– We export data in ascii format, process into MOLA aeroid, and then interpolate/interpret in ESRI’s ArcGIS

Procedure for data export
• Time units depend on how data were loaded, at UT our time units are not ms but 10 µs
• Data is exported with trace and time
• Surface return can be referenced to MOLA allowing conversion to an XYZ domain
• Pixlatlon file contains latitude and longitude for traces

Data export, products produced
• Once data correctly referenced to MOLA it can be input to GIS software for manipulation and viewing

Reference
Brothers, T.C., and J.W. Holt, Korolev Crater, Mars: Growth of a 2-km Thick Ice-Rich Dome Independent of, but Possibly Linked to, the North Polar Layered Deposits, 44th Lunar and Planetary Science Conference, Abstract #3022, 2013
Recommended


![Announces Q4 & FY16 Results (Standalone), Form A (Standalone) & Auditors Report (Standalone) for the period ended March 31, 2016 [Result]](https://img.pdfslide.us/doc/110x75/577c7af51a28abe05496b138/announces-q4-fy16-results-standalone-form-a-standalone-auditors-report.jpg)