1
Laccase biosensors based on different enzyme immobilization
strategies for phenolic compounds determination
E. Caseroa, M.D. Petit-Domínguez
a, L. Vázquez
b, I. Ramírez-Asperilla
a, A.M. Parra-
Alfambraa, F. Pariente
a, E. Lorenzo
a*
aDepartamento de Química Analítica y Análisis Instrumental. Facultad de Ciencias. c/
Francisco Tomás y Valiente, Nº7. bInstituto de Ciencia de Materiales de Madrid (CSIC). c/ Sor Juana Inés de la Cruz Nº3.
Campus de Excelencia de la Universidad Autónoma de Madrid. 28049 Madrid. Spain.
e-mail: [email protected]
Abstract
Different enzyme immobilization approaches of Trametes versicolor laccase (TvL)
onto gold surfaces and their influence on the performance of the final bioanalytical
platforms are described. The laccase immobilization methods include: i) direct
adsorption onto gold electrodes (TvL/Au), ii) covalent attachment to a gold surface
modified with a bifunctional reagent, 3,3'-Dithiodipropionic acid di (N-succinimidyl
ester) (DTSP), and iii) integration of the enzyme into a sol-gel 3D polymeric network
derived from (3-mercaptopropyl)-trimethoxysilane (MPTS) previously formed onto a
gold surface (TvL/MPTS/Au). The characterization and applicability of these
biosensors are described. Characterization is performed in aqueous acetate buffer
solutions using atomic force microscopy (AFM), providing valuable information
concerning morphological data at the nanoscale level.
The response of the three biosensing platforms developed, TvL/Au, TvL/DTSP/Au
and TvL/MPTS/Au, is evaluated in the presence of hydroquinone (HQ), used as a
phenolic enzymatic substrate. All systems exhibit a clear electrocatalytic activity and
HQ can be amperometrically determined at -0.10 V versus Ag/AgCl. However, the
performance of biosensors -evaluated in terms of sensitivity, detection limit, linear

2
response range, reproducibility and stability- depends clearly on the enzyme
immobilization strategy, which allows establishing its influence on the enzyme catalytic
activity.
Keywords: amperometric biosensors, enzyme immobilization, Trametes versicolor
laccase, phenolic compounds, atomic force microscopy.
3
1. Introduction
Development of amperometric biosensors based on enzyme immobilization onto
electrode surfaces in such way that they retain their fully activity and stability has
become one of the most important issues in several fields ranging from environmental
analysis to clinical diagnosis.
In this sense, nowadays, in nutritional literature, a high effort is devoted to study
several aspects of free radicals, a type of unstable compounds produced during
metabolic processes. An excess of free radicals in the human body, which can be caused
by pollution, sunlight or smoke of cigarettes overexposure, promotes oxidative damage
in cells, accelerating the aging process. Among the different compounds with
antioxidant properties, polyphenols play a protective role against human diseases
associated with oxidative stress. They are commonly present in fruits, legumes,
vegetables and several beverages. Accordingly, during the last years, numerous studies
aimed at evaluating the antioxidant capacity of natural products, such as wines, teas and
herbal infusions, have been reported. In particular, special attention has been paid to the
development of new methodologies, such as amperometric biosensors based on
tyrosinase, peroxidase or laccase enzymes, which can be employed as alternative
methods for total polyphenolic content determination in foods [1-10].
Laccases, which have been employed in a less extent than tyrosinases for phenols
quantification, are a type of copper-containing oxidoreductases produced by numerous
plants, fungi, and bacteria. In particular, Trametes versicolor laccase, TvL, (dimensions
of 7.0 nm × 5.0 nm × 5.6 nm) [11] is a fungal laccase containing four copper ions
located in sites denoted as T1, T2 and T3 in the active center of the enzyme [12-14].
Among laccases from different sources, there are remarkable differences such as
molecular weight, substrate specificity and optimum pH, but they have in common the
4
capability to oxidize benzenediols/phenols to the corresponding phenones with the
concomitant reduction of oxygen. Thus, the detection of polyphenolic compounds can
be based on measuring the reduction current of quinones generated as products of the
enzymatic reaction.
The performance of enzyme-based amperometric biosensors depends on several
factors, mainly on the catalytic activity preservation after the enzyme immobilization
onto solid electrodes. Since the immobilization process can produce an alteration of the
three-dimensional conformation of the enzyme that leads to a diminution of the catalytic
activity, an adequate choice of the immobilization strategy plays a crucial role in the
biosensor design and performance. In the particular case of laccase-based biosensors, an
extensive research effort has been addressed to immobilize laccase on surfaces by
different immobilization strategies in order to design biosensors with a wide range of
applications [15, 16]. In this sense, laccase immobilization has been performed in the
literature on different solid supports (glassy carbon, carbon paste, platinum, gold) using
immobilization strategies such as direct adsorption, covalent binding, entrapment in
polymeric membranes or gels and cross-linking procedures. Recent advances in this
field are related to the development of new support matrix as suitable platforms (most
of them including nanomaterials) for enzymes immobilization, which lead to biosensors
with improved analytical properties. So, in recent works, laccase has been immobilized
by direct adsorption, covalent binding or entrapment onto: epoxy resin membranes [9],
mesoporous materials with well-controlled pore structures [10, 17], multi-walled carbon
nanotubes paste electrodes [18], nanocomposites formed by chitosan and carbon
nanotubes [19], copper-containing ordered mesoporous carbon chitosan matrix [8],
pyrenehexanoic acid-modified hierarchical carbon microfibers/carbon nanotubes
composite electrodes [16], polyvinyl alcohol photopolymers [20], sol-gel matrix of
5
diglycerylsilane [21], 3-mercaptopropionic acid self-assembled monolayer modified
gold electrodes [22], cysteine self-assembled monolayer and quantum dots modified
gold electrodes [23], nanocomposites of silver nanoparticles and zinc oxide
nanoparticles electrochemically deposited onto gold electrodes [24], platinum
nanoparticles and reduced graphene composites deposited onto screen printed electrodes
[25], polyethyleneimine coated gold-nanoparticles modified glassy carbon electrodes
[26], multiwalled carbon nanotubes and polypyrrole electrocodeposited onto platinum
electrodes [27].
In this paper, we describe the development and characterization of three different
laccase, from Trametes versicolor (TvL), based biosensors for polyphenols
determination. Among the different available strategies to achieve the enzyme
immobilization onto gold surfaces, we have focused our attention on: i) direct
adsorption of TvL onto a gold substrate, ii) covalent bonding to a self-assembled
monolayer (SAM) and iii) encapsulation into a sol-gel matrix. The morphological
characteristics at the nanometer level of the developed biosensors were obtained by
atomic force microscopy (AFM) technique. The influence of the enzyme
immobilization strategy on the analytical performance of the resulting biosensors was
evaluated using hydroquinone as a model phenolic substrate.
2. Experimental Section
2.1. Reagents and solutions
Laccase (EC 1.1.3.4) from Trametes versicolor (TvL), lyophilized powder
containing 27.9 U/mg solid, was obtained from the Sigma Chemical Co. (St. Louis,
MO). Stock enzyme solution was prepared dissolving 35.7 mg of the TvL lyophilized
powder in 250 µL of 0.1 M acetic/acetate buffer solution pH 4.5, aliquoted (10 µL) and
6
stored at -30ºC. Under these conditions, the enzymatic activity remains stable for
several weeks. Hydroquinone (HQ), 3,3'-Dithiodipropionic acid di (N-succinimidyl
ester) (DTSP), dimethyl-sulfoxide (DMSO) and (3-mercaptopropyl)-trimethoxysilane
(MPTS) were also purchased from Sigma Chemical Co. and used as received. Stock
solutions of HQ (1 mM) were freshly prepared. Other chemicals used in this work, such
as methanol, hydrochloric acid and sodium acetate were used as received without
additional purification steps. Sodium acetate was employed for the preparation of
acetic/acetate buffer solutions (0.1 M, pH 4.5) Water was purified with a Millipore
Milli-Q-System. All solutions were prepared just prior to use.
2.2. Experimental techniques
2.2.1. Atomic force microscopy measurements
Supports employed for laccase immobilization in AFM measurements consist of
glass substrates (1.1 x 1.1 cm2) covered with a chromium layer (1-4 nm thick) on which
a gold layer (200-300 nm thick) was deposited (Metallhandel Schröer GmbH, Lienen,
Germany). The AFM measurements were performed with a Nanoscope IIIa equipment
(Bruker) operating in intermittent contact and under buffer conditions. Sharp silicon
nitride levers (Bruker) with a nominal force constant close to 0.32 N/m were employed.
These cantilevers have a silicon tip with a nominal tip radius of about 2 nm. Imaging
soft matter under liquid environment with this sharp tip requires an extreme care to keep
low the applied tip load since if this is not the case the soft sample feature could be
pierced or deformed by the tip. Accordingly, extreme low free amplitudes (around 0.2-
0.3 V) were employed. The images were obtained in 3-6 minutes and were composed
by 512 x 512 pixels. The thickness of the MPTS layer was estimated in air conditions
with silicon cantilevers through force curve analysis.
2.2.2. Electrochemical measurements
7
Cyclic voltammetric and amperometric studies were carried out with an Ecochemie
Autolab PGSTAT12 system (Utrecht, The Netherlands). The electrochemical
experiments were carried out in a three-compartment electrochemical cell with standard
taper joints so that all compartments could be hermetically sealed with Teflon adapters.
A gold electrode was used as working electrode. A large-area coiled platinum wire was
employed as a counter electrode. All potentials were reported against a Ag/AgCl
reference electrode without taking into account the liquid junction.
2.3. Procedures
2.3.1. Preparation of the electrochemical biosensing platforms
Prior to each experiment, gold electrodes were polished with 1 µm diamond paste
(Buehler) and rinsed with water.
The TvL/Au electrochemical biosensing platform was developed by placing 5 µL
of the stock enzyme solution onto the electrode surface. After air-drying, the modified
electrodes were washed with water to remove any weakly bound material.
The TvL/DTSP/Au was developed by immersing a gold substrate for 3h at room
temperature in a solution of DTSP (1.0 mM in DMSO). The corresponding monolayer
containing the active succinimidyl esters was rinsed in DMSO and water. Subsequently,
5 µl of TvL stock solution was placed onto the modified surface (DTSP/Au) leading to a
covalent binding between the enzyme and the succinimidyl esters. After air-drying, the
biosensor was washed with water to remove any weakly bound enzyme.
Finally, the development of the TvL/MPTS/Au biosensing platform requires the
previous formation of a sol gel network. In a first step, the sol-gel solution was prepared
mixing 200 µL of MPTS with 600 µL of water, 600 µL of methanol and 200 µL of 0.1
M HCl. This solution was sonicated using an Ultrasons bath (P-Selecta) for 30 min at
room temperature. Subsequently, the solution was stored for three hours at room
8
temperature. Afterwards, the gold surface was immersed in the MPTS sol-gel solution,
prepared as described above, for 1 hour. MPTS sol chemisorbs on the polycrystalline
Au electrode forming a 3D silicate network. The resulting MPTS sol-modified electrode
was thoroughly rinsed with water to remove the physically adsorbed MPTS sol and
finally 5 µL of the TvL stock solution were dropped on this surface. After air-drying,
the biosensor was washed with water to remove any weakly bound enzyme.
The three different enzyme immobilization approaches employed for biosensors
preparation are summarized in scheme 1A.
2.3.2. AFM measurements
Gold supports employed for AFM measurements were previously annealed for 2
min in a gas flame in order to obtain Au (111) terraces and imaged in buffer solution to
assess that the surface was flat and clean prior to enzyme immobilization. The images,
before and after TvL immobilization, were taken with different cantilevers in order to
ensure that the imaged structures were not due to tip artefacts.
3. Results and discussion
3.1. Immobilization of TvL onto gold surfaces by different approaches:
characterization by AFM.
A critical step in developing biosensors is the enzyme immobilization onto the
transducer. Physical adsorption is a rapid and easy way to immobilize enzymes on gold,
which is a rather interesting material for bioelectronic devices. However, it may result
in low stability of the enzyme on the electrode; thus a stronger linkage is sometimes
required for biosensor applications. One of the approaches employed successfully to
achieve strong immobilization of enzymes on gold surfaces consists of chemical
modification of the electrode surface for favoring specific interactions with the enzyme
molecules. Entrapping enzymes into polymeric structures or hydrogels allows a higher
9
concentration of enzyme on the electroactive surface, but the background current is
increased. In this work, we have developed and compared three different strategies,
based on the principles mentioned above, to immobilize Trametes versicolor laccase: i)
direct adsorption onto a gold electrode (TvL/Au), ii) covalent attachment on a
previously functionalized gold surface with an adequate self-assembled monolayer
(SAM) (TvL/DTSP/Au) and iii) encapsulation of TvL onto a sol-gel matrix
(TvL/MPTS/Au). In the former case (TvL/Au), the interaction responsible of the
enzyme immobilization is unspecific adsorption. In contrast, in the second approach we
have used a well-established strategy to bind covalently proteins. This approach is based
on the covalent attachment of proteins containing lysine residues, through acylation of
free primary or secondary aliphatic groups, to gold surfaces modified with a
bifunctional reagent containing succinimide functionalities, in particular, 3,3’
Dithiodipropionic acid di (N-succinimidyl ester) (DTSP). Since DTSP adsorbs onto
gold surfaces through the disulfide group, the terminal succinimidyl groups are exposed
to the solution allowing further covalent immobilization of amine-containing
biomolecules, such as laccase from Trametes versicolor (TvL/DTSP/Au). Finally, the
third approach is based on TvL encapsulation on a sol-gel 3D polymeric network
derived from (3-mercaptopropyl)-trimethoxysilane (MPTS) previously formed onto a
gold surface. MPTS presents the advantage of forming a 3D polymeric network
containing a large number of thiol tail groups distributed throughout its structure that
enable its anchoring onto gold surfaces. Moreover, this matrix provides a biocompatible
environment that preserves the catalytic activity of TvL after its immobilization and
allows the incorporation of a high amount of enzyme, which is expected to improve the
sensitivity of the final biosensing device. Since the performance of the developed
biosensors is closely related to several factors including the conformation, distribution
10
and morphology of the immobilized enzyme onto the surface, performing an AFM
characterization of each system becomes essential.
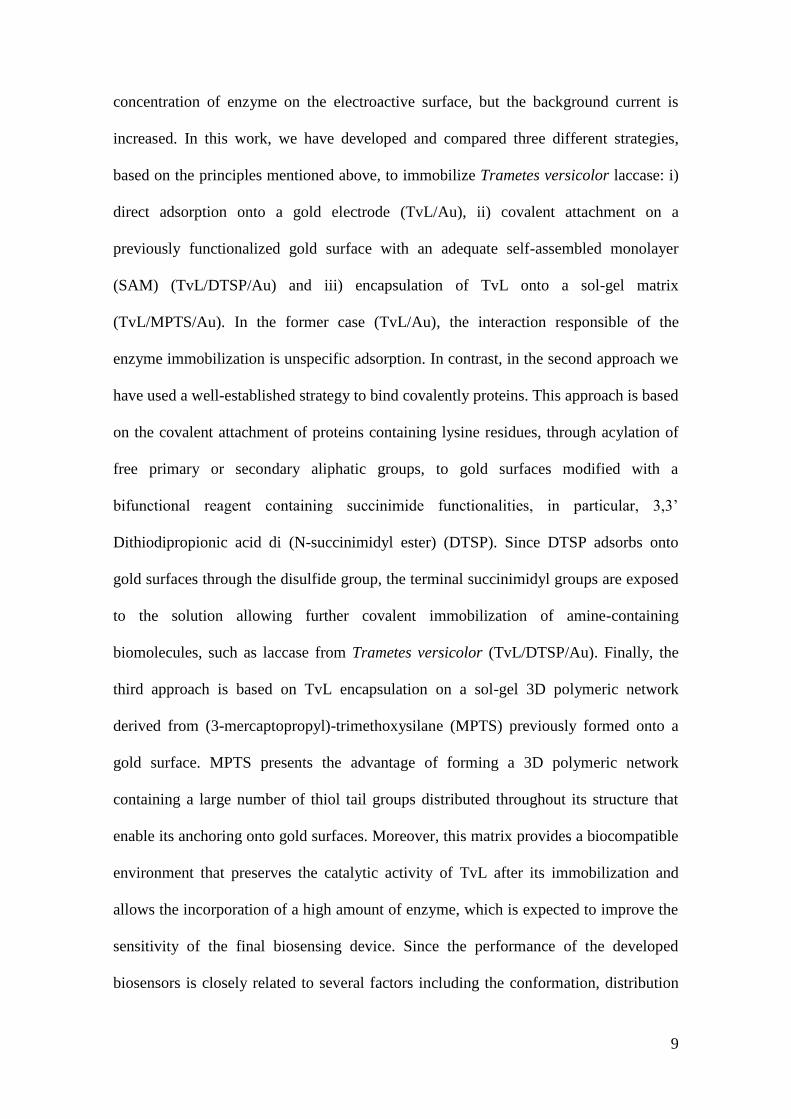
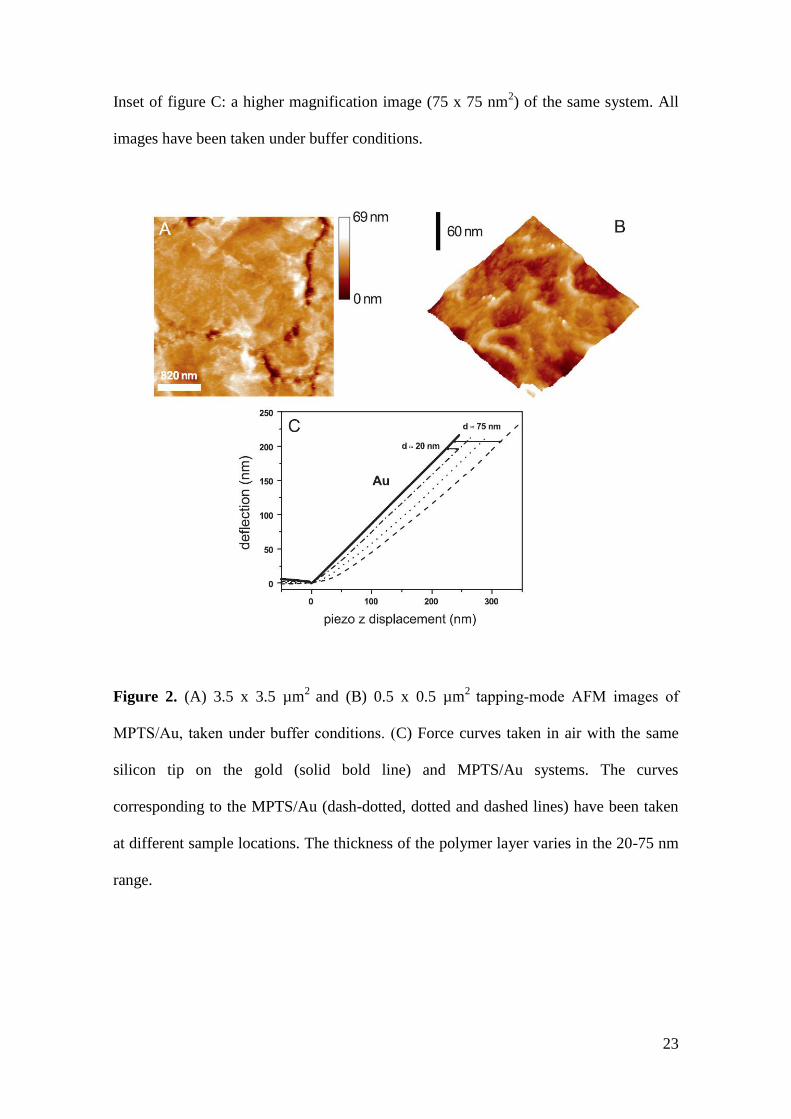
Figure 1A shows a 3.5 x 3.5 µm2 image of the gold surface after deposition of
laccase by direct adsorption. Clearly, the characteristic micro-granular structure of the
underlying gold surface is observed. The bright spots observed in the image correspond
to laccase aggregates that usually tend to be formed along the steps and the micro-grain
boundaries of the gold surface. Characteristic 0.5 x 0.5 µm2 images obtained on the
surface of a flat micro-grain (figure 1B) reveal that the whole surface is covered by a
compact layer of globular structures with characteristic lateral sizes in the 5-8 nm range.
In a higher resolution image (75 x 75 nm2) of this layer (inset of figure 1A) the globular
morphology and size of these structures are better observed. As these structures were
not present in the as-prepared gold surface (data not shown), and their lateral
dimensions are consistent with those of the laccase molecule, we can identify them as
those of the laccase deposit. In fact, the brighter (i.e., higher) spots observed in figures
1A and 1B correspond either to single proteins adsorbed on top of the laccase
monoloyer (with heights in the 6-7 nm range) or to laccase aggregates displaying larger
height values (above 10 nm).
The AFM analysis of the TvL/DTSP/Au system (figures 1C and 1D) shows a
similar behavior than that observed on the previous system (TvL/Au). Perhaps, the most
noticeable difference lies in the fact that it seems that laccase tends to aggregate mainly
at the micro-grain boundaries as figure 1C shows. Once more, the images taken on flat
micro-grains (figure 1D) display a compact laccase monolayer, where the laccase
structures show lateral sizes in the 5-7 nm range (see inset of figure 1C). Again, some
structures 6-8 nm high, are imaged on top of the laccase monolayer, which correspond
to laccase structures deposited on top of the underlying monolayer.
11
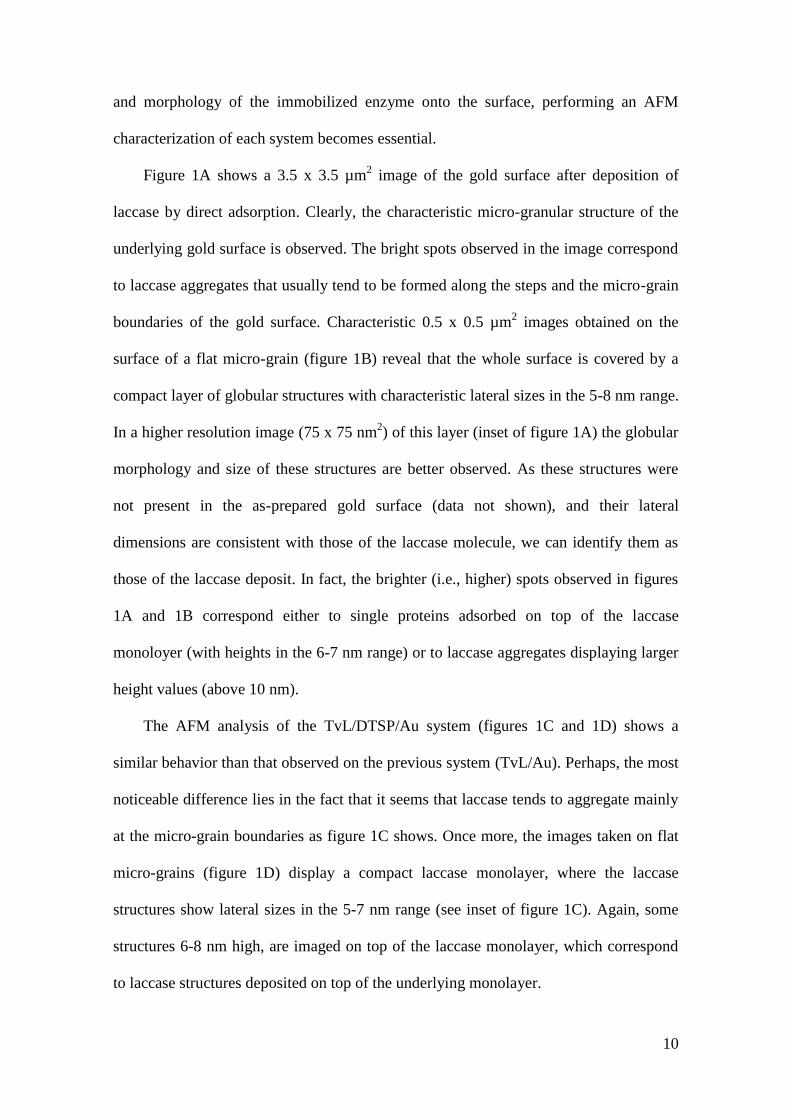
Finally, when laccase is included in a 3D polymeric network, the resulting platform
(TvL/MPTS/Au) presents some morphological differences with respect to the two
previous ones. In order to better interpret the AFM images obtained in this system, it is
convenient to first characterize the MPTS/Au system. Its surface morphology as imaged
by AFM is shown in figures 2A and 2B. The larger image (figure 2A) shows a flatter
surface as the grooves between micro-grains are to some extent blurred or less marked,
probably due to the deposit of the polymer layer at these locations. However, some sort
of surface roughness is evident in both figures 2A and 2B, although it becomes clear
that the MPTS/Au surface morphology at the nano-scale is different from those
obtained in laccase-containing systems (compare figure 2B with figures 1B or 1D).
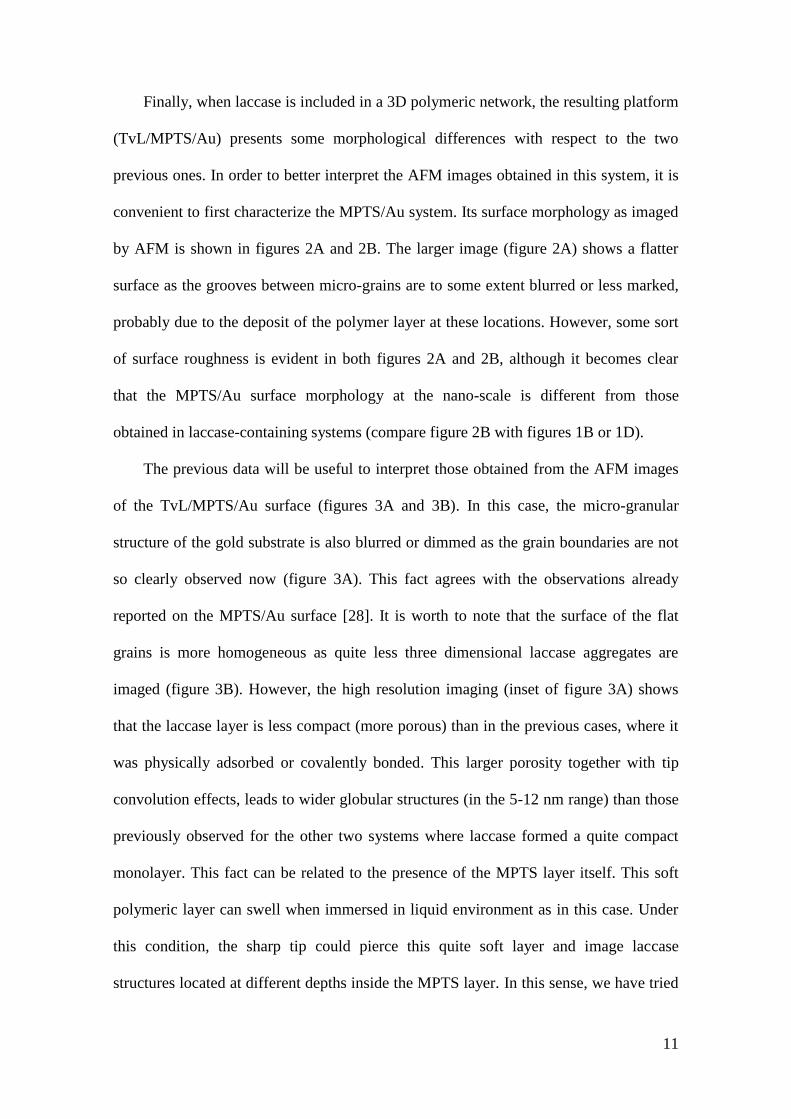
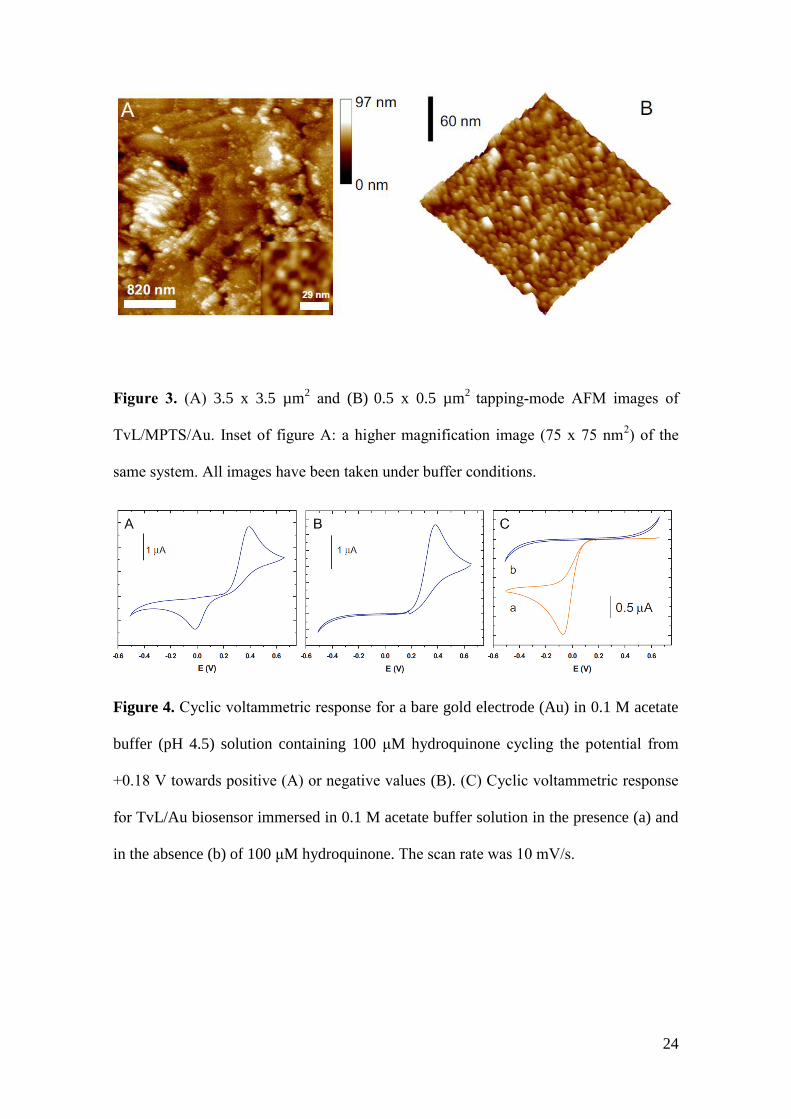
The previous data will be useful to interpret those obtained from the AFM images
of the TvL/MPTS/Au surface (figures 3A and 3B). In this case, the micro-granular
structure of the gold substrate is also blurred or dimmed as the grain boundaries are not
so clearly observed now (figure 3A). This fact agrees with the observations already
reported on the MPTS/Au surface [28]. It is worth to note that the surface of the flat
grains is more homogeneous as quite less three dimensional laccase aggregates are
imaged (figure 3B). However, the high resolution imaging (inset of figure 3A) shows
that the laccase layer is less compact (more porous) than in the previous cases, where it
was physically adsorbed or covalently bonded. This larger porosity together with tip
convolution effects, leads to wider globular structures (in the 5-12 nm range) than those
previously observed for the other two systems where laccase formed a quite compact
monolayer. This fact can be related to the presence of the MPTS layer itself. This soft
polymeric layer can swell when immersed in liquid environment as in this case. Under
this condition, the sharp tip could pierce this quite soft layer and image laccase
structures located at different depths inside the MPTS layer. In this sense, we have tried
12
to estimate the thickness of the MPTS layer. For this purpose, we have taken different
force curves in air with the same tip on the Au surface and the MPTS/Au surface.
In figure 2C are displayed characteristic force curves taken on the gold surface and
at three different spots of the MPTS/Au sample. The steepest slope is observed for the
Au sample because of its stiffer character. For the MPTS/Au sample, there is first a
curved region, which corresponds to the softer MPTS layer, followed by a straight
regime with a slope similar to that measured on Au. This last regime then corresponds
to the point where the soft MPTS layer has been pierced and the underlying Au surface
has been reached. From the lateral shift at this point between the MPTS/Au curve and
that measured on Au, MPTS thickness values ranging from 20 nm up to 75 nm are
obtained. Therefore, as one would expect for a 3D network, the MPTS layer could stack
a large number of laccase structures at different depths, which would be consistent with
the images obtained for the TvL/MPTS/Au system. Based on the above results, it seems
clear that the third strategy allows the immobilization of a great number of laccase
molecules per unit of geometric area than those based on either direct adsorption or
covalent binding to a SAM-modified gold electrode.
3.2. Evaluation of the biosensor response.
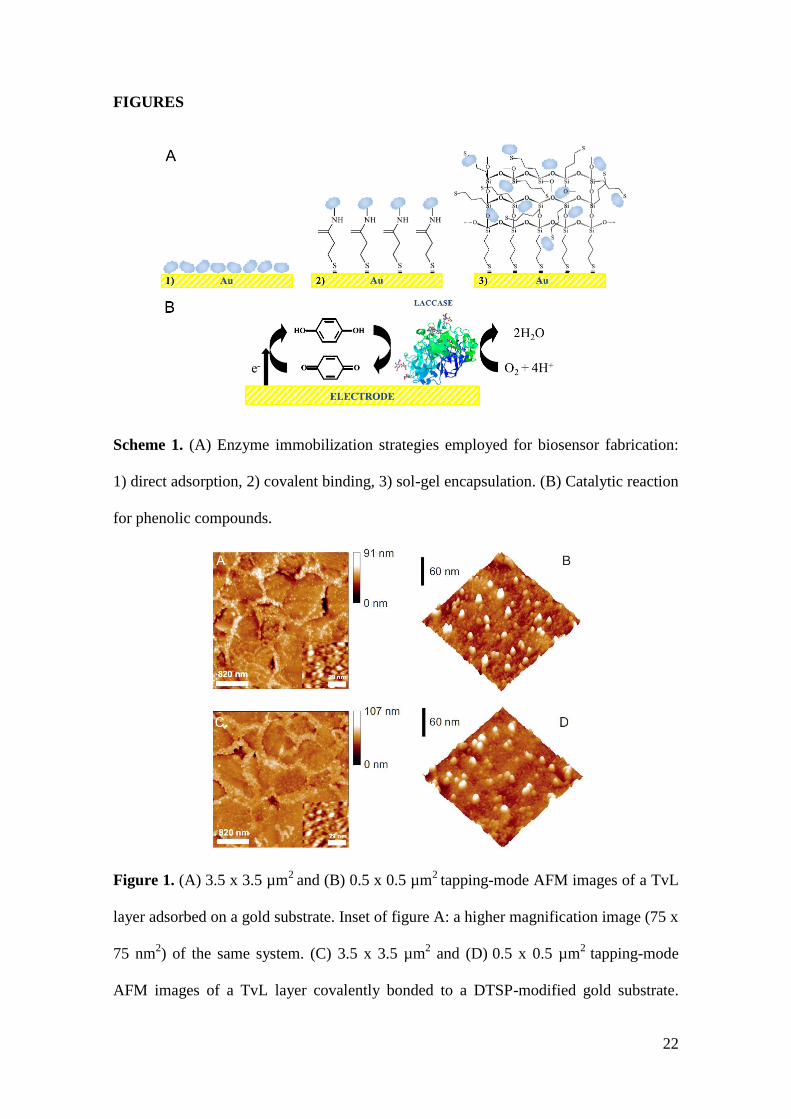
Laccase catalyzes the oxidation of benzenediols with concomitant reduction of O2
to H2O [29]. In the biosensing platforms developed in this work, hydroquinone was
selected as a model phenolic substrate. According to scheme 1B, laccase catalyzes the
oxidation of hydroquinone to quinone through its active center T1 acting the molecular
oxygen as final electron acceptor, which is reduced to water [12]. The quinone
enzymatically generated is reduced to hydroquinone at the electrode surface, giving rise
to an electrocatalytic current. Thus, the concentration of hydroquinone, or other
13
phenolic substrates, can be determined by monitoring this electrocatalytic current.
In order to assess whether the developed laccase based biosensors present catalytic
activity towards phenolic compounds and to evaluate the influence of the enzyme
immobilization strategy on the analytical performance of the resulting devices, its cyclic
voltammetric response in the absence and in the presence of hydroquinone was
obtained.
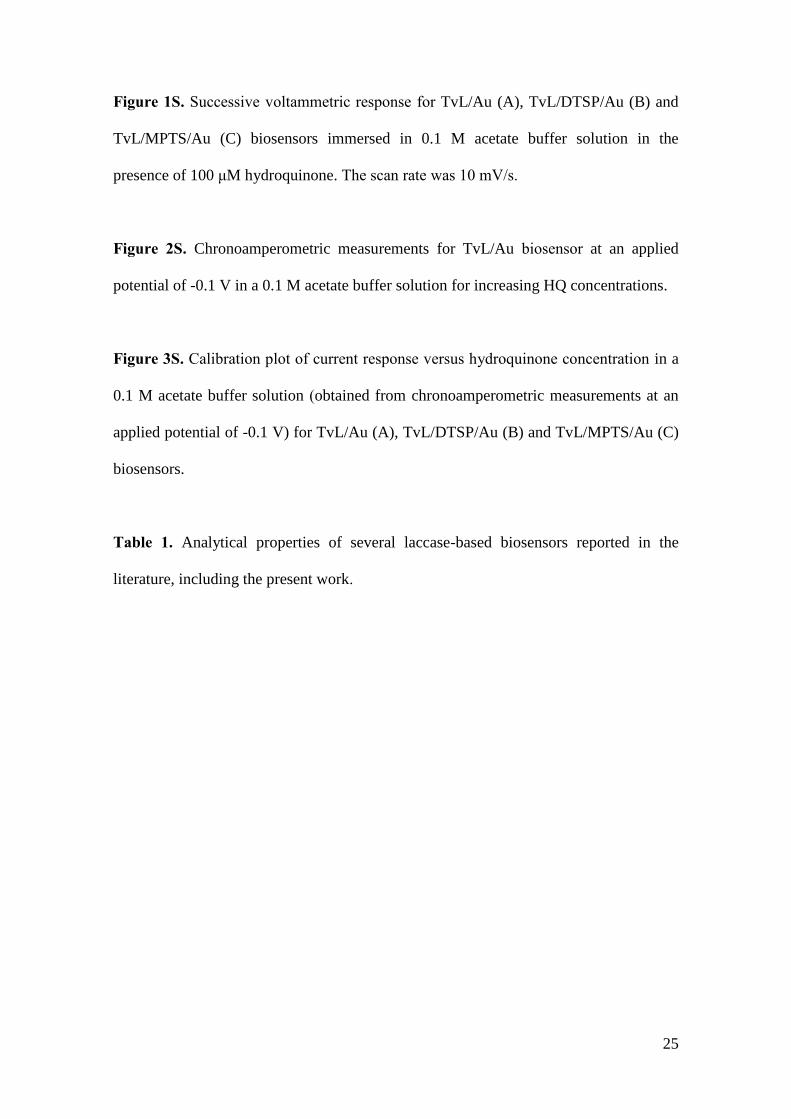
Hydroquinone presents electrochemical response at gold electrode, thus the first
step was to study its response under the same experimental condition than those
employed for the biosensor. Figure 4A displays the cyclic voltammogram of a bare Au
electrode in the presence of hydroquinone in 0.1 M acetate buffer (pH 4.5) solution. As
can be observed, when the potential was cycled from +0.18 V (where no faradaic
current is observed) towards positive values and then reversed until -0.5 V, a pair of
redox peaks with a formal potential of +0.20 V, ascribed to the hydroquinone/quinone
redox couple, is observed. The peak potential separation (∆Ep = 400 mV) is larger than
the typical value for two-protons / two-electrons redox reaction, indicating a charge
transfer resistance between redox species and electrode surface. If the potential is swept
from + 0.18 V towards negative values and then reversed until + 0.6 V (figure 4B), no
reduction peak appears in the cathodic scan, indicating the absence of quinones or other
oxidants in the initial solution. However, the oxidation of the hydroquinone is evident in
the anodic scan.
Figure 4C shows the cyclic voltammogram response for the TvL/Au biosensing
platform in the presence (a) and in the absence (b) of hydroquinone in 0.1 M acetate
buffer solution, from -0.5 V to +0.65 V at 10 mV/s. The potential sweep was carried out
at the same conditions as in figure 4B. In the presence of hydroquinone (scan a of figure
4C), it can be observed that in the anodic scan there are not oxidation peaks, indicating
14
that hydroquinone was not present near the electrode since the enzymatic reaction was
taking place. In contrast, in the cathodic scan, since quinone is generated as product of
the enzymatic reaction, a clear response ascribed to its electrocatalytic reduction was
observed. Obviously, in the absence of hydroquinone (scan b of figure 4C) no peaks
were obtained. For both TvL/DTSP/Au and TvL/MPTS/Au platforms, similar cyclic
voltammograms to those displayed in figure 4C were obtained (Figure 1S).
The optimal response of biosensors depends on several factors including the degree
of catalytic activity preservation after the enzyme immobilization process and
operational parameters such as the working pH and the applied potential in
chronoamperometric measurements. Concerning operational parameters, we have
assayed pH values between 4 and 7 (data not shown). A pH in the 4-5 range was
selected since this gives the optimum response, according to the optimum pH value for
the enzyme [20]. On the other hand, from figure 4C (where the cathodic wave ascribed
to the electrocatalytic reduction of p-quinone to hydroquinone appears at -0.07 V) a
potential value of -0.10 V was selected to carry out the chronoamperometric
experiments, since it is adequate to provide a good intensity signal, minimizing
interferences due to other redox compounds. Thus, chronoamperometric measurements
of TvL/Au, TvL/DTSP/Au and TvL/MPTS/Au platforms for different HQ
concentrations were carried out by posing the biosensor at a step-potential from +0.18
V, where no redox process is occurring, to -0.10 V, where reduction of the quinones
generated as products of the enzymatic reaction was assured. From the
chronoamperometric response obtained for the developed biosensors in the presence of
increasing HQ concentrations (as an example data for TvL/Au system are displayed in
figure 2S), it can be concluded that a steady state current is reached after 50s.
15
Therefore, the current measured at this time was plotted as a function of the
concentration of HQ in solution (figure 3S) for TvL/Au (curve A), TvL/DTSP/Au
(curve B) and TvL/MPTS/Au (curve C) biosensors. The linear concentration range for
each biosensor was described by the following linear regression equations:
Iss(μA)=2.29C(mM)+0.0014 (R=0.992) for TvL/Au, Iss(μA)=2.53C(mM)+0.0015
(R=0.990) for TvL/DTSP/Au, and Iss(μA)=2.84C(mM)+0.0048 (R=0.990) for
TvL/MPTS/Au. The analytical properties of the developed biosensors, such as linear
concentration range, sensitivity, detection limit and reproducibility were evaluated, and
are displayed in Table 1. As can be observed, the sensitivity, calculated as the slope of
the calibration curves, was 2.29, 2.53, and 2.84 μA mM-1
for TvL/Au, TvL/DTSP/Au,
and TvL/MPTS/Au, respectively. Concerning the detection limit, calculated as the ratio
between three times the standard deviation of the blank signal and the sensitivity, values
of 0.91, 0.89, and 0.25 μM were obtained. As can be concluded from these data,
biosensors based on direct adsorption and covalent binding show similar linear
concentration ranges that are narrower than the corresponding to sol-gel based one.
Regarding sensitivity and detection limit, they are higher and lower respectively, in the
case of sol-gel based platforms. These results are consistent with the fact that this
approach allows to incorporate a large number of laccase structures at different depths
as it was concluded from AFM images. The reproducibility was evaluated from the
RSD for five different measurements of 7 µM of hydroquinone, yielding similar values
for the biosensors based on the three different immobilization strategies (around 3%).
Thus, if we compare the results obtained for the biosensor based on three
dimensional sol-gel network with the results obtained for both dimensional biosensors,
based on direct adsorption or covalent binding, we can affirm that the three strategies
allowed to prepare very reproducible final biosensing devices. Nevertheless, as one
16
would expect and according to the literature, the three dimensional sol-gel network
allows the incorporation of a higher amount of enzyme, which improves the sensitivity
of the final biosensing device without lost of reproducibility.
In order to compare the analytical properties obtained for the three developed
biosensors with those of other similar biosensors, we have also included in table 1 data
concerning linear concentration range, sensitivity, detection limit and reproducibility of
several laccase-based biosensors reported in the literature [3, 4, 8-10, 17, 19-21, 25-27,
30-35]. It is important to highlight that, in general, a direct comparison of the
performance of the different biosensors is not straightforward since they employ
different detection strategies, they determine different phenolic substrates and they are
developed using different sources of enzymes. However, although a high variability of
data is observed for each analytical parameter (due to the different nature of biosensors
displayed in table 1), it can be concluded that most of the analytical properties of the
biosensors designed by us are comparable or even better than those reported in the
literature for other laccase-based biosensors. It is important to highlight that some of the
biosensors summarized in the table include nanomaterials, which is not our case.
Moreover, an important point to take into account is that related to the simplicity of the
biosensor fabrication process. In this sense, the three biosensors designed in the present
work involve an easy fabrication process, allowing to obtain similar or better analytical
parameters than those showed in the table, most of them obtained with more
complicated methods.
Finally, since one of the most critical issues for an enzyme immobilization
approach is to avoid the leaking of the immobilized enzyme to the solution and to
preserve its catalytic activity, the stability of TvL/Au, TvL/DTSP/Au and
TvL/MPTS/Au biosensors was also evaluated by recording successive cyclic
17
voltammograms in 0.1 M acetate buffer (pH 4.5) solution containing 100 μM
hydroquinone. From these measurements, displayed in figure 1S, it can be concluded
that about 89%, 96% and 99% of the initial current response was retained after 50
measurements for TvL/Au, TvL/DTSP/Au and TvLMPTS/Au, respectively. In order to
study the storage stability of the three developed biosensors, additional experiments
were carried out. Biosensors were stored at 4ºC, when not in use. Biosensors maintain
their initial response during the first week of storage, while after six weeks TvL/Au,
TvL/DTSP/Au and TvL/MPTS/Au retain 87%, 93% and 97% of the initial current
response, indicating that the developed biosensing platforms, particularly the based on
sol-gel technology, present excellent storage stability. The results indicate that specially
in the case of the TvL/MPTS/Au biosensor, the enzyme was immobilized in a friendly
and biocompatible environment.
4. Conclusions
In this paper, the influence of different enzyme immobilization strategies on the
performance of TvL biosensing platforms is studied. The three methods selected for the
immobilization process are based on different interactions between the enzyme and the
surface: i) unspecific adsorption, ii) covalent binding and iii) inclusion in a sol gel
matrix. In presence of a phenolic compound, the biosensing platforms exhibit
electrocatalytic activity, and hydroquinone can be amperometrically determined at -0.10
V versus Ag/AgCl. The biosensor based on sol-gel technology exhibits a lower
detection limit and a wider linear concentration range, when compared with biosensors
based on direct adsorption and covalent binding, respectively. In this sense, this relative
biosensing performance enhancement is explained by the incorporation of a higher
amount of enzyme, which is enabled by the three dimensional sol-gel network. In

18
addition, the sol-gel network provides with a biocompatible and friendly environment to
enzyme encapsulation, leading to biosensors with an excellent stability.
Acknowledgments
This work has been supported by Comunidad Autónoma de Madrid (project No.
S2009/PPQ-1642, AVANSENS) and Ministerio de Ciencia e Innovación (projects No.
CTQ2008-05775 and FIS2012-38866-C05-05).
19
REFERENCES
[1] S.A.S.S. Gomes, J.M.F. Nogueira, M.J.F. Rebelo, Biosens. Bioelectron. 20 (2004)
1211-1216.
[2] F. Vianello, S. Ragusa, M.T. Cambria, A. Rigo, Biosens. Bioelectron. 21 (2006)
2155-2160.
[3] M.L. Mena, V. Carralero, A. González-Cortés, P. Yáñez-Sedeño, J.M. Pingarrón,
Electroanalysis 17 (2005) 2147-2155.
[4] A.I. Yaropolov, S.V. Shleev, O.V. Morozova, E.A. Zaitseva, G. Marko-Varga, J.
Emneus, L. Gorton, J. Anal. Chem. 60 (2005) 553-557.
[5] H. Tang, W. Zhang, P. Geng, Q. Wang, L. Jin, Z. Wu, M. Lou, Anal. Chim. Acta.
562 (2006) 190-196.
[6] Y. Zhang, G. Zeng, L. Tang, D. Huang, X. Jiang, Y. Chen, Biosens. Bioelectron.
22 (2007) 2121-2126.
[7] Y. Tan, W. Deng, Y. Li, Z. Huang, Y. Meng, Q. Xie, M. Ma, S. Yao, J. Phys.
Chem. B 114 (2010) 5016-5024.
[8] X. Xu, M. Guo, P. Lu, R. Wang, Mater. Sci. Eng. C-Mat 30 (2010) 722-729.
[9] S. Chawla, R. Rawal, Shabnam, R.C. Kuhad, C.S. Pundir, Anal. Methods 3 (2011)
709-714.
[10] T. Shimomura, T. Itoh, T. Sumiya, T. Hanaoka, F. Mizukami, M. Ono, Sensor.
Actuat. B-Chem. 153 (2011) 361-368.
[11] T. Bertrand, C. Jolivalt, P. Briozzo, E. Caminade, N. Joly, C. Madzak, C. Mougin,
Biochemistry 41 (2002) 7325-7333.
[12] S. Shleev, J. Tkac, A. Christenson, T. Ruzgas, A.I. Yaropolov, J.W. Whittaker, L.
Gorton, Biosens. Bioelectron. 20 (2005) 2517-2554.
20
[13] F. Xu, A.E. Palmer, D.S. Yaver, R.M. Berka, G.A. Gambetta, S.H. Brown, E.I.
Solomon, J. Biol. Chem. 274 (1999) 12372-12375.
[14] S. Shleev, A. Christenson, V. Serezhenkov, D. Burbaev, A. Yaropolov, L. Gorton,
T. Ruzgas, Biochem. J. 385 (2005) 745-754.
[15] N. Durán, M.A. Rosa, A. D’Annibale, L. Gianfreda, Enzyme Microb. Tech. 31
(2002) 907-931.
[16] C. Gutiérrez-Sánchez, W. Jia, Y. Beyl, M. Pita, W. Schuhmann, A.L. De Lacey, L.
Stoica, Electrochim. Acta 82 (2012) 218-223.
[17] X. Xu, P. Lu, Y. Zhou, Z. Zhao, M.Guo, Mater. Sci. Eng. C-Mat 29 (2009) 2160-
2164.
[18] T.M.B.F. Oliveira, M.F. Barroso, S. Morais, P. de Lima-Neto, A.N. Correia,
M.B.P.P.Oliveira, C. Delerue-Matos, Talanta 106 (2013) 137-143.
[19] M. Diaconu, S.C. Litescu, G.L. Radu, Microchim. Acta 172 (2011) 177-184.
[20] P. Ibarra-Escutia, J. Juarez-Gómez, C. Calas-Blanchard, J.L. Marty, M.T.
Ramírez-Silva, Talanta 81 (2010) 1636-1642.
[21] M.R. Montereali, L.D. Seta, W. Vastarella, R. Pilloton, J. Mol. Catal. B-Enzym.
64 (2010) 189-194.
[22] F. Vianello, A. Cambria, S. Ragusa, M.T. Cambria, L. Zennaro, A. Rigo, Biosens.
Bioelectron. 20 (2004) 315-321.
[23] Z. Wang, Q. Xu, J.H. Wang, Q. Yang, J.H. Yu, Y.D. Zhao, Microchim. Acta 165
(2009) 387-392.
[24] S. Chawla, R. Rawal, D. Kumar, C.S. Pundir, Anal. Biochem. 430 (2012) 16-23.
[25] S.A.V. Eremia, I. Vasilescu, A. Radoi, S.C. Litescu, G.L. Radu, Talanta 110
(2013) 164-170.
21
[26] D. Brondani, B. de Souza, B.S. Souza, A. Neves, I.C. Vieira, Biosens. Bioelectron.
42 (2013) 242-247.
[27] I. Cesarino, H.V. Galesco, F.C.Moraes, M.R.V. Lanza, S.A.S. Machado,
Electroanalysis 25 (2013) 394-400.
[28] A.M. Parra-Alfambra, E. Casero, M.D. Petit-Domínguez, M. Barbadillo, F.
Pariente, L. Vázquez, E. Lorenzo, Analyst 136 (2011) 340-347.
[29] A.I. Yaropolov, O.V. Skorobogatko, S.S. Vartanov, S.D. Varfolomeyev, Appl.
Biochem. Biotech. 49 (1994) 257–280.
[30] A. Jarosz-Wilkolazka, T. Ruzgas, L. Gorton, Talanta 66 (2005) 1219-1224.
[31] S.C. Litescu, S.A.V. Eremia, A. Bertoli, L. Pistelli, G.L. Radu, Anal. Lett. 43
(2010) 1089-1099.
[32] M. Diaconu, S.C. Litescu, G.L. Radu, Sensor. Actuat. B-Chem. 145 (2010) 800-
806.
[33] M. ElKaoutit, I. Naranjo-Rodriguez, K.R. Temsamani, M.P. Hernández-Artiga, D.
Bellido-Milla, J.L. Hidalgo-Hidalgo de Cisneros, Food Chem. 110 (2008) 1019-
1024.
[34] B. Haghighi, L. Gorton, T. Ruzgas, L.J. Jönsson, Anal. Chim. Acta 487 (2003) 3-
14.
[35] Y. Liu, X. Qu, H. Guo, H. Chen, B. Liu, S. Dong, Biosens. Bioelectron. 21 (2006)
2195-2201.
22
FIGURES
Scheme 1. (A) Enzyme immobilization strategies employed for biosensor fabrication:
1) direct adsorption, 2) covalent binding, 3) sol-gel encapsulation. (B) Catalytic reaction
for phenolic compounds.
Figure 1. (A) 3.5 x 3.5 µm2
and (B) 0.5 x 0.5 µm2
tapping-mode AFM images of a TvL
layer adsorbed on a gold substrate. Inset of figure A: a higher magnification image (75 x
75 nm2) of the same system. (C) 3.5 x 3.5 µm
2 and (D)
0.5 x 0.5 µm
2 tapping-mode
AFM images of a TvL layer covalently bonded to a DTSP-modified gold substrate.
23
Inset of figure C: a higher magnification image (75 x 75 nm2) of the same system. All
images have been taken under buffer conditions.
Figure 2. (A) 3.5 x 3.5 µm2
and (B) 0.5 x 0.5 µm2
tapping-mode AFM images of
MPTS/Au, taken under buffer conditions. (C) Force curves taken in air with the same
silicon tip on the gold (solid bold line) and MPTS/Au systems. The curves
corresponding to the MPTS/Au (dash-dotted, dotted and dashed lines) have been taken
at different sample locations. The thickness of the polymer layer varies in the 20-75 nm
range.
24
Figure 3. (A) 3.5 x 3.5 µm2 and (B)
0.5 x 0.5 µm
2 tapping-mode AFM images of
TvL/MPTS/Au. Inset of figure A: a higher magnification image (75 x 75 nm2) of the
same system. All images have been taken under buffer conditions.
Figure 4. Cyclic voltammetric response for a bare gold electrode (Au) in 0.1 M acetate
buffer (pH 4.5) solution containing 100 μM hydroquinone cycling the potential from
+0.18 V towards positive (A) or negative values (B). (C) Cyclic voltammetric response
for TvL/Au biosensor immersed in 0.1 M acetate buffer solution in the presence (a) and
in the absence (b) of 100 μM hydroquinone. The scan rate was 10 mV/s.
25
Figure 1S. Successive voltammetric response for TvL/Au (A), TvL/DTSP/Au (B) and
TvL/MPTS/Au (C) biosensors immersed in 0.1 M acetate buffer solution in the
presence of 100 μM hydroquinone. The scan rate was 10 mV/s.
Figure 2S. Chronoamperometric measurements for TvL/Au biosensor at an applied
potential of -0.1 V in a 0.1 M acetate buffer solution for increasing HQ concentrations.
Figure 3S. Calibration plot of current response versus hydroquinone concentration in a
0.1 M acetate buffer solution (obtained from chronoamperometric measurements at an
applied potential of -0.1 V) for TvL/Au (A), TvL/DTSP/Au (B) and TvL/MPTS/Au (C)
biosensors.
Table 1. Analytical properties of several laccase-based biosensors reported in the
literature, including the present work.
Recommended


![MB-JASS 2006 Nathalie Munnikes, TUM...Biosensors and Bioelectronics 20, 2005 [5] Enzyme inhibition-based biosensors for food safety and environmental monitoring A. Amine, H. Mohammadi,](https://img.pdfslide.us/doc/110x75/60d900078a7b5d08b05d9583/mb-jass-2006-nathalie-munnikes-biosensors-and-bioelectronics-20-2005-5-enzyme.jpg)