L:\AECOM\Andersen\42338COV.wpd EM +EDD
LABORATORY DATA CONSULTANTS, INC. 2701 Loker Ave. West, Suite 220, Carlsbad, CA 92010 Bus: 760-827-1100 Fax: 760-827-1099
AECOM June 25, 20181001 Bishop Street Suite 1600Honolulu, HI 96813ATTN: Dr. Brant Landers
SUBJECT: Andersen AFB, CTO JQ13, Data Validation
Dear Dr. Landers
Enclosed are the final validation reports for the fraction listed below. These SDGs were received onMay 30, 2018. Attachment 1 is a summary of the samples that were reviewed for each analysis.
LDC Project #42338:
SDG # Fraction
18D194, 18D20218D210, 680-151865-1680-151914-1, 680-151915-1
2,4-D & 2,4,5-T
The data validation was performed under Level C & D validation guidelines. The analyses werevalidated using the following documents and variances, as applicable to each method:
! Final Work Plan for Limited Investigation into Alleged Herbicide Orange Use at ThreeSites, Andersen Air Force Base, Guam; 2018,
! Project Procedures Manual, U.S. Naval Facilities Engineering Command EvironmentalRestoration Program, NAVFAC Pacific; DON 2015
! U.S. Department of Defense Quality Systems Manual for Environmental Laboratories;Version 5.1; 2017
! EPA SW 846, Third Edition, Test Methods for Evaluating Solid Waste, update 1, July1992; update IIA, August 1993; update II, September 1994; update IIB, January 1995;update III, December 1996; update IIIA, April 1998; IIIB, November 2004; Update IV,February 2007
Please feel free to contact us if you have any questions.
Sincerely,
Stella Cuenco Project Manager/Senior Chemist
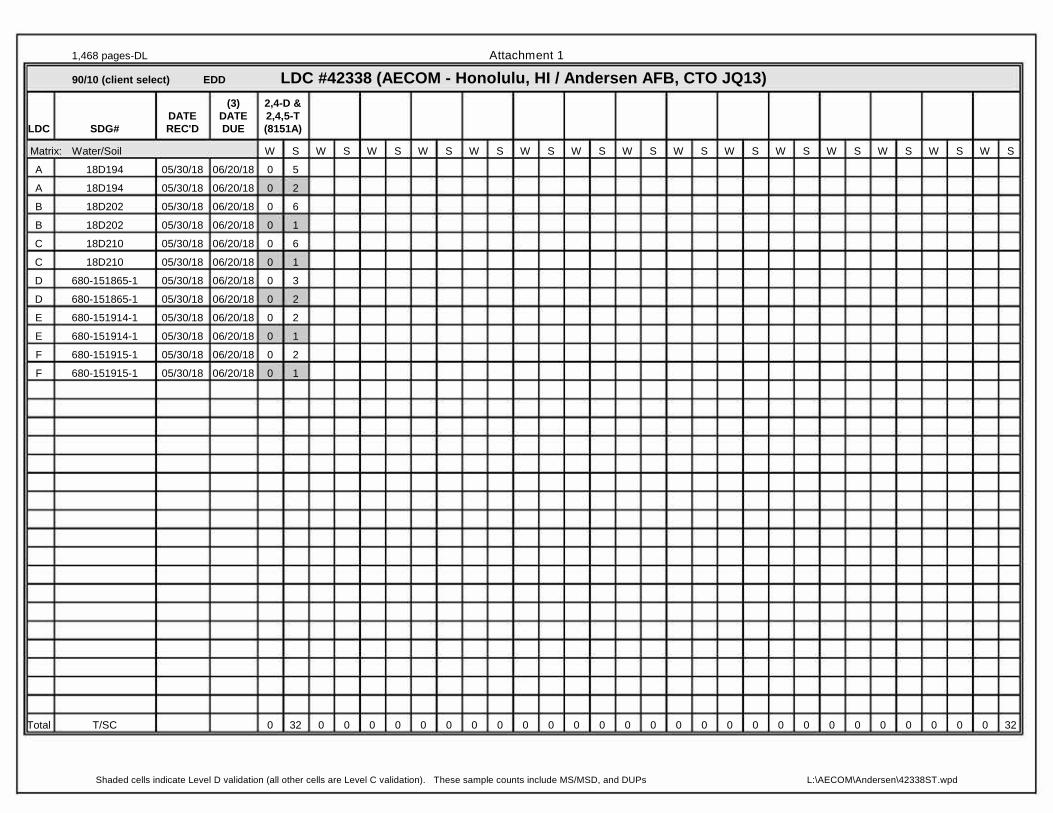
Shaded cells indicate Level D validation (all other cells are Level C validation). These sample counts include MS/MSD, and DUPs L:\AECOM\Andersen\42338ST.wpd
1,468 pages-DL Attachment 1
90/10 (client select) EDD LDC #42338 (AECOM - Honolulu, HI / Andersen AFB, CTO JQ13)
LDC SDG#DATEREC'D
(3)DATEDUE
2,4-D &2,4,5-T(8151A)
Matrix: Water/Soil W S W S W S W S W S W S W S W S W S W S W S W S W S W S W S
A 18D194 05/30/18 06/20/18 0 5
A 18D194 05/30/18 06/20/18 0 2
B 18D202 05/30/18 06/20/18 0 6
B 18D202 05/30/18 06/20/18 0 1
C 18D210 05/30/18 06/20/18 0 6
C 18D210 05/30/18 06/20/18 0 1
D 680-151865-1 05/30/18 06/20/18 0 3
D 680-151865-1 05/30/18 06/20/18 0 2
E 680-151914-1 05/30/18 06/20/18 0 2
E 680-151914-1 05/30/18 06/20/18 0 1
F 680-151915-1 05/30/18 06/20/18 0 2
F 680-151915-1 05/30/18 06/20/18 0 1
Total T/SC 0 32 0 0 0 0 0 0 0 0 0 0 0 0 0 0 0 0 0 0 0 0 0 0 0 0 0 0 0 32

LDC Report# 42338A5
Laboratory Data Consultants, Inc. Data Validation Report
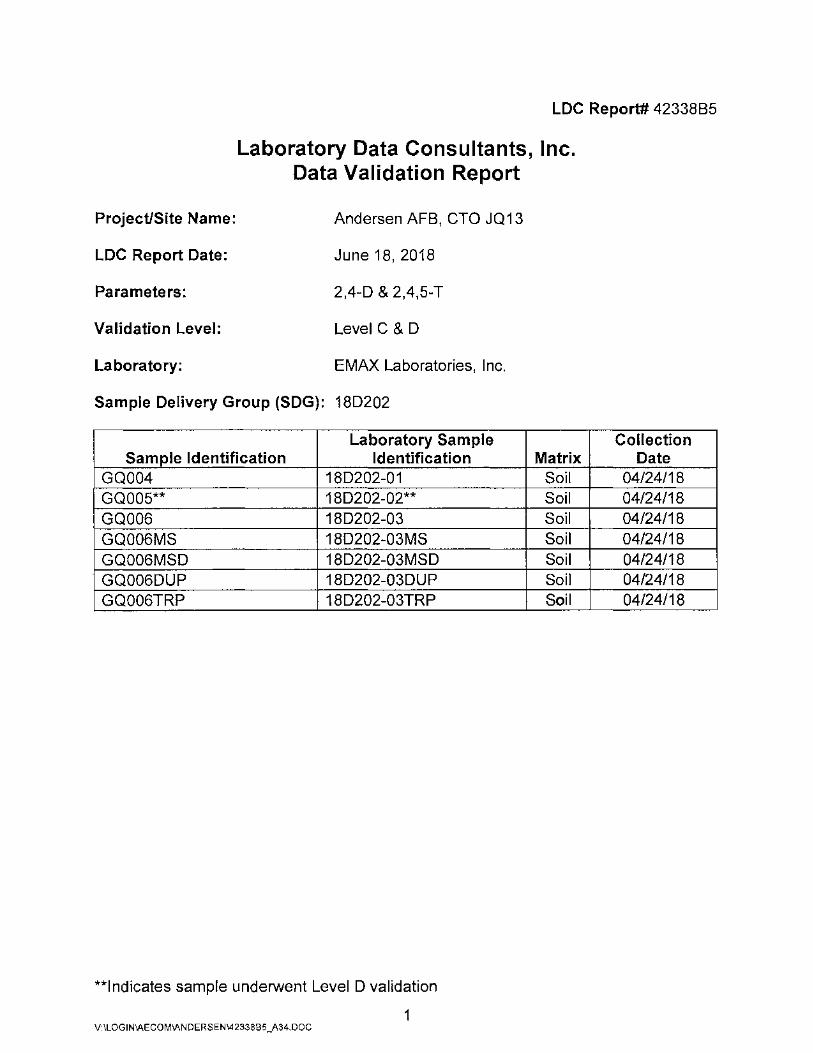
Project/Site Name: Andersen AFB, CTO JQ13
LDC Report Date: June 18, 2018
Parameters: 2,4-0 & 2,4,5-T
Validation Level: Level C & 0
Laboratory: EMAX Laboratories, Inc.
Sample Delivery Group (SDG): 180194
Laboratory Sample Sample Identification Identification
GQ001** 180194-01 ** GQ002 180194-02 GQ003** 180194-03** GQ0020UP 180194-020UP GQ002TRP 180194-02TRP GQ003MS 180194-03MS GQ003MSO 180194-03MSO
**Indicates sample underwent Level 0 validation
1 V:\LOGIN\AECOM\ANDERSEN\42338A5_A34.DOC
Collection Matrix Date
Soil 04/23/18 Soil 04/23/18 Soil 04/23/18 Soil 04/23/18 Soil 04/23/18 Soil 04/23/18 Soil 04/23/18
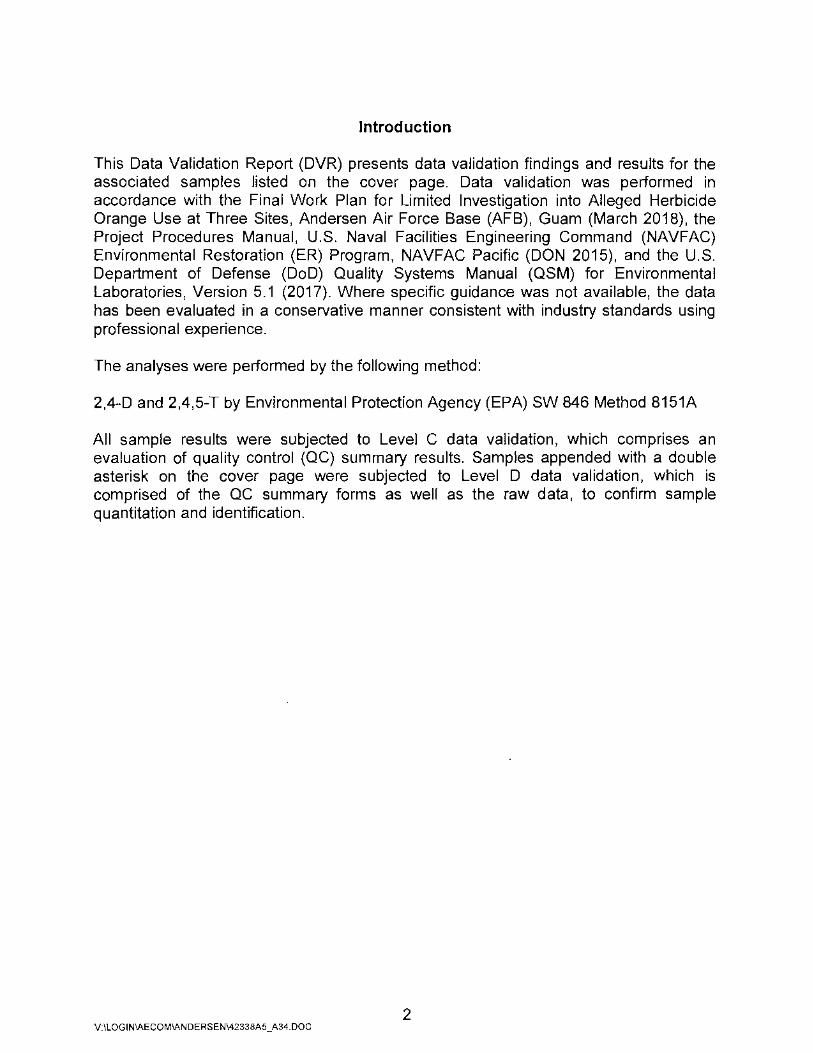
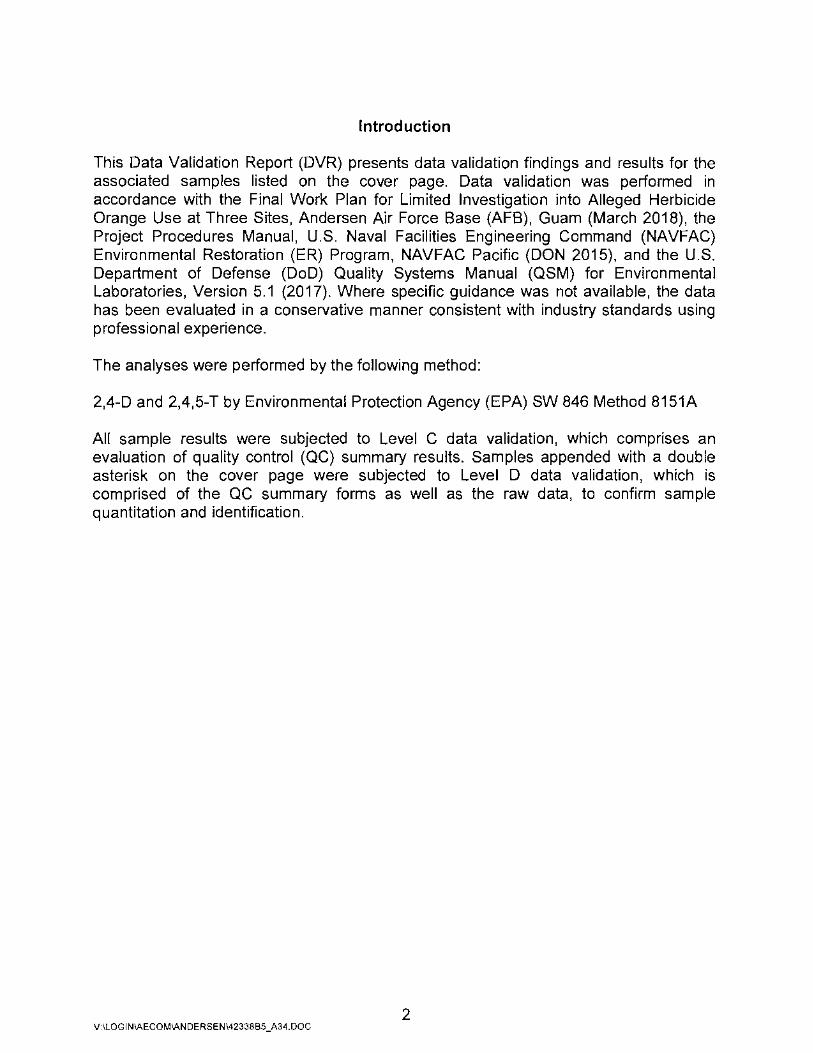
Introduction
This Data Validation Report (DVR) presents data validation findings and results for the associated samples listed on the cover page. Data validation was performed in accordance with the Final Work Plan for Limited Investigation into Alleged Herbicide Orange Use at Three Sites, Andersen Air Force Base (AFB), Guam (March 2018), the Project Procedures Manual, U.S. Naval Facilities Engineering Command (NAVFAC) Environmental Restoration (ER) Program, NAVFAC Pacific (DON 2015), and the U.S. Department of Defense (DoD) Quality Systems Manual (QSM) for Environmental Laboratories, Version 5.1 (2017). Where specific guidance was not available, the data has been evaluated in a conservative manner consistent with industry standards using professional experience.
The analyses were performed by the following method:
2,4-D and 2,4,5-T by Environmental Protection Agency (EPA) SW 846 Method 8151A
All sample results were subjected to Level C data validation, which comprises an evaluation of quality control (QC) summary results. Samples appended with a double asterisk on the cover page were subjected to Level D data validation, which is comprised of the QC summary forms as well as the raw data, to confirm sample quantitation and identification.
2 V: \LOG I N\AECOM\AN DERSEN\42338A5 _A34. DOC

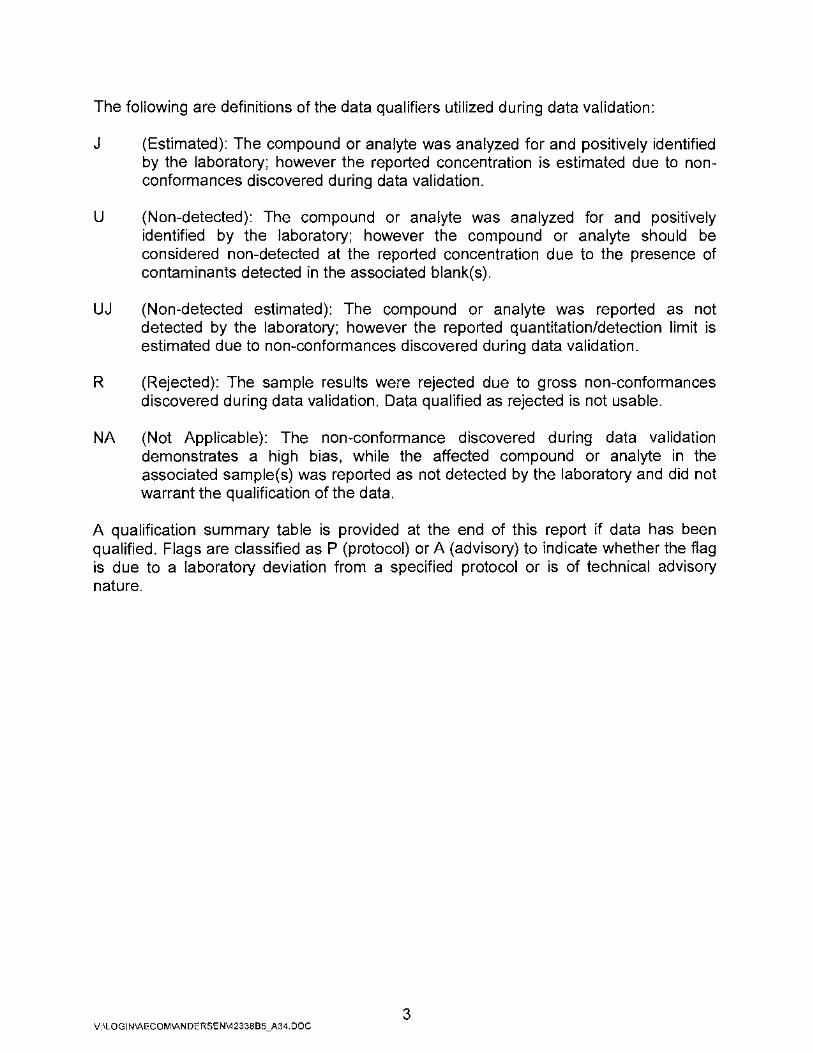
The following are definitions of the data qualifiers utilized during data validation:
J (Estimated): The compound or analyte was analyzed for and positively identified by the laboratory; however the reported concentration is estimated due to nonconformances discovered during data validation.
U (Non-detected): The compound or analyte was analyzed for and positively identified by the laboratory; however the compound or analyte should be considered non-detected at the reported concentration due to the presence of contaminants detected in the associated blank(s).
UJ (Non-detected estimated): The compound or analyte was reported as not detected by the laboratory; however the reported quantitation/detection limit is estimated due to non-conformances discovered during data validation.
R (Rejected): The sample results were rejected due to gross non-conformances discovered during data validation. Data qualified as rejected is not usable.
NA (Not Applicable): The non-conformance discovered during data validation demonstrates a high bias, while the affected compound or analyte in the associated sample(s) was reported as not detected by the laboratory and did not warrant the qualification of the data.
A qualification summary table is provided at the end of this report if data has been qualified. Flags are classified as P (protocol) or A (advisory) to indicate whether the flag is due to a laboratory deviation from a specified protocol or is of technical advisory nature.
3 V:\LOGIN\AECOM\ANDERSEN\42338A5_A34.DOC

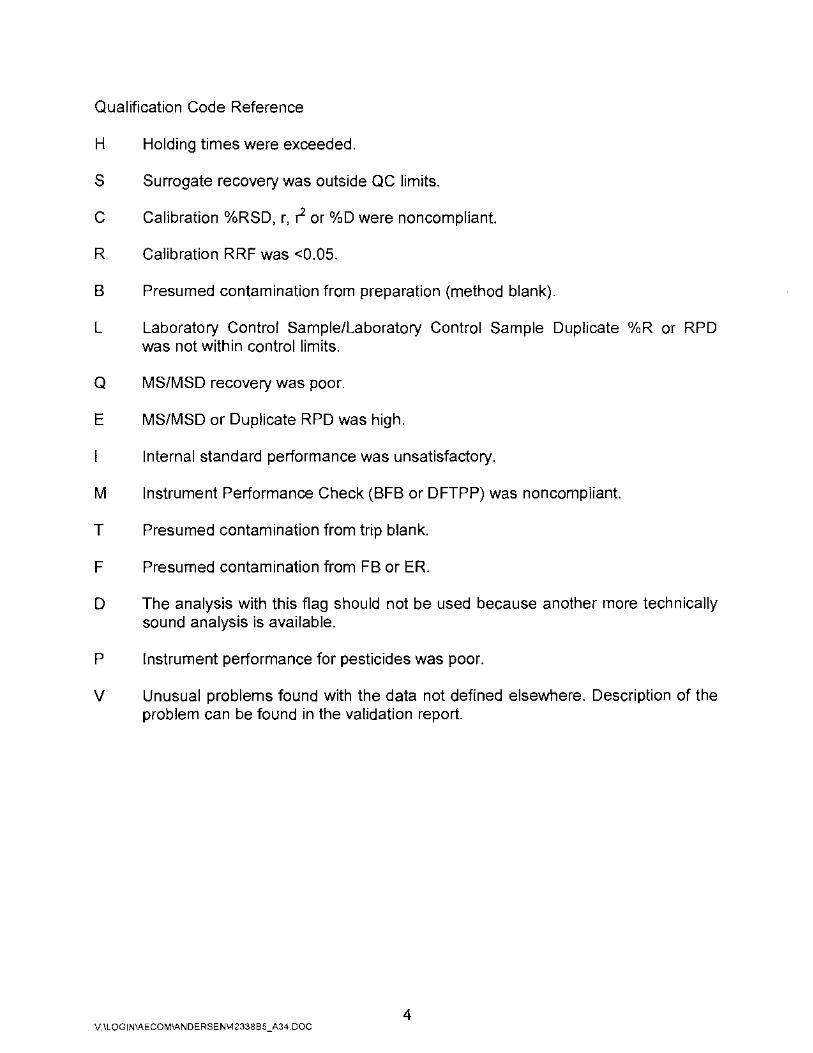
Qualification Code Reference
H Holding times were exceeded.
S Surrogate recovery was outside QC limits.
C Calibration °/oRSD, r, r2 or 0/oD were noncompliant.
R Calibration RRF was <0.05.
B Presumed contamination from preparation (method blank).
L Laboratory Control Sample/Laboratory Control Sample Duplicate 0/oR or RPD was not within control limits.
Q MS/MSD recovery was poor.
E MS/MSD or Duplicate RPD was high.
Internal standard performance was unsatisfactory.
M Instrument Performance Check (BFB or DFTPP) was noncompliant.
T Presumed contamination from trip blank.
F Presumed contamination from FB or ER.
D The analysis with this flag should not be used because another more technically sound analysis is available.
P Instrument performance for pesticides was poor.
V Unusual problems found with the data not defined elsewhere. Description of the problem can be found in the validation report.
4 V:\LOGIN\AECOM\ANDERSEN\42338A5_A34.DOC
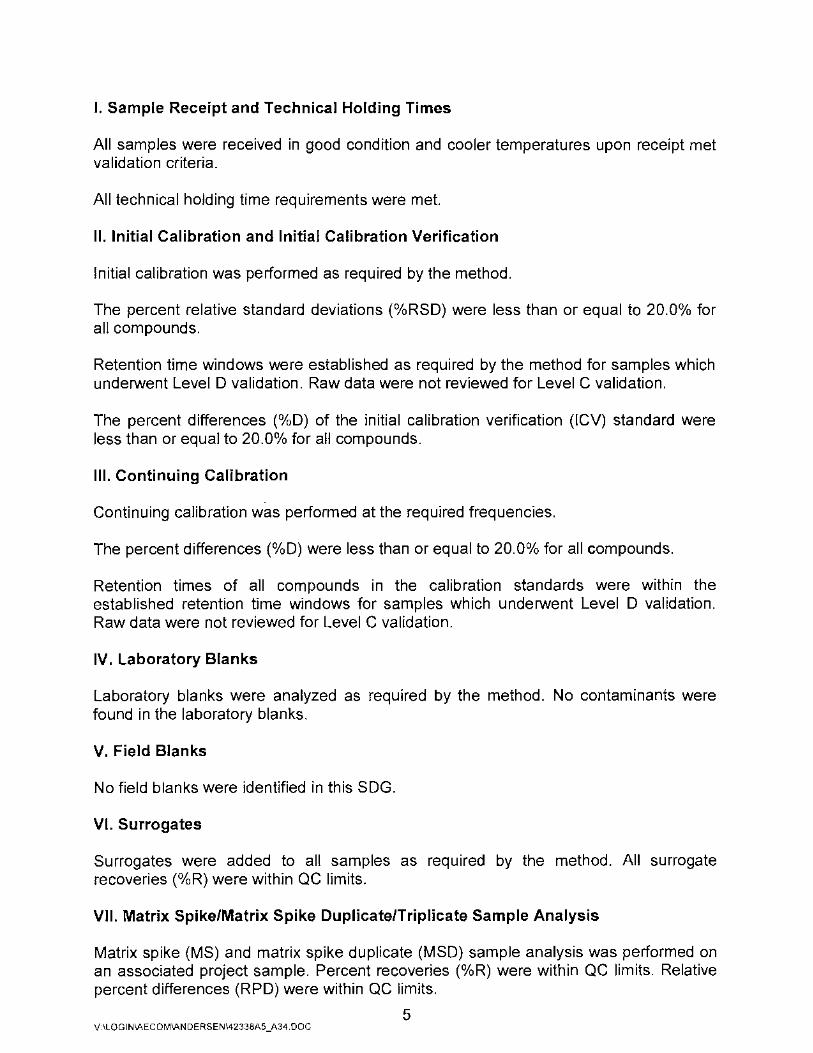
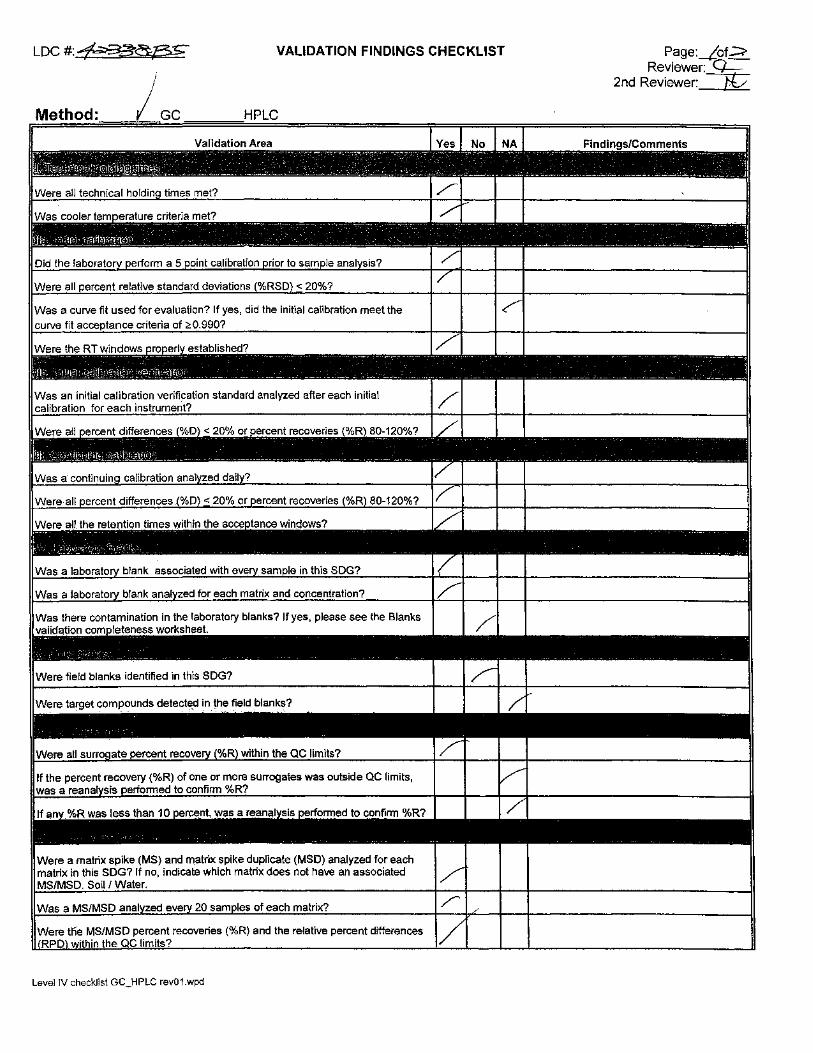
I. Sample Receipt and Technical Holding Times
All samples were received in good condition and cooler temperatures upon receipt met validation criteria.
All technical holding time requirements were met.
II. Initial Calibration and Initial Calibration Verification
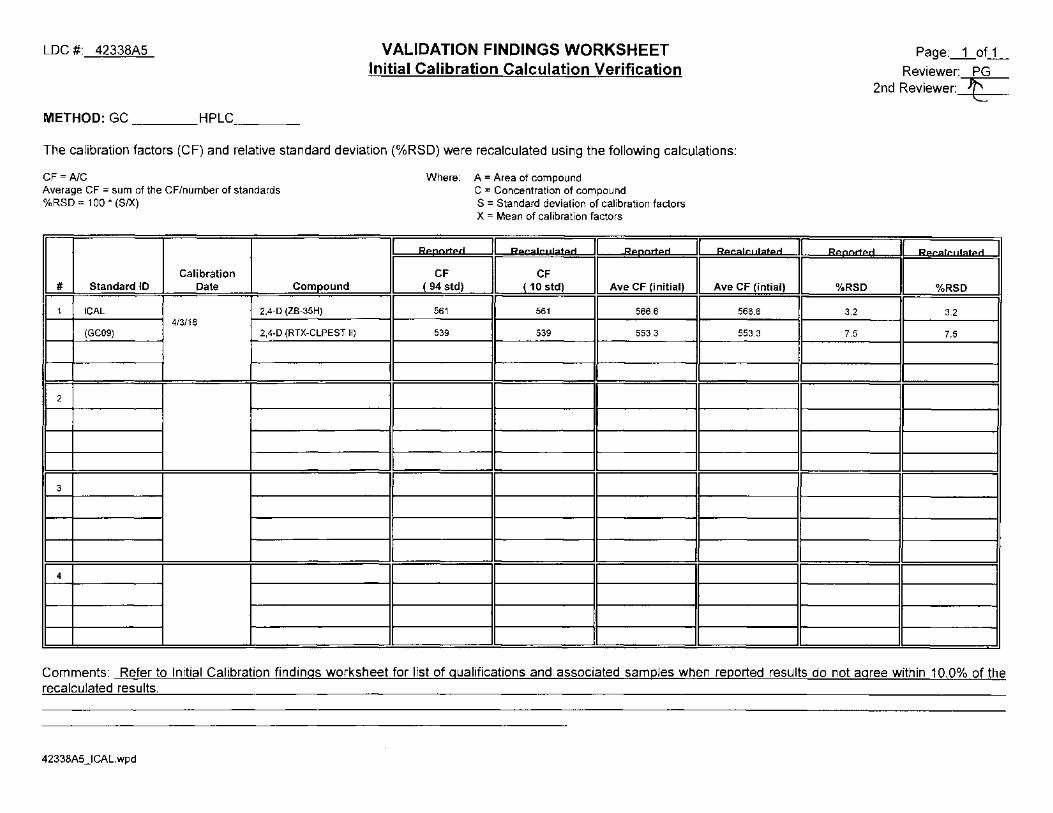
Initial calibration was performed as required by the method.
The percent relative standard deviations (0/oRSD) were less than or equal to 20.0o/o for all compounds.
Retention time windows were established as required by the method for samples which underwent Level D validation. Raw data were not reviewed for Level C validation.
The percent differences (0/oD) of the initial calibration verification (ICV) standard were less than or equal to 20.0°/o for all compounds.
Ill. Continuing Calibration
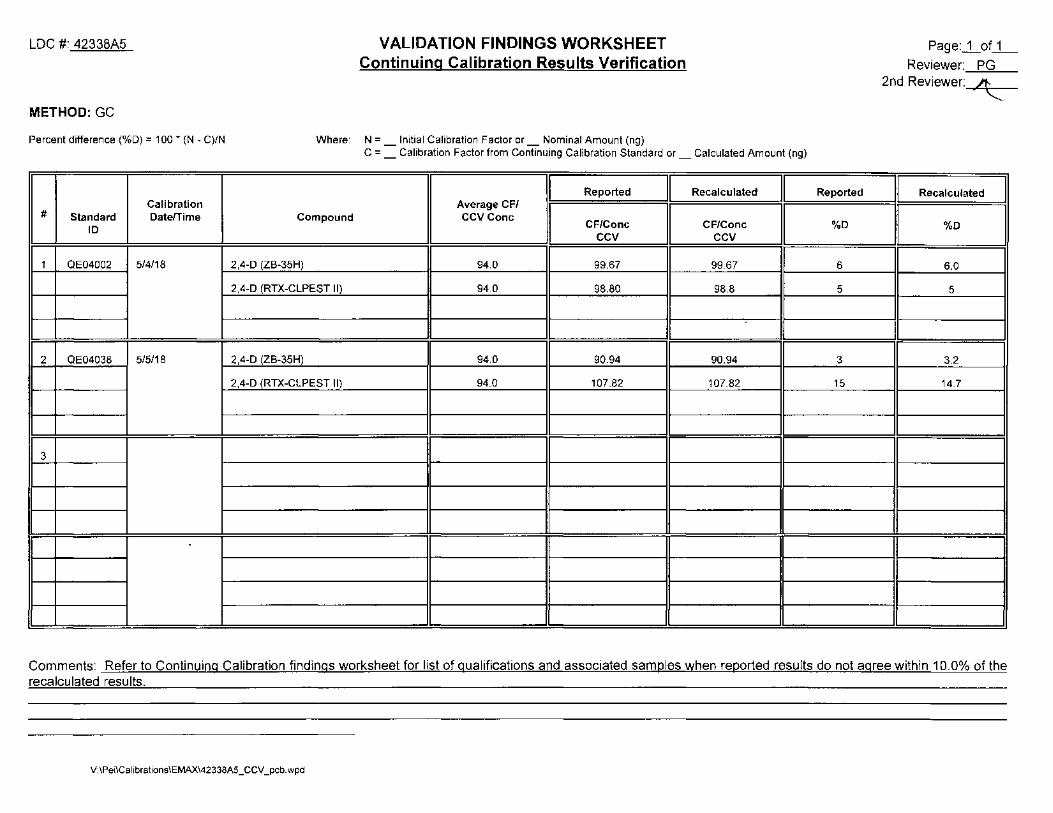
Continuing calibration was performed at the required frequencies.
The percent differences (0/oD) were less than or equal to 20.0°/o for all compounds.
Retention times of all compounds in the calibration standards were within the established retention time windows for samples which underwent Level D validation. Raw data were not reviewed for Level C validation.
IV. Laboratory Blanks
Laboratory blanks were analyzed as required by the method. No contaminants were found in the laboratory blanks.
V. Field Blanks
No field blanks were identified in this SDG.
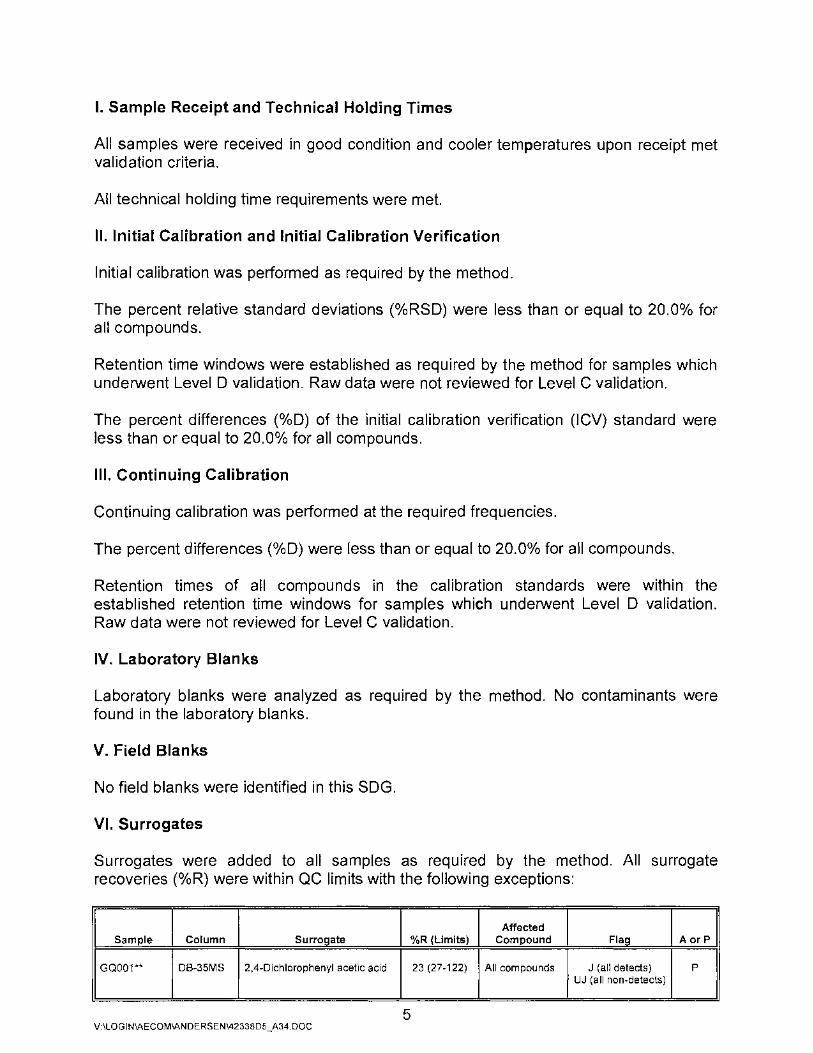
VI. Surrogates
Surrogates were added to all samples as required by the method. All surrogate recoveries (0/oR) were within QC limits.
VII. Matrix Spike/Matrix Spike Duplicate/Triplicate Sample Analysis
Matrix spike (MS) and matrix spike duplicate (MSD) sample analysis was performed on an associated project sample. Percent recoveries (o/oR) were within QC limits. Relative percent differences (RPD) were within QC limits.
5 V:\LOGIN\AECOM\ANDERSEN\42338A5_A34.DOC
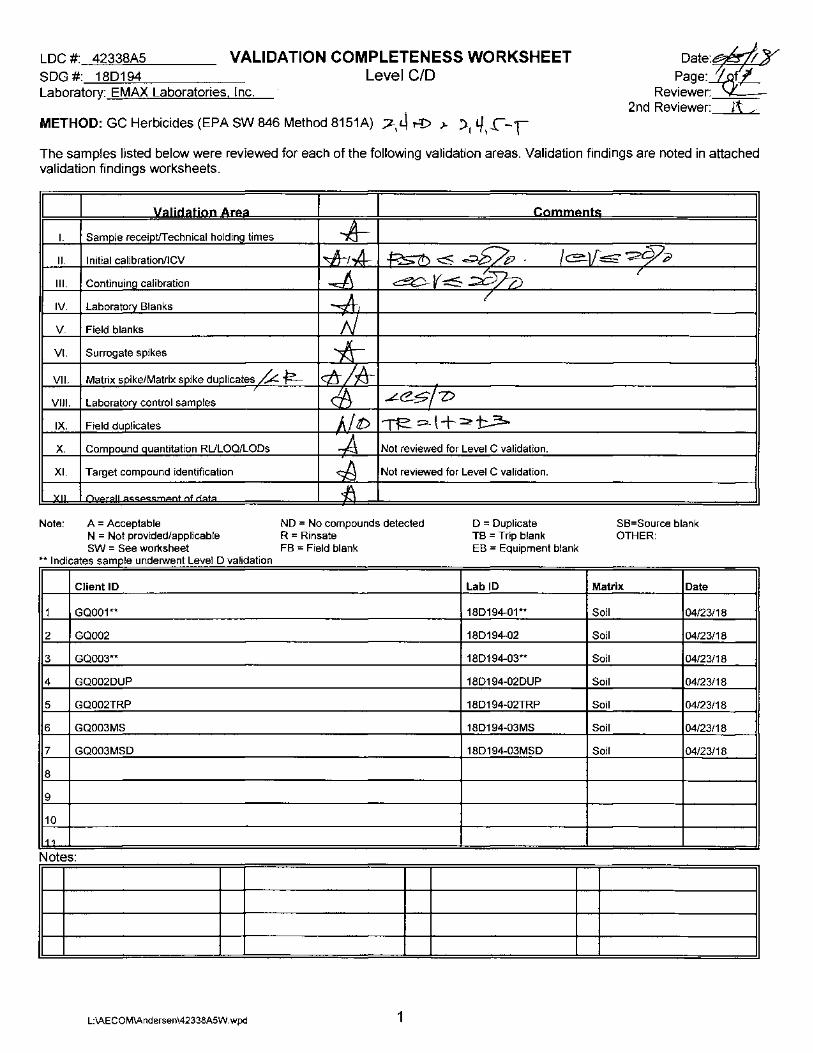
Triplicate (TRP) sample analysis was performed on an associated project sample. Results were within QC limits.
VIII. Laboratory Control Samples
Laboratory control samples (LCS) and laboratory control samples duplicates (LCSD) were analyzed as required by the method. Percent recoveries (0/oR) were within QC limits. Relative percent differences (RPD) were within QC limits.
IX. Field Triplicates
Samples GQ001 **, GQ002, and GQ003** were identified as field triplicates. No results were detected in any of the samples.
X. Compound Quantitation
All compound quantitations met validation criteria for samples which underwent Level D validation. Raw data were not reviewed for Level C validation.
XI. Target Compound Identification
All target compound identifications met validation criteria for samples which underwent Level D validation. Raw data were not reviewed for Level C validation.
XII. Overall Assessment of Data
The analysis was conducted within all specifications of the method. No results were rejected in this SDG.
The quality control criteria reviewed were met and are considered acceptable. Based upon the data validation all results are considered valid and usable for all purposes.
6 V:\LOGIN\AECOM\ANDERSEN\42338A5_A34.DOC

Andersen AFB, CTO JQ13 2,4-D & 2,4,5-T - Data Qualification Summary - SDG 18D194
No Sample Data Qualified in this SDG
Andersen AFB, CTO JQ13 2,4-D & 2,4,5-T - Laboratory Blank Data Qualification Summary - SDG 18D194
No Sample Data Qualified in this SDG
Andersen AFB, CTO JQ13 2,4-D & 2,4,5-T - Field Blank Data Qualification Summary - SDG 18D194
No Sample Data Qualified in this SDG
7 V:\LOGIN\AECOM\ANDERSEN\42338A5_A34.DOC
LDC #: 42338A5
SDG #: 180194
VALIDATION COMPLETENESS WORKSHEET Level C/O
Laboratory: EMAX Laboratories. Inc.
METHOD: GC Herbicides (EPA SW 846 Method 8151A) 7,4 r-D ~ ).1 ~~._r-t
Date:ftY Page:_!/.o(l
Reviewer~-~-2nd Reviewer: 11 <
The samples listed below were reviewed for each of the following validation areas. Validation findings are noted in attached validation findings worksheets.
I I llalidatioo A[ea I I Comments
I. Sample receipt/Technical holding times ~ II. Initial calibration/ICV *'4 ~~~&/ /c::?!-\[ ~ 297p
~ ~v-::::s~ /' Ill. Continuing calibration
IV. Laboratory Blanks -~' /
V. Field blanks N VI. Surrogate spikes * VII. Matrix spike/Matrix spike duplicates /...L-~ <tsll:s-
;
VIII. Laboratory control samples
IX. Field duplicates
X. Compound quantitation RULOQ/LODs
XI. Target compound identification
)(II ()\/~r::tll nf rl::~t::~
Note: A = Acceptable N = Not provided/applicable SW = See worksheet
** I d. t I d t L I D I'd f n 1ca es sample un erwen eve va1 a1on
Client ID
1 GQ001**
2 GQ002
3 GQ003**
4 GQ002DUP
5 GQ002TRP
6 GQ003MS
7 GQ003MSD
8
9
10
11
Notes:
L:\AECOM\Andersen\42338ASW. wpd
c!!J- -L-e-~fZ>
1\/!D ~~t+=<'t.> .-A Not reviewed for Level C validation.
~ Not reviewed for Level C validation.
<8 ND =No compounds detected R = Rinsate
D =Duplicate TB = Trip blank
FB = Field blank EB = Equipment blank
LabiD
180194-01**
180194-02
180194-03**
18D194-02DUP
18D194-02TRP
18D194-03MS
18D194-03MSD
1
SB=Source blank OTHER:
Matrix Date
Soil 04/23/18
Soil 04/23/18
Soil 04/23/18
Soil 04/23/18
Soil 04/23/18
Soil 04/23/18
Soil 04/23/18
I

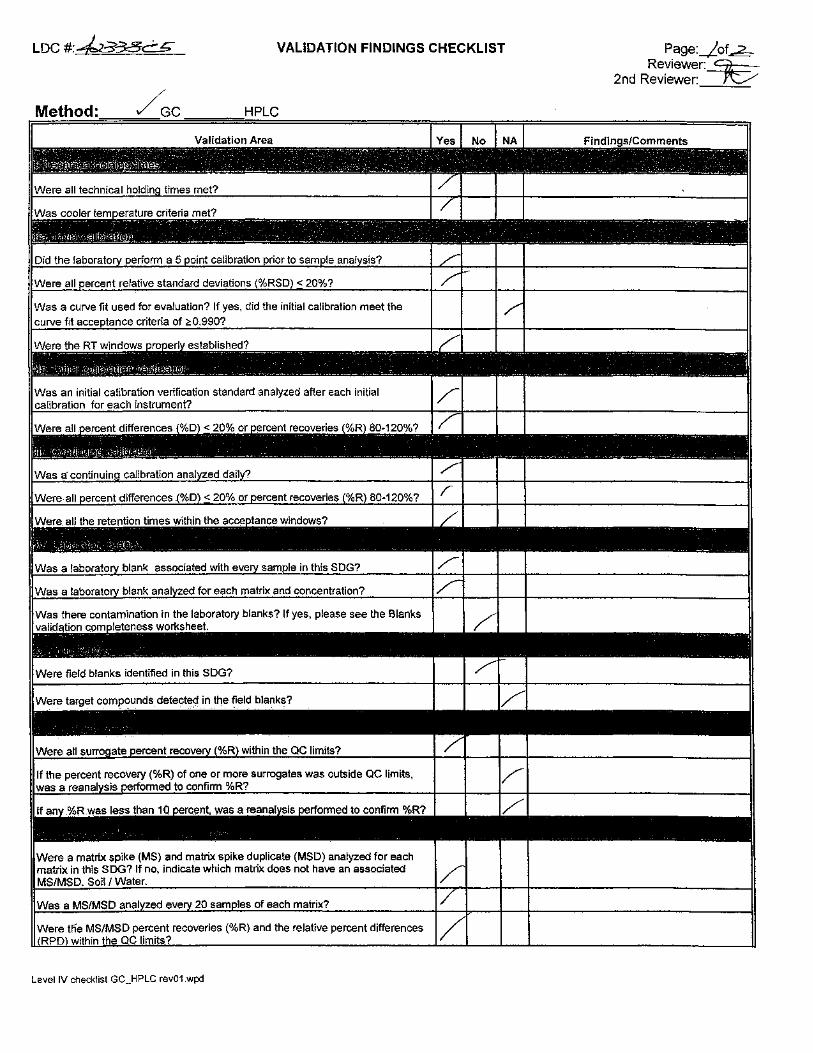
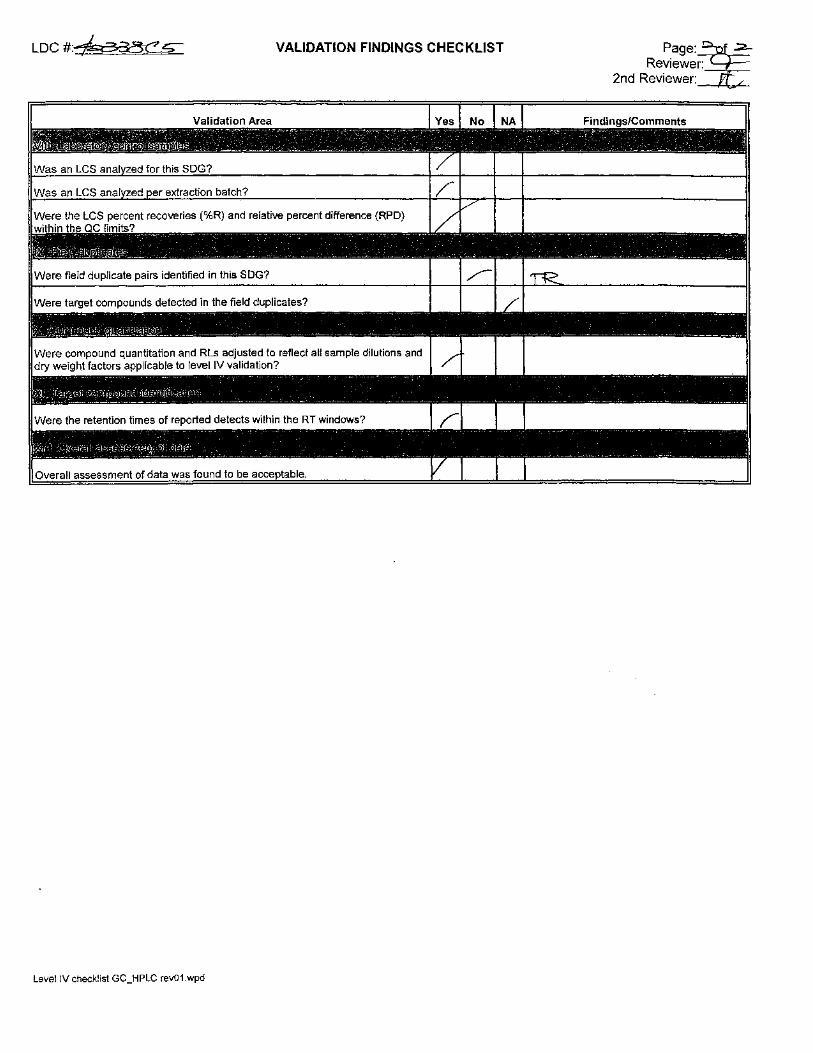
VALIDATION FINDINGS CHECKLIST
Method: GC PLC
Level IV checklist GC_HPLC rev01.wpd
Page:.L_Qf~ Reviewer:~
2nd Reviewer: /!!;;;. ,

ment of;data was found to be
Level IV check!ist GC_HPLC rev01.wpd
VALIDATION FINDINGS CHECKLIST Page:~of~ Reviewer: cp:=
2nd Reviewer: Jby
LDC #: 42338A5
METHOD:GC HPLC ______ _
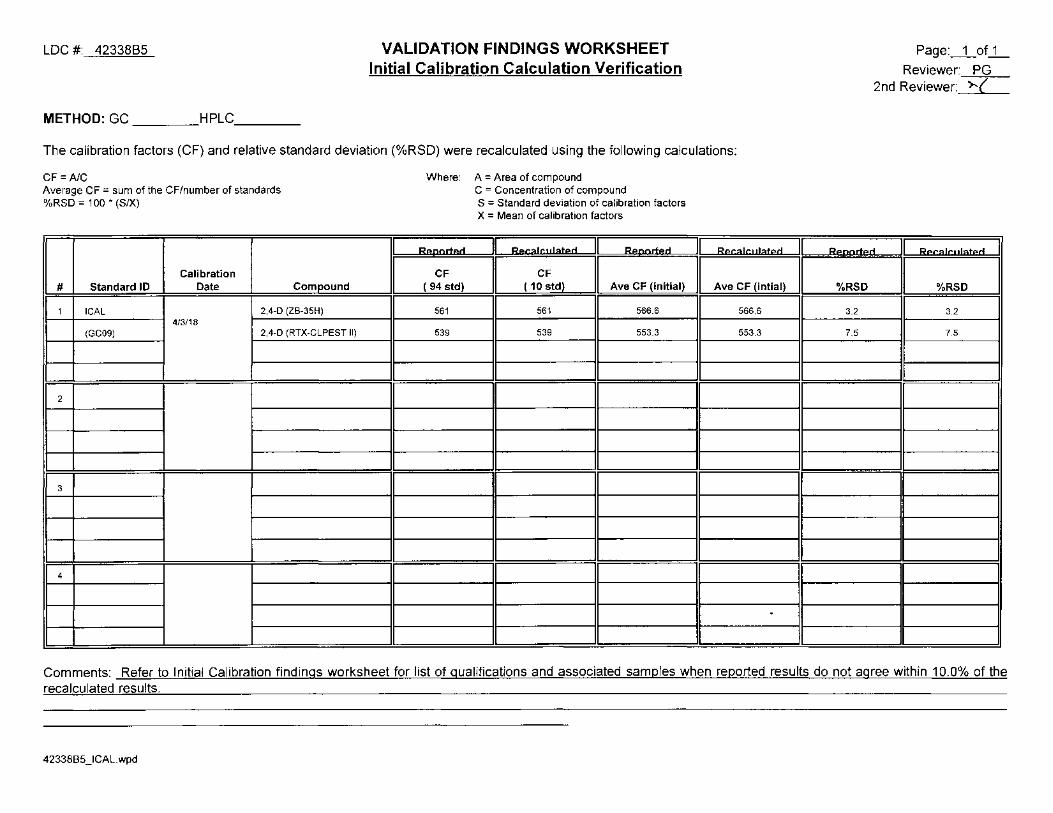
VALIDATION FINDINGS WORKSHEET Initial Calibration Calculation Verification
The calibration factors (CF) and relative standard deviation (%RSD) were recalculated using the following calculations:
CF = AJC Average CF = sum of the CF/number of standards %RSD = 100 * (SIX)
Calibration # Standard ID Date Compound
1 I CAL 2,4-D (ZB-35H) 4/3/18
(GC09) 2,4-D (RTX-CLPEST II)
2
3
I 4 I I I II
Where: A = Area of compound
~
CF ( 94 std)
561
539
C = Concentration of compound S = Standard deviation of calibration factors X = Mean of calibration factors
I Becalc11lated I .... -•
I CF
I ( 10 std) Ave CF (initial)
561 566.6
539 553.3
II II
I eecalc11lated
Ave CF (intial)
566.6
553.3
II
Page:_1_of_1_
Reviewer: PG 2nd Reviewer:~
1~1 eecalc11lated I
%RSD I I %RSD
3.2 3.2
7.5 7.5
II II I
Comments: Refer to Initial Calibration findings worksheet for list of qualifications and associated samples when reported results do not agree within 10.0% of the recalculated results.
42338A5_1CAL.wpd
LDC #: 42338A5
METHOD:GC
Percent difference (%0) = 100 * (N - C)/N
Calibration # Standard Date/Time
ID
1 QE04002 5/4/18
2 QE04038 5/5/18
3
I l_ J - I
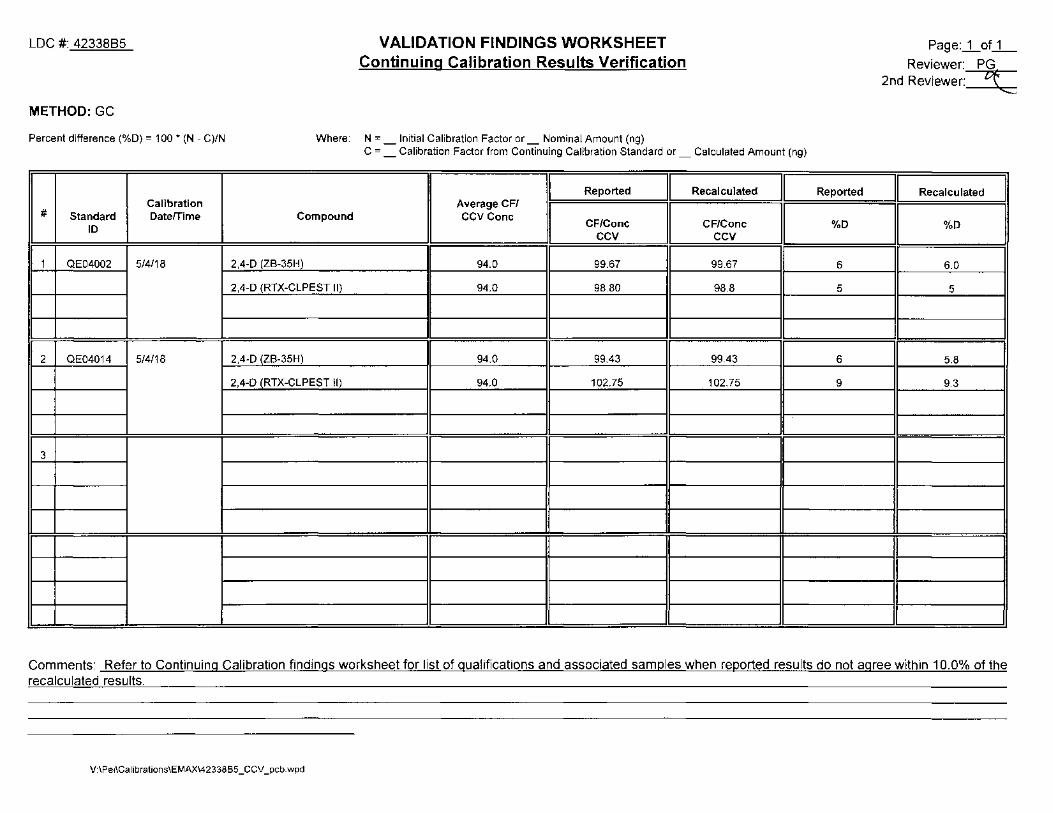
VALIDATION FINDINGS WORKSHEET Continuing Calibration Results Verification
Where: N = _ Initial Calibration Factor or_ Nominal Amount (ng) C =_Calibration Factor from Continuing Calibration Standard or_ Calculated Amount (ng)
I Reported II Recalculated II Average CF/
I II II Compound CCV Cone
CF/Conc CF/Conc CCV CCV
2,4-D (ZB-35H) 94.0 99.67 99.67
2,4-D (RTX-CLPEST II) 94.0 98.80 98.8
2,4-D (ZB-35H) 94.0 90.94 90.94
2,4-D (RTX-CLPEST II) 94.0 107.82 107.82
II II II II
Reported
%0
6
5
3
15
Page:_1_of_1 _
Reviewer: PG 2nd Reviewer: ,n...
"---·
II Recalculated
II %0
6.0
5
3.2
14.7
IL I
Comments: Refer to Continuing Calibration findings worksheet for list of qualifications and associated samples when reported results do not agree within 10.0% of the recalculated results.
V:\Pei\Calibrations\EMAX\42338A5 _CCV _pcb. wpd
-..__,..._.-
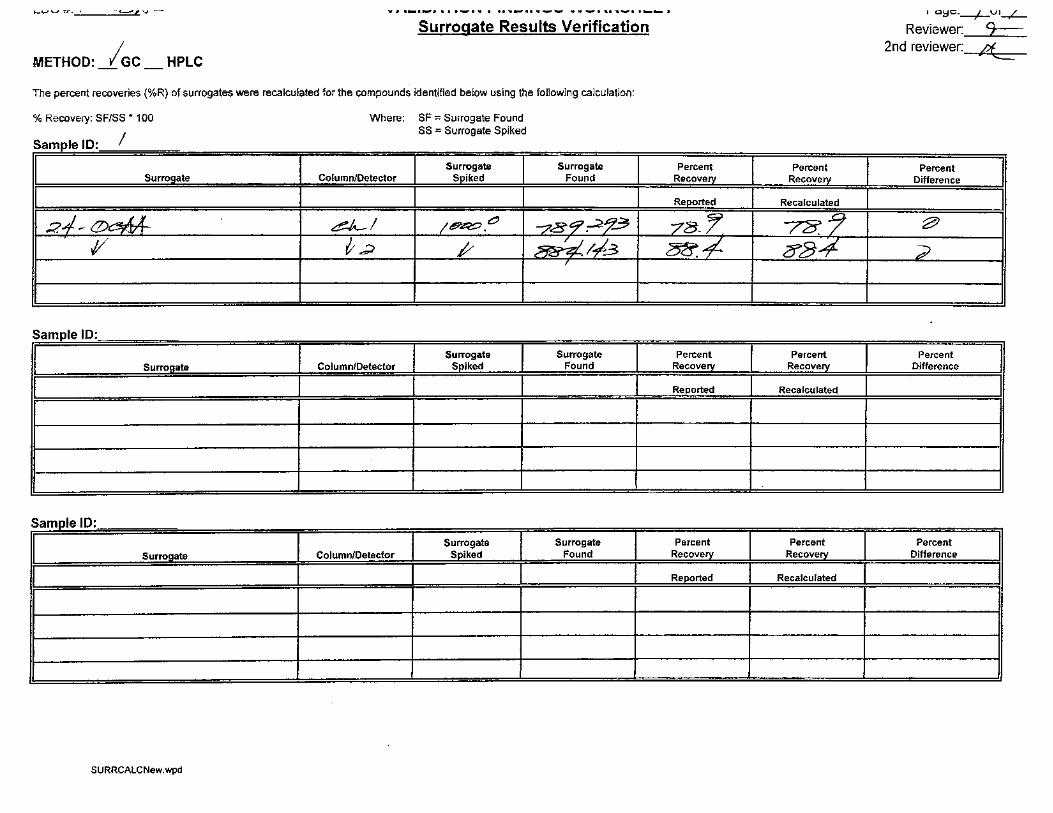
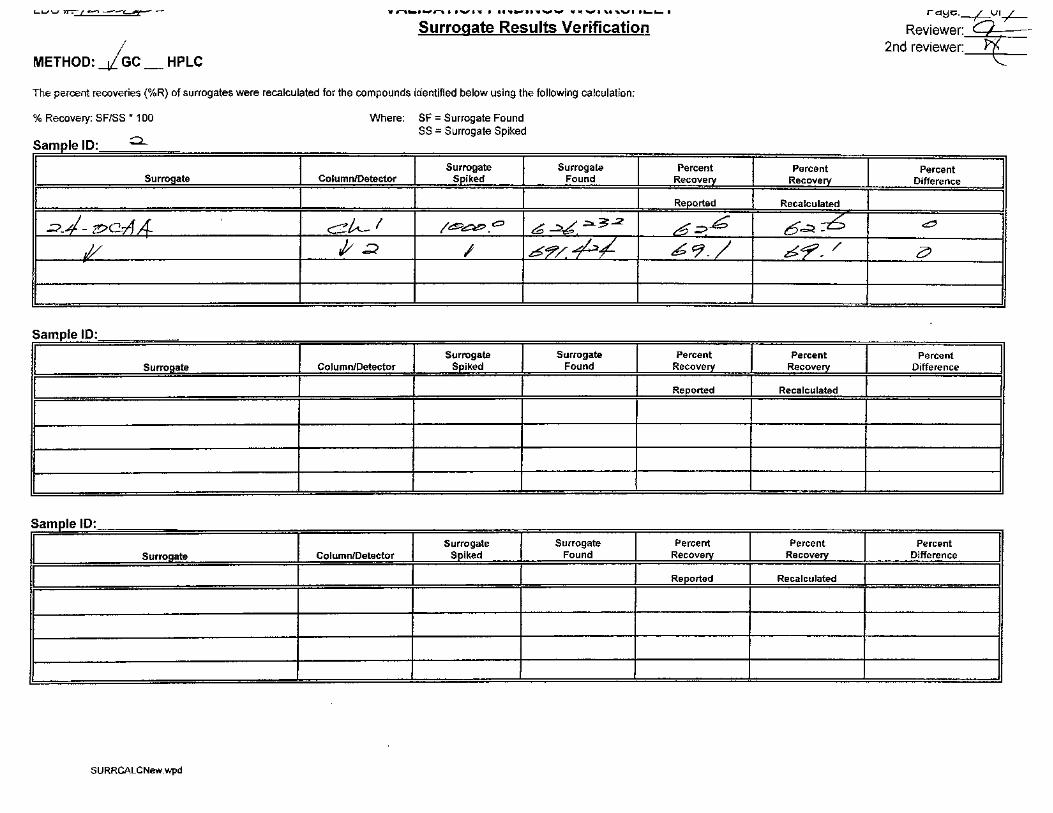
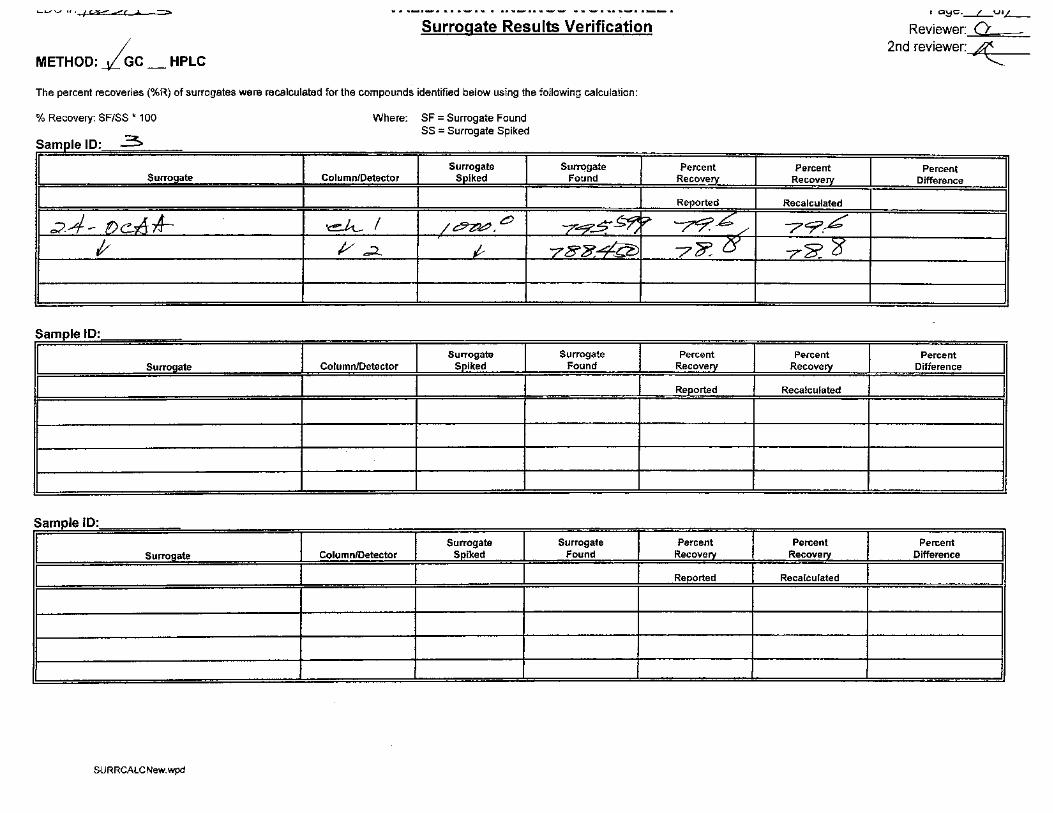
Surrogate Results Verification
METHOD: _(GC HPLC
The percent recoveries (%R) of surrogates were recalculated for the compounds identified below using the following calculation:
%Recovery: SF/SS * 100
Sample ID· I
II I Surrogate
I ~~~-~
SamoleiD
Surro ate
Sample 10·
I Surro ate
'I
SURRCALCNew. wpd
Where: SF = Surrogate Found SS = Surrogate Spiked
I Column/Detector J Surrogate I Spiked
I I I Surrogate I Found
I
I ~I I /~.o I=ZI ?.:;; p
Surrogate Column/Detector Found
I Surrogate Column/Detector Found
I
I~ Q~C.-1--UI-,L.-
Reviewer: 9--=--2nd reviewer: ~
Percent I Percent l Percent I Recovery Recovery Difference
Re~orted I Recalculated I I 78.~ I ;;:tl
g
I ~~ 2
Percent Difference
Re~orted Recalculated I
Percent Difference
Re~orted Recalculated
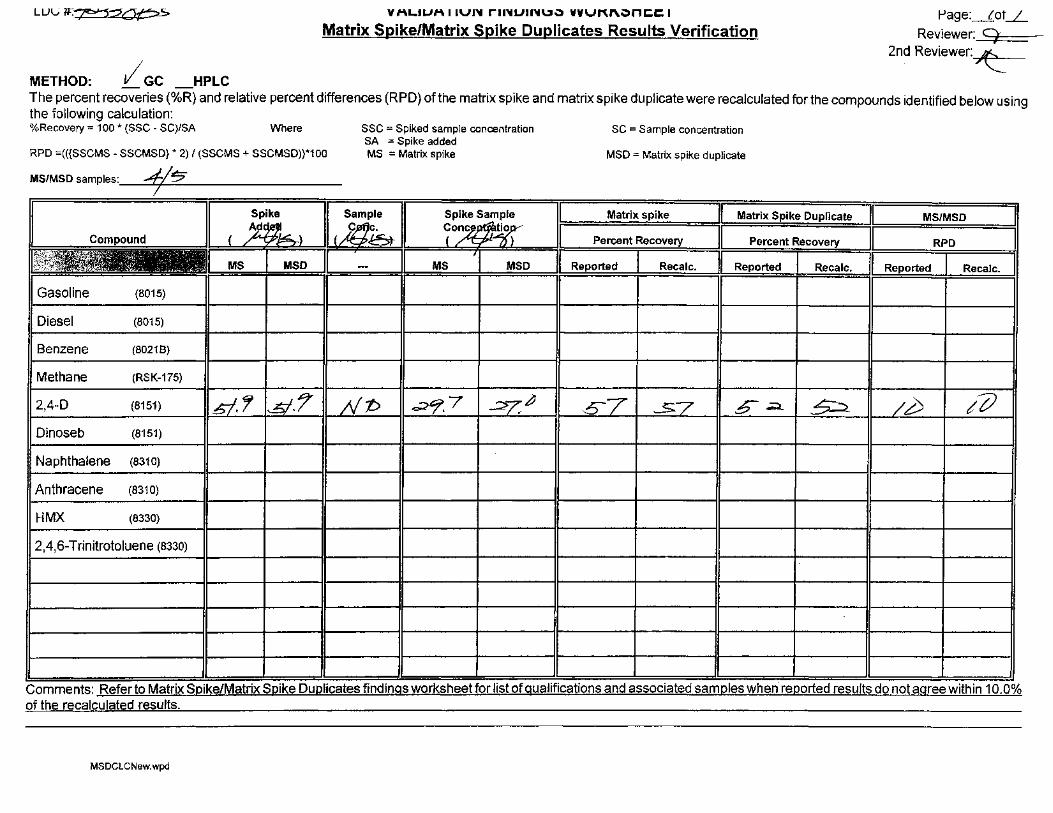
Y 1"\LILII"\ I lVI~ rii~LIII~U~ VVVI"\.1'\.~nt:E: I
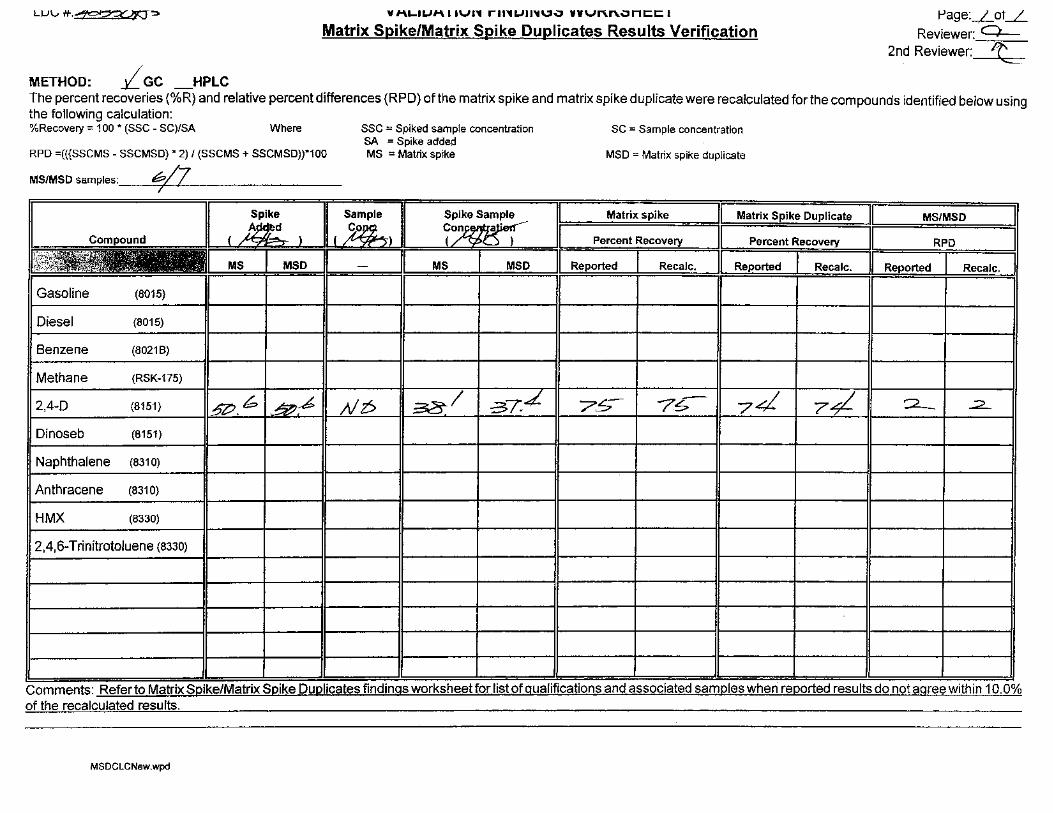
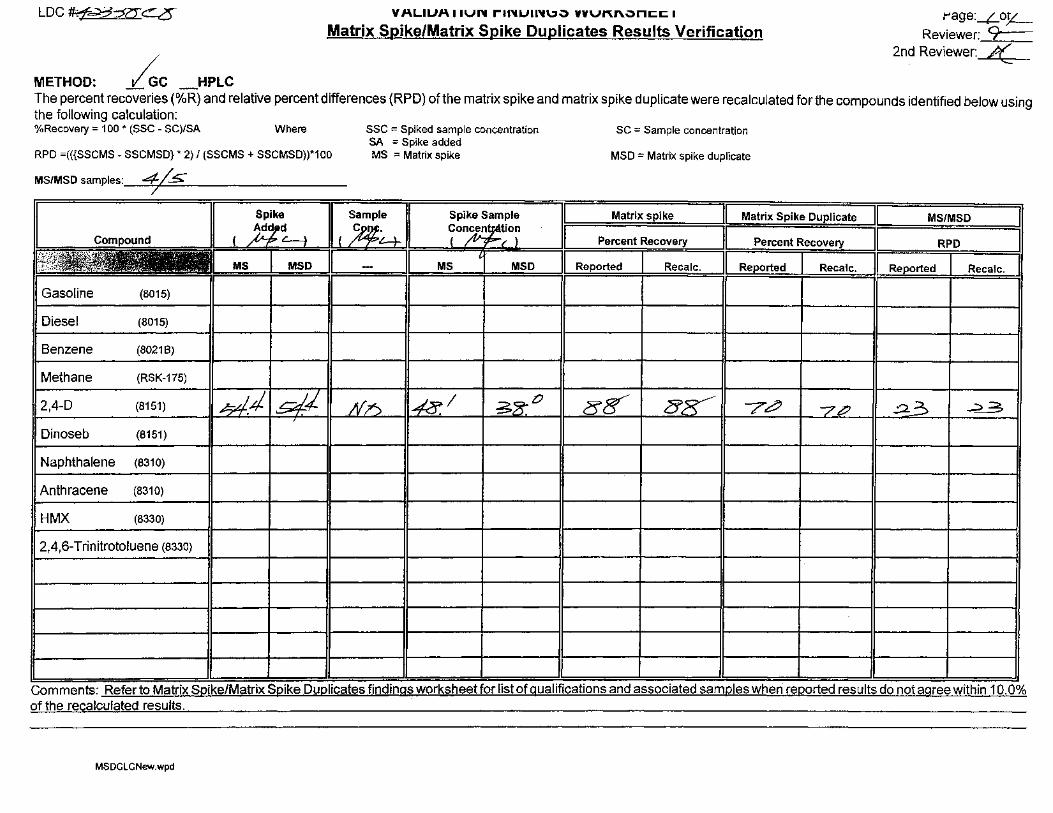
Matrix Spike/Matrix Spike Duplicates Results Verification Page:-Lot_.L
Reviewer: 0--2nd Reviewer: ~-
METHOD: LGc _HPLC The percent recoveries (%R) and relative percent differences (RPD) of the matrix spike and matrix spike duplicate were recalculated for the compounds identified below using the following calculation: %Recovery = 100 * (SSC - SC)/SA Where
RPD =(({SSCMS- SSCMSD} * 2) I (SSCMS + SSCMSD))*100
MS/MSD samples: __ 6~~--~---Z ________ _ I
Gasoline (8015)
Diesel (8015)
Benzene (80218)
Methane (RSK-175)
SSC = Spiked sample concentration SA = Spike added. MS = Matrix spike
SC = Sample concentration
MSD = Matrix spike duplicate
Spike Sample . - ~--- Matrix spike If-Matrix Spike Duplicate II MS/MSD I
Con ~ . I Percent Recovery II Percent Recovery II RPD I
-- I MSD II Reported I Recalc. II Reported I Recalc. II Reported I Recalc. I
2,4-D (8151) II~· b l~:b I~D ;38--1 -37.4'- 75- 7~ 74 7~- 2_ ...2.._
Dinoseb (8151)
Naphthalene (8310) -
Anthracene (8310)
HMX (8330)
2,4,6-Trinitrotoluene (8330)
Comments: Refer to Matrix Spike/Matrix Spike Duplicates findings worksheet for list of qualifications and associated samples when reported results do not agree within 10.0% of the recalculated results.
MSDCLCNew.wpd
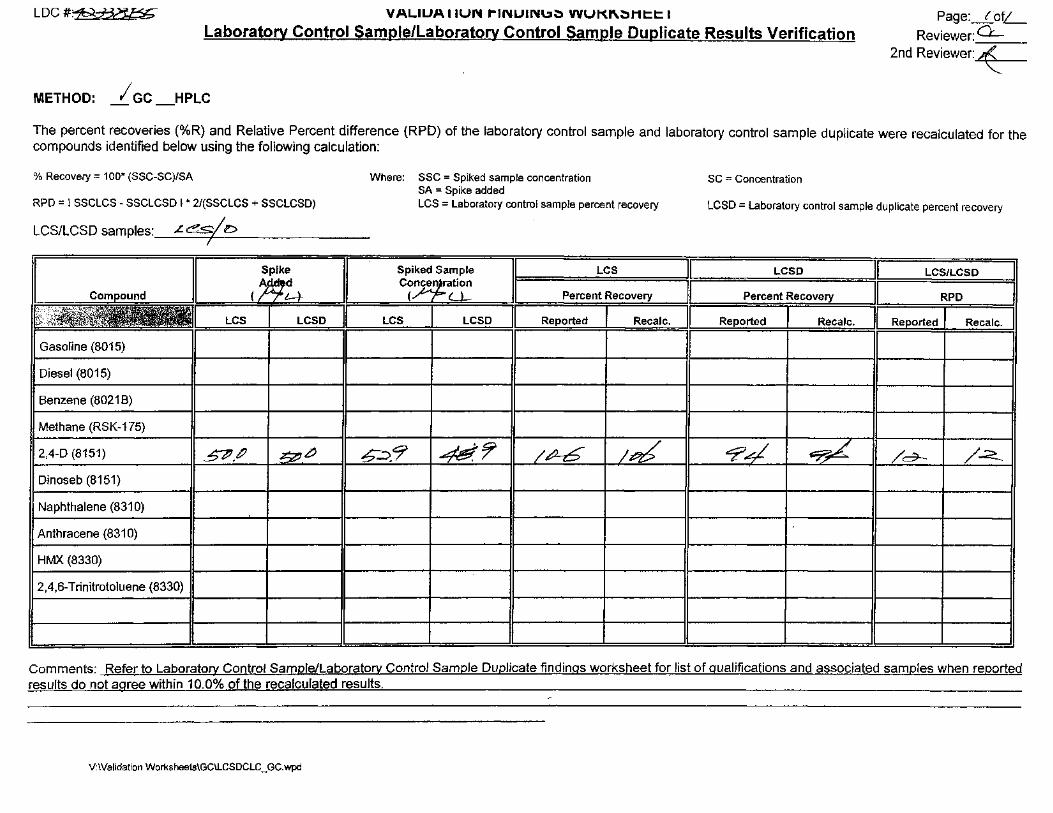
LUC~ VALIUA IIUN I'""INUINU~ VVUI'(I"\~Mt:.t:. I
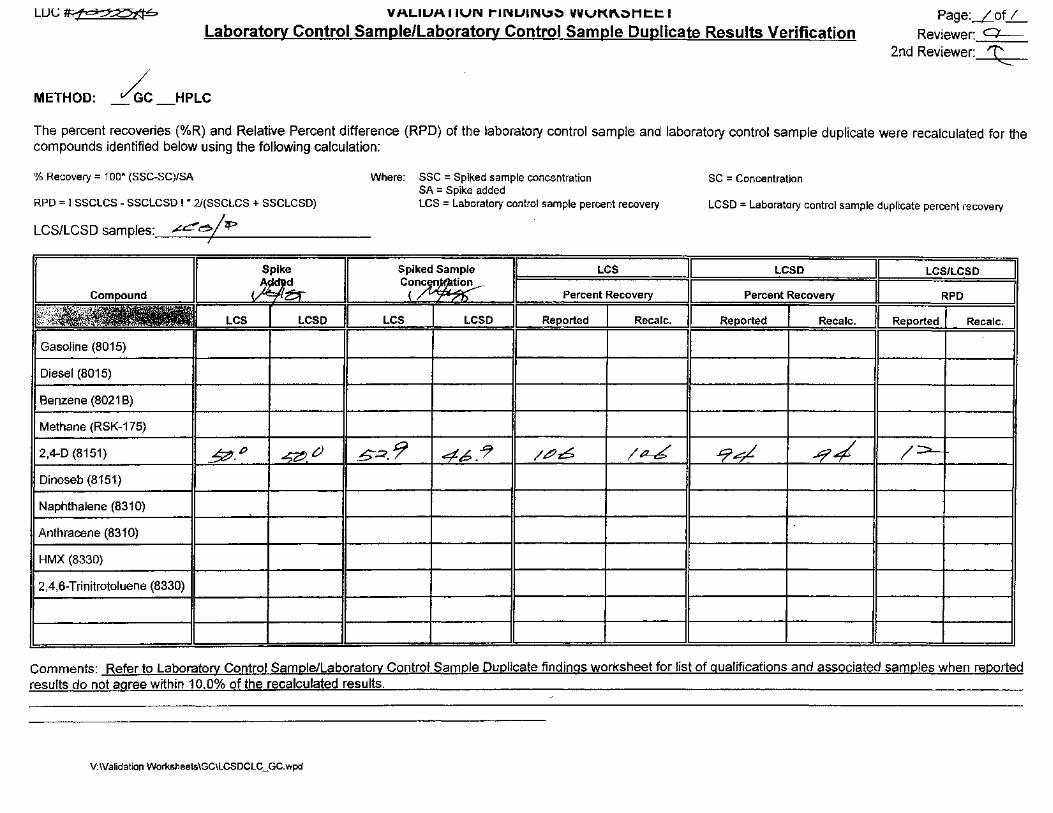
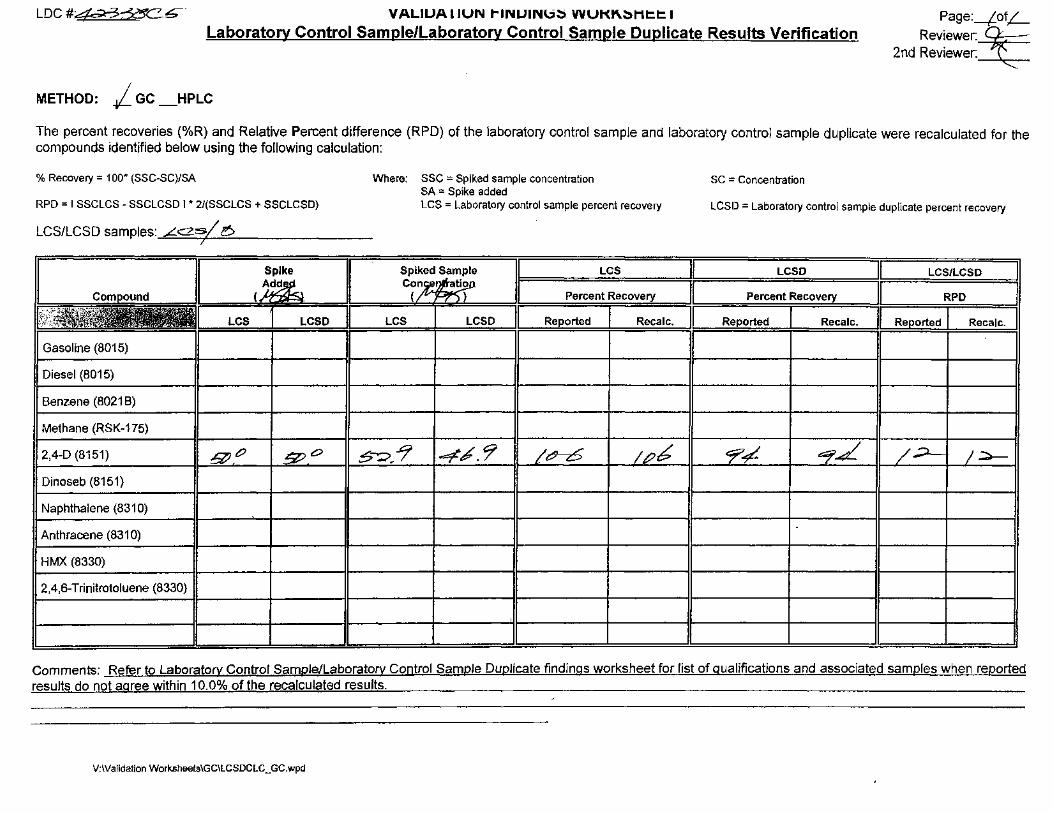
Laboratory Control Sample/Laboratory Control Sample Duplicate Results Verification Page:_Lof..L_
Reviewer: 0---2nd Reviewer: ~
METHOD: ~ _HPLC
The percent recoveries (%R) and Relative Percent difference (RPD) of the laboratory control sample and laboratory control sample duplicate were recalculated for the compounds identified below using the following calculation:
% Recovery = 1 00* (SSC-SC)/SA
RPD = I SSCLCS - SSCLCSD I * 2/(SSCLCS + SSCLCSD)
Where: SSC = Spiked sample concentration SA = Spike added LCS = Laboratory control sample percent recovery
LCS/LCSD samples:_..__/_<:'._6....,7,_/_"Zf> _______ _
SC =Concentration
LCSD = Laboratory control sample duplicate percent recovery
I I Spike Spiked Sample LCS I --LCSD II LCS/LCSD I l>JIIll "'!'!"'~om pound - ' ~~ cf/-~n Percent Recovery I Percent Recovery II RPD II ~~l~~- LCS I LCSD LCS J LCSD I Reported I Recalc. II Reported I Recalc. II Reported I Recalc. I
r
Gasoline (8015)
Diesel (8015)
Benzene (8021 B)
Methane (RSK-175)
2,4-D (8151) ~-0 ~-C) _5-.::?. 9 ~:'7' /~6 /P-6 -9d -~-4 /~
Dinoseb (8151)
Naphthalene (831 0)
Anthracene (831 0)
HMX (8330)
2,4,6-Trinitrotoluene (8330)
Comments: Refer to Laboratory Control Sample/Laboratory Control Sample Duplicate findings worksheet fo~ list of qualifications and associated samples when reported results do not aaree within 10.0% of the recalculated results.
V:\Validation Worksheets\GC\LCSDCLC _ GC. wpd
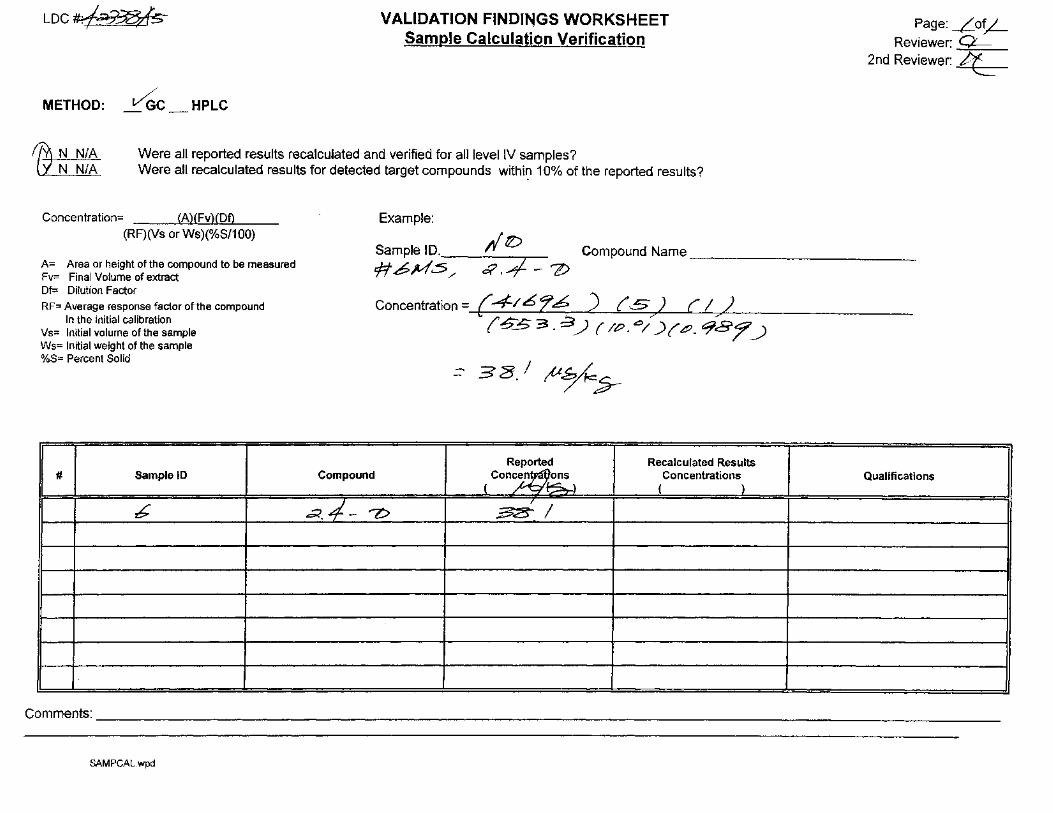
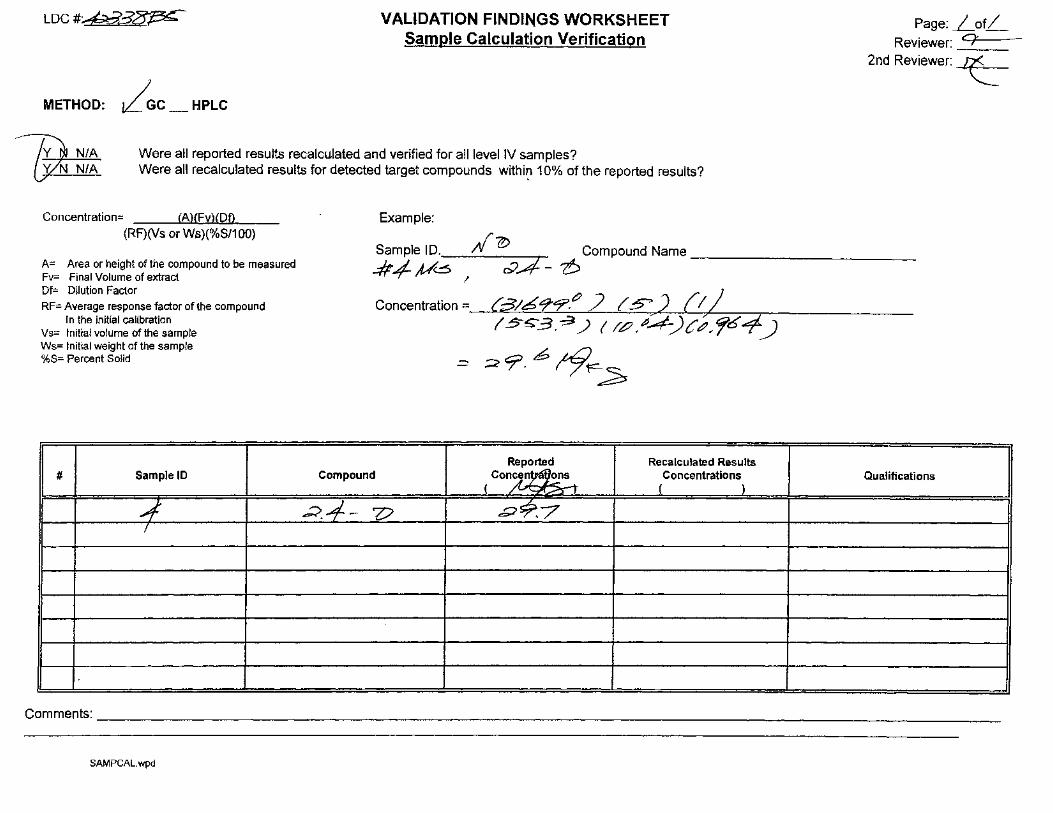
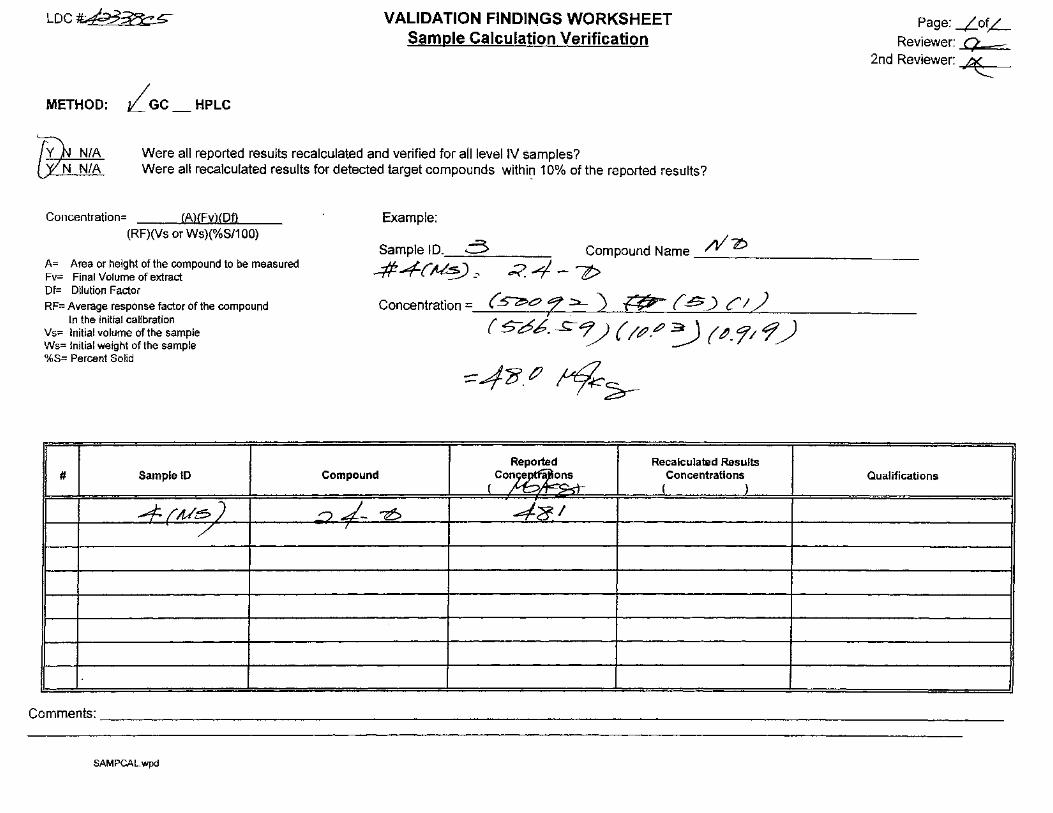
LDC~ VALIDATION FINDINGS WORKSHEET Sample Calculation Verification
METHOD: ve;c HPLC
rfA N N/A
~ Were all reported results recalculated and verified for all level IV samples? Were all recalculated results for detected target compounds withi~ 10% of the reported results?
Concentration= (A)(Fv)(Df) Example: (RF)(Vs or Ws)(%5/100)
Page:_Lo!,L_ Reviewer: 0---
2nd Reviewer: ~
A= Area or height of the compound to be measured Fv= Final Volume of extract
Sample I D. t1 rD #~MS/ &?.;j.- 7)
Compound Name __________________________ _
Of= Dilution Factor
RF= Average response factor of' the compound In the initial calibration
Vs= Initial volume of the sample Ws= Initial weight of the sample %S= Percent Solid
# Sample ID
&
Compound
Concentration = { 4-16 1b ) (57
) { I;>) (~.53. -:3/ (/?>.e./.)('&?. 98-j? __)
3 8. I ft~$--
Reported Recalculated Results Conce~_ons Concentrations
j $.,....) ( /"~~ ( t
e;;<. 4- '7:> ~I
Qualifications
Comments:------------------------------------------------------------------------------------------------------------
SAMPCAL.wpd
LDC Report# 4233885
Laboratory Data Consultants, Inc. Data Validation Report
Project/Site Name: Andersen AFB, CTO JQ13
LDC Report Date: June 18, 2018
Parameters: 2,4-0 & 2,4,5-T
Validation Level: Level C & 0
Laboratory: EMAX Laboratories, Inc.
Sample Delivery Group (SDG): 180202
Laboratory Sample Sample Identification Identification
GQ004 180202-01 GQ005** 180202-02** GQ006 180202-03 GQ006MS 180202-03MS GQ006MSO 180202-03MSO GQ0060UP 180202-030UP GQ006TRP 180202-03TRP
**Indicates sample underwent Level 0 validation
1 V:\LOGIN\AECOM\ANDERSEN\4233885_A34.DOC
Collection Matrix Date
Soil 04/24/18 Soil 04/24/18 Soil 04/24/18 Soil 04/24/18 Soil 04/24/18 Soil 04/24/18 Soil 04/24/18
Introduction
This Data Validation Report (DVR) presents data validation findings and results for the associated samples listed on the cover page. Data validation was performed in accordance with the Final Work Plan for Limited Investigation into Alleged Herbicide Orange Use at Three Sites, Andersen Air Force Base (AFB), Guam (March 2018), the Project Procedures Manual, U.S. Naval Facilities Engineering Command (NAVFAC) Environmental Restoration (ER) Program, NAVFAC Pacific (DON 2015), and the U.S. Department of Defense (DoD) Quality Systems Manual (QSM) for Environmental Laboratories, Version 5.1 (2017). Where specific guidance was not available, the data has been evaluated in a conservative manner consistent with industry standards using professional experience.
The analyses were performed by the following method:
2,4-D and 2,4,5-T by Environmental Protection Agency (EPA) SW 846 Method 8151A
All sample results were subjected to Level C data validation, which comprises an evaluation of quality control (QC) summary results. Samples appended with a double asterisk on the cover page were subjected to Level D data validation, which is comprised of the QC summary forms as well as the raw data, to confirm sample quantitation and identification.
2 V:\LOGIN\AECOM\ANDERSEN\4233885_A34.DOC
The following are definitions of the data qualifiers utilized during data validation:
J (Estimated): The compound or analyte was analyzed for and positively identified by the laboratory; however the reported concentration is estimated due to nonconformances discovered during data validation.
U (Non-detected): The compound or analyte was analyzed for and positively identified by the laboratory; however the compound or analyte should be considered non-detected at the reported concentration due to the presence of contaminants detected in the associated blank(s).
UJ (Non-detected estimated): The compound or analyte was reported as not detected by the laboratory; however the reported quantitation/detection limit is estimated due to non-conformances discovered during data validation.
R (Rejected): The sample results were rejected due to gross non-conformances discovered during data validation. Data qualified as rejected is not usable.
NA (Not Applicable): The non-conformance discovered during data validation demonstrates a high bias, while the affected compound or analyte in the associated sample(s) was reported as not detected by the laboratory and did not warrant the qualification of the data.
A qualification summary table is provided at the end of this report if data has been qualified. Flags are classified as P (protocol) or A (advisory) to indicate whether the flag is due to a laboratory deviation from a specified protocol or is of technical advisory nature.
3 V:\LOGIN\AECOM\AN DERSEN\42338B5_A34. DOC
Qualification Code Reference
H Holding times were exceeded.
S Surrogate recovery was outside QC limits.
C Calibration °/oRSD, r, r2 or 0/oD were noncompliant.
R Calibration RRF was <0.05.
B Presumed contamination from preparation (method blank).
L Laboratory Control Sample/Laboratory Control Sample Duplicate 0/oR or RPD was not within control limits.
Q MS/MSD recovery was poor.
E MS/MSD or Duplicate RPD was high.
Internal standard performance was unsatisfactory.
M Instrument Performance Check (BFB or DFTPP) was noncompliant.
T Presumed contamination from trip blank.
F Presumed contamination from FB or ER.
D The analysis with this flag should not be used because another more technically sound analysis is available.
P Instrument performance for pesticides was poor.
V Unusual problems found with the data not defined elsewhere. Description of the problem can be found in the validation report.
4 V:\LOGIN\AECOM\ANDERSEN\42338B5_A34.DOC
I. Sample Receipt and Technical Holding Times
All samples were received in good condition and cooler temperatures upon receipt met validation criteria.
All technical holding time requirements were met.
II. Initial Calibration and Initial Calibration Verification
Initial calibration was performed as required by the method.
The percent relative standard deviations (o/oRSD) were less than or equal to 20.0o/o for all compounds.
Retention time windows were established as required by the method for samples which underwent Level D validation. Raw data were not reviewed for Level C validation.
The percent differences (o/oD) of the initial calibration verification (ICV) standard were less than or equal to 20.0°/o for all compounds.
Ill. Continuing Calibration
Continuing calibration was performed at the required frequencies.
The percent differences (0/oD) were less than or equal to 20.0°/o for all compounds.
Retention times of all compounds in the calibration standards were within the established retention time windows for samples which underwent Level D validation. Raw data were not reviewed for Level C validation.
IV. Laboratory Blanks
Laboratory blanks were analyzed as required by the method. No contaminants were found in the laboratory blanks.
V. Field Blanks
No field blanks were identified in this SDG.
VI. Surrogates
Surrogates were added to all samples as required by the method. All surrogate recoveries (0/oR) were within QC limits.
VII. Matrix Spike/Matrix Spike Duplicate/Triplicate Sample Analysis
Matrix spike (MS) and matrix spike duplicate (MSD) sample analysis was performed on an associated project sample. Percent recoveries (o/oR) were within QC limits. Relative percent differences (RPD) were within QC limits.
5 V:\LOGIN\AECOM\ANDERSEN\42338B5_A34.DOC
Triplicate (TRP) sample analysis was performed on an associated project sample. Results were within QC limits.
VIII. Laboratory Control Samples
Laboratory control samples (LCS) and laboratory control samples duplicates (LCSD) were analyzed as required by the method. Percent recoveries (0/oR) were within QC limits. Relative percent differences (RPD) were within QC limits.
IX. Field Triplicates
Samples GQ004, GQ005**, and GQ006 were identified as field triplicates. No results were detected in any of the samples.
X. Compound Quantitation
All compound quantitations met validation criteria for samples which underwent Level D validation. Raw data were not reviewed for Level C validation.
XI. Target Compound Identification
All target compound identifications met validation criteria for samples which underwent Level D validation. Raw data were not reviewed for Level C validation.
XII. Overall Assessment of Data
The analysis was conducted within all specifications of the method. No results were rejected in this SDG.
The quality control criteria reviewed were met and are considered acceptable. Based upon the data validation all results are considered valid and usable for all purposes.
6 V:\LOGIN\AECOM\ANDERSEN\42338B5_A34.DOC
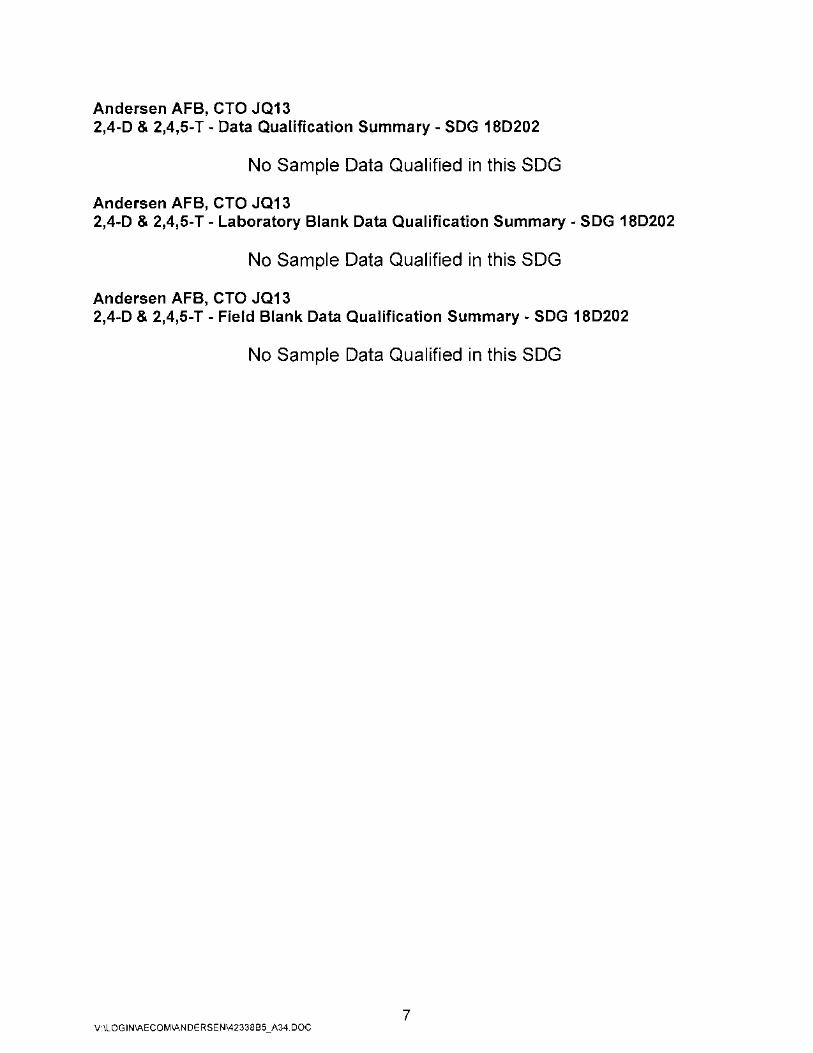
Andersen AFB, CTO JQ13 2,4-D & 2,4,5-T - Data Qualification Summary - SDG 18D202
No Sample Data Qualified in this SDG
Andersen AFB, CTO JQ13 2,4-D & 2,4,5-T- Laboratory Blank Data Qualification Summary- SDG 18D202
No Sample Data Qualified in this SDG
Andersen AFB, CTO JQ13 2,4-D & 2,4,5-T - Field Blank Data Qualification Summary - SDG 18D202
No Sample Data Qualified in this SDG
7 V:\LOG I N\AECOM\AN DE RS EN\42338 B5 _A34. DOC
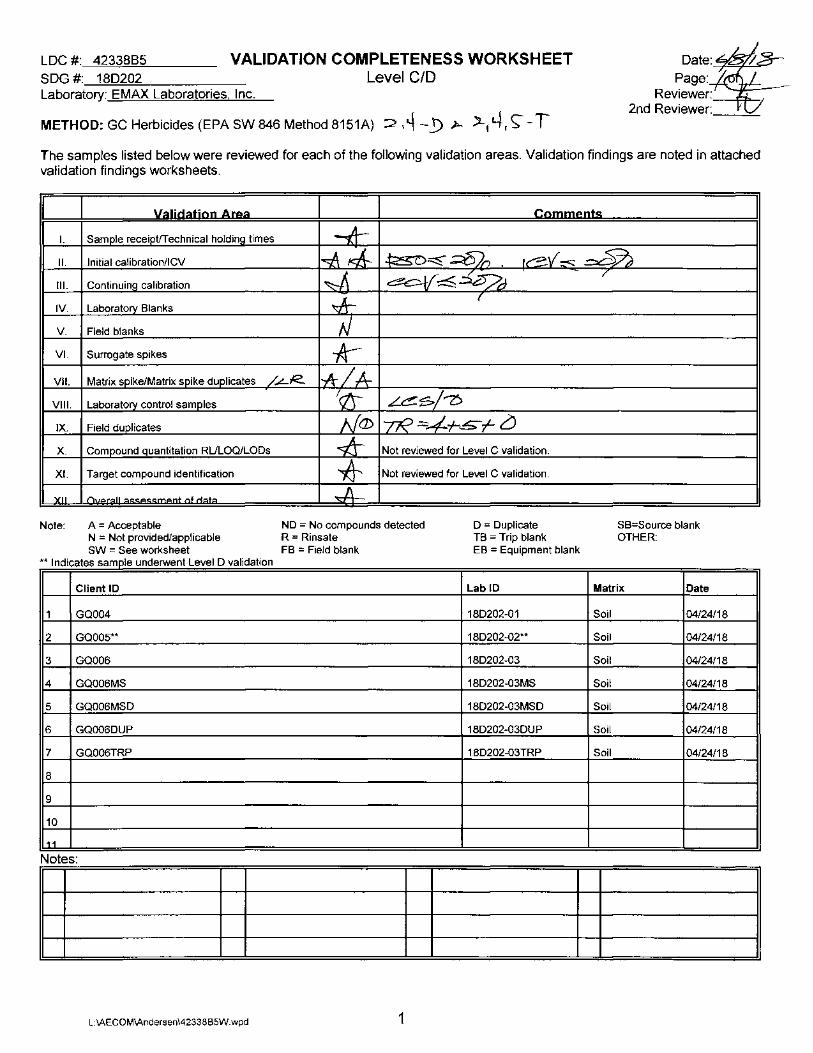
LDC #: 4233885 SDG #: 180202
VALIDATION COMPLETENESS WORKSHEET Level C/O
Laboratory: EMAX Laboratories. Inc.
METHOD: GC Herbicides (EPA SW 846 Method 8151A) :2 .4 ·-_D P- '-rlf, s:--T
Datett-. ~ Page:
Reviewer: 2nd Reviewer: '
The samples listed below were reviewed for each of the following validation areas. Validation findings are noted in attached validation findings worksheets.
Valjdatjon Area Comments
I. Sample receipt/Technical holding times
II. Initial calibration/ICV
Ill. Continuing calibration
IV. Laboratory Blanks
V. Field blanks
VI. Surrogate spikes
VII. Matrix spike/Matrix spike duplicates / ..LR...
VIII.
IX.
X.
XI.
)(II
Note:
Laboratory control samples
Field duplicates
Compound quantitation RULOQ/LODs
Target compound identification
A = Acceptable N = Not provided/applicable SW = See worksheet
"d . **Indicates sample underwent Level D vall at1on
Client ID
1 GQ004
2 GQ005**
3 GQ006
4 GQ006MS
5 GQ006MSD
6 GQ006DUP
7 GQ006TRP
8
9
10
11
Notes:
L:\AECOM\Andersen\4233885W.wpd
~ Not reviewed for Level C validation.
~ Not reviewed for Level C validation.
ND = No compounds detected R = Rinsate FB = Field blank
1
D = Duplicate TB = Trip blank EB = Equipment blank
LabiD
180202-01
180202-02**
180202-03
18D202-03MS
18D202-03MSD
18D202-03DUP
18D202-03TRP
SB=Source blank OTHER:
Matrix Date
Soil 04/24/18
Soil 04/24/18
Soil 04/24/18
Soil 04/24/18
Soil 04/24/18
Soil 04/24/18
Soil 04/24/18
LDC#:~~ VALIDATION FINDINGS CHECKLIST
Method: GC HPLC
Were a matrix spike (MS) and matrix spike duplicate (MSD) analyzed for each matrix in this SDG? If no, indicate which matrix does not have an associated
. Soil/ Water.
of each matrix?
Level IV checklist GC_HPLC rev01.wpd
Page:_Lof:;:::;. Reviewer:~
2nd Reviewer: f{;

LDC #:~i?B:fB~
ment ofdata was found to be
Level IV checklist GC_HPLC rev01.wpd
VALIDATION FINDINGS CHECKLIST Page:~f~ Reviewer:~
2nd Reviewer:~
LDC #: 4233885
METHOD: GC HPLC __ _
VALIDATION FINDINGS WORKSHEET Initial Calibration Calculation Verification
Page:_1_of_1_
Reviewer: PG 2nd Reviewer: ~(
The calibration factors (CF) and relative standard deviation (%RSD) were recalculated using the following calculations:
CF = A/C Average CF = sum of the CF/number of standards %RSD = 1 00 * (S/X)
--
Calibration # Standard ID Date Compound
1 I CAL 2,4-0 (ZB-35H) 4/3/18
(GC09) 2,4-0 (RTX-CLPEST II)
2
3
14 I I I
Where: A = Area of compound
....
CF ( 94 std)
561
539
C = Concentration of compound S = Standard deviation of calibration factors X = Mean of calibration factors
I eecalc111ated I -
I CF
I ( 10 std) Ave CF (initial)
561 566.6
539 553.3
I IEJI Becalc111ated Becalc11lated
%RSD I Ave CF (intial) %RSD
566.6 3.2 3.2
553.3 7.5 7.5
I§§§§§§ Comments: Refer to Initial Calibration findings worksheet for list of qualifications and associated samples when reported results do not agree within 10.0% of the recalculated results.
42338B5_1CAL. wpd
LDC #: 4233885
METHOD:GC
Percent difference (%0) = 100 * (N - C)/N
Calibration # Standard Date/Time
ID
1 QE04002 5/4/18
2 QE04014 5/4/18
I 3 I I I
VALIDATION FINDINGS WORKSHEET Continuing Calibration Results Verification
Where: N = _ Initial Calibration Factor or_ Nominal Amount (ng) C =_Calibration Factor from Continuing Calibration Standard or_ Calculated Amount (ng)
I Reported II Recalculated II Average CF/
I II II Compound CCV Cone
CF/Conc CF/Conc CCV CCV
2,4-D (ZB-35H) 94.0 99.67 99.67
2,4-D (RTX-CLPEST II) 94.0 98.80 98.8
2,4-D (ZB-35H) 94.0 99.43 99.43
2,4-D (RTX-CLPEST II) 94.0 102.75 102.75
II II II II
Reported
%0
6
5
6
9
Page:_1_of_1 _
Reviewer: PG 2nd Reviewer: Z?t
'---
II Recalculated I
II %0
I 6.0
5
5.8
9.3
IL I
Comments: Refer to Continuing Calibration findings worksheet for list of qualifications and associated samples when reported results do not agree within 10.0% of the recalculated results.
V:\Pei\Calibrations\EMAX\4233885_ CCV _pcb.wpd
L.L.I\J ~{........, ~-~-
Surrogate Results Verification
METHOD: ~C _ HPLC
The percent recoveries (%R) of surrogates were recalculated for the compounds identified below using the following calculation:
%Recovery: SF/SS * 100
s leiD Q
II I
I Surrogate
.=>_.J- Z!>C-71 A-//
Sample ID:
Where: SF = Surrogate Found SS = Surrogate Spiked
I Surrogate I Column/Detector Spiked
ct-.·; ~~~.o
,}/~ I
Surrogate I Found
~~..::::.__3'..2
6'?/. -7/~/
Percent I Percent Recovery Recove_ry
Reported Recalculated
6=:>h 6~-:6 69./ ~.~~ /
-
I
rCI81::.~UI~
Reviewer:~ 2nd reviewer:4-
Percent Difference
<C'
0
II I I Surrogate I Surrogate I Percent I Percent I Percent Surrogate Column/Detector Spiked E_ound Recovery Recovery Difference
I I I r I Reported .-1 Recalculated I I
Sam~Jie 10· Surrogate Percent
Surro ate Column/Detector Found Difference
Reported Recalculated
SURRCALCNew.wpd
LUll1f:~:2GJ~ V Jo\LIUJo\ I lVI~ rii~UII~U~ VVVI"\1'\.~nE:E: I
Matrix Spike/Matrix Spike Duplicates Results Verification Page:_{of_L
Reviewer:~Sf':::::/:::.===--2nd Reviewer: k=
METHOD: I GC _HPLC The percent recoveries (%R) and relative percent differences (RPD) of the matrix spike and matrix spike duplicate were recalculated for the compounds identified below using the following calculation: %Recovery = 1 00 * (SSC - SC)/SA Where
RPD =(({SSCMS - SSCMSD} * 2) I (SSCMS + SSCMSD))*1 00
MS/MSD samples: __ 4"'-+-f_:? _________ _
SSC = Spiked sample concentration SA = Spike added MS = Matrix spike
SC = Sample concentration
MSD = Matrix spike duplicate
---- -- I Matrix spike I[ Matrix Spike Duplicate II MS/MSD I I Percent Recovery II Percent Recovery II RPD 1
1
I Reported I Recalc. II Reported I Recalc. II Reported __ l_ Recalc. I
Gasoline (8015)
Diesel (8015)
Benzene (8021 B)
Methane (RSK-175)
2,4-D (8151) liar ld-7 11 /1/"P -~~ 7 I .:27 i' o71 S7 c~ s~ L_Q ctJ Dinoseb (8151)
Naphthalene (8310) -
Anthracene (8310)
HMX (8330)
2,4,6-Trinitrotoluene (8330)
Comments: Refer to Matrix Spike/Matrix Spike Duplicates findings worksheet for list of qualifications and associated samples when reported results do not agree within 1 0. 0% of the recalculated results.
MSDCLCNew.wpd
LDC#~;f3~ VALIUA IIUN t"INUINu~ VVUKr\~MI:.t:. I
Laboratory Control Sample/Laboratory Control Sample Duplicate Results Verification Page:_LofL_
Reviewer: Q__
2nd Reviewer:+-
METHOD: _!_ GC _HPLC
The percent recoveries (%R) and Relative Percent difference (RPD) of the laboratory control sample and laboratory control sample duplicate were recalculated for the compounds identified below using the following calculation:
% Recovery = 1 00* (SSC-SC)/SA
RPD = I SSCLCS - SSCLCSD I * 2/(SSCLCS + SSCLCSD)
Where: SSC = Spiked sample concentration SA = Spike added LCS = Laboratory control sample percent recovery
LCS/LCSD samples: __ .L_e_s~.,_;:_D _______ _ I
SC = Concentration
LCSD =Laboratory control sample duplicate percent recovery
I Spike I Spiked Sample LCS r ~~---- LCSD II LCS/LCSD I A d Concen ration
Compound ( .f7!=+ ~~ Ll- Percent Recovery I Percent Recovery II RPD I I LCS I LCSD II _____ R~2_orted I Recalc. II Reported L_ Recalc. II Reported I __ Recalc. 1
1 LCS I LCSD
Gasoline (8015)
Diesel (8015)
Benzene (8021 B)
Methane (RSK-175)
2,4-D (8151) ~-~ ~-z; ~~9 _#.sr /#-6" /~ ~~ ~ /a- / Dinoseb (8151)
Naphthalene (831 0)
Anthracene (831 0)
HMX (8330)
2,4,6-Trinitrotoluene (8330)
Comments: Refer to Laboratory Control Sample/Laboratory Control Sample Duplicate findings worksheet for list of qualifications and associated samples when reported results do not aoree within 10.0% of the recalculated results. ,
V:\Validation Worksheets\GC\LCSDCLC _ GC. wpd
LDC#~3~
METHOD: ~C_HPLC
VALIDATION FINDINGS WORKSHEET Sample Calculation Verification
Were all reported results recalculated and verified for all level IV samples? Were all recalculated results for detected target compounds withi~ 10% of the reported results?
Concentration= (A)(Fv}(Df) Example:
Page:Lof/ Reviewer: c;._q.;;--
2nd Reviewer: t
(RF)(Vs or Ws)(%8/1 00)
A= Area or height of the compound to be measured Fv= Final Volume of extract
Sample I D. ;(' ~ Compound Name----------.:It 4- ;1,/r.::S 0) C4- - b
Df= Dilution Factor
RF= Average response factor of the compound In the initial calibration
Vs= Initial volume of the sample Ws= Initial weight of the sample %8= Percent Solid
# Sample ID
~ I
Compound
I
Concentration= (:::3/699.t:J / { ~) {I) (5~3.--:3 _; ( /t?J.~~)c; __ f6f _J
- :=29.6~~~
Reported Recalculated Results Conc;7~ns Concentrations
( /._..~.....-"'S' I ( 1
P+- v £)~/
Qualifications
Comments:------------------------------------------------------------------------------------------------------------
SAMPCAL.wpd
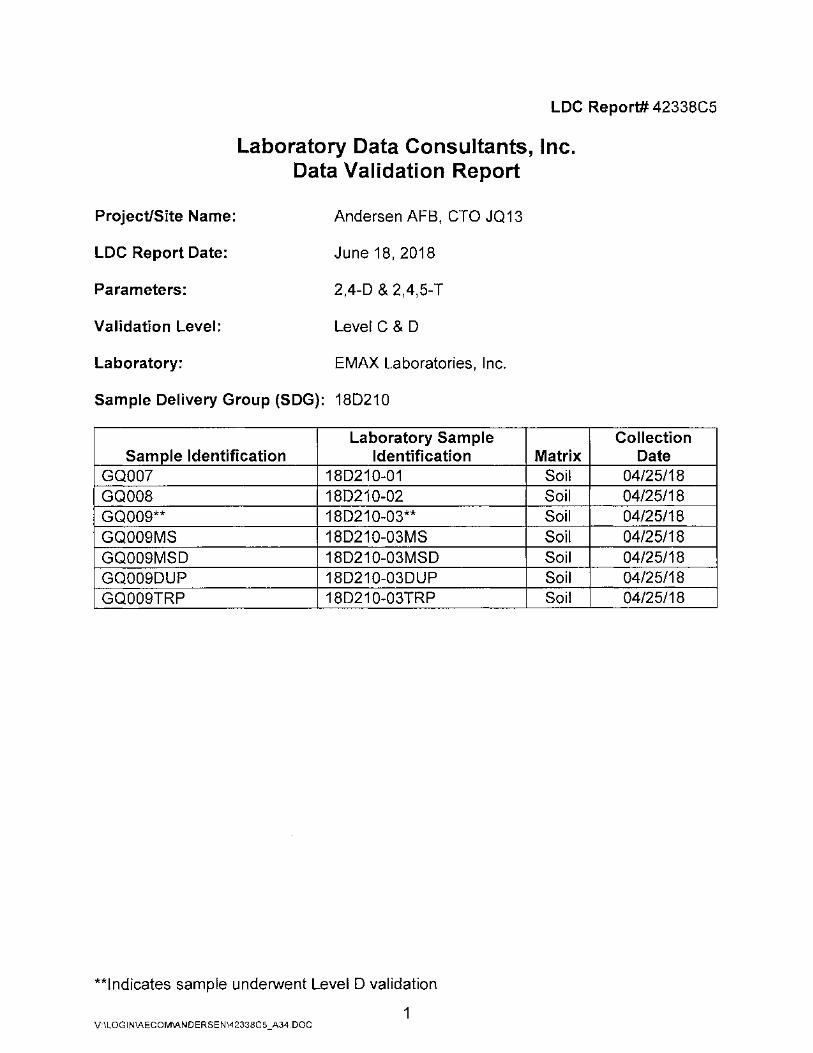
LDC Report# 42338C5
Laboratory Data Consultants, Inc. Data Validation Report
Project/Site Name: Andersen AFB, CTO JQ13
LDC Report Date: June 18, 2018
Parameters: 2,4-0 & 2,4,5-T
Validation Level: Level C & 0
Laboratory: EMAX Laboratories, Inc.
Sample Delivery Group (SDG): 180210
Laboratory Sample Sample Identification Identification
GQ007 180210-01 GQ008 180210-02 GQ009** 18021 0-03** GQ009MS 18021 0-03MS GQ009MSO 18021 0-03MSO GQ0090UP 180210-030UP GQ009TRP 180210-03TRP
**Indicates sample underwent Level 0 validation
1 V:\LOG I N\AECOM\AN D ERSEN\42338C5 _A34. DOC
Collection Matrix Date
Soil 04/25/18 Soil 04/25/18 Soil 04/25/18 Soil 04/25/18 Soil 04/25/18 Soil 04/25/18 Soil 04/25/18

Introduction
This Data Validation Report (DVR) presents data validation findings and results for the associated samples listed on the cover page. Data validation was performed in accordance with the Final Work Plan for Limited Investigation into Alleged Herbicide Orange Use at Three Sites, Andersen Air Force Base (AFB), Guam (March 2018), the Project Procedures Manual, U.S. Naval Facilities Engineering Command (NAVFAC) Environmental Restoration (ER) Program, NAVFAC Pacific (DON 2015), and the U.S. Department of Defense (DoD) Quality Systems Manual (QSM) for Environmental Laboratories, Version 5.1 (2017). Where specific guidance was not available, the data has been evaluated in a conservative manner consistent with industry standards using professional experience.
The analyses were performed by the following method:
2,4-D and 2,4,5-T by Environmental Protection Agency (EPA) SW 846 Method 8151A
All sample results were subjected to Standard data validation, which comprises an evaluation of quality control (QC) summary results. Samples appended with a double asterisk on the cover page were subjected to Full data validation, which is comprised of the QC summary forms as well as the raw data, to confirm sample quantitation and identification.
2 V:\LOGIN\AECOM\ANDERSEN\42338C5_A34.DOC
The following are definitions of the data qualifiers utilized during data validation:
J (Estimated): The compound or analyte was analyzed for and positively identified by the laboratory; however the reported concentration is estimated due to nonconformances discovered during data validation.
U (Non-detected): The compound or analyte was analyzed for and positively identified by the laboratory; however the compound or analyte should be considered non-detected at the reported concentration due to the presence of contaminants detected in the associated blank(s).
UJ (Non-detected estimated): The compound or analyte was reported as not detected by the laboratory; however the reported quantitation/detection limit is estimated due to non-conformances discovered during data validation.
R (Rejected): The sample results were rejected due to gross non-conformances discovered during data validation. Data qualified as rejected is not usable.
NA (Not Applicable): The non-conformance discovered during data validation demonstrates a high bias, while the affected compound or analyte in the associated sample(s) was reported as not detected by the laboratory and did not warrant the qualification of the data.
A qualification summary table is provided at the end of this report if data has been qualified. Flags are classified as P (protocol) or A (advisory) to indicate whether the flag is due to a laboratory deviation from a specified protocol or is of technical advisory nature.
3 V:\LOGIN\AECOM\ANDERSEN\42338C5_A34.DOC

Qualification Code Reference
H Holding times were exceeded.
S Surrogate recovery was outside QC limits.
C Calibration °/oRSD, r, ~ or o/oD were noncompliant.
R Calibration RRF was <0.05.
B Presumed contamination from preparation (method blank).
L Laboratory Control Sample/Laboratory Control Sample Duplicate o/oR or RPD was not within control limits.
Q MS/MSD recovery was poor.
E MS/MSD or Duplicate RPD was high.
Internal standard performance was unsatisfactory.
M Instrument Performance Check (BFB or DFTPP) was noncompliant.
T Presumed contamination from trip blank.
F Presumed contamination from FB or ER.
D The analysis with this flag should not be used because another more technically sound analysis is available.
P Instrument performance for pesticides was poor.
V Unusual problems found with the data not defined elsewhere. Description of the problem can be found in the validation report.
4 V:\LOG I N\AECOM\AN DERSE N\42338C5 _A34. DOC
I. Sample Receipt and Technical Holding Times
All samples were received in good condition and cooler temperatures upon receipt met validation criteria.
All technical holding time requirements were met.
II. Initial Calibration and Initial Calibration Verification
Initial calibration was performed as required by the method.
The percent relative standard deviations (%RSD) were less than or equal to 20.0% for all compounds.
Retention time windows were established as required by the method for samples which underwent Level D validation. Raw data were not reviewed for Level C validation.
The percent differences (o/oD) of the initial calibration verification (ICV) standard were less than or equal to 20.0°/o for all compounds.
Ill. Continuing Calibration
Continuing calibration was performed at the required frequencies.
The percent differences (0/oD) were less than or equal to 20.0°/o for all compounds.
Retention times of all compounds in the calibration standards were within the established retention time windows for samples which underwent Level D validation. Raw data were not reviewed for Level C validation.
IV. Laboratory Blanks
Laboratory blanks were analyzed as required by the method. No contaminants were found in the laboratory blanks.
V. Field Blanks
No field blanks were identified in this SDG.
VI. Surrogates
Surrogates were added to all samples as required by the method. All surrogate recoveries (o/oR) were within QC limits.
VII. Matrix Spike/Matrix Spike Duplicate/Triplicate Sample Analysis
Matrix spike (MS) and matrix spike duplicate (MSD) sample analysis was performed on an associated project sample. Percent recoveries (o/oR) were within QC limits. Relative percent differences (RPD) were within QC limits.
5 V:\LOGIN\AECOM\ANDERSEN\42338C5_A34.DOC

Triplicate (TRP) sample analysis was performed on an associated project sample. Results were within QC limits.
VIII. Laboratory Control Samples
Laboratory control samples (LCS) and laboratory control samples duplicates (LCSD) were analyzed as required by the method. Percent recoveries (%R) were within QC limits. Relative percent differences (RPD) were within QC limits.
IX. Field Triplicates
Samples GQ007, GQ008, and GQ009** were identified as field triplicates. No results were detected in any of the samples.
X. Compound Quantitation
All compound quantitations met validation criteria for samples which underwent Level D validation. Raw data were not reviewed for Level C validation.
XI. Target Compound Identification
All target compound identifications met validation criteria for samples which underwent Level D validation. Raw data were not reviewed for Level C validation.
XII. Overall Assessment of Data
The analysis was conducted within all specifications of the method. No results were rejected in this SDG.
The quality control criteria reviewed were met and are considered acceptable. Based upon the data validation all results are considered valid and usable for all purposes.
6 V:\LOG I N\AECOM\AN DERSEN\42338C5 _A34. DOC
Andersen AFB, CTO JQ13 2,4-D & 2,4,5-T - Data Qualification Summary - SDG 18D21 0
No Sample Data Qualified in this SDG
Andersen AFB, CTO JQ13 2,4-D & 2,4,5-T- Laboratory Blank Data Qualification Summary- SDG 18D210
No Sample Data Qualified in this SDG
Andersen AFB, CTO JQ13 2,4-D & 2,4,5-T - Field Blank Data Qualification Summary - SDG 18D21 0
No Sample Data Qualified in this SDG
7 V:\LOGIN\AECOM\ANDERSEN\42338C5_A34.DOC
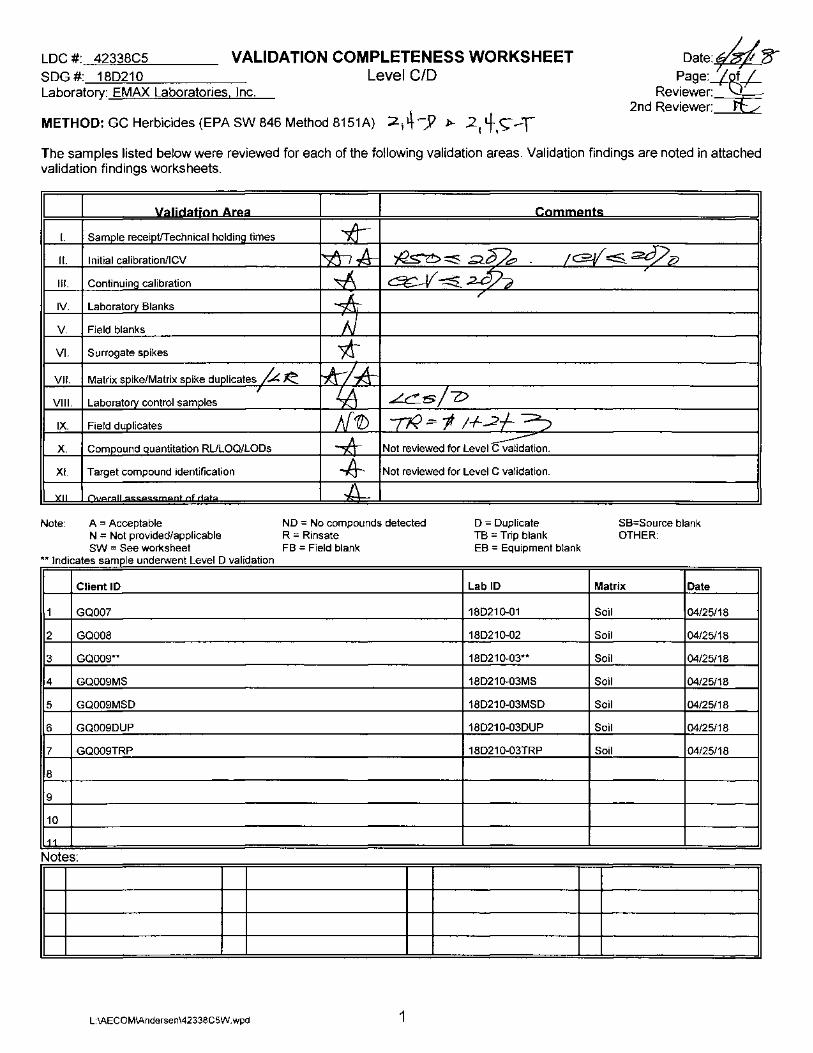
LDC #: 42338C5 SDG #: 180210
VALIDATION COMPLETENESS WORKSHEET Level C/O
Laboratory: EMAX Laboratories. Inc.
METHOD: GC Herbicides (EPA SW 846 Method 8151A) :Zi ~ ·-y ~· 21 fs; -T
Date:~ Page:--tof+
Reviewer:-rcz=_ 2nd Reviewer:=t(L
The samples listed below were reviewed for each of the following validation areas. Validation findings are noted in attached validation findings worksheets.
I I :\lalidatioo A[ea I I Comments
I. Sample receipt/Technical holding times ~ II. Initial calibration/ICV ~A- ~~~~ !G2-ll =:$_ ~ 0
~ ~~:uP~ r
Ill. Continuing calibration
-A /
IV. Laboratory Blanks
V. Field blanks N VI. Surrogate spikes ;&-VII. Matrix spike/Matrix spike duplicates /~ '!!!::.. kl~ , VIII. Laboratory control samples
IX. Field duplicates
X. Compound quantitation RULOQ/LODs
XI. Target compound identification
XII ()vor<:>ll nfrbt<:>
Note: A = Acceptable N = Not provided/applicable SW = See worksheet
d L I D l"d f ** Indicates sample un erwent eve va1 a1on
Client ID
1 GQ007
2 GQ008
3 GQ009**
4 GQ009MS
5 GQ009MSD
6 GQ009DUP
7 GQ009TRP
8
9
10
11
Notes:
L:\AECOM\Andersen\42338C5W. wpd
~ LC-s/-z> /\(1/) -r~ ~ 1 !+-2-f ~ ~ Not reviewed for Level~on. ~ Not reviewed for Level C validation.
A-ND = No compounds detected R = Rinsate
D = Duplicate TB = Trip blank
FB = Field blank EB = Equipment blank
LabiD
180210-01
180210-02
18021 0-03**
18021 0-03MS
18021 0-03MSD
18021 0-03DUP
18021 0-03TRP
1
SB=Source blank OTHER:
Matrix Date
Soil 04/25/18
Soil 04/25/18
Soil 04/25/18
Soil 04/25/18
Soil 04/25/18
Soil 04/25/18
Soil 04/25/18
I
VALIDATION FINDINGS CHECKLIST
Method: ~c HPLC
Did the
Were all
Were a matrix spike (MS) and matrix spike duplicate (MSD) analyzed for each matrix in this SDG? If no, indicate which matrix does not have an associated
D. Soil/ Water.
of each matrix?
Level IV checklist GC_HPLC rev01.wpd
Page: _,Lot ...2-. Reviewer:~
2nd Reviewer: ~
LDC#:~3;5~
ment of.data was found to be
Level IV checklist GC_HPLC rev01.wpd
VALIDATION FINDINGS CHECKLIST Page:~ Reviewer:~
2nd Reviewer: -ft.....!_;..-/-
LDC #: 42338C5
METHOD:GC HPLC ---
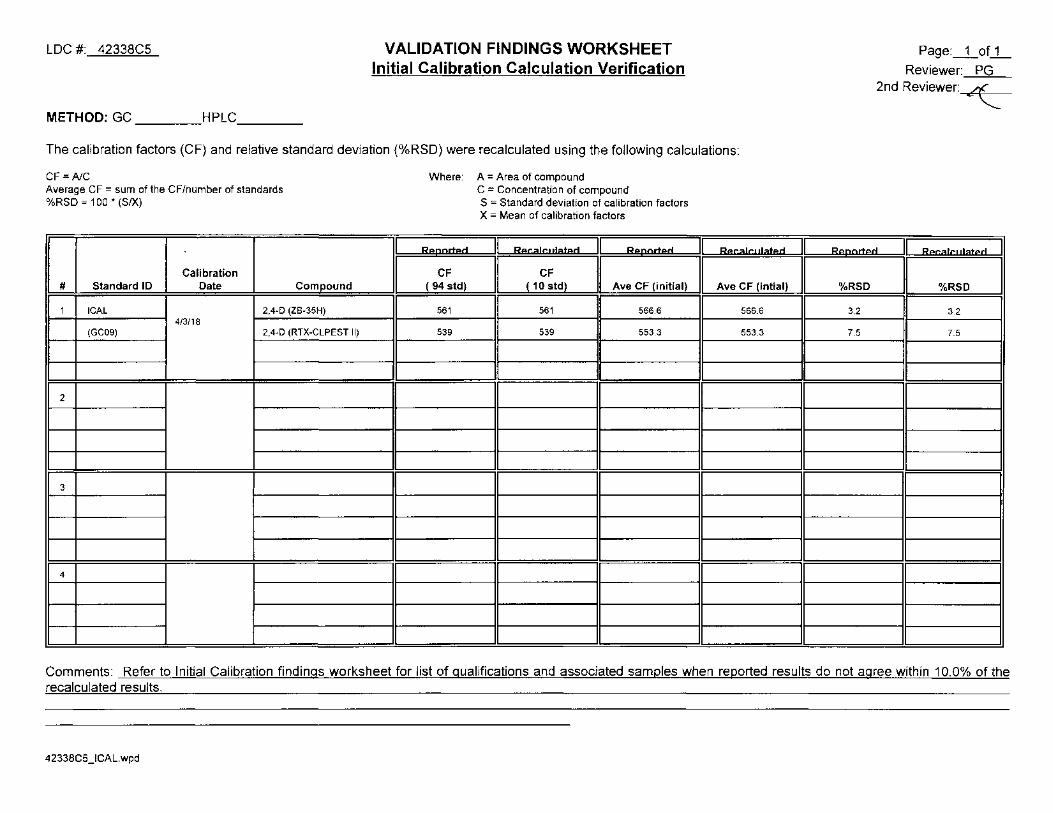
VALIDATION FINDINGS WORKSHEET Initial Calibration Calculation Verification
The calibration factors (CF) and relative standard deviation (%RSD) were recalculated using the following calculations:
CF = AJC Average CF = sum of the CF/number of standards %RSD = 1 00 * (S/X)
Calibration # Standard ID Date Compound
1 I CAL 2,4-D (ZB-35H) 4/3/18
(GC09) 2,4-D (RTX-CLPEST II)
2
3
I 4 I I I II
Where: A = Area of compound
.... -'
CF ( 94 std)
561
539
C = Concentration of compound S = Standard deviation of calibration factors X = Mean of calibration factors
I Becalc11lated I ....
I CF
I ( 10 std} Ave CF (initial)
561 566.6
539 553.3
II II
I Becalc11lated
Ave CF (intial)
566.6
553.3
II
Page:_1_of_1_
Reviewer: PG
2nd Reviewer: ~-
1~1 Becalc11lated I
%RSD I I %RSD
3.2 3.2
7.5 7.5
II II ]
Comments: Refer to Initial Calibration findings worksheet for list of qualifications and associated samples when reported results do not agree within 10.0% of the recalculated results.
42338C5_1CAL.wpd
LDC #: 42338C5
METHOD:GC
Percent difference (%D) = 100 * (N - C)/N
Calibration # Standard Date/Time
ID
1 QE04002 5/4/18
2 QE04014 5/4/18
l_lL_ I I
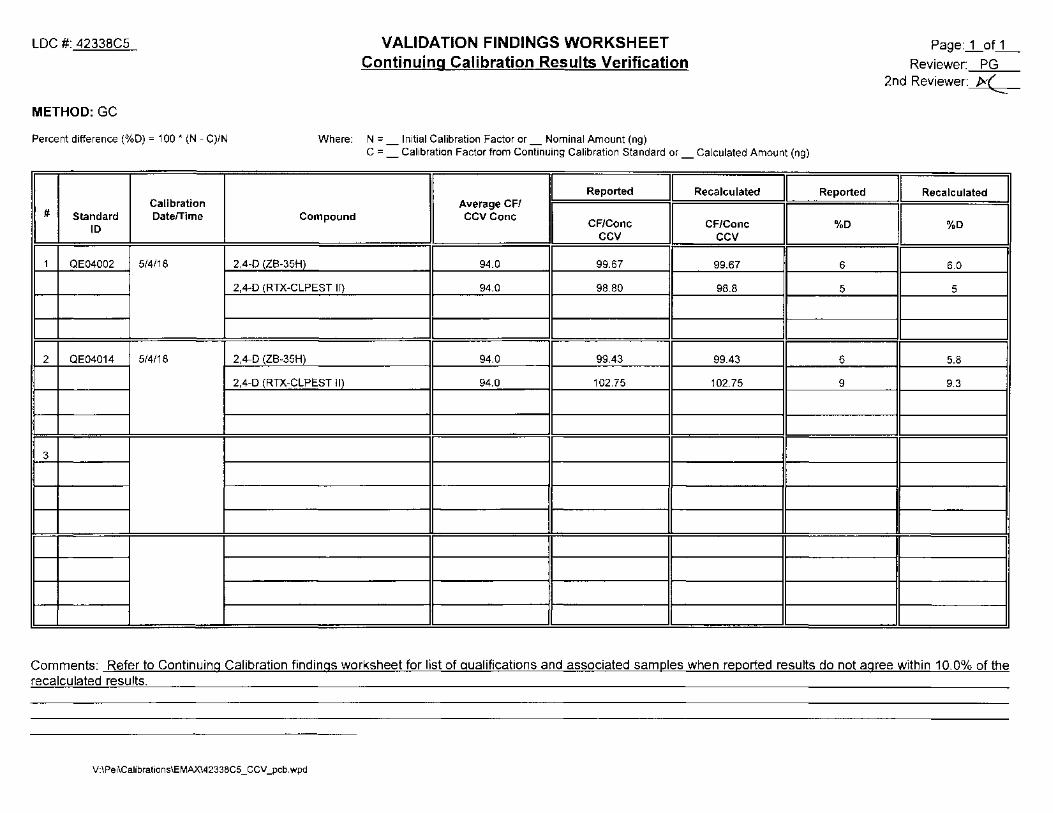
VALIDATION FINDINGS WORKSHEET Continuing Calibration Results Verification
Where: N = _ Initial Calibration Factor or_ Nominal Amount (ng) C =_Calibration Factor from Continuing Calibration Standard or_ Calculated Amount (ng)
I Reported II Recalculated II Average CF/
I II II Compound CCV Cone
CF/Conc CF/Conc CCV CCV
2,4-D (ZB-35H) 94.0 99.67 99.67
2,4-D (RTX-CLPEST II) 94.0 98.80 98.8
2,4-D (ZB-35H) 94.0 99.43 99.43
2,4-D (RTX-CLPEST II) 94.0 102.75 102.75
II II II ~L
Reported
%0
6
5
6
9
Page:_1_of_1 _
Reviewer: PG 2nd Reviewer: JxC.
II Recalculated
II %0
6.0
5
5.8
9.3
II I
Comments: Refer to Continuing Calibration findings worksheet for list of qualifications and associated samples when reported results do not agree within 10.0% of the recalculated results.
V:\Pei\Calibrations\EMAX\42338C5 _CCV _pcb. wpd
._....,. '-' ''. I c:.?"........- ,e''I I :=:>
Surrogate Results Verification
METHOD: be_ HPLC
The percent recoveries (%R) of surrogates were recalculated for the compounds identified below using the following calculation:
%Recovery: SF/SS * 100
SampleiD· .3
II Surrogate I I I 1.;?.-4-:cA-1-
I
SampleiD:
II Surrogate
Where: SF = Surrogate Found SS = Surrogate Spiked
Column/Detector I I
·eh- I
I 1/.;;2..
Column/Detector
Surrogate I Spiked
I ,L~-~ I
Surrogate Sl!_iked
Surrogate I Found
I L~;<Z
78'3.
Surrogate Found
Percent I Recovery
Reported I 7?.~1 7'?:.
Percent Recove_IY_
Percent Recovery
Recalculated
79~ 7~2?
Percent Recovery
I I
I
I CI~C.___£_VI~
Reviewer:.....:Q~===-2nd reviewer:, ..... ff-~-
~-
Percent Difference
Percent Difference
I
I
I I c--- I I Reported ---- -, Recalculated I I
Sample ID·
Surrogate Percent Surro ate Column/Detector Found Difference
Reeorted Recalculated
SURRCALCNew.wpd
LDC #~;3('!!C~ VALIUA IIUN t-INUINu::S VVUKI\.::SHt:.t:. I
Laboratory Control Sample/Laboratory Control Sample Duplicate Results Verification Page:_jof,L_
Reviewer:~ 2nd Reviewer:~
METHOD: j_ GC _HPLC
The percent recoveries (%R) and Relative Percent difference (RPD) of the laboratory control sample and laboratory control sample duplicate were recalculated for the compounds identified below using the following calculation:
% Recovery = 1 00* (SSC-SC)/SA Where: SSG= Spiked sample concentration SA = Spike added LCS = Laboratory control sample percent recovery RPD = I SSCLCS - SSCLCSD I * 2/(SSCLCS + SSCLCSD)
LCS/LCSD samples: ~c:z:s/6 ~~-+~~~---------------
SC = Concentration
LCSD =Laboratory control sample duplicate percent recovery
'~ ..;ompo~nd . ,I I Percent Recovery II Percent Recovery II RPD 11 ~~. LCS LCS I Reported I Recalc. II Reported I Recalc. II Reported I Recalc. I
LCS I LCSD II LCS/LCSD I
Gasoline (8015)
Diesel (8015)
Benzene (80218)
Methane (RSK-175)
2,4-D (8151) ~p g;o ~-::> .. -1___14~- ~ j4-L1-L' ;p6 __ r~ ~d /..;;L-f I .J-
Dinoseb (8151}
Naphthalene (831 0)
Anthracene (831 0)
HMX (8330)
2,4,6-Trinitrotoluene (8330}
Comments: Refer to Laboratory Control Sample/Laboratory Control Sample Duplicate findings worksheet for list of qualifications and associated samples when reported results do not aaree within 10.0% of the recalculated results. ,
V:\Validation Worksheets\GC\LCSDCLC _ GC. wpd
LOG #:if:-~;:1?5~
METHOD: ~C _HPLC
VALIUA IIUN r-II~UINU~ VVU~"~nt:t: I
Matrix Spike/Matrix Spike Duplicates Results Verification t-'age:~oJL_
Reviewer: '-9--2nd Reviewer: L(_
The percent recoveries (%R) and relative percent differences (RPD) of the matrix spike and matrix spike duplicate were recalculated for the compounds identified below using the following calculation: %Recovery = 1 00 * (SSC - SC)/SA Where
RPD =(({SSCMS - SSCMSD} * 2) I (SSCMS + SSCMSD))*1 00
MS/MSD samples: __ 4.!.4-/.....;;,s;,__ ________ _ 7
sse = Spiked sample concentration SA = Spike added MS = Matrix spike
SC = Sample concentration
MSD = Matrix spike duplicate
------- --ll Spike ~~ample ~~-- Matrix spike II Matrix Spike Duplicate ~~~ MS/MSD I Compound ( 9"'-:i C 4 I Percent Recovery II Percent Recovery II RPD ,,
I MS I MSD I --- MS MSD !_Reported I Recalc. II Reported I Recalc. II Reported I Recalc. I Gasoline (8015)
Diesel (8015)
Benzene (80218)
Methane (RSK-175)
2,4-D (8151) 11¥~41-?f? _db_ ~I ~z:t) a& zyg 7ttf7 7_?/ .:2._3 ~
Dinoseb (8151)
Naphthalene (8310) -
Anthracene (8310)
HMX (8330)
2,4,6-Trinitrotoluene (8330)
Comments: Refer to Matrix Spike/Matrix Spike Duplicates findings worksheet for list of qualifications and associated samples when reported results do not agree within 10.0% of the recalculated results. ~
MSDCLCNew.wpd
LDC~.r;;- VALIDATION FINDINGS WORKSHEET Sample Calculation Verification
METHOD: LGc_HPLC
(:;\ N/A
~ Were all reported results recalculated and verified for all level IV samples? Were all recalculated results for detected target compounds withi~ 10% of the reported results?
Concentration= (A)(Fv)(Of) Example:
Page:-.L,o~
Reviewer: q -2nd Reviewer: LX ..,.,"+"'-.,__
(RF)(Vs or Ws)(o/oS/100)
A= Area or height of the compound to be measured Fv= Final Volume of extract
Sample 10. .::3 Compound Name_#_?:> ________ _
-#4-(~_ .. ~4-7> Of= Dilution Factor
RF= Average response factor of the compound In the initial calibration
Vs= Initial volume of the sample Ws= Initial weight of the sample %S= Percent Solid
# SampleiD
~('!U&>) /
Comments:
Compound
.0 .d-f
Concentration = ( 57!>t::? 1' ~ ) ~ ( b __) C I/ r ~Pb. s:-~ ( /V'.~ :J r IJ. 7/ 4f __)
-:=: 4-ZJ. tl !-fk '2r-
Reported Recalculated Results Con7~ons Concentrations Qualifications
( /-0/~~t- ( )
76 4-Cf.l
-------------------------------------------------------------------------
SAMPCAL. wpd
LDC Report# 4233805
Laboratory Data Consultants, Inc. Data Validation Report
Project/Site Name: Andersen AFB, CTO JQ13
LDC Report Date: June 18, 2018
Parameters: 2,4-D & 2,4,5-T
Validation Level: Level C & D
Laboratory: TestAmerica, Inc.
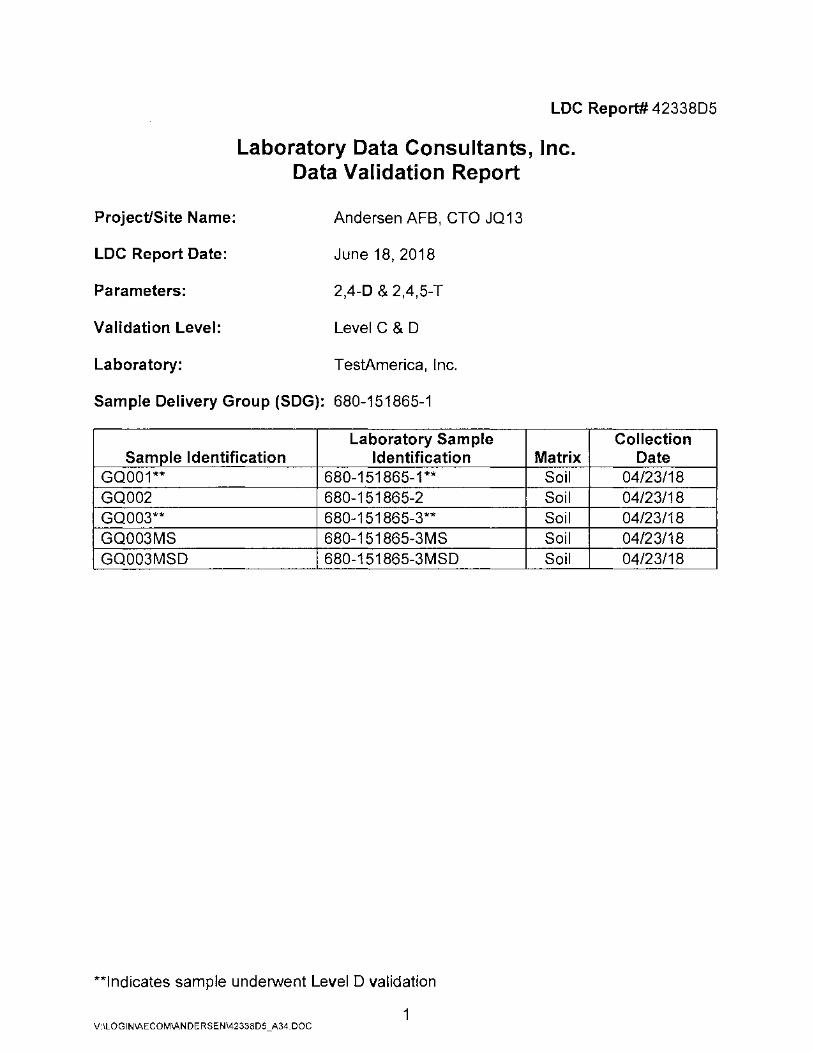
Sample Delivery Group (SDG): 680-151865-1
Laboratory Sample Collection Sample Identification Identification Matrix Date
GQ001** 680-151865-1 ** Soil 04/23/18 GQ002 680-151865-2 Soil 04/23/18 GQ003** 680-151865-3** Soil 04/23/18 GQ003MS 680-151865-3MS Soil 04/23/18 GQ003MSD 680-151865-3MSD Soil 04/23/18
**Indicates sample underwent Level D validation
1 V:\LOGIN\AECOM\ANDERSEN\42338D5_A34.DOC
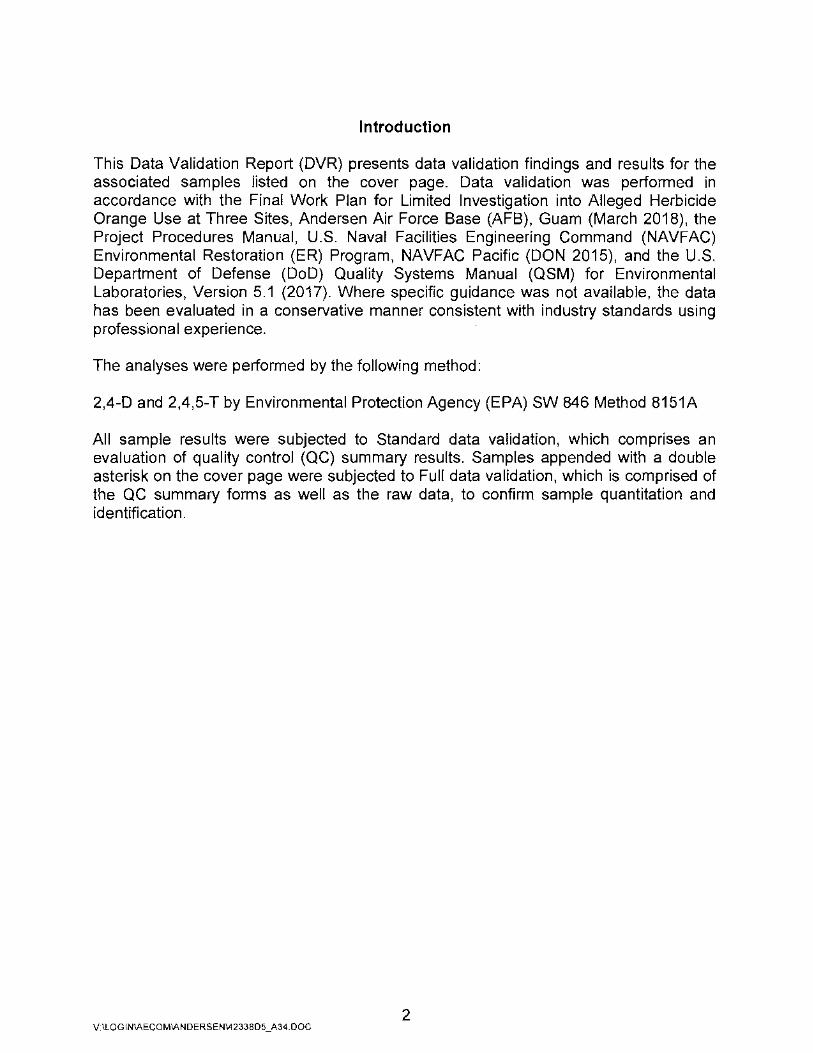
Introduction
This Data Validation Report (DVR) presents data validation findings and results for the associated samples listed on the cover page. Data validation was performed in accordance with the Final Work Plan for Limited Investigation into Alleged Herbicide Orange Use at Three Sites, Andersen Air Force Base (AFB), Guam (March 2018), the Project Procedures Manual, U.S. Naval Facilities Engineering Command (NAVFAC) Environmental Restoration (ER) Program, NAVFAC Pacific (DON 2015), and the U.S. Department of Defense (DoD) Quality Systems Manual (QSM) for Environmental Laboratories, Version 5.1 (2017). Where specific guidance was not available, the data has been evaluated in a conservative manner consistent with industry standards using professional experience.
The analyses were performed by the following method:
2,4-D and 2,4,5-T by Environmental Protection Agency (EPA) SW 846 Method 8151A
All sample results were subjected to Standard data validation, which comprises an evaluation of quality control (QC) summary results. Samples appended with a double asterisk on the cover page were subjected to Full data validation, which is comprised of the QC summary forms as well as the raw data, to confirm sample quantitation and identification.
2 V:\LOGIN\AECOM\ANDERSEN\4233805_A34.DOC
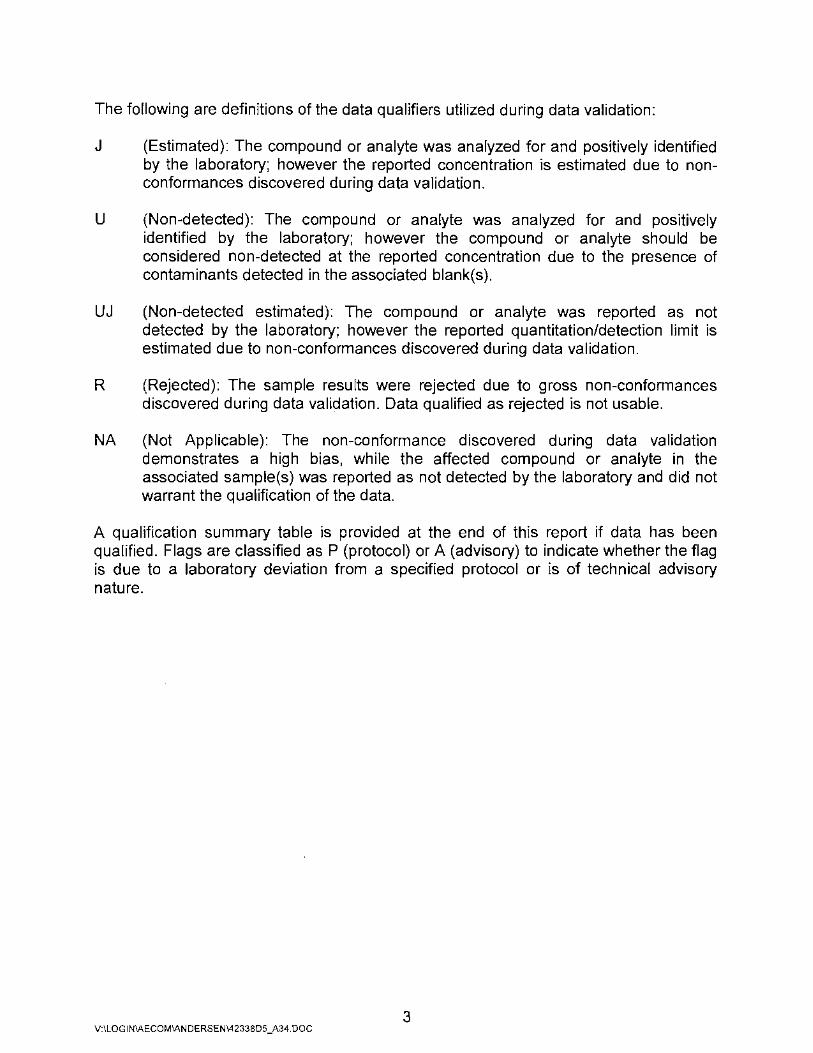
The following are definitions of the data qualifiers utilized during data validation:
J (Estimated): The compound or analyte was analyzed for and positively identified by the laboratory; however the reported concentration is estimated due to nonconformances discovered during data validation.
U (Non-detected): The compound or analyte was analyzed for and positively identified by the laboratory; however the compound or analyte should be considered non-detected at the reported concentration due to the presence of contaminants detected in the associated blank(s).
UJ (Non-detected estimated): The compound or analyte was reported as not detected by the laboratory; however the reported quantitation/detection limit is estimated due to non-conformances discovered during data validation.
R (Rejected): The sample results were rejected due to gross non-conformances discovered during data validation. Data qualified as rejected is not usable.
NA (Not Applicable): The non-conformance discovered during data validation demonstrates a high bias, while the affected compound or analyte in the associated sample(s) was reported as not detected by the laboratory and did not warrant the qualification of the data.
A qualification summary table is provided at the end of this report if data has been qualified. Flags are classified as P (protocol) or A (advisory) to indicate whether the flag is due to a laboratory deviation from a specified protocol or is of technical advisory nature.
3 V:\LOGIN\AECOM\ANDERSEN\42338D5_A34.DOC
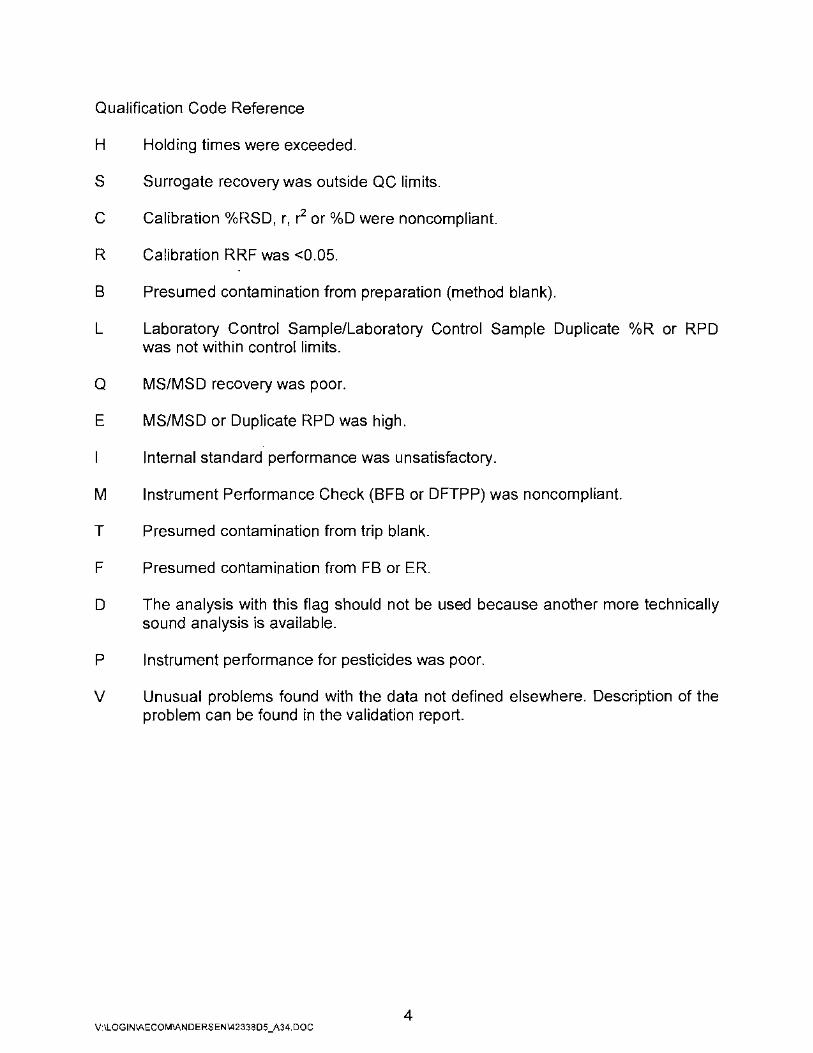
Qualification Code Reference
H Holding times were exceeded.
S Surrogate recovery was outside QC limits.
C Calibration o/oRSD, r, r2 or 0/oD were noncompliant.
R Calibration RRF was <0.05.
8 Presumed contamination from preparation (method blank).
L Laboratory Control Sample/Laboratory Control Sample Duplicate 0/oR or RPD was not within control limits.
Q MS/MSD recovery was poor.
E MS/MSD or Duplicate RPD was high.
Internal standard performance was unsatisfactory.
M Instrument Performance Check (BFB or DFTPP) was noncompliant.
T Presumed contamination from trip blank.
F Presumed contamination from FB or ER.
D The analysis with this flag should not be used because another more technically sound analysis is available.
P Instrument performance for pesticides was poor.
V Unusual problems found with the data not defined elsewhere. Description of the problem can be found in the validation report.
4 V:\LOGIN\AECOM\ANDERSEN\42338D5_A34.DOC
I. Sample Receipt and Technical Holding Times
All samples were received in good condition and cooler temperatures upon receipt met validation criteria.
All technical holding time requirements were met.
II. Initial Calibration and Initial Calibration Verification
Initial calibration was performed as required by the method.
The percent relative standard deviations (o/oRSD) were less than or equal to 20.0%, for all compounds.
Retention time windows were established as required by the method for samples which underwent Level D validation. Raw data were not reviewed for Level C validation.
The percent differences (0/oD) of the initial calibration verification (ICV) standard were less than or equal to 20.0°/o for all compounds.
Ill. Continuing Calibration
Continuing calibration was performed at the required frequencies.
The percent differences (o/oD) were less than or equal to 20.0°/o for all compounds.
Retention times of all compounds in the calibration standards were within the established retention time windows for samples which underwent Level D validation. Raw data were not reviewed for Level C validation.
IV. Laboratory Blanks
Laboratory blanks were analyzed as required by the method. No contaminants were found in the laboratory blanks.
V. Field Blanks
No field blanks were identified in this SDG.
VI. Surrogates
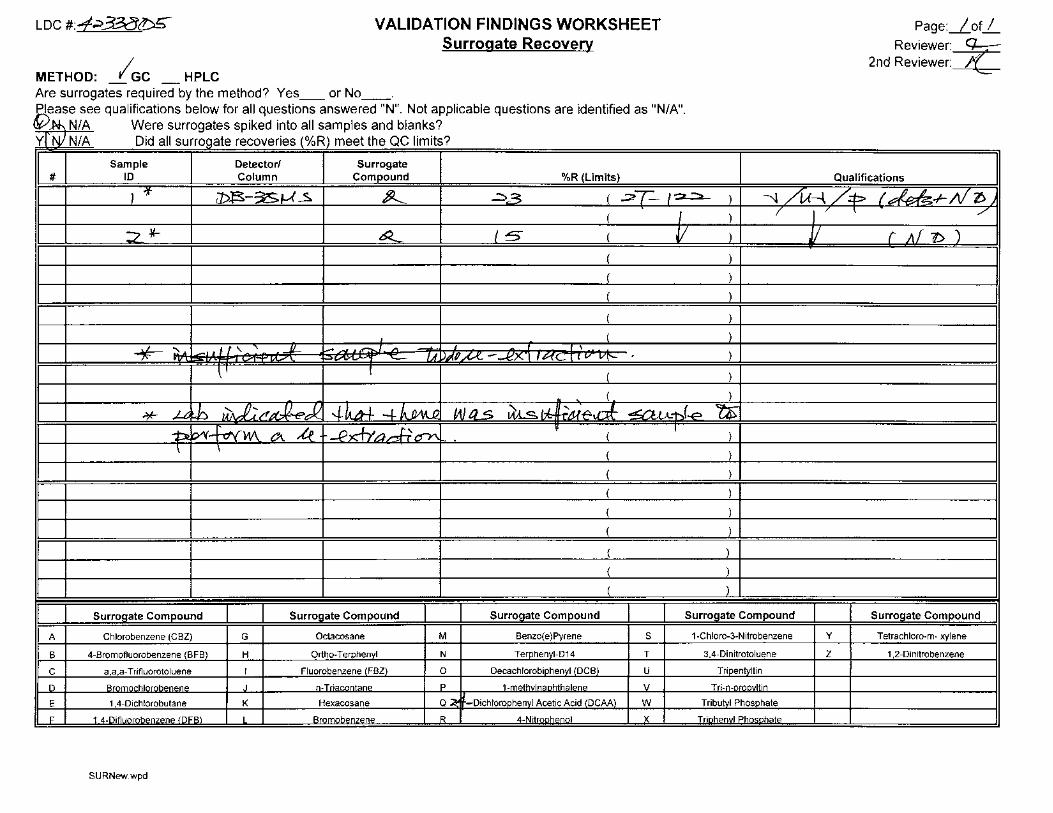
Surrogates were added to all samples as required by the method. All surrogate recoveries (o/oR) were within QC limits with the following exceptions:
Affected Sample Column Surrogate %R (Limits) Compound Flag A or P
GQ001** DB-35MS 2,4-Dichlorophenyl acetic acid 23 (27-122) All compounds J (all detects) p UJ (all non-detects)
5 V:\LOGIN\AECOM\ANDERSEN\42338D5_A34.DOC
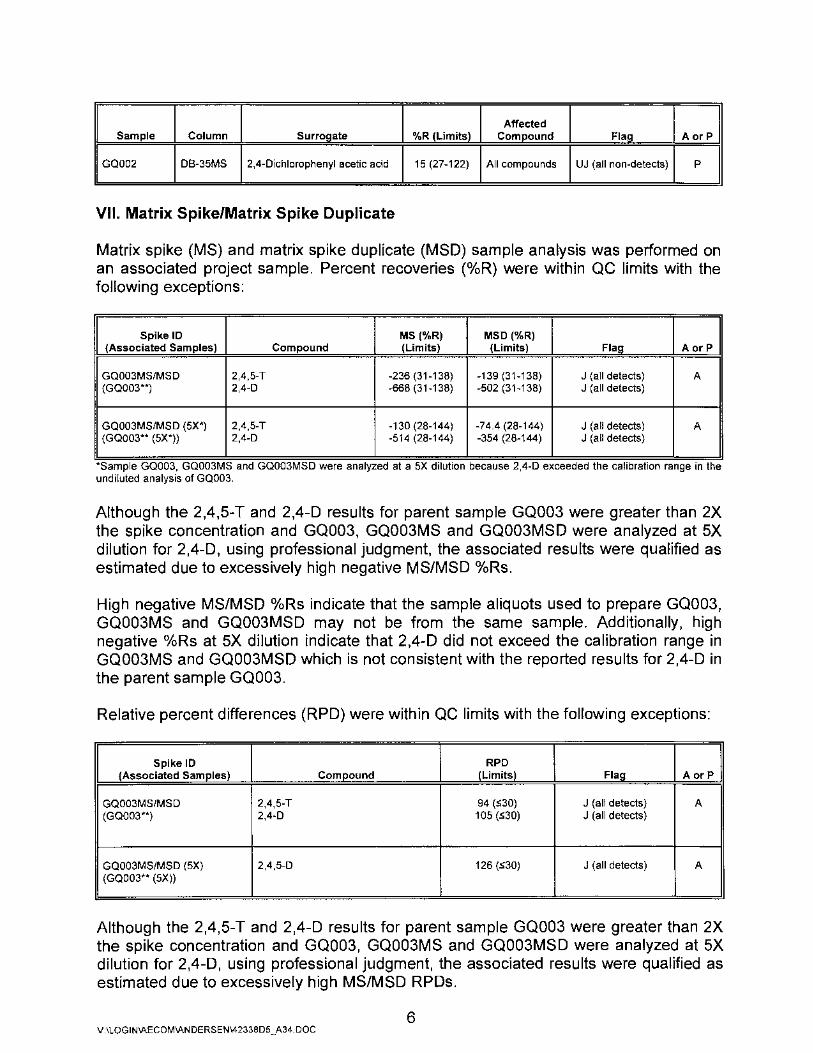
Affected Sample Column Surrogate %R (Limits) Compound Flag AorP
GQ002 DB-35MS 2,4-Dichlorophenyl acetic acid 15 (27-122) All compounds UJ (all non-detects) p
VII. Matrix Spike/Matrix Spike Duplicate
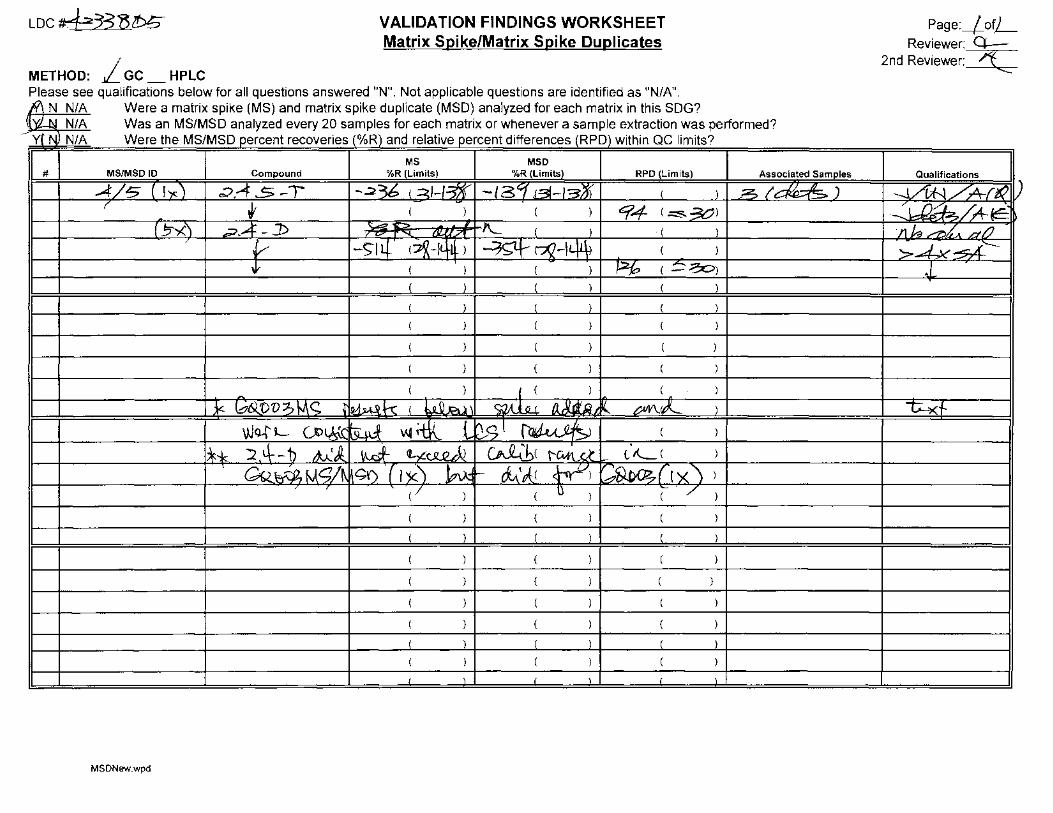
Matrix spike (MS) and matrix spike duplicate (MSD) sample analysis was performed on an associated project sample. Percent recoveries (0/oR) were within QC limits with the following exceptions:
Spike 10 MS (%R) MSO (%R) (Associated Samples) Compound (Limits) (Limits) Flag A or P
GQ003MS/MSD 2,4,5-T -236 (31-138) -139 (31-138) J (all detects) A (GQ003**) 2,4-D -668 (31-138) -502 (31-138) J (all detects)
GQ003MS/MSD (5X*) 2,4,5-T -130 (28-144) -74.4 (28-144) J (all detects) A (GQ003** (5X*)) 2,4-D -514 (28-144) -354 (28-144) J (all detects)
*Sample GQ003, GQ003MS and GQ003MSD were analyzed at a 5X d1lut1on because 2,4-D exceeded the calibration range m the undiluted analysis of GQ003.
Although the 2,4,5-T and 2,4-D results for parent sample GQ003 were greater than 2X the spike concentration and GQ003, GQ003MS and GQ003MSD were analyzed at 5X dilution for 2,4-D, using professional judgment, the associated results were qualified as estimated due to excessively high negative MS/MSD 0/oRs.
High negative MS/MSD 0/oRs indicate that the sample aliquots used to prepare GQ003, GQ003MS and GQ003MSD may not be from the same sample. Additionally, high negative 0/oRs at 5X dilution indicate that 2,4-D did not exceed the calibration range in GQ003MS and GQ003MSD which is not consistent with the reported results for 2,4-D in the parent sample GQ003.
Relative percent differences (RPD) were within QC limits with the following exceptions:
Spike 10 RPO (Associated Samples) Compound (Limits) Flag A orP
GQ003MS/MSD 2,4,5-T 94 (S30) J (all detects) A (GQ003**) 2,4-D 105 (S30) J (all detects)
GQ003MS/MSD (5X) 2,4,5-D 126 (S30) J (all detects) A (GQ003** (5X))
Although the 2,4,5-T and 2,4-D results for parent sample GQ003 were greater than 2X the spike concentration and GQ003, GQ003MS and GQ003MSD were analyzed at 5X dilution for 2,4-D, using professional judgment, the associated results were qualified as estimated due to excessively high MS/MSD RPDs.
6 V:\LOGIN\AECOM\ANDERSEN\4233805_A34.DOC
High MS/MSD RPDs may indicate a high degree of heterogeneity in the sample matrix, however, in this case, based on the excessively high negative MS/MSD o/oRs, imprecision may be due to either improper sample handling or inconsistent sample preparation.
VIII. Laboratory Control Samples
Laboratory control samples (LCS) were analyzed as required by the method. Percent recoveries (0/oR) were within QC limits.
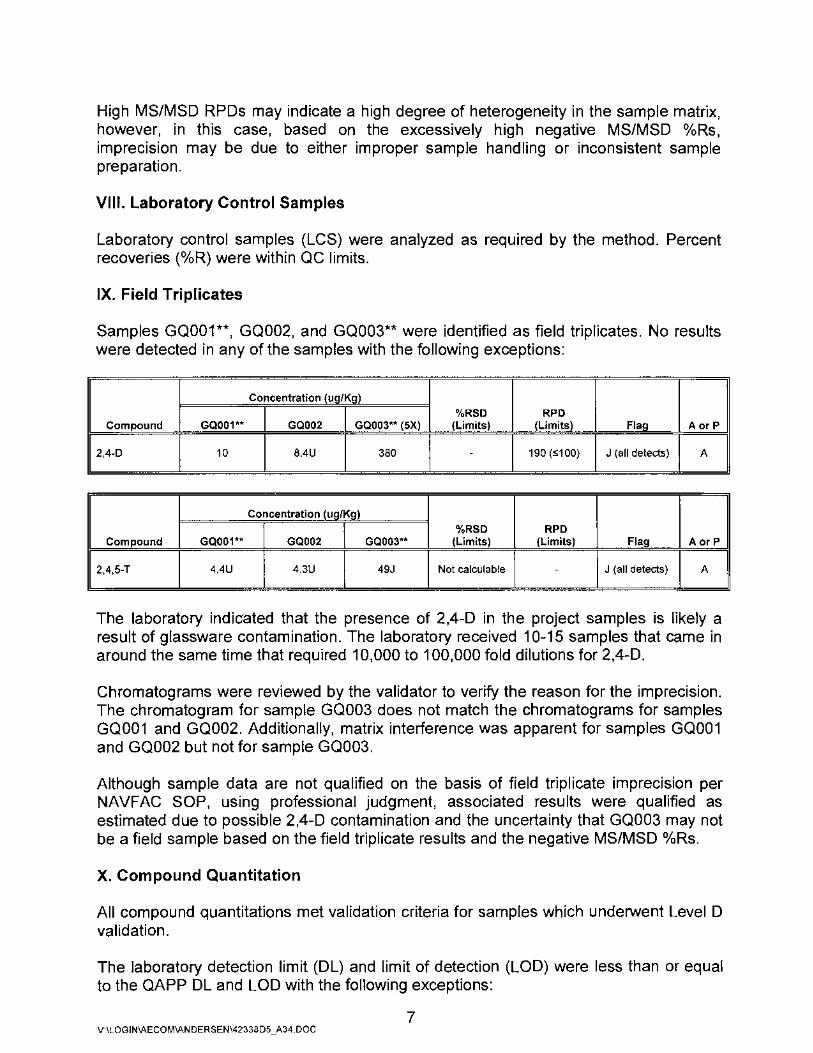
IX. Field Triplicates
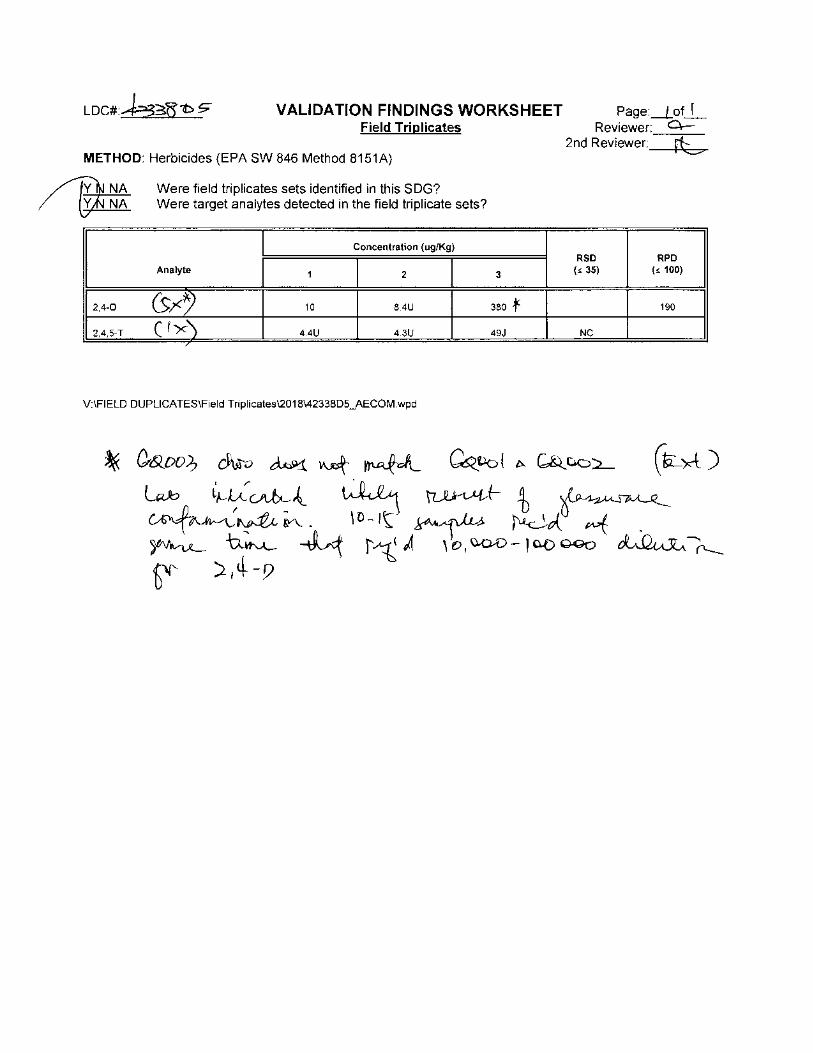
Samples GQ001**, GQ002, and GQ003** were identified as field triplicates. No results were detected in any of the samples with the following exceptions:
Concentration (ug/Kg) %RSD RPD
Compound GQ001** GQ002 GQ003** ( 5X) (Limits) (Limits) Flag AorP
2,4-D 10 8.4U 380 - 190 ($100) J (all detects) A
Concentration (ug/Kg) %RSD RPD
Compound GQ001** GQ002 GQ003** (Limits) (Limits) Flag AorP
2,4,5-T 4.4U 4.3U 49J Not calculable - J (all detects) A
The laboratory indicated that the presence of 2,4-D in the project samples is likely a result of glassware contamination. The laboratory received 10-15 samples that came in around the same time that required 10,000 to 100,000 fold dilutions for 2,4-D.
Chromatograms were reviewed by the validator to verify the reason for the imprecision. The chromatogram for sample GQ003 does not match the chromatograms for samples GQ001 and GQ002. Additionally, matrix interference was apparent for samples GQ001 and GQ002 but not for sample GQ003.
Although sample data are not qualified on the basis of field triplicate imprecision per NAVFAC SOP, using professional judgment, associated results were qualified as estimated due to possible 2,4-D contamination and the uncertainty that GQ003 may not be a field sample based on the field triplicate results and the negative MS/MSD %Rs.
X. Compound Quantitation
All compound quantitations met validation criteria for samples which underwent Level D validation.
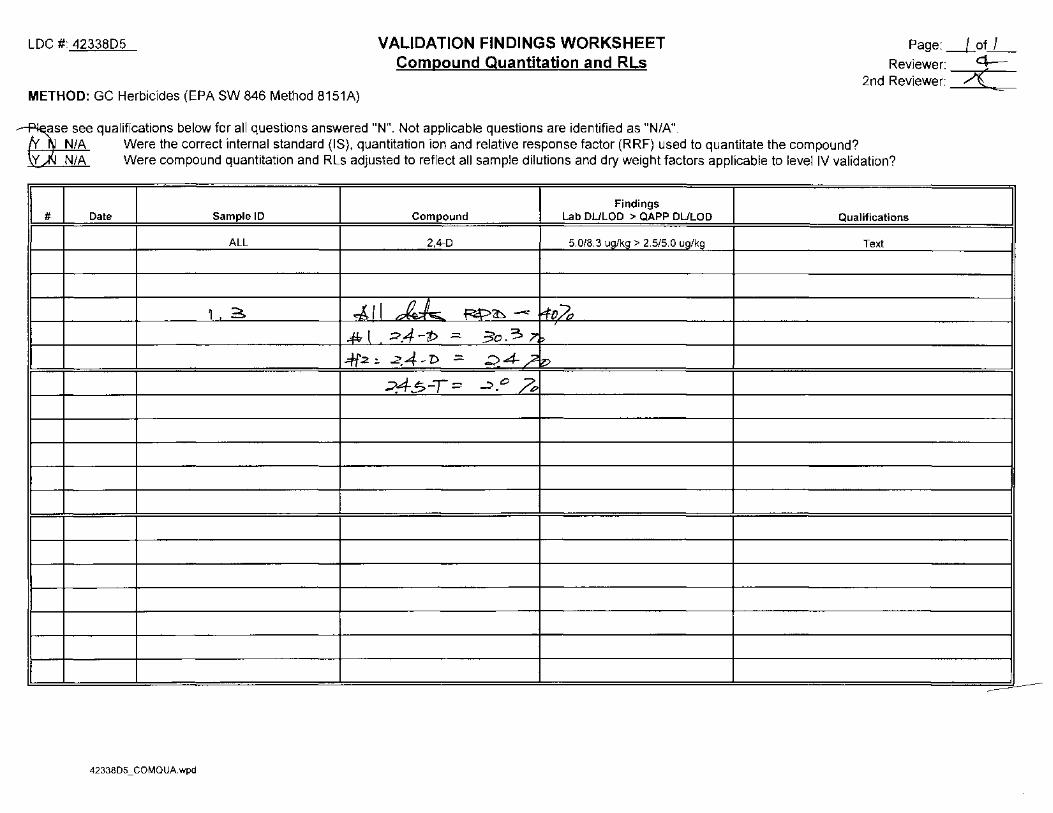
The laboratory detection limit (DL) and limit of detection (LOD) were less than or equal to the QAPP DL and LOD with the following exceptions:
7 V:\LOGIN\AECOM\ANDERSEN\4233805_A34.DOC
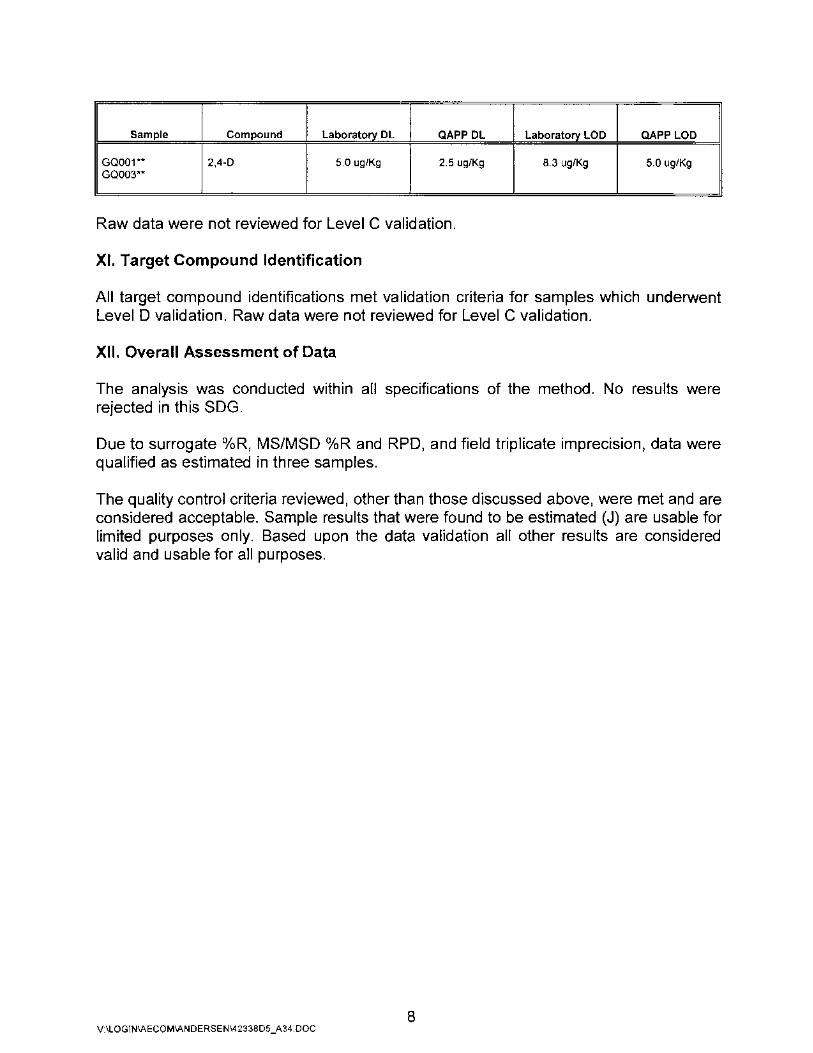
Sample Compound Laboratory DL QAPP DL Laboratory LOD QAPP LOD
GQ001** 2,4-D 5.0 ug/Kg 2.5 ug/Kg 8.3 ug/Kg 5.0 ug/Kg GQ003**
Raw data were not reviewed for Level C validation.
XI. Target Compound Identification
All target compound identifications met validation criteria for samples which underwent Level D validation. Raw data were not reviewed for Level C validation.
XII. Overall Assessment of Data
The analysis was conducted within all specifications of the method. No results were rejected in this SDG.
Due to surrogate 0/oR, MS/MSD o/oR and RPD, and field triplicate imprecision, data were qualified as estimated in three samples.
The quality control criteria reviewed, other than those discussed above, were met and are considered acceptable. Sample results that were found to be estimated (J) are usable for limited purposes only. Based upon the data validation all other results are considered valid and usable for all purposes.
8 V:\LOGIN\AECOM\ANDERSEN\4233805_A34.DOC
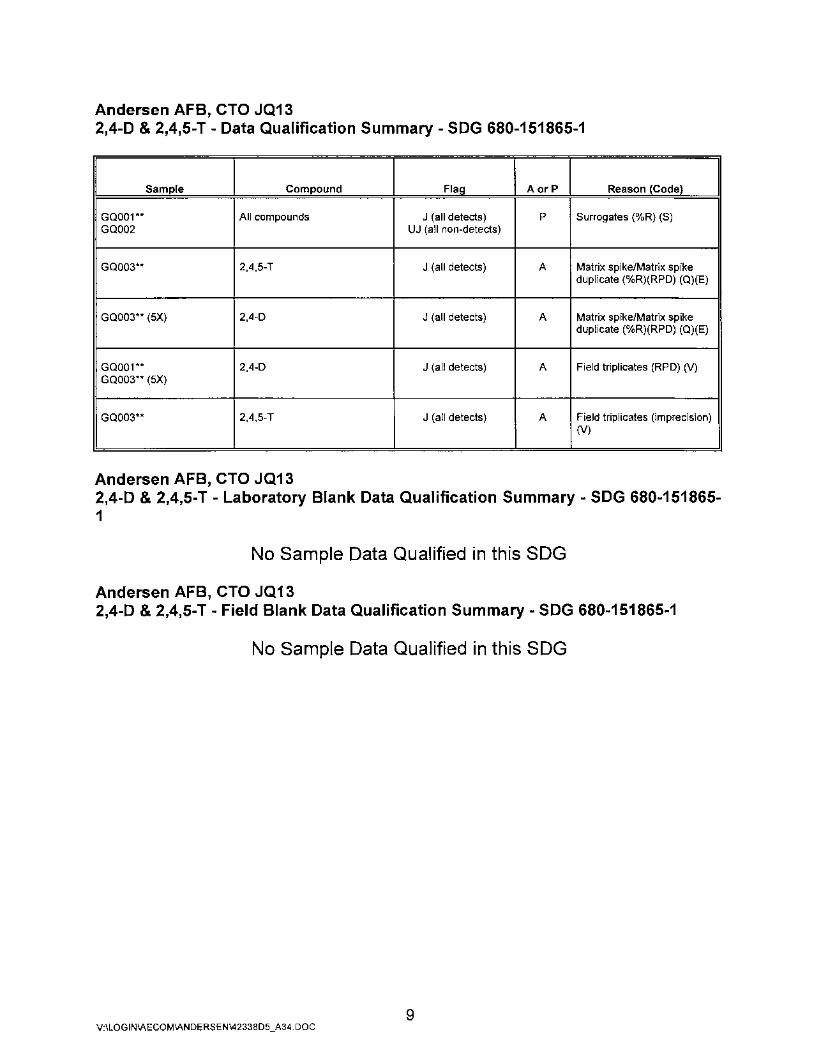
Andersen AFB, CTO JQ13 2,4-D & 2,4,5-T - Data Qualification Summary - SDG 680-151865-1
Sample Compound Flag AorP Reason (Code)
GQ001** All compounds J (all detects) p Surrogates (%R) (S) GQ002 UJ (all non-detects)
GQ003** 2,4,5-T J (all detects) A Matrix spike/Matrix spike duplicate (%R)(RPD) (Q)(E)
GQ003** (5X) 2,4-D J (all detects) A Matrix spike/Matrix spike duplicate (%R)(RPD) (Q)(E)
GQ001** 2,4-D J (all detects) A Field triplicates (RPD) (V) GQ003** (5X)
GQ003** 2,4,5-T J (all detects) A Field triplicates (imprecision) (V)
Andersen AFB, CTO JQ13 2,4-D & 2,4,5-T - Laboratory Blank Data Qualification Summary - SDG 680-151865-1
No Sample Data Qualified in this SDG
Andersen AFB, CTO JQ13 2,4-D & 2,4,5-T- Field Blank Data Qualification Summary- SDG 680-151865-1
No Sample Data Qualified in this SDG
9 V:\LOGIN\AECOM\ANDERSEN\42338D5_A34.DOC
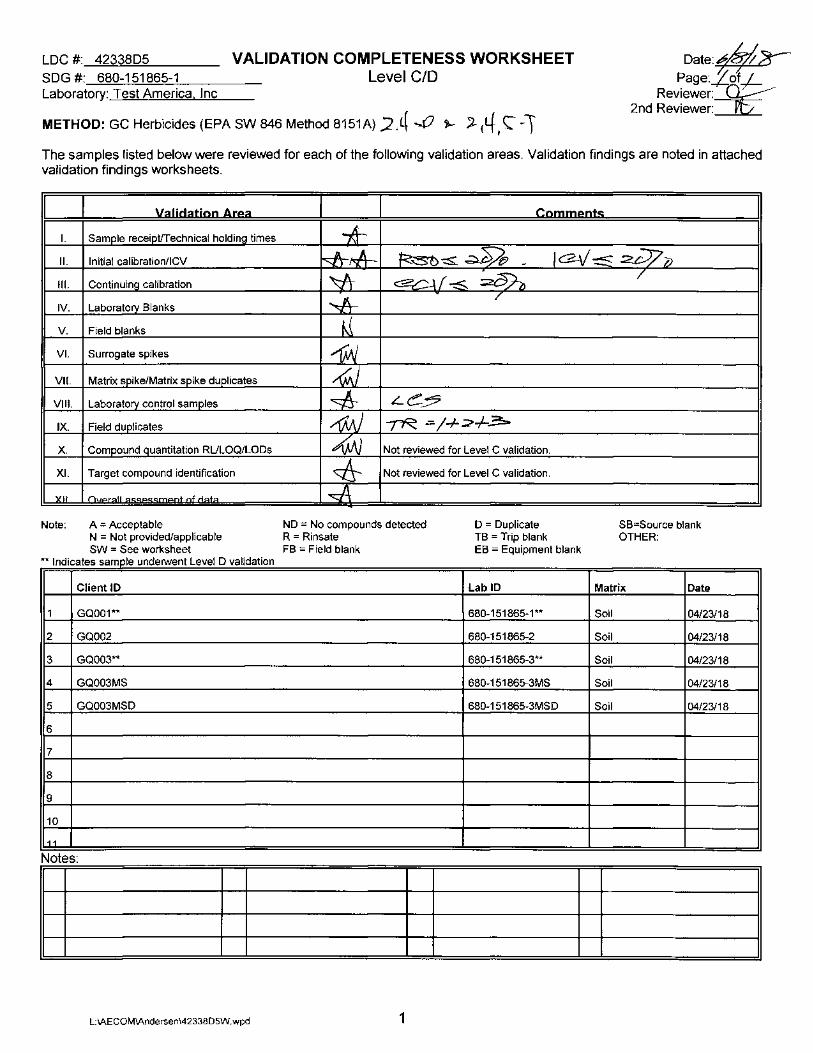
LDC #: 4233805 SDG #: 680-151865-1 Laboratory: Test America. Inc
VALIDATION COMPLETENESS WORKSHEET Level C/O
METHOD: GC Herbicides (EPA SW 846 Method 8151A) :2 ,q -0 ~· ;2-. <~, C' -1
Date:~ Page:-l,ot-:t
Reviewer:~ 2nd Reviewer:~
The samples listed below were reviewed for each of the following validation areas. Validation findings are noted in attached validation findings worksheets.
I I I.
II.
Ill.
IV.
V.
VI.
VII.
VIII.
IX.
X.
XI.
)(II
Note:
llalidatiao Area
Sample receipt/Technical holding times
Initial calibration/ICV
Continuing calibration
Laboratory Blanks
Field blanks
Surrogate spikes
Matrix spike/Matrix spike duplicates
Laboratory control samples
Field duplicates
Compound quantitation RULOQ/LODs
Target compound identification
()\/..,.r:::all nf rl:::at:::a
A = Acceptable N = Not provided/applicable SW = See worksheet
**Indicates sample underwent Level D validation
Client ID
1 GQ001**
2 GQ002
3 GQ003**
4 GQ003MS
5 GQ003MSD
6
7
8
9
10
11
Notes:
L:\AECOM\Andersen\4233805W.wpd
I I Cammeots
* JA A '{:<~~~ I C2J/ ~ 2_CJ7 7J .........,_) '"'l.T -~ .~r~~ /
~ /
M ~ 4AJ ~ Le__?
4JJ -rR. -=-/-1- ::;.+.3!!::=-
A)AJ Not reviewed for Level C validation.
~ Not reviewed for Level C validation.
~
ND =No compounds detected R = Rinsate
D = Duplicate TB = Trip blank
SB=Source blank OTHER:
FB = Field blank EB = Equipment blank
LabiD Matrix Date
680-151865-1** Soil 04/23/18
680-151865-2 Soil 04/23/18
680-151865-3** Soil 04/23/18
680-151865-3MS Soil 04/23/18
680-151865-3MSD Soil 04/23/18
1
I
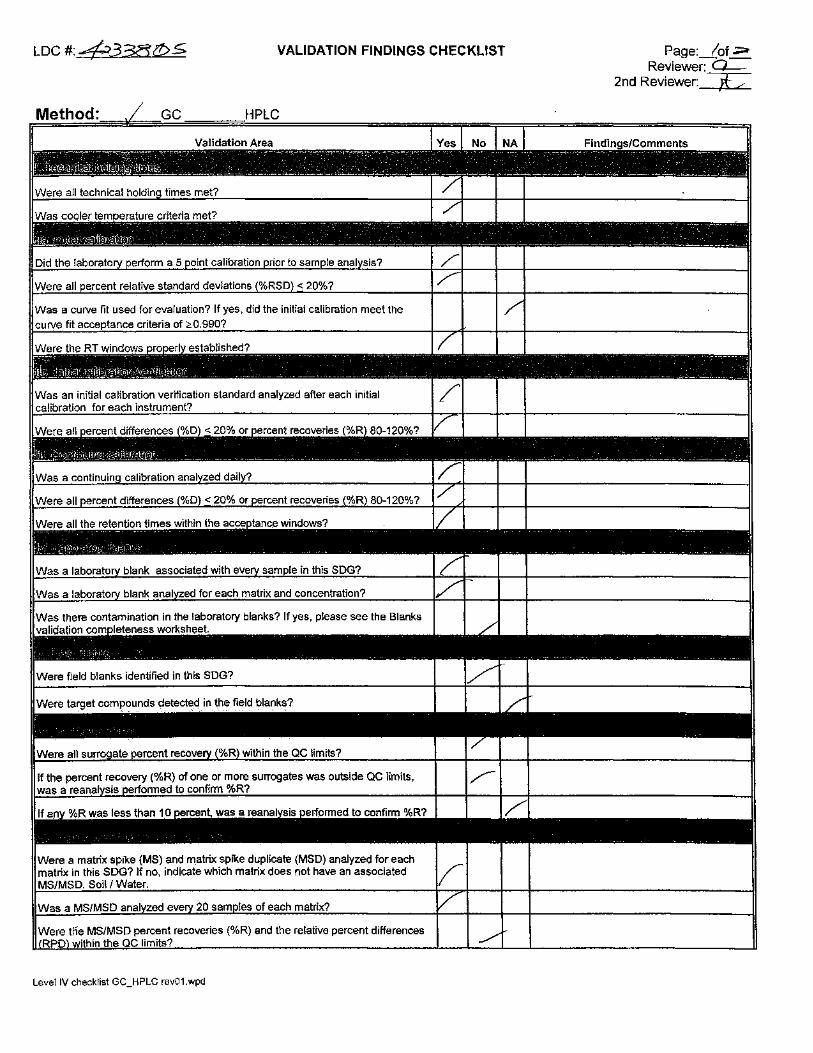
LDC #: ~3"3ae!>5
Method: GC
Level IV checklist GC_HPLC rev01.wpd
VALIDATION FINDINGS CHECKLIST
PLC
Page:_Lot~ Reviewer: Q__
2nd Reviewer: tt .c •
LDC #:...fc:?S38' tD~
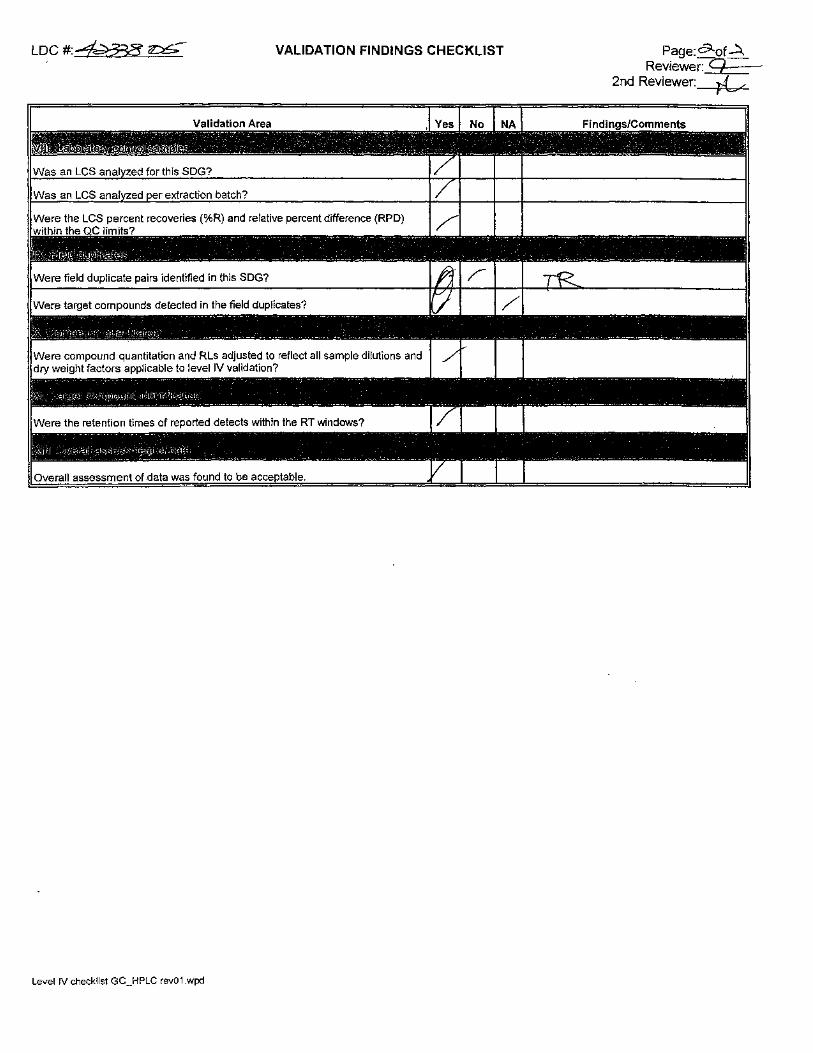
Overall assessment of:data was found to be a
Level IV check!ist GC_HPLC rev01.wpd
VALIDATION FINDINGS CHECKLIST Page: <:5\of ~ Reviewe~-
2nd Reviewer: J?L/
LDC #:d-:>33:5~
METHOD: __!'Gc HPLC
VALIDATION FINDINGS WORKSHEET Surrogate Recovery
Are surrogates required by the method? Yes __ or No Please see qualifications below for all questions answered "N"o Not applicable questions are identified as "N/A"o ~ v(NJ NiA 00 0 0 _g - --- .. \ 0-0 ., 0 0 0 .. -· ·- ·····-- .
i Sample Detector/ Surrogate I
I # 10 Column Compound %R (Limits)
Page:_Lof_.L
Reviewer: ~ 2nd Reviewer:~
Qualifications
'-J" lt>fS-3$1-.A _s. ~ .:::>.3 ( .:::;?T-f~ ) ~ /U-\ / ::(:> (~-I-1\1 l> ) ( I ) f J / \ /
::z_¥- &<..__ {5 ( v ) J/ r Af 1:> ) ( )
( )
( )
( )
I ( )
--;f-~ ~J ,~ r' ' ..JI_._ -1"'1 .~1 i'"\ I \
IA..oo'\.. ~ lA. 1)/J(fl ~ -_.ex~\ IV{( TT v Vt'-- ~ )
\ I I ( )
lo ( )
* .LV ~ ,'AJ; ~ J--eJ!. -+W-+~ WtLS tks.~o-rf\d- ~'"br-e '?:$ ....... "'·"' 1 .... W\ (}\. A_ -e xft a d7 c5"Y\
,, (
I ) ..t;....l( r.."" ,. l v~
\ \ ( )
( )
I I I I I
(
i I I (
(
I I I I I
(
i I I
(
(
Surrogate Compound Surrogate Compound Surrogate Compound Surrogate Compound Surrogate Compound
A Chlorobenzene (CBZ) G Octacosane M Benzo(e)Pyrene s 1-Chloro-3-N itrobenzene y Tetrachloro-m- xylene
B 4-Bromofluorobenzene (BFB) H Ortho-Terphenyl N Terphenyi-D 14 T 3,4-Dinitrotoluene z 1 ,2-Dinitrobenzene
c a,a,a-Trifluorotoluene I Fluorobenzene (FBZ) 0 Decachlorobiphenyl (DCB) u Tripentyltin
D Bromochlorobenene J n-Triacontane p 1-methvlnaohthalene v Tri-n-oroovltin
E 1 ,4-Dichlorobutane K Hexacosane Q~ ~-Dichlorophenyl Acetic Acid (DCAA) w Tributyl Phosphate
F 1 4-Difluorobenzene fDFB) L Bromobenzene R 4-Nitroohenol X Triohenvl Phosohate
SURNew.wpd
LDC d-2~313!!:>6
METHOD: j_ GC _ HPLC
VALIDATION FINDINGS WORKSHEET Matrix Spike/Matrix Spike Duplicates
Please see qualifications below for all questions answered "N". Not applicable questions are identified as "N/A" . . . '" . -··' l~ N/A Was an MS/MSD analyzed every 20 samples for each matrix or whenever a sample extraction was performed? YfN N/A Were the MS/MSD percent recoveries (%R) and relative percent differences (RPD) within QC limits?
MS MSD # MS/MSD ID Compound %R (Limits) %R (Limits) RPD (Limits) Associated Samples
A/5 { f'J<) o?.~S-T -.::2-36 ( =~J-1~ -13~ £31-13~ ( ) ES(~~) !' ~
-Cf4(~~) ( ) ( ) ...
( 5')() ~.4-:D ~_"'L::>. L "- ( ) . ( ) i' .c;.7 ........ _lJUL7f / v -S'I~ ~-~tt1!) ~~~-144 ( )
\lr ( ) ( ) Pk_ (=~) ( ) ( ) ( )
( ) ( ) ( )
( ) ( ) ( )
( ) ( ) ( )
( ) ( ) ( )
( ) ( ( ) ( ) ,..
~ ~S.,OV=?M<;. ~l~h: (~.A' ~A.JcLr (1~, ~ t"fil'\_rf)l..._ )
wQ.\ L Gt>~ t§:J\J w~ l ~g~ ~A~ ( )
I~* :2.l\---"b ~~ ~- <l.,cCJLQJ» (.pj41< t'Wf'\.._<;k 1- ttL< )
I
~ GO ( I'J<) ~ ~ ~'A<~) l~~({x)) '- (/ ) (
l) ) ( / )
( ) ( ) ( )
( ) ( ) ( )
( ) ( ) ( )
( ) ( ) ( )
( ) ( ) ( )
( ) ( ) ( )
( ) ( ) ( )
( ) ( ) ( )
j_ .l ( ) ( )
MSDNew.wpd
Page:_j_ofL Reviewer: 0--
2nd Reviewer: '?'t .........__
Qualifications
-J/Lif-4LAL!2 ~ /kO~~/_ti_~ 1tk~£nC 2~::774-'--
J.
~
LDC#:~t}b 57 VALIDATION FINDINGS WORKSHEET Field Triplicates
METHOD: Herbicides (EPA SW 846 Method 8151A)
~ Were field triplicates sets identified in this SDG? / ~ Were target analytes detected in the field triplicate sets?
Concentration (ug/Kg)
Analyte 1 2 3
2,4-D ($;<~ 10 8.4U 380 ·t 2,4,5-T c rx) 4.4U 4.3U 49J
,r
V:\FI ELD DUPLICATES\Field Triplicates\2018\42338D5_AECOM.wpd
Page:Jof_r_ Reviewer: Q..-
2nd Reviewer: ~~
RSD RPD (:<> 35) (:<> 100)
190
NC
LDC #: 4233805
METHOD: GC Herbicides (EPA SW 846 Method 8151A)
VALIDATION FINDINGS WORKSHEET Compound Quantitation and Rls
ase see qualifications below for all questions answered "N". Not applicable questions are identified as "N/A".
Page: _J_of_/_
Reviewer: 4--2nd Reviewer: 2(
. . N/A Were the correct internal standard (IS), quantitation ion and relative response factor (RRF) used to quantitate the compound? \v JJ N/A Were compound quantitation and Rls adjusted to reflect all sample dilutions and dry weight factors applicable to level IV validation?
Findings # Date Sample ID Compound Lab DULOD > QAPP DULOD Qualifications
ALL 2,4-D 5.0/8.3 ug/kg > 2.5/5.0 ug/kg Text I
, ~ 4Ll_~ ~~~ ~h ~J :::>.4 -t> - 3o. 3 ?,p
.:#'2 :. .2. 4 -D - .=::>4-.? ~
;;>,4-.$ -T :: ~.o h
4233805 _COMO UA. wpd
LDC #: 4233805
METHOD: GC HPLC __ _
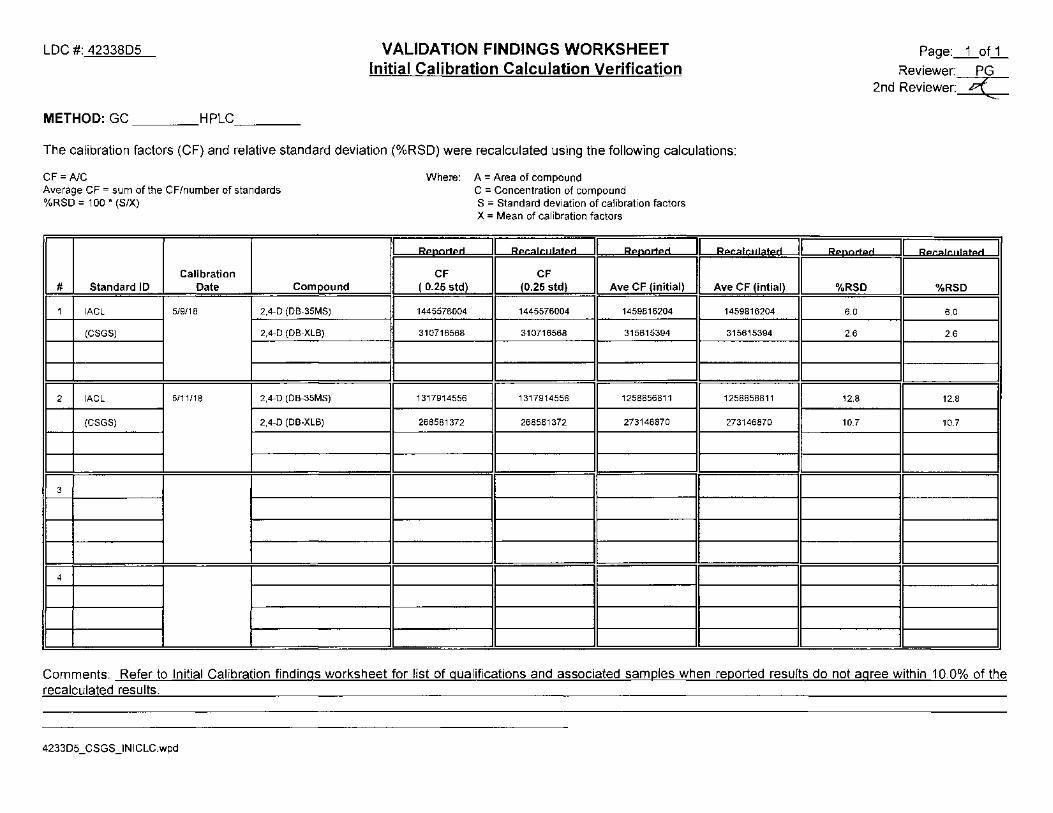
VALIDATION FINDINGS WORKSHEET Initial Calibration Calculation Verification
The calibration factors (CF) and relative standard deviation (%RSD) were recalculated using the following calculations:
CF = AJC Average CF = sum of the CF/number of standards %RSD = 100 * (SIX)
- -
Calibration # Standard ID Date Compound
1 IACL 5/9/18 2,4-D (DB-35MS)
(CSGS) 2,4-D (DB-XLB)
2 IACL 5/11/18 2,4-D (DB-35MS)
(CSGS) 2,4-D (DB-XLB)
3
I 4 I I I II
Where: A = Area of compound
.... -'
CF ( 0.25 std)
1445576004
310716568
1317914556
268581372
C = Concentration of compound S = Standard deviation of calibration factors X = Mean of calibration factors
I eecalc11lated I ....
I CF
I (0.25 std) Ave CF (initial)
1445576004 1459816204
310716568 315615394
1317914556 1258856811
268581372 273146870
II II
I eecalc11lated
Ave CF (intial)
1459816204
315615394
1258856811
273146870
II
Page:_1_of_1_
Reviewer: PG 2nd Reviewer:4
IEJI eecalc11lated I
%RSD I I %RSD
6.0 6.0
2.6 2.6
12.8 12.8
10.7 10.7
II II I
Comments: Refer to Initial Calibration findings worksheet for list of qualifications and associated samples when reported results do not agree within 10.0% of the recalculated results.
4233D5_CSGS_INICLC.wpd
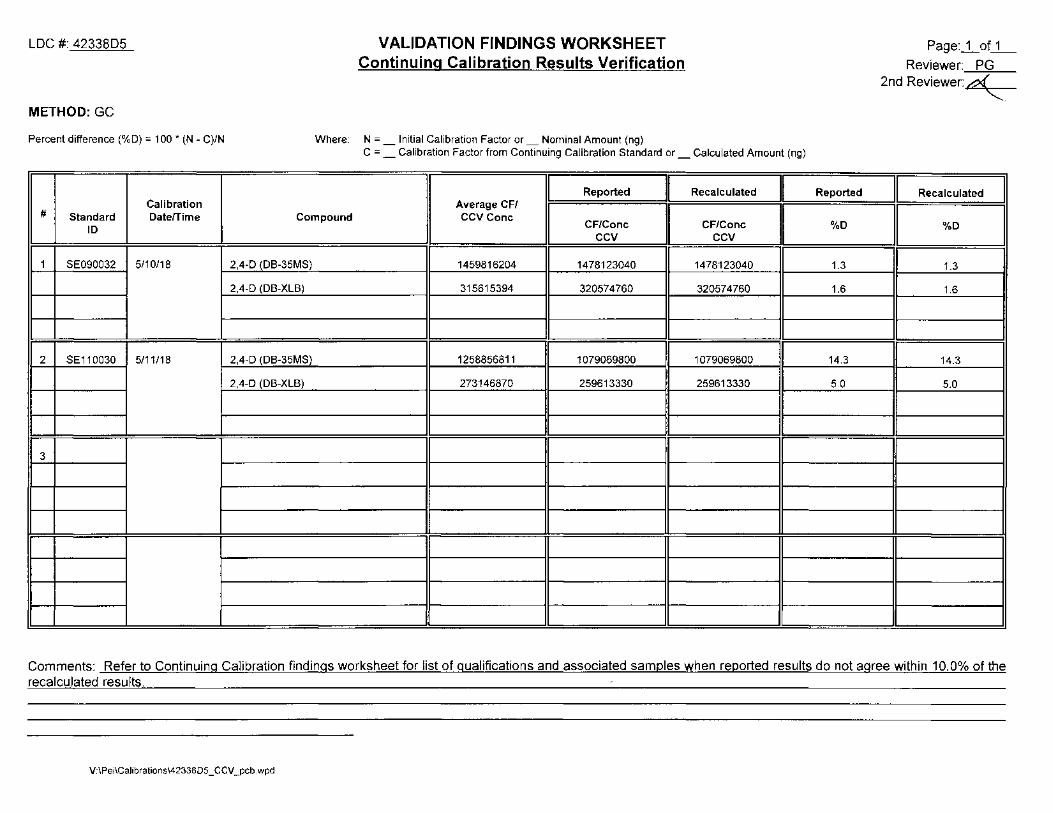
LDC #: 4233805
METHOD:GC
Percent difference (%0) = 1 00 * (N - C)/N
Calibration # Standard Date/Time
ID
1 SE090032 5/10/18
2 SE110030 5/11/18
I 3 I I I
VALIDATION FINDINGS WORKSHEET Continuing Calibration Results Verification
Where: N = _ Initial Calibration Factor or_ Nominal Amount (ng) C =_Calibration Factor from Continuing Calibration Standard or_ Calculated Amount (ng)
----
I Reported II Recalculated II Average CF/
I II II Compound CCV Cone
CF/Conc CF/Conc CCV CCV
2,4-D (DB-35MS) 1459816204 1478123040 1478123040
2,4-D (DB-XLB) 315615394 320574760 320574760
2,4-D (DB-35MS) 1258856811 1079069800 1079069800
2,4-D (DB-XLB) 273146870 259613330 259613330
II II II II
Reported
%0
1.3
1.6
14.3
5.0
Page:_1_of_1 _
Reviewer: PG
2nd Reviewer:~-
II Recalculated
II %0
1.3
1.6
14.3
5.0
IL I
Comments: Refer to Continuing Calibration findings worksheet for list of qualifications and associated samples when reported results do not agree within 10.0% of the recalculated results.
V:\Pei\Calibrations\4233805_ CCV _pcb. wpd
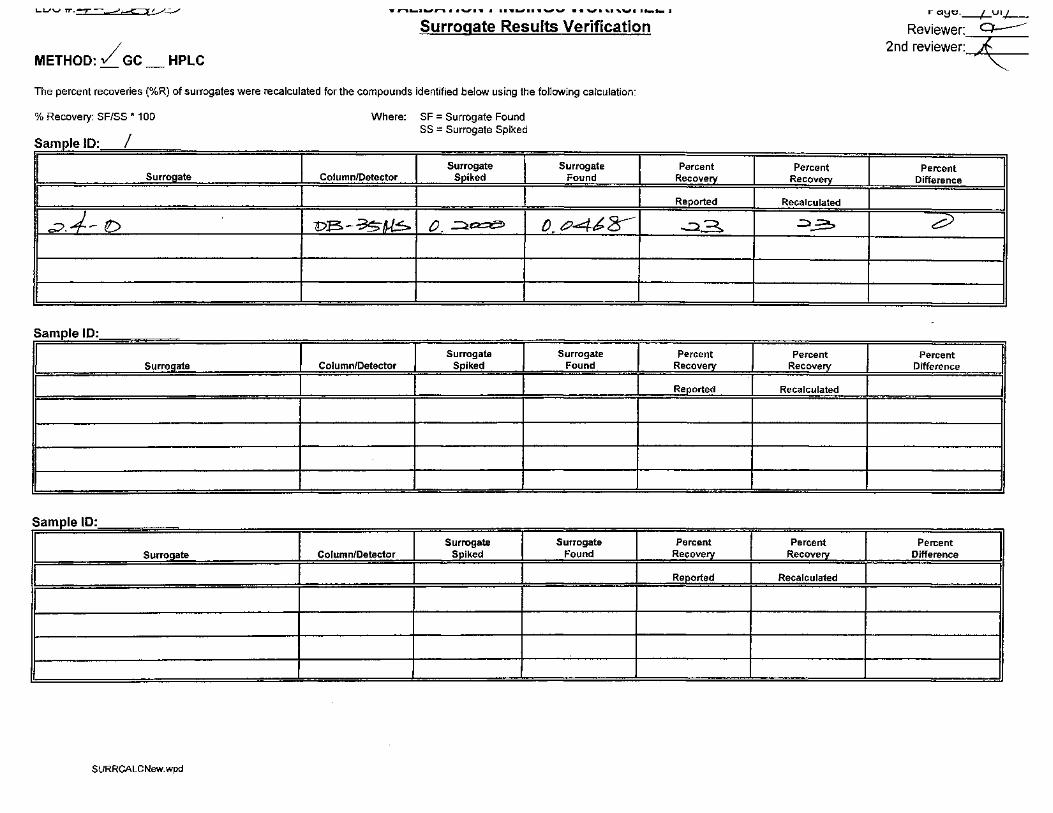
L.IJV n-.-z:-&<""'~F./..:;../ W ~~~ ..... ......-..I 1'-11111'1-. I II'W....,II .. '-IIIII,._. •. -~I , •. ,'-1'.1 •. ._._.I
Surrogate Results Verification
METHOD:/Gc HPLC
The percent recoveries (%R) of surrogates were recalculated for the compounds identified below using the following calculation:
%Recovery: SF/SS * 100
Sample ID: I
II Surrogate
! I c::>.+-- D
Sample ID:
Where: SF = Surrogate Found SS =Surrogate Spiked
I I Surrogate I Column/Detector S.£iked
! . I I I• Dl3-3$~1 0. ~a:=B I
Surrogate I Found
I 0. t?4bs-l
Percent J Percent Recovery Recovery
Reeorted I Recalculated
~~ I ~~
l I I
1- a~C.---f-UI-1-
Reviewer: o..-----2nd reviewer:~
Percent
J Difference
I (d) I
II Surrogate Percent J
Surro ate Column/Detector Found Differ~11ce
I I . . I I I Reeorted ., Recalculated I I
Samole ID
Surrogate Percent Surro ate Column/Detector Found Difference
I Reeorted Recalculated I
SURRCALCNew. wpd
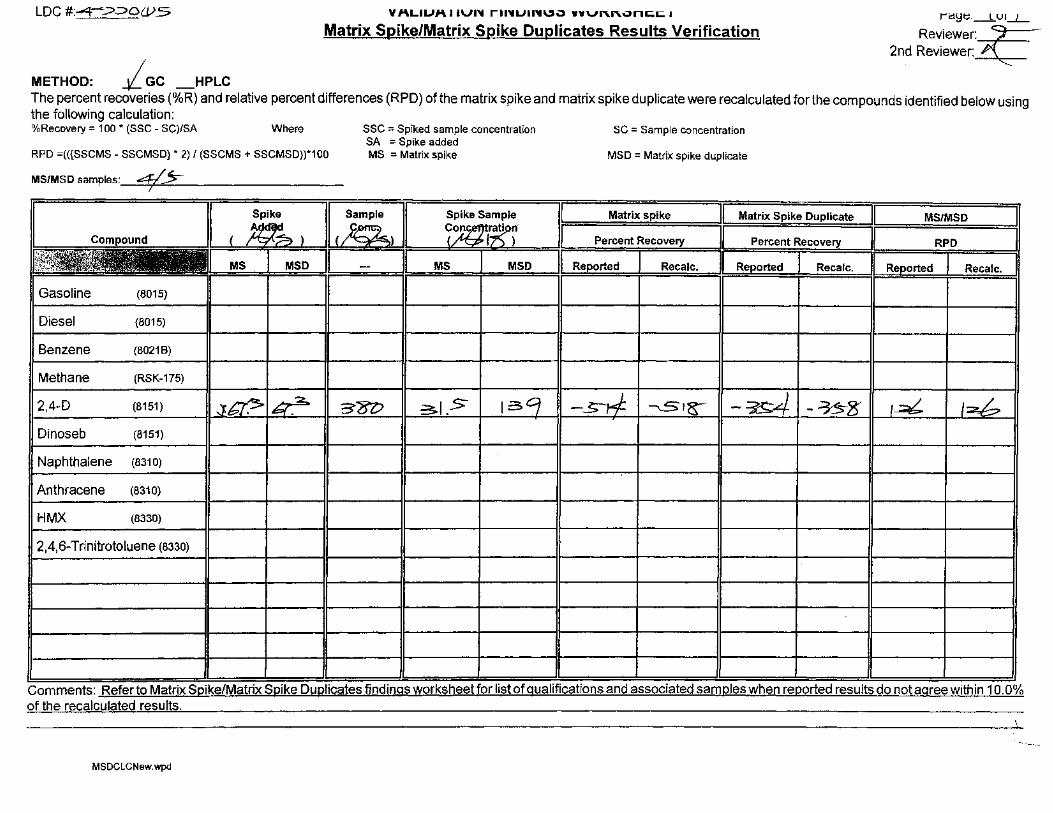
LOG #:-4-~.:::>0(VS
METHOD: 1 GC _HPLC
V ALILIA IIVI'I rii'IUII'IU" YYVI"'\.n.."n~:;;~:;; I
Matrix Spike/Matrix Spike Duplicates Results Verification li::I!::Jt:._l UI_L_
Reviewer:~ 2nd Reviewer:
The percent recoveries (%R) and relative percent differences (RPD) of the matrix spike and matrix spike duplicate were recalculated for the compounds identified below using the following calculation: %Recovery = 1 00 * (SSG - SC)/SA Where
RPD =(({SSCMS- SSCMSD} * 2) I (SSCMS + SSCMSD))*100
sse = Spiked sample concentration SA = Spike added MS = Matrix spike
SC = Sample concentration
MSD = Matrix spike duplicate
MS/MSD samples: __ ~~=y __________ _
-----~ - J ~ample I Matrix spike I[ Matrix Spike Duplicate II MS/MSD I • Compound C • ) I Percent RecoveJY II Percent Recovel)' II RPD l1
--- [ Reported __ _j_ R~calc. II Reported I _ Recalc. ~~rted _ I Recalc. I Gasoline (8015)
Diesel (8015)
Benzene (80218)
Methane (RSK-175)
2,4-D (8151) J6t~l~ ~C)Z) :3-15> 13'1 -~ I -,s-,~ II - ~4 I -~z II _l?l? ~~ Dinoseb (8151)
Naphthalene (8310) -
Anthracene (8310}
HMX (8330)
2,4,6-Trinitrotoluene (8330}
Comments: Refer to Matrix Spike/Matrix Spike Duplicates findings worksheet for list of qualifications and associated samples when reported results do not agree within 1 0. 0% of the recalculated results.
MSDCLCNew.wpd
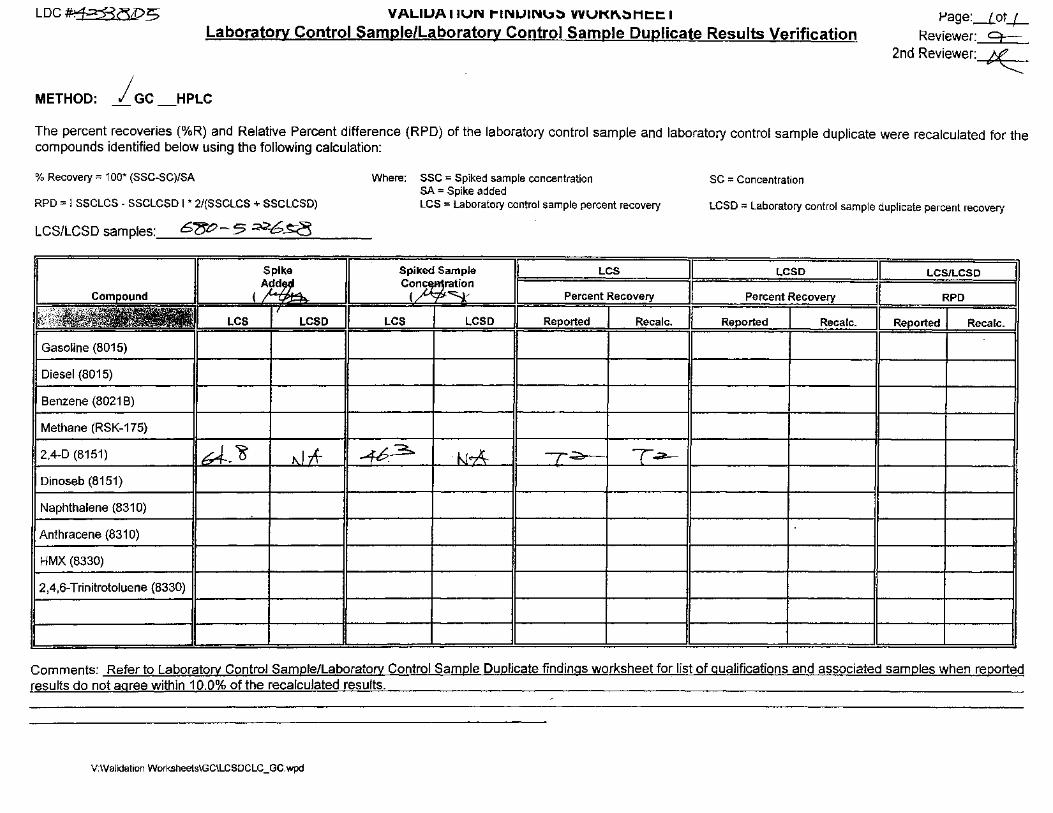
LDC~~tD5 VALIUA IIUN I"'INUINu~ VVUKI\..~Mt:.t: I
Laboratory Control Sample/Laboratory Control Sample Duplicate Results Verification Page:_L.ot-+-
Reviewer: 9-::: 2nd Reviewer: ~
METHOD: j GC _HPLC
The percent recoveries (%R) and Relative Percent difference (RPD) of the laboratory control sample and laboratory control sample duplicate were recalculated for the compounds identified below using the following calculation:
% Recovery = 1 00* (SSC-SC)/SA
RPD = I SSCLCS - SSCLCSD I * 2/(SSCLCS + SSCLCSD)
LCS/LCSD samples: 6e!~- 5 ~6~
Gasoline (8015)
Diesel (8015)
Benzene (8021 B)
Methane (RSK-175)
2,4-D (8151) 64-.~ ~J-fr Dinoseb (8151)
Naphthalene (831 0)
Anthracene (831 0)
HMX (8330)
2,4,6-Trinitrotoluene (8330)
Where: SSC = Spiked sample concentration SA = Spike added LCS = Laboratory control sample percent recovery
Spiked Sample LCS
SC = Concentration
LCSD = Laboratory control sample duplicate percent recovery
I LCSD II LCS/LCSD I ( I Percent Recovery J[~ Percent Recovery j[- RPD I
LCS LCSD I Reported I Recalc. II Reported I Recalc. J[_Report~d I Recalc. 11
--d:.h.-3 ·~- ~~IT·
Comments: Refer to Laboratorv Control Sample/Laboratorv Control Sample Duplicate findings worksheet fo~ list of qualifications and associated samples when reported results do not aaree within 10.0% of the recalculated results.
V:\Validation Worksheets\GC\LCSDCLC_ GC.wpd
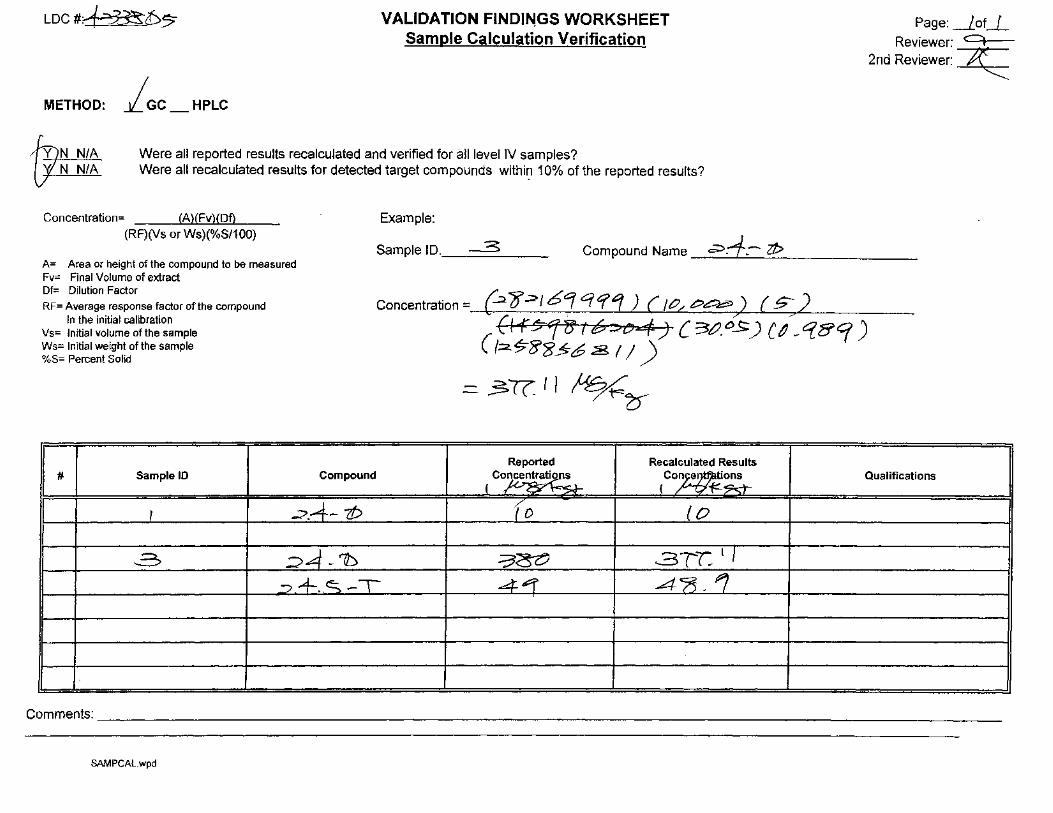
LDC#~f~D_$
METHOD: jGC_HPLC
VALIDATION FINDINGS WORKSHEET Sample Calculation Verification
Were all reported results recalculated and verified for all level IV samples? Were all recalculated results for detected target compounds withi~ 10% of the reported results?
Concentration= (A)(Fv)(Df) Example: (RF)(Vs or Ws)(%S/100)
Page: _lof_L Reviewer:~
2nd Reviewer:
A= Area or height of the compound to be measured Fv= Final Volume of extract
Sample ID. ---3 Compound Name e::> . .-f~- Z1> ----~-=-------------
Df= Dilution Factor
RF= Average response factor of the compound In the initial calibration
Vs= Initial volume of the sample Ws= Initial weight of the sample %8= Percent Solid
# Sample 10
I
~
I_
Concentration= &-o~J6Cjqtf'i) (/C/P~~) { 5)
( fl f!'TfB r 6=>t:4J c 3tJ.~ J c/_q89) /::2.$"8g~6 .;g I I)
.3Tr ' ' liSfro
Reported Recalculated Results Compound Co~s Co~tions Qualifications
( 0'~ ( ~~
-?.4-1!::> (o {0
;;>,4- 'lJ -3~ 3{7: t I
:::::> . t .. c:; - T 4~ 4'75' 1
Comments:------------------------------------------------------------------------------------------------------------
SAMPCAL. wpd
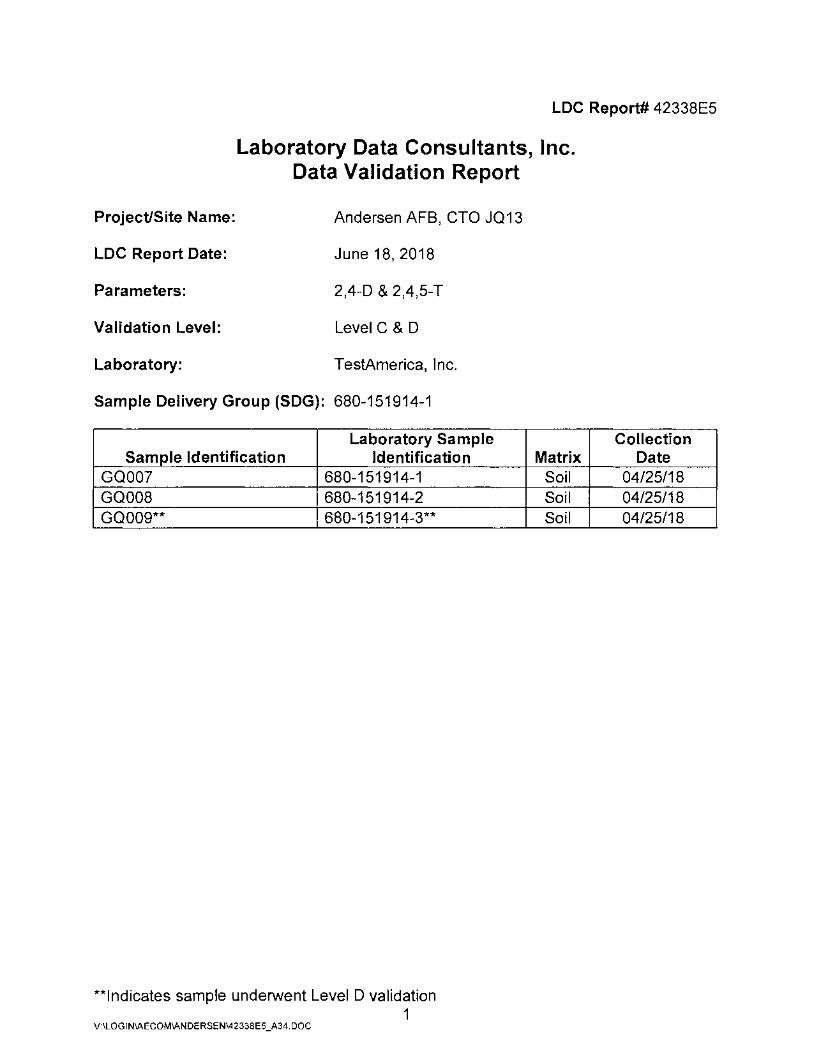
LDC Report# 42338E5
Laboratory Data Consultants, Inc. Data Validation Report
Project/Site Name: Andersen AFB, CTO JQ13
LDC Report Date: June 18, 2018
Parameters: 2,4-D & 2,4,5-T
Validation Level: Level C & D
Laboratory: TestAmerica, Inc.
Sample Delivery Group (SDG): 680-151914-1
Laboratory Sample Sample Identification Identification
GQ007 680-151914-1 GQ008 680-151914-2 GQ009** 680-151914-3**
**Indicates sample underwent Level D validation 1
V:\LOGIN\AECOM\ANDERSEN\42338E5_A34.DOC
Collection Matrix Date
Soil 04/25/18 Soil 04/25/18 Soil 04/25/18
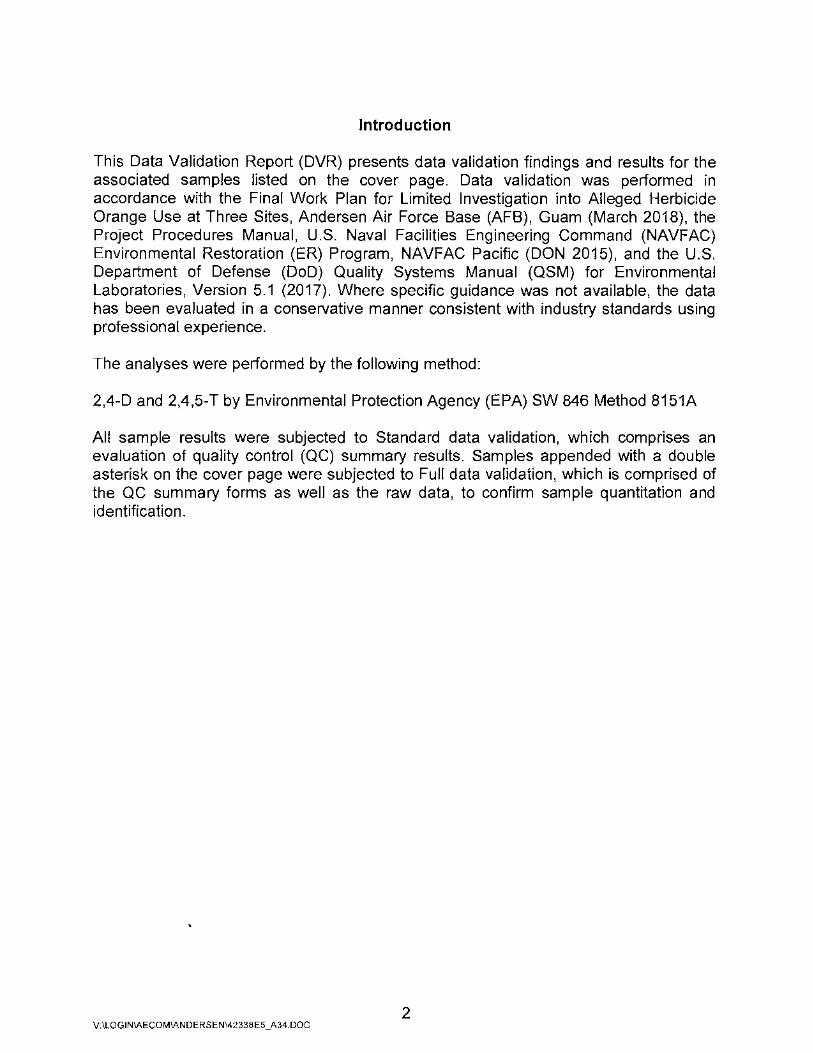
Introduction
This Data Validation Report (DVR) presents data validation findings and results for the associated samples listed on the cover page. Data validation was performed in accordance with the Final Work Plan for ·Limited Investigation into Alleged Herbicide Orange Use at Three Sites, Andersen Air Force Base (AFB), Guam (March 2018), the Project Procedures Manual, U.S. Naval Facilities Engineering Command (NAVFAC) Environmental Restoration (ER) Program, NAVFAC Pacific (DON 2015), and the U.S. Department of Defense (DoD) Quality Systems Manual (QSM) for Environmental Laboratories, Version 5.1 (2017). Where specific guidance was not available, the data has been evaluated in a conservative manner consistent with industry standards using professional experience.
The analyses were performed by the following method:
2,4-D and 2,4,5-T by Environmental Protection Agency (EPA) SW 846 Method 8151A
All sample results were subjected to Standard data validation, which comprises an evaluation of quality control (QC) summary results. Samples appended with a double asterisk on the cover page were subjected to Full data validation, which is comprised of the QC summary forms as well as the raw data, to confirm sample quantitation and identification.
2 V:\LOGIN\AECOM\ANDERSEN\42338E5_A34.DOC
The following are definitions of the data qualifiers utilized during data validation:
J (Estimated): The compound or analyte was analyzed for and positively identified by the laboratory; however the reported concentration is estimated due to nonconformances discovered during data validation.
U (Non-detected): The compound or analyte was analyzed for and positively identified by the laboratory; however the compound or analyte should be considered non-detected at the reported concentration due to the presence of contaminants detected in the associated blank(s).
UJ (Non-detected estimated): The compound or analyte was reported as not detected by the laboratory; however the reported quantitation/detection limit is estimated due to non-conformances discovered during data validation.
R (Rejected): The sample results were rejected due to gross non-conformances discovered during data validation. Data qualified as rejected is not usable.
NA (Not Applicable): The non-conformance discovered during data validation demonstrates a high bias, while the affected compound or analyte in the associated sample(s) was reported as not detected by the laboratory and did not warrant the qualification of the data.
A qualification summary table is provided at the end of this report if data has been qualified. Flags are classified as P (protocol) or A (advisory) to indicate whether the flag is due to a laboratory deviation from a specified protocol or is of technical advisory nature.
3 V:\LOGIN\AECOM\ANDERSEN\42338E5_A34.DOC
Qualification Code Reference
H Holding times were exceeded.
S Surrogate recovery was outside QC limits.
C Calibration °/oRSD, r, r2 or 0/oD were noncompliant.
R Calibration RRF was <0.05.
B Presumed contamination from preparation (method blank).
L Laboratory Control Sample/Laboratory Control Sample Duplicate o/oR or RPD was not within control limits.
Q MS/MSD recovery was poor.
E MS/MSD or Duplicate RPD was high.
Internal standard performance was unsatisfactory.
M Instrument Performance Check (BFB or DFTPP) was noncompliant.
T Presumed contamination from trip blank.
F Presumed contamination from FB or ER.
D The analysis with this flag should not be used because another more technically sound analysis is available.
P Instrument performance for pesticides was poor.
V Unusual problems found with the data not defined elsewhere. Description of the problem can be found in the validation report.
4 V:\LOGIN\AECOM\ANDERSEN\42338E5_A34.DOC
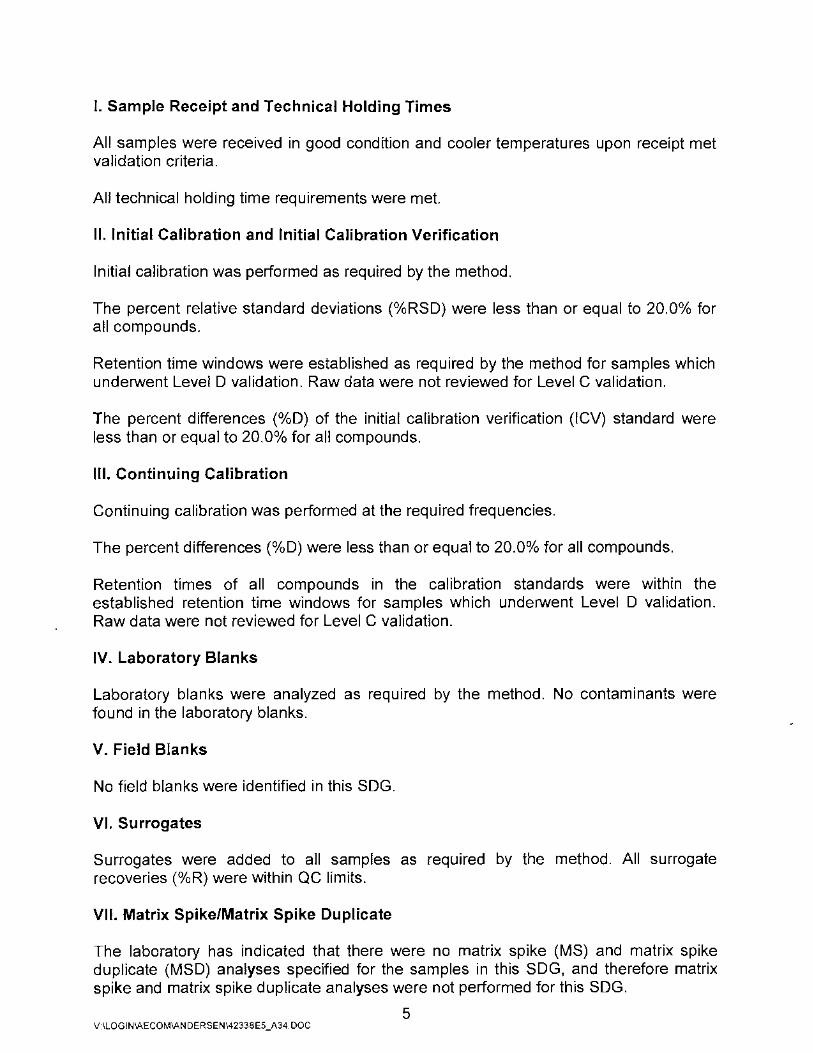
I. Sample Receipt and Technical Holding Times
All samples were received in good condition and cooler temperatures upon receipt met validation criteria.
All technical holding time requirements were met.
II. Initial Calibration and Initial Calibration Verification
Initial calibration was performed as required by the method.
The percent relative standard deviations (0/oRSD) were less than or equal to 20.0% for all compounds.
Retention time windows were established as required by the method for samples which underwent Level D validation. Raw data were not reviewed for Level C validation.
The percent differences (o/oD) of the initial calibration verification (ICV) standard were less than or equal to 20.0% for all compounds.
Ill. Continuing Calibration
Continuing calibration was performed at the required frequencies.
The percent differences (0/oD) were less than or equal to 20.0o/o for all compounds.
Retention times of all compounds in the calibration standards were within the established retention time windows for samples which underwent Level D validation. Raw data were not reviewed for Level C validation.
IV. Laboratory Blanks
Laboratory blanks were analyzed as required by the method. No contaminants were found in the laboratory blanks.
V. Field Blanks
No field blanks were identified in this SDG.
VI. Surrogates
Surrogates were added to all samples as required by the method. All surrogate recoveries (0/oR) were within QC limits.
VII. Matrix Spike/Matrix Spike Duplicate
The laboratory has indicated that there were no matrix spike (MS) and matrix spike duplicate (MSD) analyses specified for the samples in this SDG, and therefore matrix spike and matrix spike duplicate analyses were not performed for this SDG.
5 V:\LOG I N\AECOM\AN D ERS EN\42338 E5 _A34. DOC
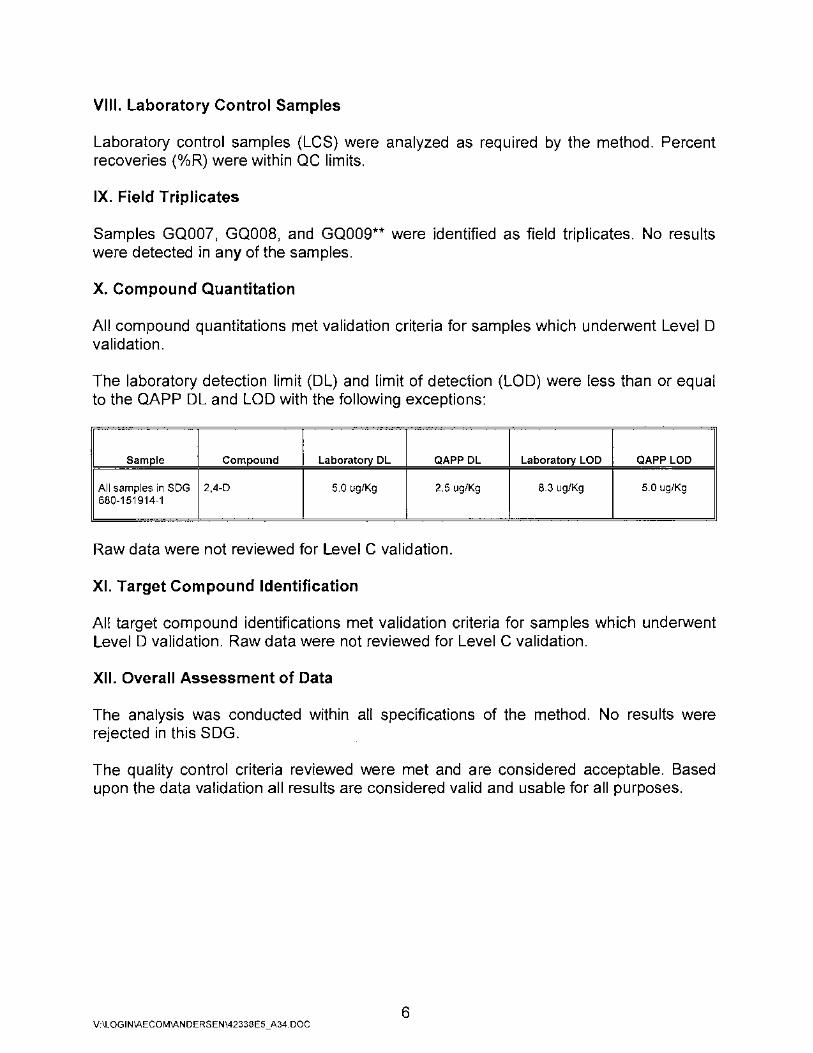
VIII. Laboratory Control Samples
Laboratory control samples (LCS) were analyzed as required by the method. Percent recoveries (%R) were within QC limits.
IX. Field Triplicates
Samples GQOO?, GQ008, and GQ009** were identified as field triplicates. No results were detected in any of the samples.
X. Compound Quantitation
All compound quantitations met validation criteria for samples which underwent Level D validation.
The laboratory detection limit (DL) and limit of detection (LOD) were less than or equal to the QAPP DL and LOD with the following exceptions:
Sample Compound Laboratory DL QAPP DL Laboratory LOD QAPP LOD
All samples in SDG 2,4-D 5.0 ug/Kg 2.5 ug/Kg 8.3 ug/Kg 5.0 ug/Kg 680-151914-1
Raw data were not reviewed for Level C validation.
XI. Target Compound Identification
All target compound identifications met validation criteria for samples which underwent Level D validation. Raw data were not reviewed for Level C validation.
XII. Overall Assessment of Data
The analysis was conducted within all specifications of the method. No results were rejected in this SDG.
The quality control criteria reviewed were met and are considered acceptable. Based upon the data validation all results are considered valid and usable for all purposes.
6 V:\LOG I N\AECOM\AN DERSEN\42338 E5 _A34. DOC
Andersen AFB, CTO JQ13 2,4-D & 2,4,5-T - Data Qualification Summary - SDG 680-151914-1
No Sample Data Qualified in this SDG
Andersen AFB, CTO JQ13 2,4-D & 2,4,5-T - Laboratory Blank Data Qualification Summary - SDG 680-151914-1
No Sample Data Qualified in this SDG
Andersen AFB, CTO JQ13 2,4-D & 2,4,5-T - Field Blank Data Qualification Summary - SDG 680-151914-1
No Sample Data Qualified in this SDG
7 V:\LOGIN\AECOM\ANDERSEN\42338E5 _A34. DOC
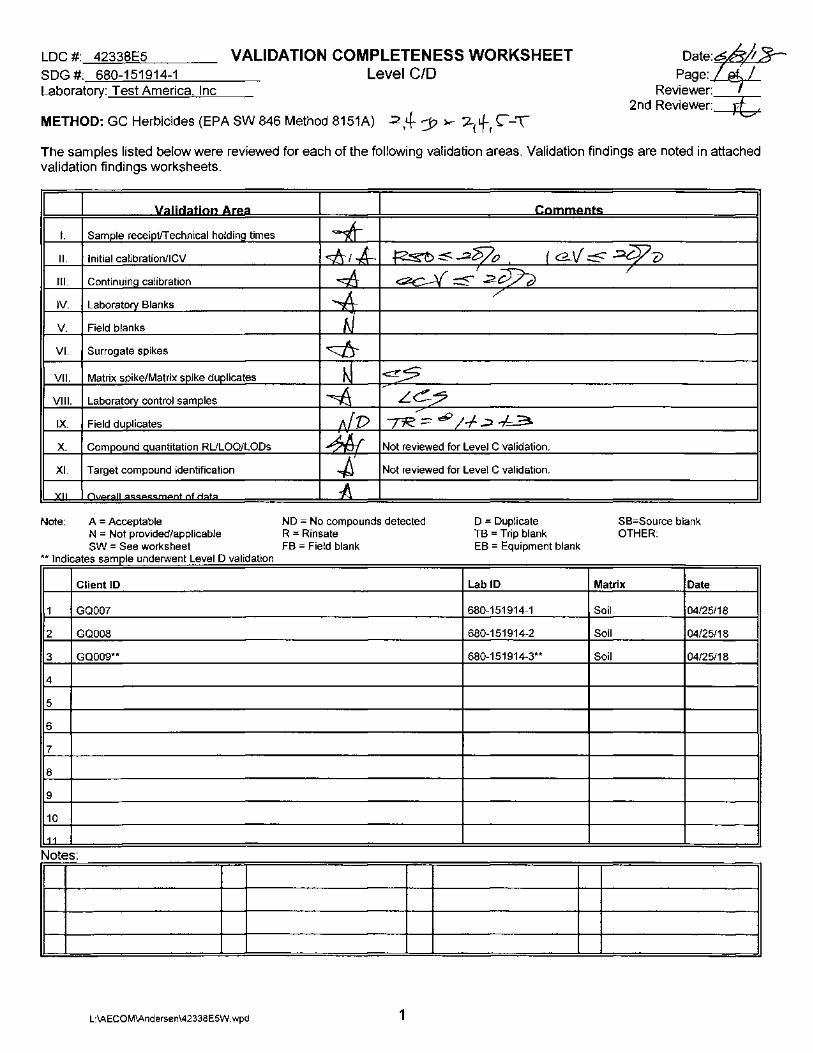
LDC #: 42338E5
SDG #: 680-151914-1 Laboratory: Test America. Inc
VALIDATION COMPLETENESS WORKSHEET Level C/O
METHOD: GC Herbicides (EPA SW 846 Method 8151A) .2 f+ j? ,.._ 7--(fr C' -"\
Date:~ Page:Lif:.L.
Reviewer:_·-,---.-2nd Reviewer: J16,,
The samples listed below were reviewed for each of the following validation areas. Validation findings are noted in attached validation findings worksheets.
I I I.
II.
Ill.
IV.
V.
VI.
VII.
VIII.
IX.
X.
XI.
)(II
Note:
llalidatico Ama
Sample receipt/Technical holding times
Initial calibration/ICV
Continuing calibration
Laboratory Blanks
Field blanks
Surrogate spikes
Matrix spike/Matrix spike duplicates
Laboratory control samples
Field duplicates
Compound quantitation RULOQ/LODs
Target compound identification
()"""r::.ll nf rl::.t::.
A = Acceptable N = Not provided/applicable SW = See worksheet
**Indicates sample underwent Level D validation
Client ID
1 GQ007
2 GQ008
3 GQ009**
4
5
6
7
8
9
10
11
Notes:
L:\AECOM\Andersen\42338ESW.wpd
I I Ccmmeots
~ <:At .A- ~::5-2~&? ( <2-'./ :5 .:::0/ {) ~ ~~':;?__CT?d
/
-..A /
tJ ~
N ~5 ~ L~?
AID /
!R :::: ~I .f ~ --k..3
4r Not reviewed for Level C validation .
.JJ' Not reviewed for Level C validation.
-A ND = No compounds detected R = Rinsate
D =Duplicate TB = Trip blank
SB=Source blank OTHER:
FB = Field blank EB = Equipment blank
LabiD Matrix Date
680-151914-1 Soil 04/25/18
680-151914-2 Soil 04/25/18
680-151914-3** Soil 04/25/18
1
I

Method: I GC
Level IV checklist GC_HPLC rev01.wpd
VALIDATION FINDINGS CHECKLIST
PLC
Page:_f_of£5_ Reviewer:~
2nd Reviewer:_---"~~--=:;_
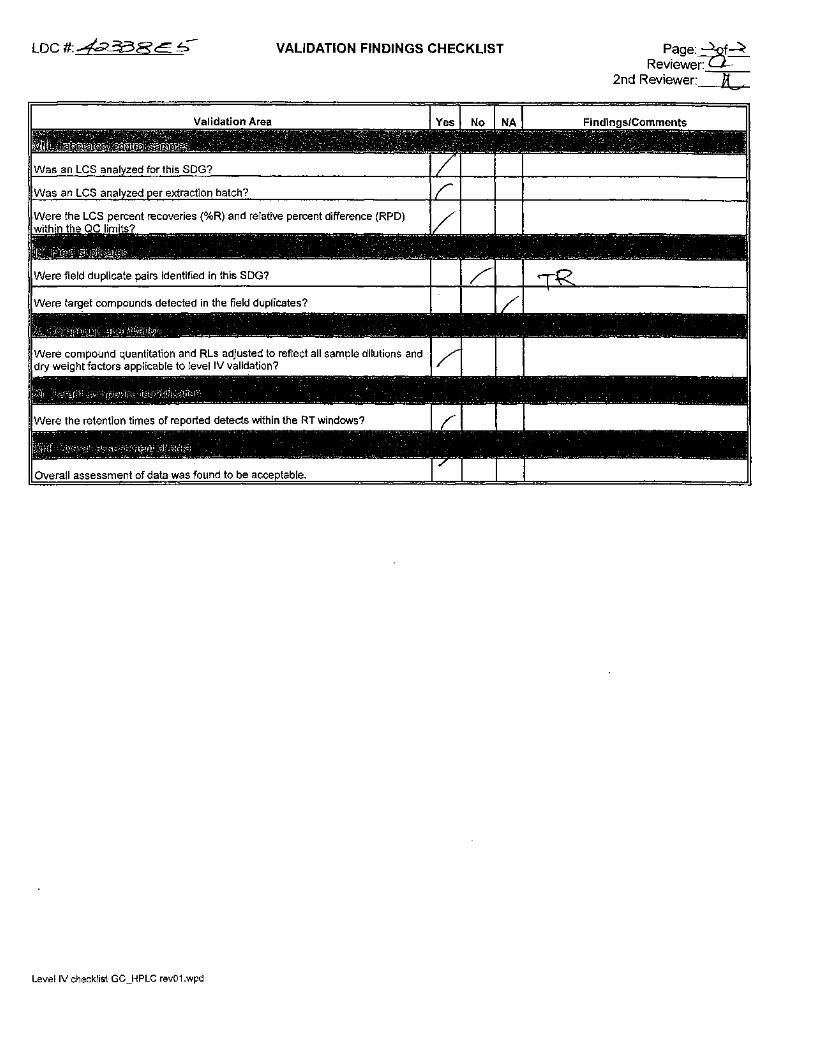
LDC #: ~338C.. .=;-- VALIDATION FINDINGS CHECKLIST
Overall assessment of:data was found to be
Level IV check!ist GC_HPLC rev01.wpd
Page:~f~ Reviewer:o=
-~-
2nd Reviewer: ll . ........
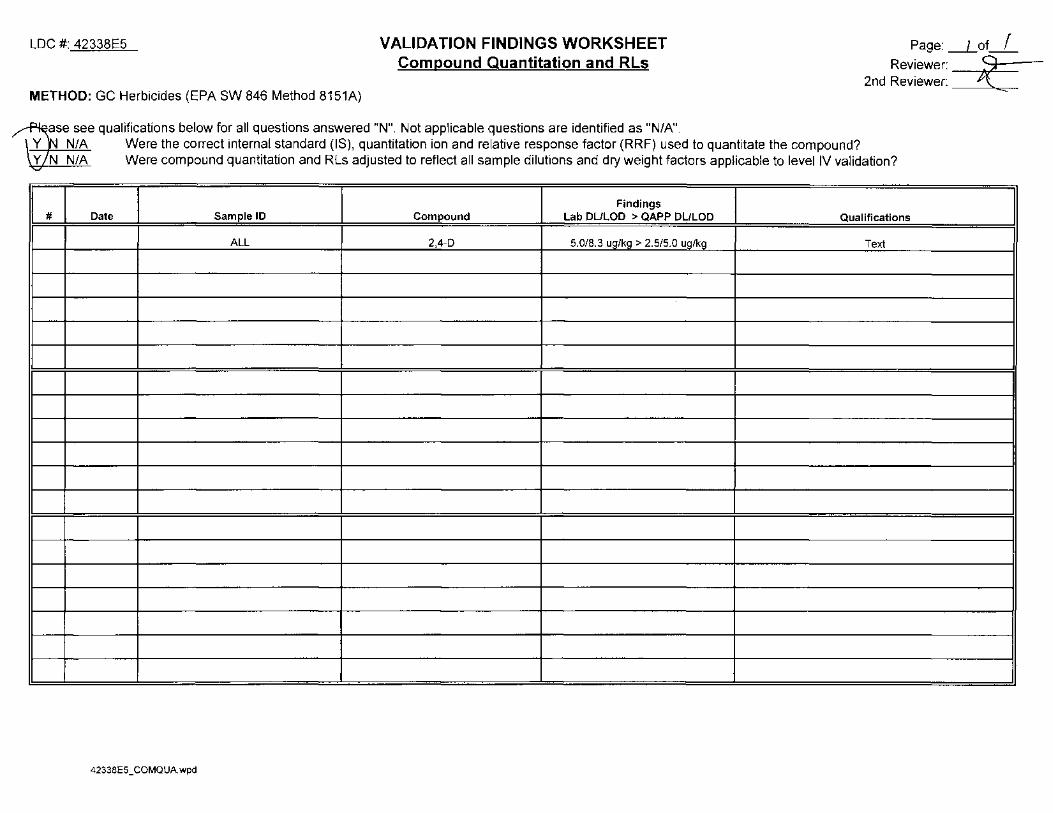
LDC #: 42338E5
METHOD: GC Herbicides (EPA SW 846 Method 8151A)
VALIDATION FINDINGS WORKSHEET Compound Quantitation and Rls
ase see qualifications below for all questions answered "N". Not applicable questions are identified as "N/A".
Page: __J_of_L Reviewer: ----.9:=:
2nd Reviewer:~
Y N/A Were the correct internal standard (IS), quantitation ion and relative response factor (RRF) used to quantitate the compound? Y N N/A Were compound quantitation and Rls adjusted to reflect all sample dilutions and dry weight factors applicable to level IV validation?
Findings # Date Sample ID Compound Lab DULOD > QAPP DULOD Qualifications
I I I ALL I 2,4-D I 5.0/8.3 u~/kg > 2.5/5.0 ug/k~ I Text I
42338E5_ COM QUA. wpd
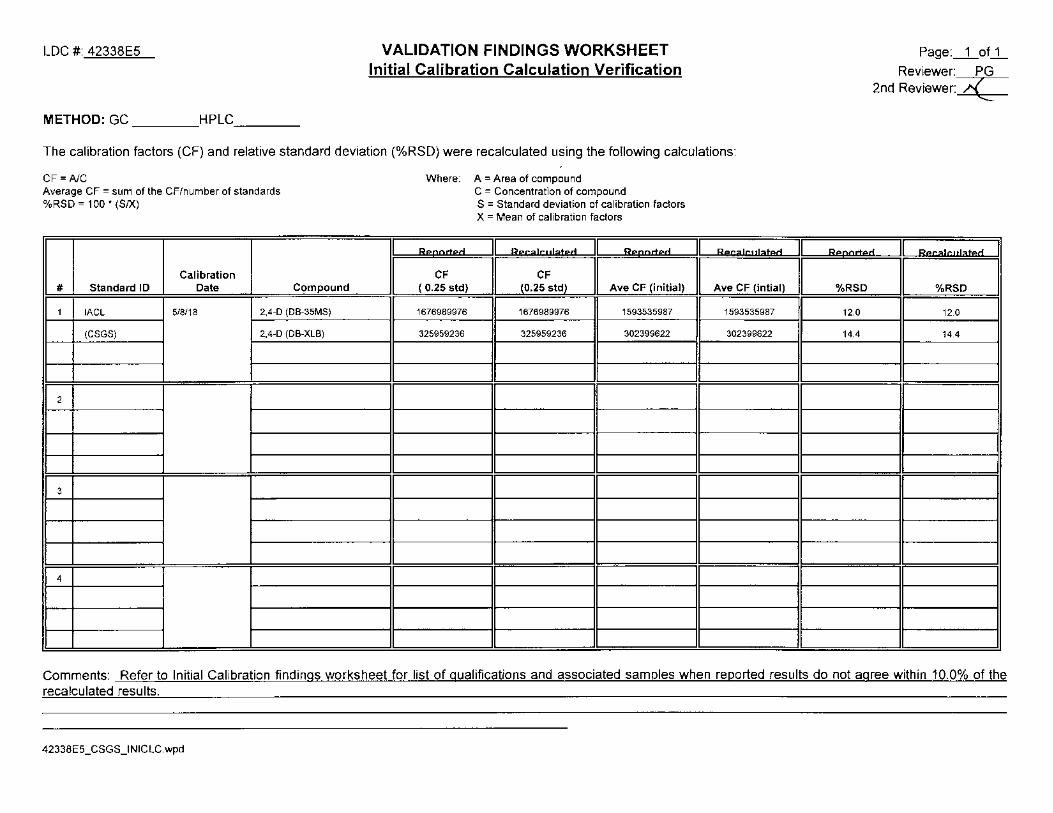
LDC #: 42338E5
METHOD: GC HPLC __ _
VALIDATION FINDINGS WORKSHEET Initial Calibration Calculation Verification
The calibration factors (CF) and relative standard deviation (%RSD) were recalculated using the following calculations:
CF = AIC Average CF = sum of the CF/number of standards %RSD = 100 * (SIX)
- -- -·--·--
Calibration # Standard ID Date Compound
1 IACL 5/8/18 2,4-D (DB-35MS)
(CSGS) 2,4-D (DB-XLB)
2
3
I 4 I I I
Where: A = Area of compound
.... ....
CF ( 0.25 std)
1676989976
325959236
C = Concentration of compound S = Standard deviation of calibration factors X = Mean of calibration factors
I eecalc111ated I .... ....
I CF
I (0.25 std) Ave CF (initial)
1676989976 1593535987
325959236 302399622
II ____ H ___ ~I II
I eecalc11lated
Ave CF (intial)
1593535987
302399622
II
Page:_1_of_1_
Reviewer: PG 2nd Reviewer:~
IEJI eecalc11lated I
%RSD I I %RSD
12.0 12.0
14.4 14.4
II IL ____ _]
Comments: Refer to Initial Calibration findings worksheet for list of qualifications and associated samples when reported results do not agree within 10.0% of the recalculated results.
42338E5_CSGS_INICLC.wpd
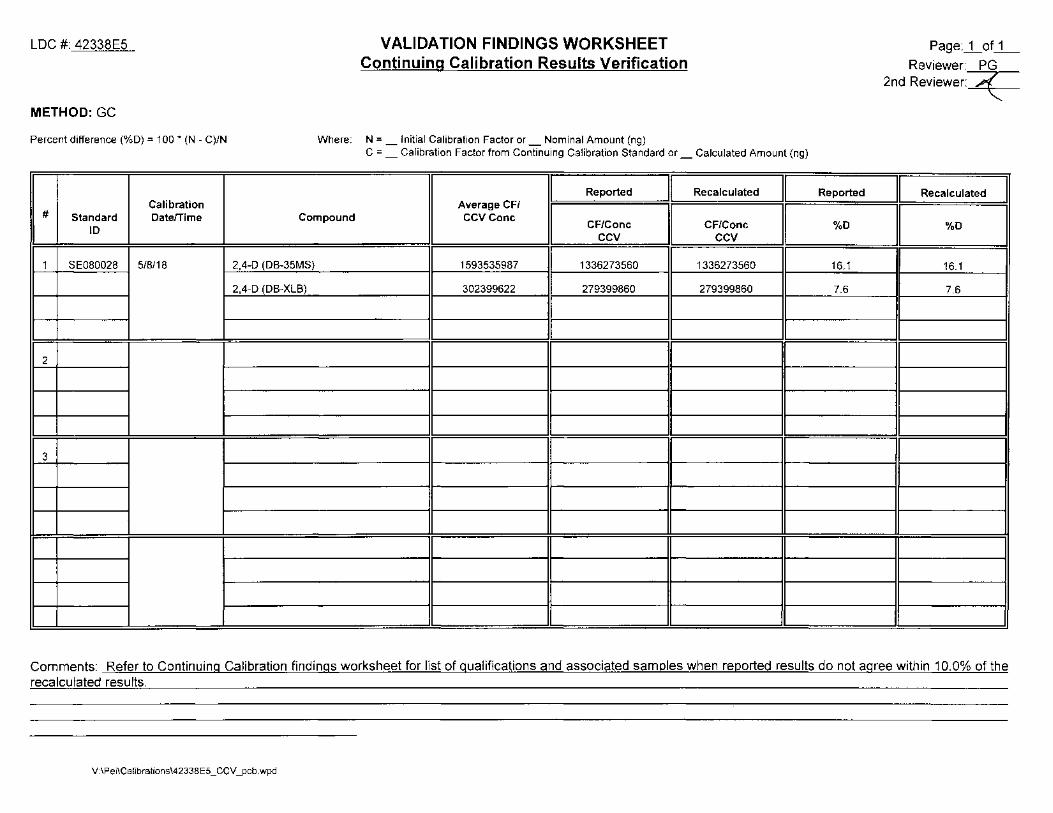
LDC #: 42338E5
METHOD:GC
Percent difference (%D) = 100 * (N - C)/N
Calibration # Standard Date/Time
ID
1 SE080028 5/8/18
2
I 3 I I I
VALIDATION FINDINGS WORKSHEET Continuing Calibration Results Verification
Where: N = _ Initial Calibration Factor or_ Nominal Amount (ng) C =_Calibration Factor from Continuing Calibration Standard or_ Calculated Amount (ng)
- -------
I Reported II Recalculated II Average CF/
I II II Compound CCVConc
CF/Conc CF/Conc CCV CCV
2,4-D (DB-35MS) 1593535987 1336273560 1336273560
2,4-D (DB-XLB) 302399622 279399860 279399860
II II II II
Reported
%0
16.1
7.6
Page:_1_of_1 _
Reviewer: PG 2nd Reviewer:+
II Recalculated I
II %0
I 16.1
7.6
IL I
Comments: Refer to Continuing Calibration findings worksheet for list of qualifications and associated samples when reported results do not agree within 10.0% of the recalculated results.
V:\Pei\Calibrations\42338E5 _CCV _pcb. wpd
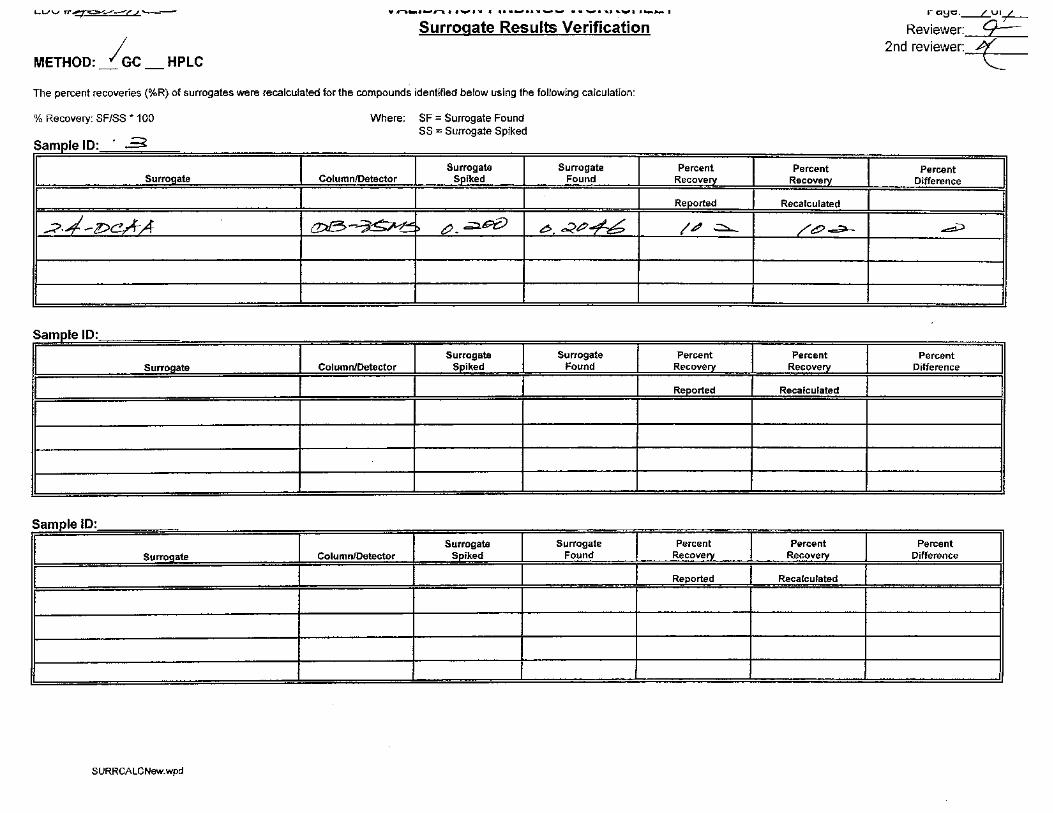
L.LJ\J ,.,.~-r,t-.o--
Surrogate Results Verification
METHOD: _!GC HPLC
The percent recoveries (%R) of surrogates were recalculated for the compounds identified below using the following calculation:
%Recovery: SF/SS * 100
Samo.le 10~ · ..3
Surro ate
II
ii.:<.-4-P~A
Sample 10·
Surro ate
I
Sample 10· --------
II Surrogate
II
II
SURRCALCNew. wpd
I
Where: SF = Surrogate Found SS =Surrogate Spiked
Column/Detector
I ,. a:e>-~_.$ t:). ~G£)
Column/Detector
I I Surrogate I Column/Detector Spiked
I I I I I I
Surrogate Found
b. c:<tP+6
Surrogate Found
Surrogate I Found
I I
Reeorted Recalculated
I~ ~ /ttP~
Reeorted Recalculated
Percent I Percent Recovery Recovery
Reeorted I Recalculated
I
I I I
1- c:I~C._____£_ U 1-,L--
Reviewer: 9::= 2nd reviewer:~
Percent Difference
~
Percent Difference
I
Percent l Difference
I I

LDC #~-;f?!Z1C::5" VALIUA IIUN r-INUINu'> VVUKr\'>Mt:t: I
Laboratory Control Sample/Laboratory Control Sample Duplicate Results Verification t-'age:_LOTL
Reviewer: Cf--2nd Reviewer:~
METHOD: ~C _HPLC
The percent recoveries (%R) and Relative Percent difference (RPD) of the laboratory control sample and laboratory control sample duplicate were recalculated for the compounds identified below using the following calculation:
% Recovery = 1 00* (SSC-SC)/SA
RPD = I SSCLCS - SSCLCSD I * 2/(SSCLCS + SSCLCSD)
LCS/LCSD samples: 6C!-tt:> ~~__c;;;f.. I
Gasoline (8015)
Diesel (8015)
Benzene (8021 B)
Methane (RSK-175)
2,4-D (8151) ~5>.4 _Lll_A-Dinoseb (8151)
Naphthalene (8310)
Anthracene (831 0)
HMX (8330)
2,4,6-Trinitrotoluene (8330)
Where: SSC = Spiked sample concentration SA = Spike added LCS = Laboratory control sample percent recovery
SC = Concentration
LCSD =Laboratory control sample duplicate percent recovery
LCS r LCSD 11 LCS/LCSD 1
Percent Recovery I Percent Recovery II RPD 11
LCS LCSD I Reported I Recalc. JJ Reported J Recai~:=JL~~~rted J Recalc. I
4.-J_. s- AM= b -:!J- 68-
Comments: Refer to Laboratory Control Sample/Laboratory Control Sample Duplicate findings worksheet for list of qualifications and associated samples when reported results do not aaree within 10.0% of the recalculated results. ,
V:\Validation Worksheets\GC\LCSDCLC _ GC. wpd
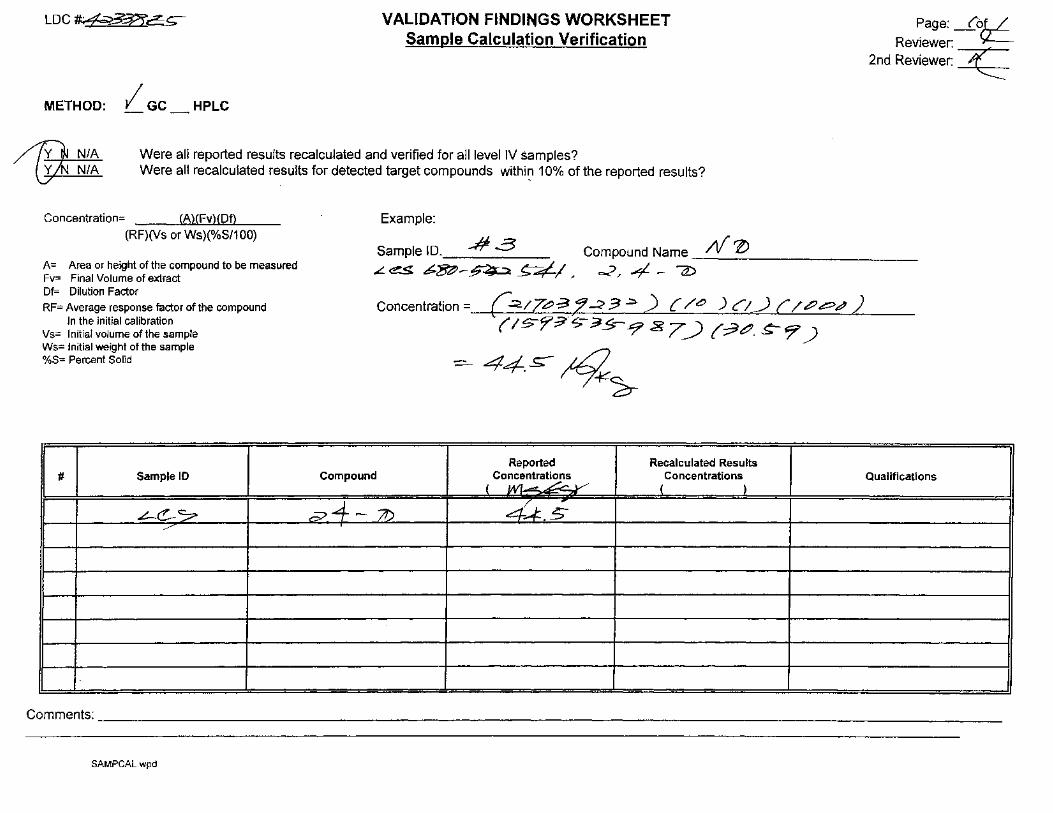
LDC~.::pf~ VALIDATION FINDINGS WORKSHEET Sample Calculation Verification
METHOD:
~ ,~
I GC HPLC
Were all reported results recalculated and verified for all level IV samples? Were all recalculated results for detected target compounds withi~ 10% of the reported results?
Concentration= (A)(Fv)(Df) Example: (RF)(Vs or Ws)(o/oS/100)
Page:_{O~ Reviewer:~
2nd Reviewer:~
A= Area or height of the compound to be measured Fv= Final Volume of extract
Sample 10. -# 3 .L es ~~-~~~I~
Compound Name .llf 'l) o.?~ 4 - ?.::>-:------------
Df= Dilution Factor
RF= Average response factor of' the compound In the initial calibration
Vs= Initial volume of the sample Ws= Initial weight of the sample %8= Percent Solid
# Sample ID
~<:!-7 _/
Compound
Concentration= c=~/7~-3,'2~ 3 ~) {" /t!:> ) c/_) C/Pe::::>e/1) (lf?'?3's-i3->-9 8 7_) (-3~.~~ ~
- 44-. .s:-~2r
Reported Recalculated Results Concentrations Concentrations
( Wl-~~ ( )
0/_4- 7D 4_,.;.. 5-
Quali'fications
Comments:---------------------------------------------------------------------------------------------------------------
SAMPCAL.wpd
I
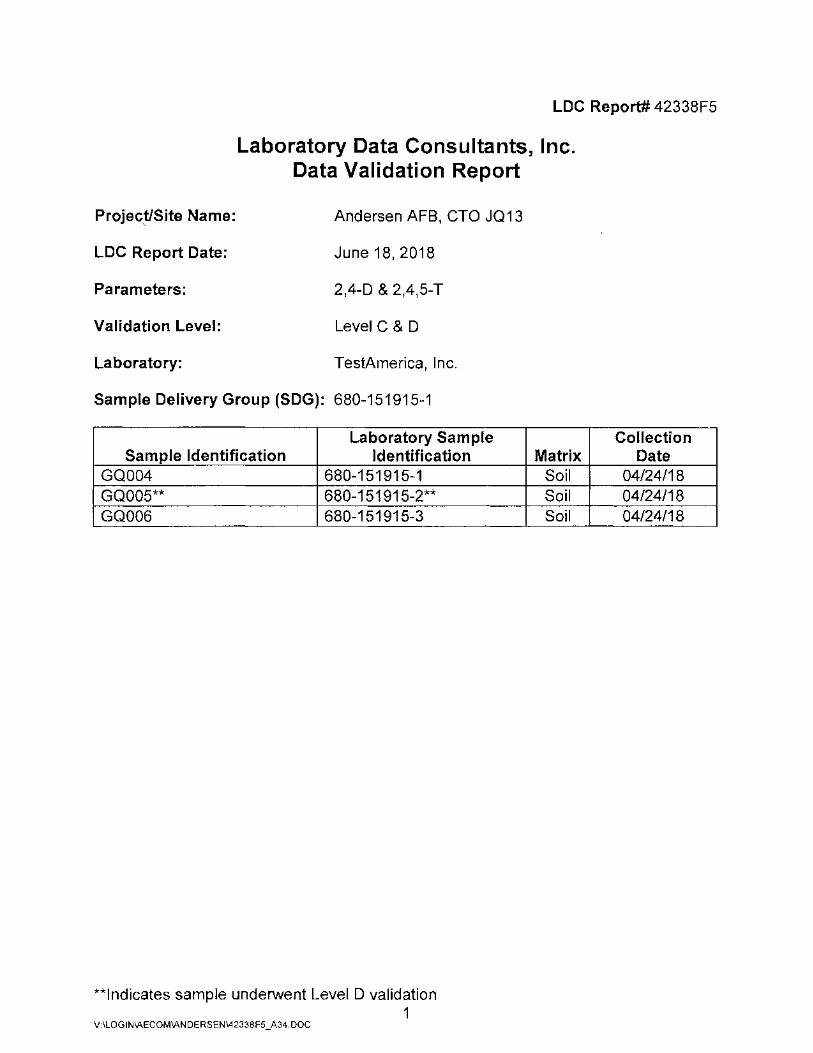
LDC Report# 42338F5
Laboratory Data Consultants, Inc. Data Validation Report
Project/Site Name: '
Andersen AFB, CTO JQ13
LDC Report Date: June 18, 2018
Parameters: 2,4-D & 2,4,5-T
Validation Level: Level C & D
Laboratory: TestAmerica, Inc.
Sample Delivery Group (SDG): 680-151915-1
Laboratory Sample Sample Identification Identification
GQ004 680-151915-1 GQ005** 680-151915-2** GQ006 680-151915-3
**Indicates sample underwent Level D validation 1
V:\LOGIN\AECOM\ANDERSEN\42338F5_A34.DOC
Collection Matrix Date
Soil 04/24/18 Soil 04/24/18 Soil 04/24/18
Introduction
This Data Validation Report (DVR) presents data validation findings and results for the associated samples listed on the cover page. Data validation was performed in accordance with the Final Work Plan for Limited Investigation into Alleged Herbicide Orange Use at Three Sites, Andersen Air Force Base (AFB), Guam (March 2018), the Project Procedures Manual, U.S. Naval Facilities Engineering Command (NAVFAC) Environmental Restoration (ER) Program, NAVFAC Pacific (DON 2015), and the U.S. Department of Defense (DoD) Quality Systems Manual (QSM) for Environmental Laboratories, Version 5.1 (2017). Where specific guidance was not available, the data has been evaluated in a conservative manner consistent with industry standards using professional experience.
The analyses were performed by the following method:
2,4-D and 2,4,5-T by Environmental Protection Agency (EPA) SW 846 Method 8151A
All sample results were subjected to Standard data validation, which comprises an evaluation of quality control (QC) summary results. Samples appended with a double asterisk on the cover page were subjected to Full data validation, which is comprised of the QC summary forms as well as the raw data, to confirm sample quantitation and
. identification.
2 V:\LOGIN\AECOM\ANDERSEN\42338F5_A34.DOC

The following are definitions of the data qualifiers utilized during data validation:
J (Estimated): The compound or analyte was analyzed for and positively identified by the laboratory; however the reported concentration is estimated due to nonconformances discovered during data validation.
U (Non-detected): The compound or analyte was analyzed for and positively identified by the laboratory; however the compound or analyte should be considered non-detected at the reported concentration due to the presence of contaminants detected in the associated blank(s).
UJ (Non-detected estimated): The compound or analyte was reported as not detected by the laboratory; however the reported quantitation/detection limit is estimated due to non-conformances discovered during data validation.
R (Rejected): The sample results were rejected due to gross non-conformances discovered during data validation. Data qualified as rejected is not usable.
NA (Not Applicable): The non-conformance discovered during data validation demonstrates a high bias, while the affected compound or analyte in the associated sample(s) was reported as not detected by the laboratory and did not warrant the qualification of the data.
A qualification summary table is provided at the end of this report if data has been qualified. Flags are classified as P (protocol) or A (advisory) to indicate whether the flag is due to a laboratory deviation from a specified protocol or is of technical advisory nature.
3 V:\LOGIN\AECOM\ANDERSEN\42338F5_A34.DOC

Qualification Code Reference
H Holding times were exceeded.
S Surrogate recovery was outside QC limits.
C Calibration °/oRSD, r, r2 or o/oD were noncompliant.
R Calibration RRF was <0.05.
B Presumed contamination from preparation (method blank).
L Laboratory Control Sample/Laboratory Control Sample Duplicate %R or RPD was not within control limits.
Q MS/MSD recovery was poor.
E MS/MSD or Duplicate RPD was high.
Internal standard performance was unsatisfactory.
M Instrument Performance Check (BFB or DFTPP) was noncompliant.
T Presumed contamination from trip blank.
F Presumed contamination from FB or ER.
D The analysis with this flag should not be used because another more technically sound analysis is available.
P Instrument performance for pesticides was poor.
V Unusual problems found with the data not defined elsewhere. Description of the problem can be found in the validation report.
4 V:\LOGIN\AECOM\ANDERSEN\42338F5_A34.DOC
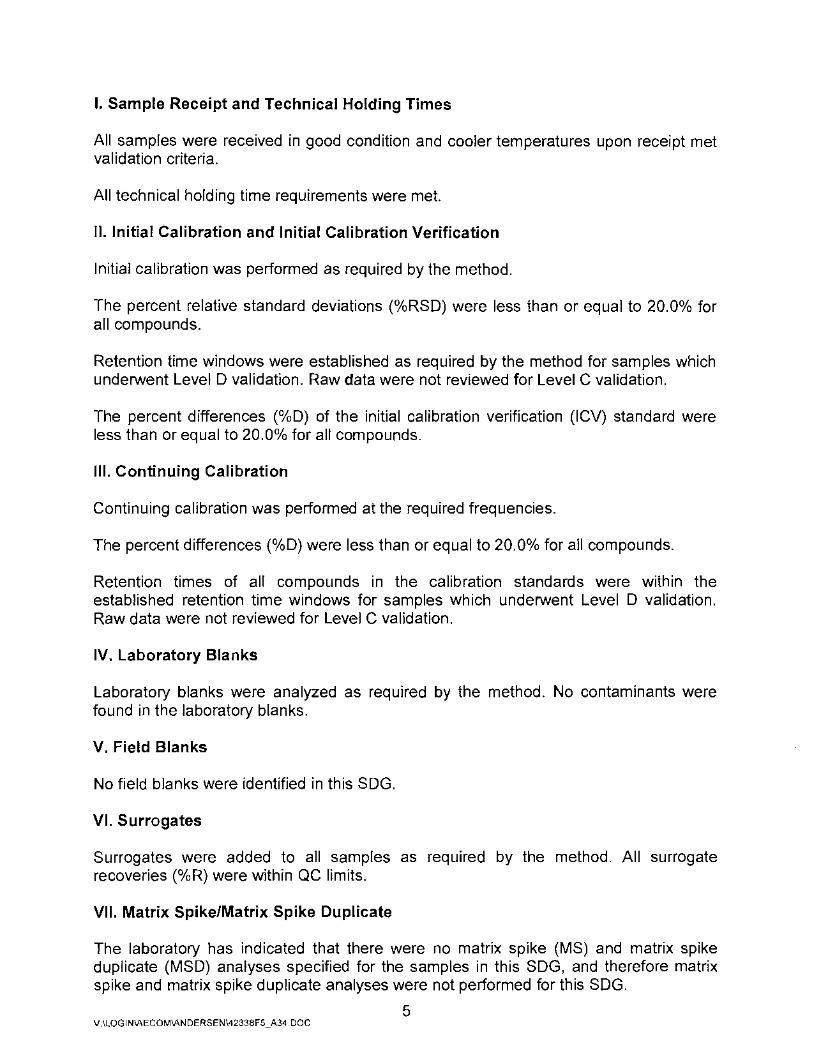
I. Sample Receipt and Technical Holding Times
All samples were received in good condition and cooler temperatures upon receipt met validation criteria.
All technical holding time requirements were met.
II. Initial Calibration and Initial Calibration Verification
Initial calibration was performed as required by the method.
The percent relative standard deviations (0/oRSD) were less than or equal to 20.0o/o for all compounds.
Retention time windows were established as required by the method for samples which underwent Level D validation. Raw data were not reviewed for Level C validation.
The percent differences (o/oD) of the initial calibration verification (ICV) standard were less than or equal to 20.0°/o for all compounds.
Ill. Continuing Calibration
Continuing calibration was performed at the required frequencies.
The percent differences (0/oD) were less than or equal to 20.0°/o for all compounds.
Retention times of all compounds in the calibration standards were within the established retention time windows for samples which underwent Level D validation. Raw data were not reviewed for Level C validation.
IV. Laboratory Blanks
Laboratory blanks were analyzed as required by the method. No contaminants were found in the laboratory blanks.
V. Field Blanks
No field blanks were identified in this SDG.
VI. Surrogates
Surrogates were added to all samples as required by the method. All surrogate recoveries (0/oR) were within QC limits.
VII. Matrix Spike/Matrix Spike Duplicate
The laboratory has indicated that there were no matrix spike (MS) and matrix spike duplicate (MSD) analyses specified for the samples in this SDG, and therefore matrix spike and matrix spike duplicate analyses were not performed for this SDG.
5 V:\LOGIN\AECOM\ANDERSEN\42338F5_A34.DOC
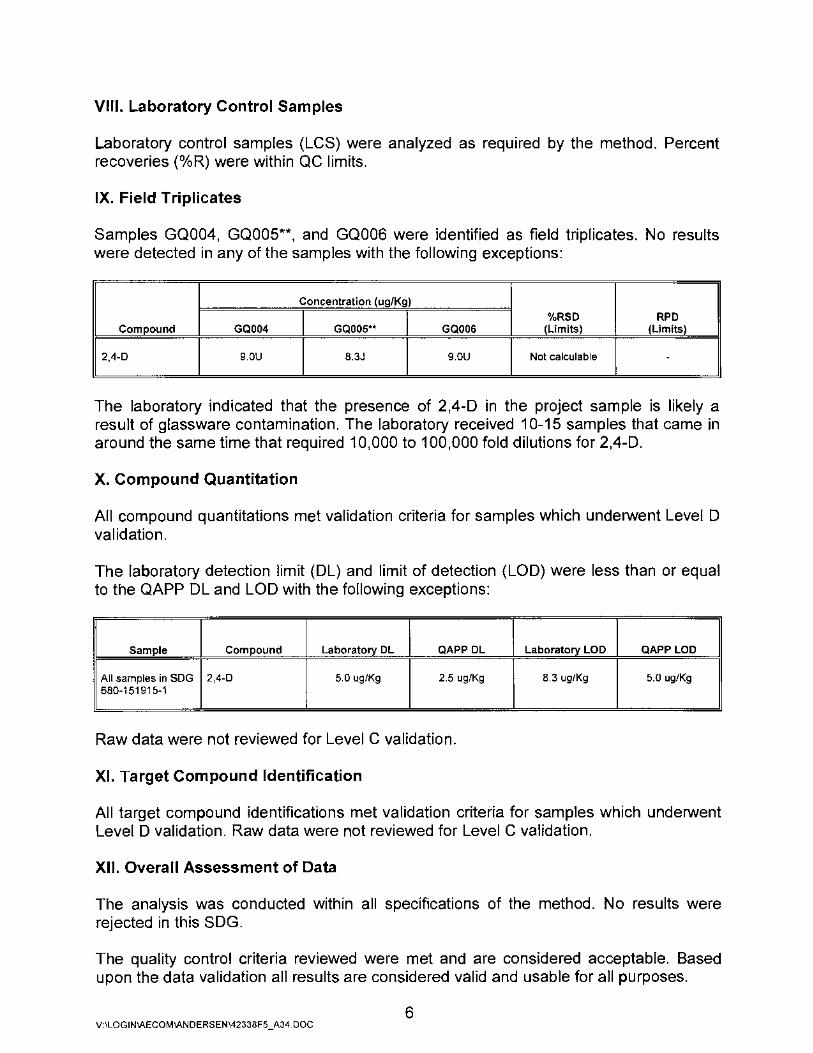
VIII. Laboratory Control Samples
Laboratory control samples (LCS) were analyzed as required by the method. Percent recoveries (0/oR) were within QC limits.
IX. Field Triplicates
Samples GQ004, GQOOS**, and GQ006 were identified as field triplicates. No results were detected in any of the samples with the following exceptions:
Concentration (ug/Kg)
I I %RSD RPD
Compound GQ004 GQ005** GQ006 (Limits) (Limits)
12,4-D I
9.0U
I 8.3J
I 9.0U
I Not calculable
I -
I
The laboratory indicated that the presence of 2,4-D in the project sample is likely a result of glassware contamination. The laboratory received 10-15 samples that came in around the same time that required 10,000 to 100,000 fold dilutions for 2,4-D.
X. Compound Quantitation
All compound quantitations met validation criteria for samples which underwent Level D validation.
The laboratory detection limit (DL) and limit of detection (LOD) were less than or equal to the QAPP DL and LOD with the following exceptions:
Sample Compound Laboratory DL QAPP DL Laboratory LOD QAPP LOD
All samples in SDG 2,4-D 5.0 ug/Kg 2.5 ug/Kg 8.3 ug/Kg 5.0 ug/Kg 680-151915-1
Raw data were not reviewed for Level C validation.
XI. Target Compound Identification
All target compound identifications met validation criteria for samples which underwent Level D validation. Raw data were not reviewed for Level C validation.
XII. Overall Assessment of Data
The analysis was conducted within all specifications of the method. No results were rejected in this SDG.
The quality control criteria reviewed were met and are considered acceptable. Based upon the data validation all results are considered valid and usable for all purposes.
6 V:\LOGIN\AECOM\ANDERSEN\42338F5_A34.DOC
Andersen AFB, CTO JQ13 2,4-D & 2,4,5-T - Data Qualification Summary - SDG 680-151915-1
No Sample Data Qualified in this SDG
Andersen AFB, CTO JQ13 2,4-D & 2,4,5-T - Laboratory Blank Data Qualification Summary - SDG 680-151915-1
No Sample Data Qualified in this SDG
Andersen AFB, CTO JQ13 2,4-D & 2,4,5-T- Field Blank Data Qualification Summary- SDG 680-151915-1
No Sample Data Qualified in this SDG
7 V:\LOGIN\AECOM\ANDERSEN\42338F5_A34.DOC
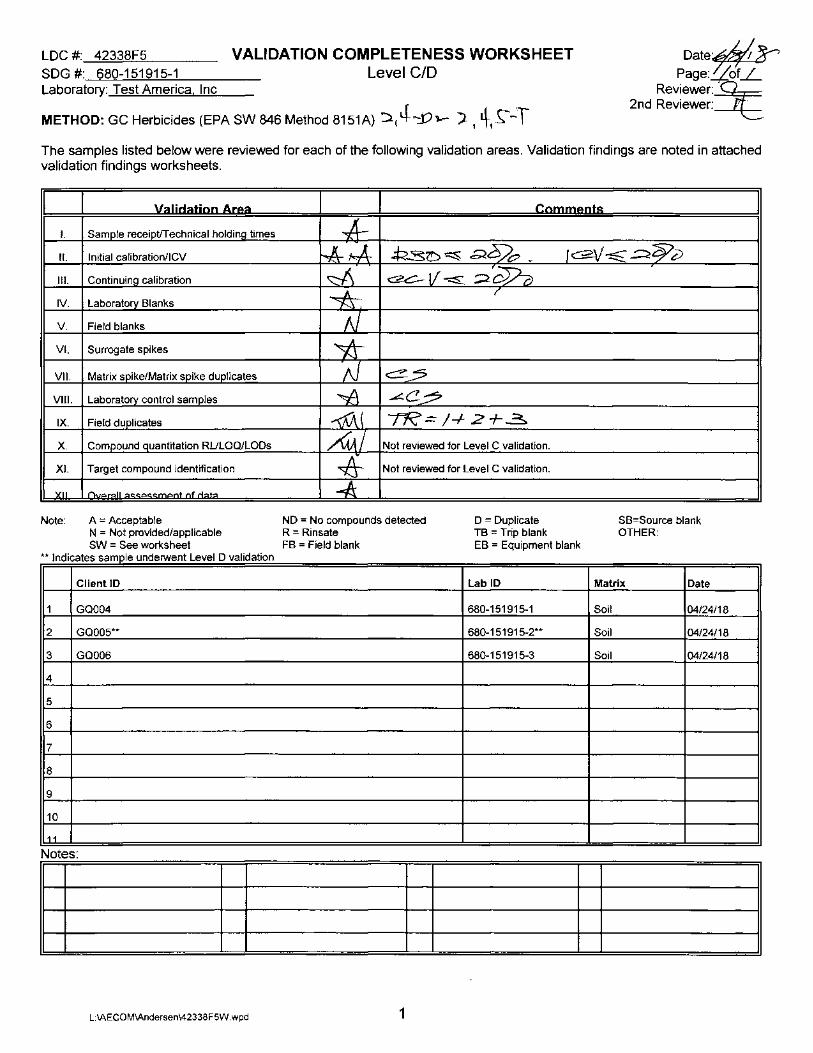
LDC #: 42338F5 SDG #: 680-151915-1 Laboratory: Test America. Inc
VALIDATION COMPLETENESS WORKSHEET Level C/O
METHOD: GC Herbicides (EPA SW 846 Method 8151A) :lc~"':D).- )-, ~,~-'f
Date~ Page:!b:otL
Reviewer:~ 2nd Reviewer:~
The samples listed below were reviewed for each of the following validation areas. Validation findings are noted in attached validation findings worksheets.
I I I.
II.
Ill.
IV.
V.
VI.
VII.
VIII.
IX.
X.
XI.
XII
Note:
llalidatiao A[ea
Sample receipt/Technical holding times
Initial calibration/ICV
Continuing calibration
Laboratory Blanks
Field blanks
Surrogate spikes
Matrix spike/Matrix spike duplicates
Laboratory control samples
Field duplicates
Compound quantitation RULOQ/LODs
Target compound identification
()vAr::.ll nf rl~t~
A = Acceptable N = Not provided/applicable SW = See worksheet
I d L I D l"d t" ** Indicates sample un erwent eve va1 a1on
Client ID
1 GQ004
2 GQ005**
3 GQ006
4
5
6
7
8
9
10
11
Notes:
L:\AECOM\Andersen\42338F5W.wpd
I I Cammeots
-A-4-·~ 4:<.3~ ~ ~6/~ - I G2l/ ~ .::=:<9/v ~ <2C- v -=:s: ~CJ?-a
* ' tJ ~ "tJ ~_:5
~ ~e?
-i!V\( -rR=/-+2+..3:. Ml Not reviewed for Level C validation.
~ Not reviewed for Level C validation.
-<A ND = No compounds detected R = Rinsate
D = Duplicate TB = Trip blank
SB=Source blank OTHER:
FB = Field blank EB = Equipment blank
LabiD Matrix Date
680-151915-1 Soil 04/24/18
680-151915-2** Soil 04/24/18
680-151915-3 Soil 04/24/18
1
I
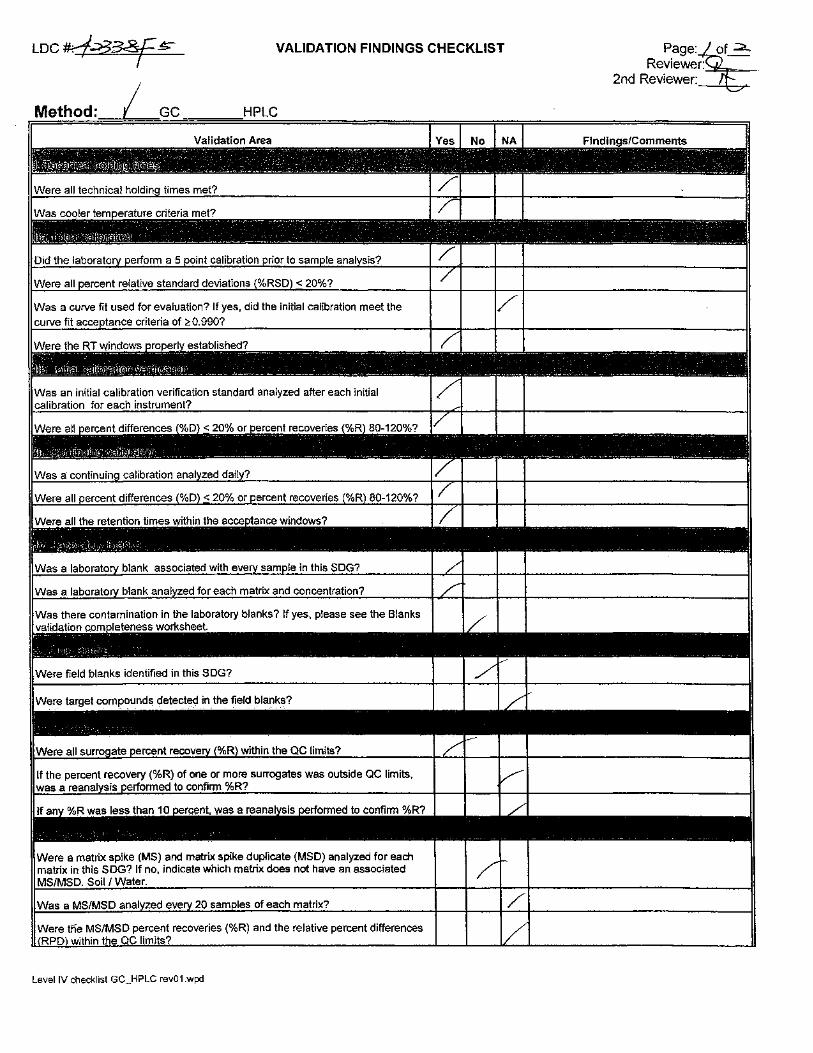
VALIDATION FINDINGS CHECKLIST Page:I?,CA Reviewer:
2nd Reviewer: , · .
Method: GC HPLC
Level IV checklist GC_HPLC rev01.wpd
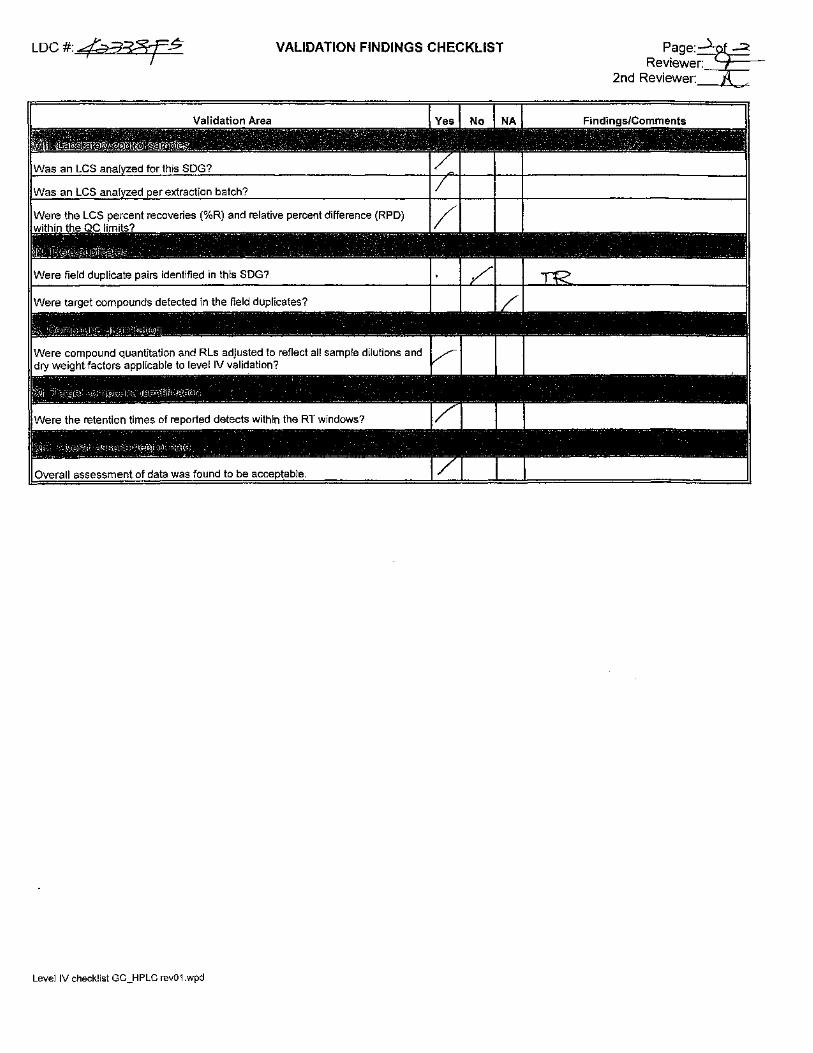
LDC#:4(aa~ VALIDATION FINDINGS CHECKLIST Page: )~= Reviewer:
2nd Reviewer: .
Overall assessment ofdata was found to be
Level IV checklist GC_HPLC rev01.wpd
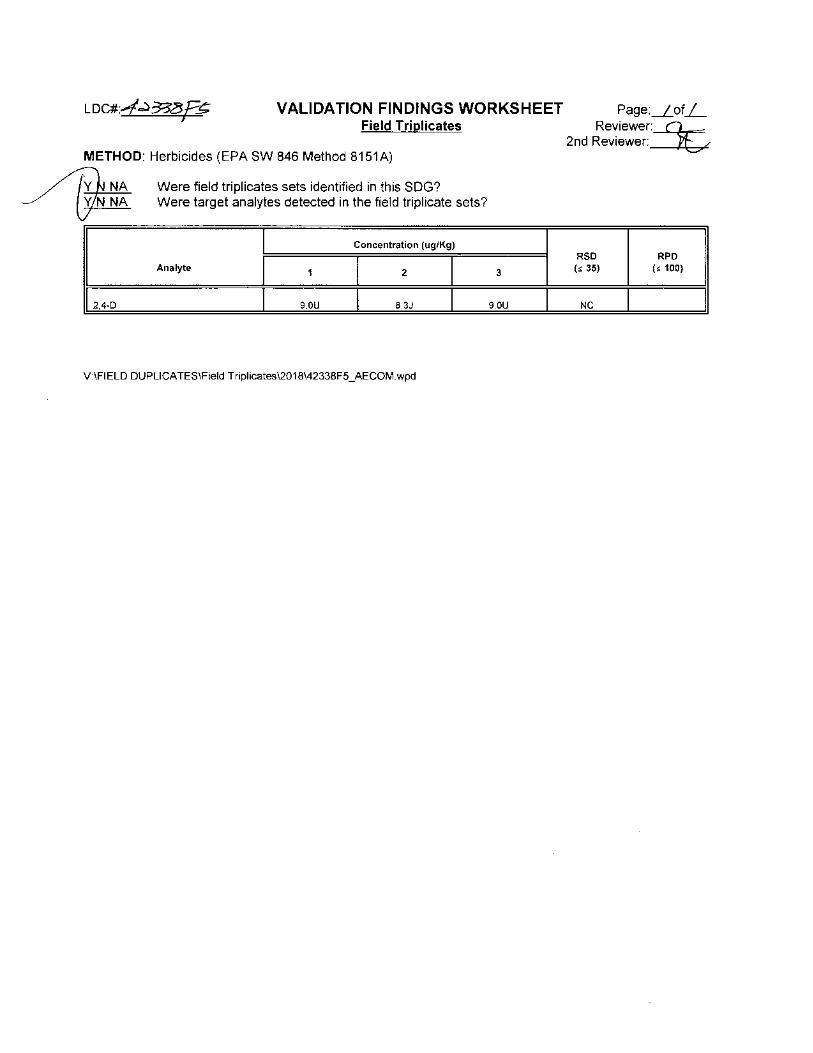
VALIDATION FINDINGS WORKSHEET Field Triplicates
METHOD: Herbicides (EPA SW 846 Method 8151A)
~ ·~ ~
12,4-D
Were field triplicates sets identified in this SDG? Were target analytes detected in the field triplicate sets?
Concentration (ug/Kg)
Analyte 1 I 2 I I 9.0U I 8.3J I
V:\FIELD DUPLICATES\Field Triplicates\2018\42338F5_AECOM.wpd
3
9.0U I
Page:_LofL Reviewer:~
2nd Reviewer:~
RSD RPD (~ 35) (~ 100)
NC I I
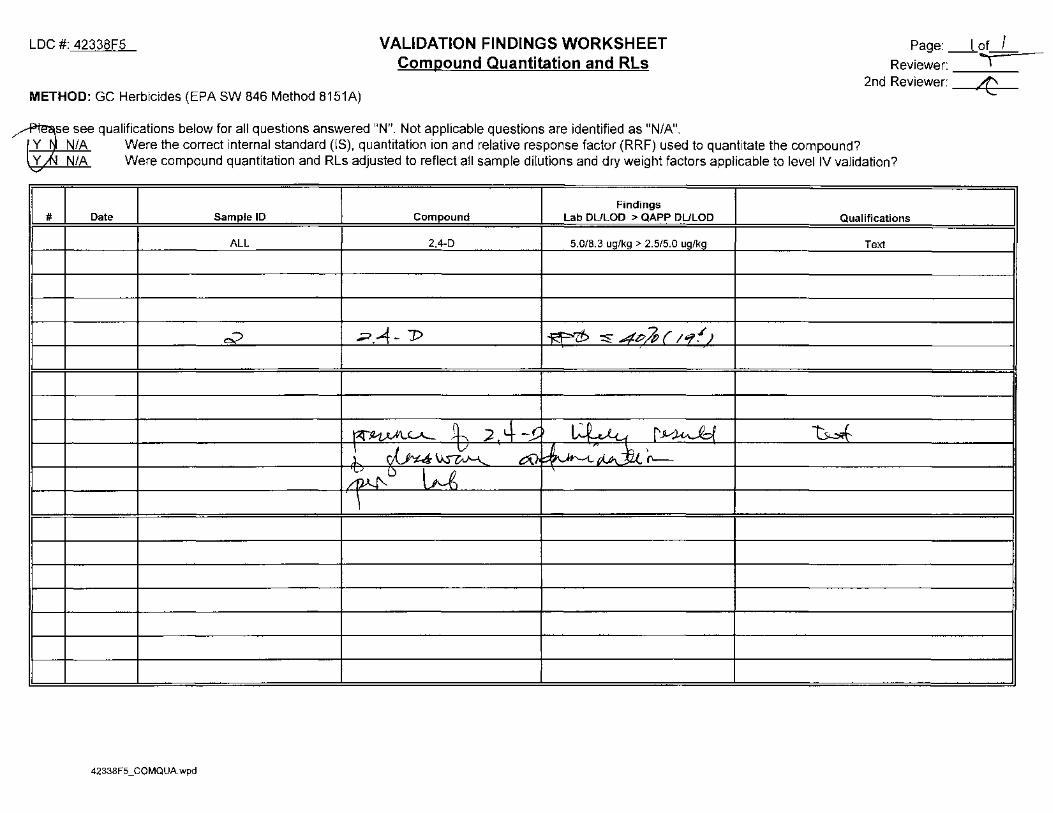
LDC #: 42338F5
METHOD: GC Herbicides (EPA SW 846 Method 8151A)
VALIDATION FINDINGS WORKSHEET Compound Quantitation and RLs
se see qualifications below for all questions answered 11 N11• Not applicable questions are identified as "N/A".
Page: __ l of_l Reviewer: l
2nd Reviewer: I(?·
. . N/A Were the correct internal standard (IS), quantitation ion and relative response factor (RRF) used to quantitate the compound? tv . ./~ N/A Were compound quantitation and Rls adjusted to reflect all sample dilutions and dry weight factors applicable to level IV validation?
Findings # Date Sample ID Compound Lab DLILOD > QAPP DLILOD Qualifications
ALL 2,4-D 5.0/8.3 ug/kg > 2.5/5.0 ug/kg Text
c9 .;:;>.--4- 1> ~(t> -:::r 4P/P ( /~()
~~~ ~ 4- -_!:D I '..P I> 11_,{ r.Vl.i ... _f-1 ~ l ~ t:10 ~~~~ ~D w '
'
42338F 5 _COMO UA. wpd
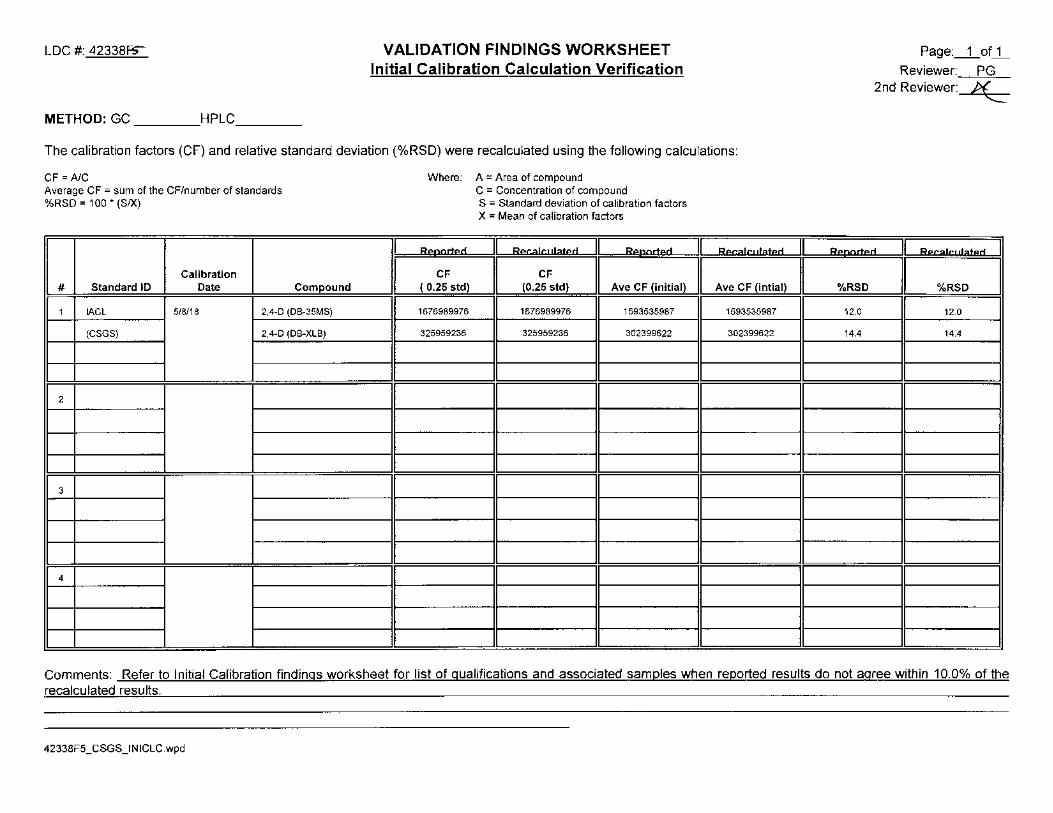
LDC #: 42338F5""
METHOD:GC HPLC ______ _
VALIDATION FINDINGS WORKSHEET Initial Calibration Calculation Verification
The calibration factors (CF) and relative standard deviation (%RSD) were recalculated using the following calculations:
CF = AIC Average CF =sum of the CF/number of standards %RSD = 100 * (SIX)
Calibration # Standard 10 Date Compound
1 IACL 5/8/18 2,4-D (DB-35MS)
(CSGS) 2,4-D (DB-XLB)
2
3
I 4 I I I II
Where: A = Area of compound
....
CF ( 0.25 std)
1676989976
325959236
C = Concentration of compound S = Standard deviation of calibration factors X = Mean of calibration factors
I eecalc11lated I ....
I CF
I (0.25 std) Ave CF (initial)
1676989976 1593535987
325959236 302399622
II II
I eecalc11lated
Ave CF (intial)
1593535987
302399622
II
Page:_1_of_1_
Reviewer:___EQ 2nd Reviewer: ~
IEJI eecalc11lated I
%RSD I I %RSD
12.0 12.0
14.4 14.4
II II I
Comments: Refer to Initial Calibration findings worksheet for list of qualifications and associated samples when reported results do not agree within 10.0% of the recalculated results.
42338F5_CSGS_INICLC.wpd
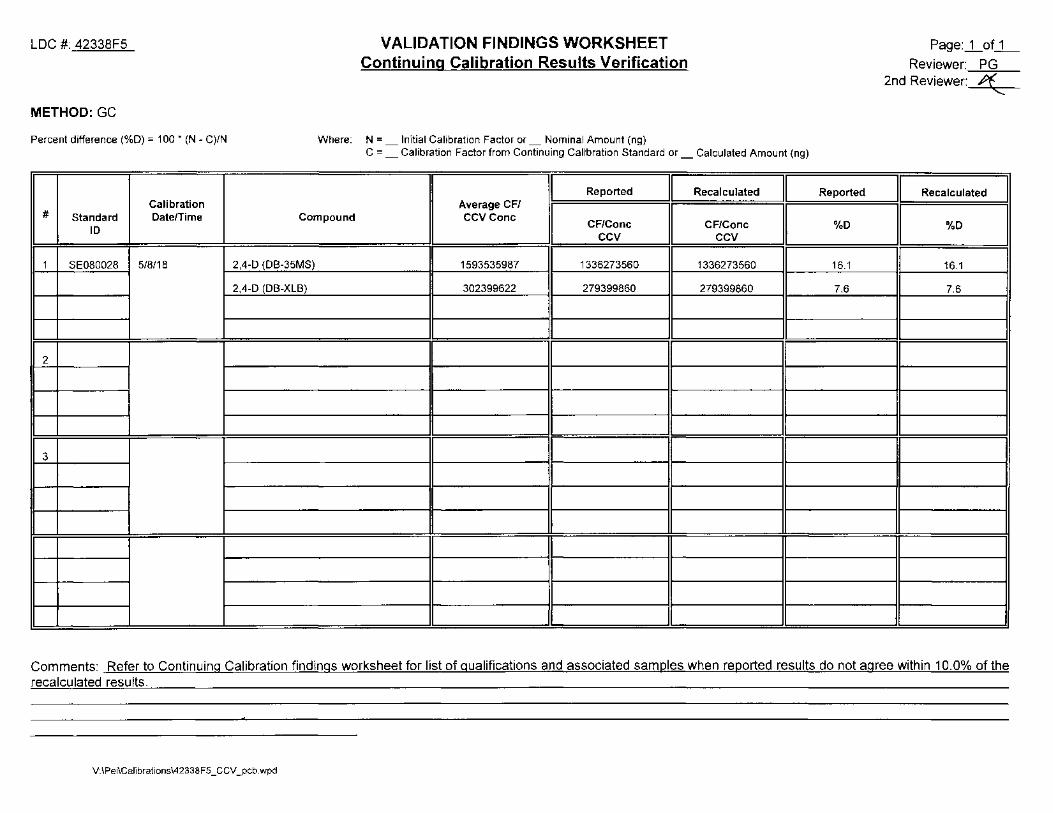
LDC #: 42338F5
METHOD:GC
Percent difference (%0) = 100 * (N - C)/N
-
Calibration # Standard Date/Time
ID
1 SE080028 5/8/18
2
I
II 3 I _] I
VALIDATION FINDINGS WORKSHEET Continuing Calibration Results Verification
Where: N = _ Initial Calibration Factor or_ Nominal Amount (ng) C =_Calibration Factor from Continuing Calibration Standard or_ Calculated Amount (ng)
------- ·-·- ---
I Reported II Recalculated II Average CF/
I II II Compound CCV Cone
CF/Conc CF/Conc CCV CCV
2,4-D (DB-35MS) 1593535987 1336273560 1336273560
2,4-D (DB-XLB) 302399622 279399860 279399860
II II II II
Reported
%0
16.1
7.6
Page:_1_of_1 _
Reviewer: PG 2nd Reviewer: !'(___
II Recalculated I
II %0
I 16.1
7.6
II I
Comments: Refer to Continuing Calibration findings worksheet for list of qualifications and associated samples when reported results do not agree within 10.0% of the recalculated results.
V:\Pei\Calibrations\42338F5 _CCV _pcb.wpd
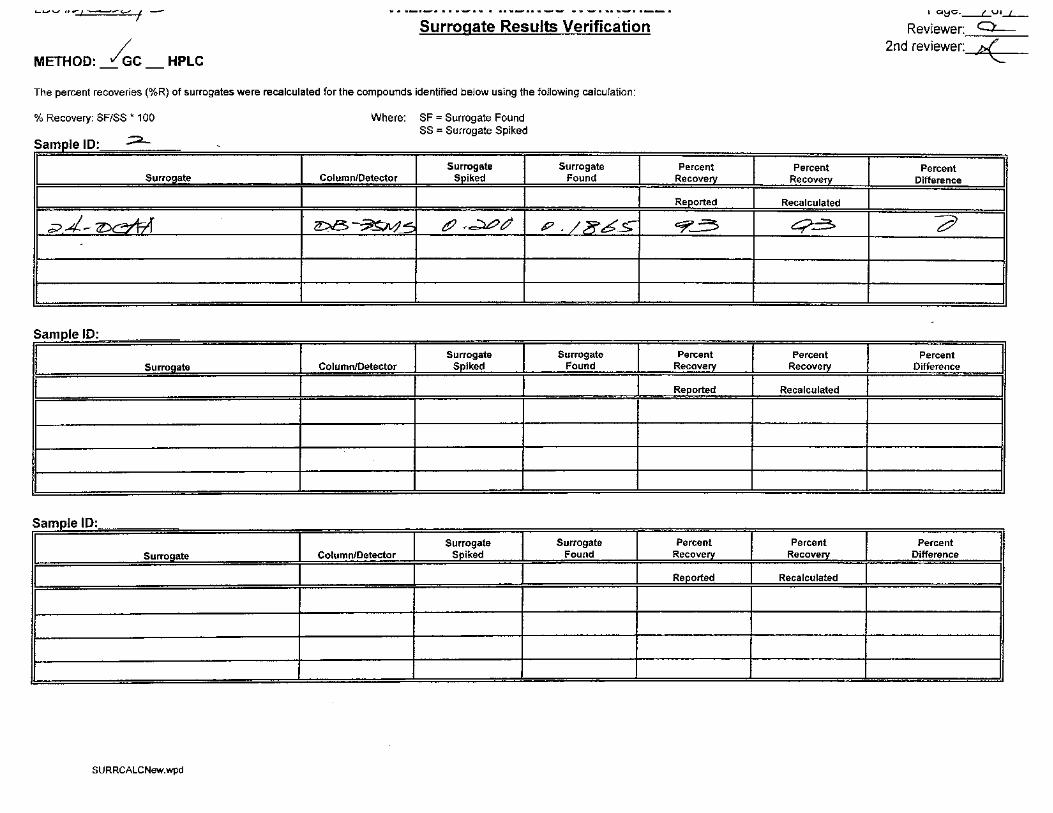
.... ._,..._, Tr.-( ..-c;.......o"" II
Surrogate Results Verification
METHOD:~C HPLC
The percent recoveries (%R) of surrogates were recalculated for the compounds identified below using the following calculation:
%Recovery: SF/SS * 100
Sample 10· ;2----
II Surrogate
I ~~.~-~
SampleiD·
I, Surrogate
Sample 10:
J I
Where: SF = Surrogate Found SS = Surrogate Spiked
J Surrogate I Column/Detector Spiked
I I ~~-~4 tP -~tTl
Column/Detector
I
Surrogate I Found
I P./8bS.~
Surrogate Found
Percent I Percent Recovery Recovery
Reeorted I Recalculated
~~ _I q-.:::3
Reeorted Recalculated
l I
I
I Q~\J.__[_VI_L_
Reviewer: Q:..__
2nd reviewer: ~
Percent J Difference
I ---;3
I
Percent Difference
II I I Surrogate I Surrogate I Percent I Percent I Percent Surr()gate Column/Detector Spiked Found Recovery Recovery Difference I I I I I --- I Reported I Recalculated -- -~ ·- -- ------~,
SURRCALCNew.wpd
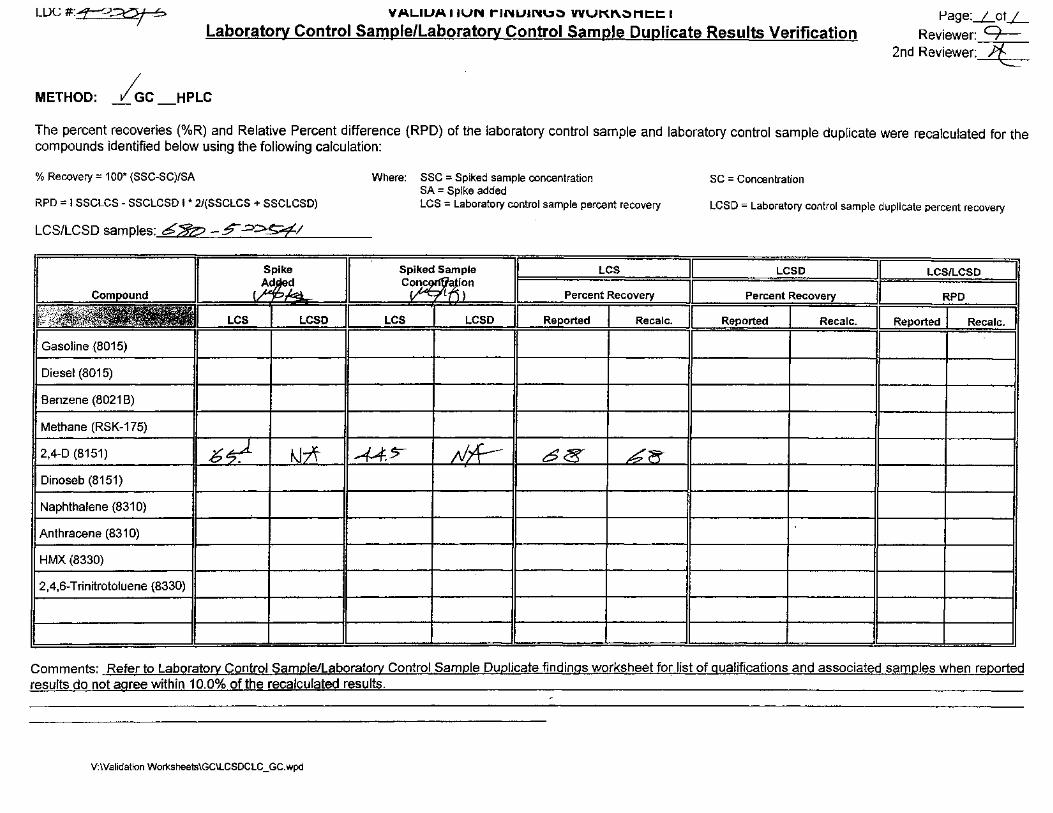
VALIUA IIUN r-INUIN\.!1~ VVUKI'\.~Mt:t: I LDC#:~
Laboratory Control Sample/Laboratory Control Sample Duplicate Results Verification Page:_LotL
Reviewer: C)---2nd Reviewer:~
METHOD: ~C _HPLC
The percent recoveries (%R) and Relative Percent difference (RPD) of the laboratory control sample and laboratory control sample duplicate were recalculated for the compounds identified below using the following calculation:
% Recovery = 1 00* (SSC-SC)/SA
RPD = I SSCLCS - SSCLCSD I * 2/(SSCLCS + SSCLCSD)
LCS/LCSD samples: 6;Jz:; - !?" .:J?$?11
Gasoline (8015)
Diesel (8015)
Benzene (8021 B)
Methane (RSK-175)
2,4-D (8151) b~ fJzT Dinoseb (8151)
Naphthalene (831 0)
Anthracene (831 0)
HMX (8330)
2,4,6-Trinitrotoluene (8330)
Where: SSC =:: Spiked sample concentration SA = Spike added
SC = Concentration
LCS = Laboratory control sample percent recovery LCSD = Laboratory control sample duplicate percent recovery
LCS -, LCSD LCS/LCSD
Percent Recovery I Percent Recovery RPD
LCS LCSD I Reported I Recalc. II Reported l Recalc.
M~ ;Jk 6g h~
Comments: Refer to Laboratory Control Sample/Laboratory Control Sample Duplicate findings worksheet for list of qualifications and associated samples when reported results do not aaree within 10.0% of the recalculated results. ,
V:\Validation Worksheets\GC\LCSDCLC _ GC. wpd
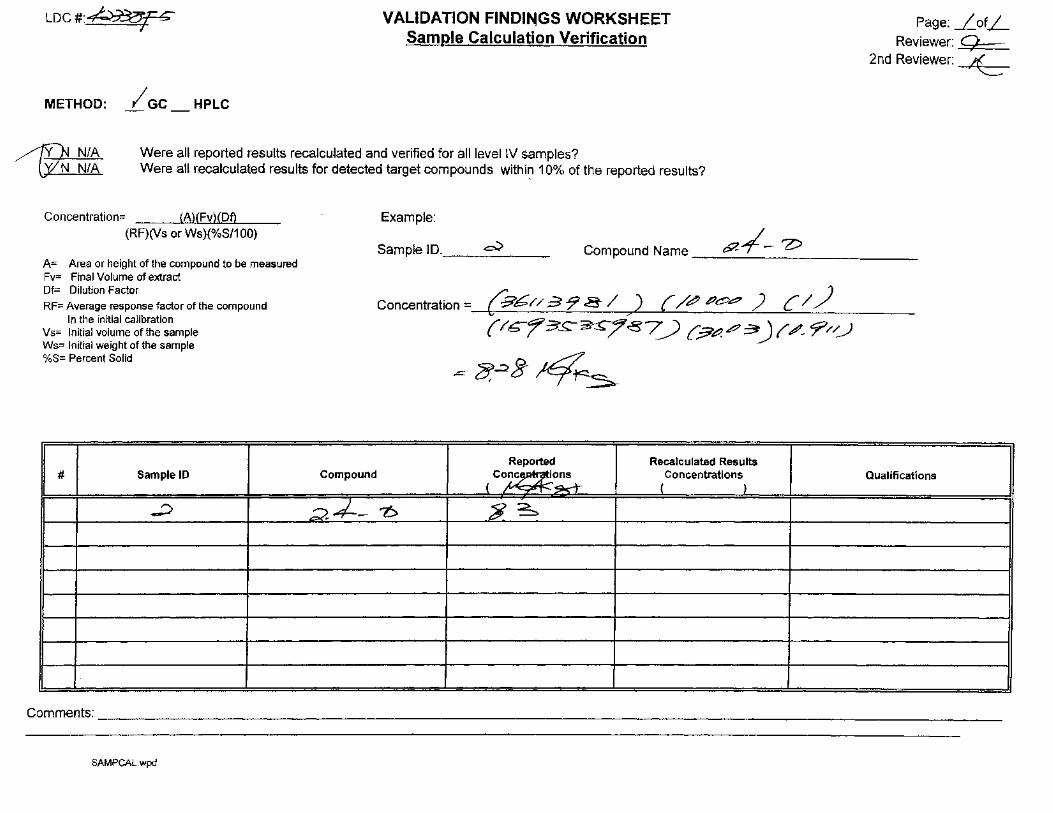
LDC#:~
METHOD: LGc HPLC
VALIDATION FINDINGS WORKSHEET Sample Calculation Verification
~ -~
Were all reported results recalculated and verified for all level IV samples? Were all recalculated results for detected target compounds withi~ 10% of the reported results?
Concentration= (A}(Fv}(Df)
(RF)(Vs or Ws)(%S/1 00)
A= Area or height of the compound to be measured Fv= Final Volume of extract Df= Dilution Factor
RF= Average response factor of the compound In the initial calibration
Vs= Initial volume of the sample Ws= Initial weight of the sample %S= Percent Solid
# Sample ID
_:)
Compound
d--1---
Example:
SampleiD. ~ Compound Name &?, ./- 'Z>
Concentration = {9bf/ :3 9 8- / 7
) (' /~ Po~ ) C // (~'~f'3s:~/~7_,) ('3:?~tt?:3: )r~~ cr/u
- (3;.:23-4~
Reported Recalculated Results Con~ons Concentrations
J -~ ( ) ( / ~r--
7:> ~ s
Page: _f_ofL Reviewer: ...;:9~-
2nd Reviewer: ~
Qualifications
Comments:------------------------------------------------------------------------------------------------------------
SAMPCAL. wpd
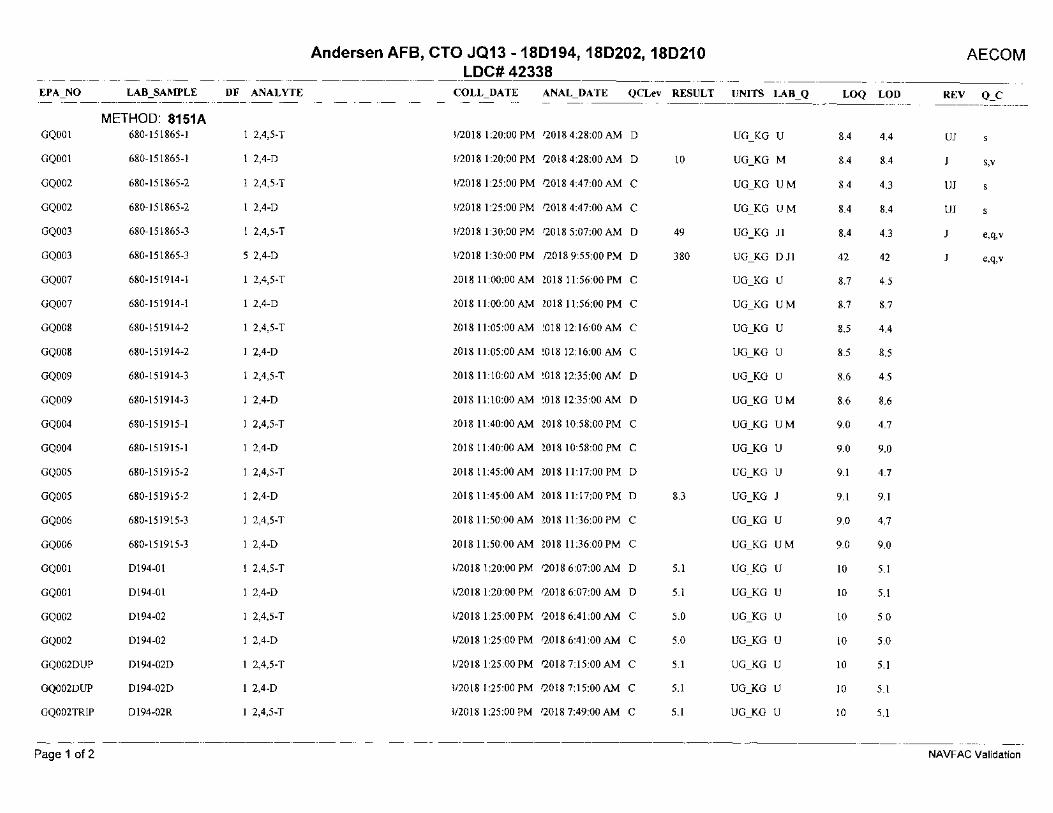
Andersen AFB, CTO JQ13- 180194, 180202, 180210 AECOM LOC#42338
EPA_NO LAB_SAMPLE DF ANALYTE COLL_DATE ANAL_DATE QCLev RESULT UNITS LAB_Q LOQ LOD REV
METHOD: 8151A GQ001 680-151865-1 1 2,4,5-T 1/2018 1:20:00 PM 12018 4:28:00 AM D UG_KG U 8.4 4.4 UJ
GQ001 680-151865-1 1 2,4-D 1/2018 1:20:00 PM 12018 4:28:00 AM D 10 UG_KG M 8.4 8.4 J s,v
GQ002 680-151865-2 1 2,4,5-T 1/2018 1:25:00 PM 12018 4:47:00 AM C UG_KG UM 8.4 4.3 UJ
GQ002 680-151865-2 1 2,4-D 1/2018 1:25:00 PM 12018 4:47:00 AM C UG_KG UM 8.4 8.4 UJ
GQ003 680-151865-3 1 2,4,5-T 1/2018 1:30:00 PM 12018 5:07:00 AM 0 49 UG_KG J1 8.4 4.3 J e,q,v
GQ003 680-151865-3 5 2,4-0 1/2018 1:30:00 PM /2018 9:55:00 PM 0 380 UG_KG 011 42 42 J e,q,v
GQ007 680-151914-1 1 2,4,5-T ~018 11:00:00 AM W18 11:56:00 PM C UG_KG U 8.7 4.5
GQ007 680-151914-1 1 2,4-0 ~018 11:00:00 AM W18 11:56:00 PM C UG_KG UM 8.7 8.7
GQ008 680-151914-2 1 2,4,5-T ~018 11:05:00 AM ~018 12:16:00 AM C UG_KG U 8.5 4.4
GQ008 680-151914-2 1 2,4-0 2018 11:05:00 AM ~018 12:16:00 AM C UG_KG U 8.5 8.5
GQ009 680-151914-3 1 2,4,5-T ~018 11:10:00 AM ~018 12:35:00 AM 0 UG_KG U 8.6 4.5
GQ009 680-151914-3 1 2,4-0 2018 11:10:00 AM ~018 12:35:00 AM 0 UG_KG UM 8.6 8.6
GQ004 680-151915-1 1 2,4,5-T 2018 11:40:00 AM W18 10:58:00 PM C UG_KG UM 9.0 4.7
GQ004 680-151915-1 1 2,4-0 ~018 11:40:00 AM W18 10:58:00 PM C UG_KG U 9.0 9.0
GQ005 680-151915-2 1 2,4,5-T ~018 11:45:00 AM W18 11:17:00 PM 0 UG_KG U 9.1 4.7
GQ005 680-151915-2 1 2,4-0 2018 11:45:00 AM W18 11:17:00 PM 0 8.3 UG_KG J 9.1 9.1
GQ006 680-151915-3 1 2,4,5-T 2018 11:50:00 AM W18 11:36:00 PM C UG_KG U 9.0 4.7
GQ006 680-151915-3 1 2,4-0 ~018 11:50:00 AM W18 11:36:00 PM C UG_KG UM 9.0 9.0
GQ001 0194-01 1 2,4,5-T l/2018 1:20:00 PM 12018 6:07:00 AM 0 5.1 UG_KG U 10 5.1
GQ001 0194-01 1 2,4-0 l/2018 1:20:00 PM 12018 6:07:00 AM 0 5.1 UG_KG U 10 5.1
GQ002 0194-02 1 2,4,5-T l/2018 1:25:00 PM 12018 6:41:00 AM C 5.0 UG_KG U 10 5.0
GQ002 0194-02 1 2,4-0 1/2018 1:25:00 PM 12018 6:41:00 AM C 5.0 UG_KG U 10 5.0
GQ0020UP 0194-020 1 2,4,5-T l/2018 1:25:00 PM 12018 7:15:00 AM C 5.1 UG_KG U 10 5.1
GQ0020UP 0194-020 1 2,4-0 1/2018 1:25:00 PM 12018 7:15:00 AM C 5.1 UG_KG U 10 5.1
GQ002TR1P 0194-02R 1 2,4,5-T l/2018 1:25:00 PM 12018 7:49:00 AM C 5.1 UG_KG U 10 5.1
Page 1 of 2 NAVFAC Validation
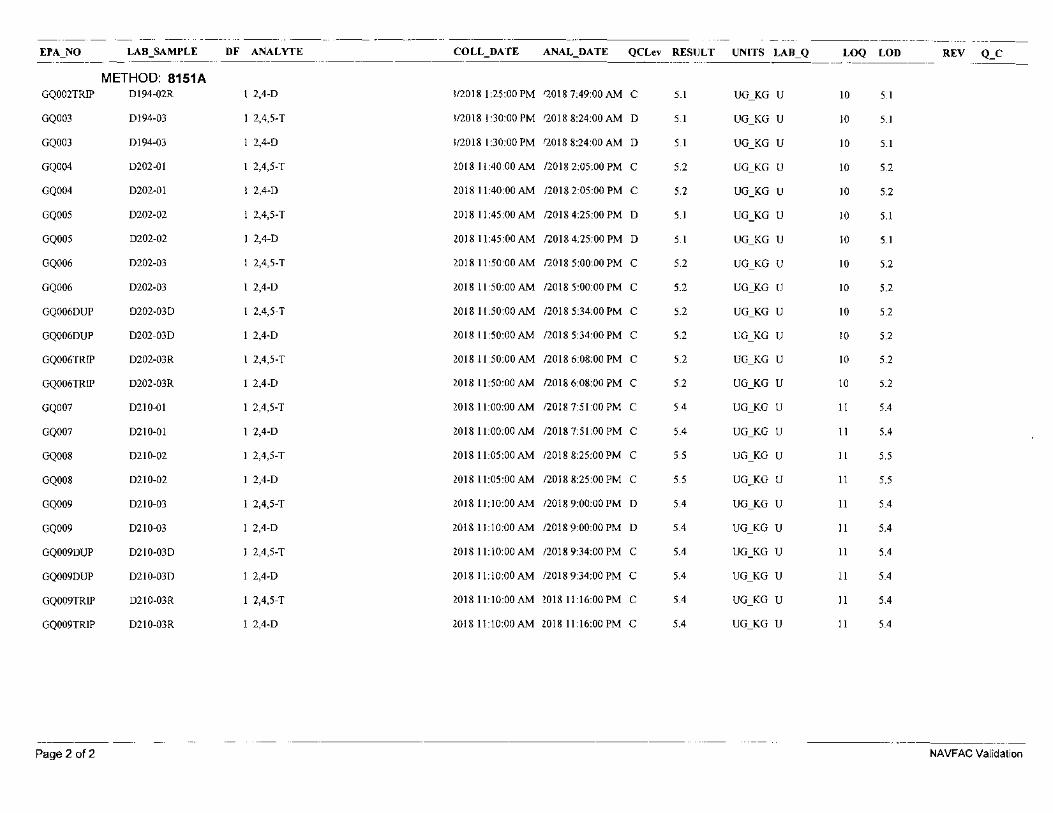
EPA_NO LAB_SAMPLE DF ANALYTE COLL_DATE ANAL _DATE QCLev RESULT UNITS LAB_Q LOQ LOD REV
METHOD: 8151A GQ002TRIP 0194-02R 1 2,4-0 1/2018 1:25:00 PM 12018 7:49:00 AM C 5.1 UG_KG U 10 5.1
GQ003 0194-03 1 2,4,5-T 1/2018 1:30:00 PM 12018 8:24:00 AM 0 5.1 UG_KG U 10 5.1
GQ003 0194-03 1 2,4-0 1/2018 1:30:00 PM 12018 8:24:00 AM 0 5.1 UG_KG U 10 5.1
GQ004 0202-01 1 2,4,5-T 2018 11:40:00 AM /2018 2:05:00 PM C 5.2 UG_KG U 10 5.2
GQ004 0202-01 1 2,4-0 2018 11:40:00 AM /2018 2:05:00 PM C 5.2 UG_KG U 10 5.2
GQ005 0202-02 1 2,4,5-T 2018 11:45:00 AM /2018 4:25:00 PM 0 5.1 UG_KG U 10 5.1
GQ005 0202-02 1 2,4-0 2018 11:45:00 AM /2018 4:25:00 PM 0 5.1 UG_KG U 10 5.1
GQ006 0202-03 1 2,4,5-T 2018 11:50:00 AM /2018 5:00:00 PM C 5.2 UG_KG U 10 5.2
GQ006 0202-03 1 2,4-0 2018 11:50:00 AM /2018 5:00:00 PM C 5.2 UG_KG U 10 5.2
GQ0060UP 0202-030 1 2,4,5-T 2018 11:50:00 AM /2018 5:34:00 PM C 5.2 UG_KG U 10 5.2
GQ0060UP 0202-030 1 2,4-0 2018 11:50:00 AM /2018 5:34:00 PM C 5.2 UG_KG U 10 5.2
GQ006TRIP 0202-03R 1 2,4,5-T 2018 11:50:00 AM /2018 6:08:00 PM C 5.2 UG_KG U 10 5.2
GQ006TRIP 0202-03R 1 2,4-0 2018 11:50:00 AM /2018 6:08:00 PM C 5.2 UG_KG U 10 5.2
GQ007 0210-01 1 2,4,5-T 2018 11:00:00 AM /2018 7:51:00 PM C 5.4 UG_KG U 11 5.4
GQ007 0210-01 1 2,4-0 2018 11:00:00 AM /2018 7:51:00 PM C 5.4 UG_KG U 11 5.4
GQ008 0210-02 1 2,4,5-T 2018 11:05:00 AM /2018 8:25:00 PM C 5.5 UG_KG U 11 5.5
GQ008 0210-02 1 2,4-0 2018 11:05:00 AM /2018 8:25:00 PM C 5.5 UG_KG U 11 5.5
GQ009 0210-03 1 2,4,5-T 2018 11:10:00 AM /2018 9:00:00 PM 0 5.4 UG_KG U 11 5.4
GQ009 0210-03 1 2,4-0 2018 11:10:00 AM /2018 9:00:00 PM 0 5.4 UG_KG U 11 5.4
GQ0090UP 0210-030 1 2,4,5-T 2018 11:10:00 AM /2018 9:34:00 PM C 5.4 UG_KG U 11 5.4
GQ0090UP 0210-030 1 2,4-0 2018 11:10:00 AM /2018 9:34:00 PM C 5.4 UG_KG U 11 5.4
GQ009TRIP 0210-03R 1 2,4,5-T 2018 11:10:00 AM W18 11:16:00 PM C 5.4 UG_KG U 11 5.4
GQ009TRIP 0210-03R 1 2,4-0 2018 11:10:00 AM W18 11:16:00 PM C 5.4 UG_KG U 11 5.4
Page 2 of2 NAVFAC Validation
Recommended