LABORATORY APPROACH TO PLATELET DISORDERS
Catherine P. M. Hayward, MD PhD, FRCP(C) Head, Coagulation, Hamilton Regional Laboratory Medicine Program Professor, Pathology and Molecular Medicine, and Medicine McMaster University, Hamilton, Ontario, Canada

Disclosures for Catherine P. M. Hayward • No financial or conflicts of interest to disclose
Objectives Review laboratory testing for platelet disorders, including: • Causes of platelet disorders and typical laboratory findings
• Focus: inherited conditions, some important acquired disorders where testing is key
• Pitfalls
Platelet Disorders • Many inherited disorders alter platelet numbers
and/or function • Important causes of abnormal bleeding • Estimated prevalence ~1-6/1000
• some forms (e.g. dense granule deficiency) have similar prevalence to von Willebrand disease (VWD)
• Laboratory testing is complex • relies on “laboratory developed methods/strategies” • no simple kits or methods
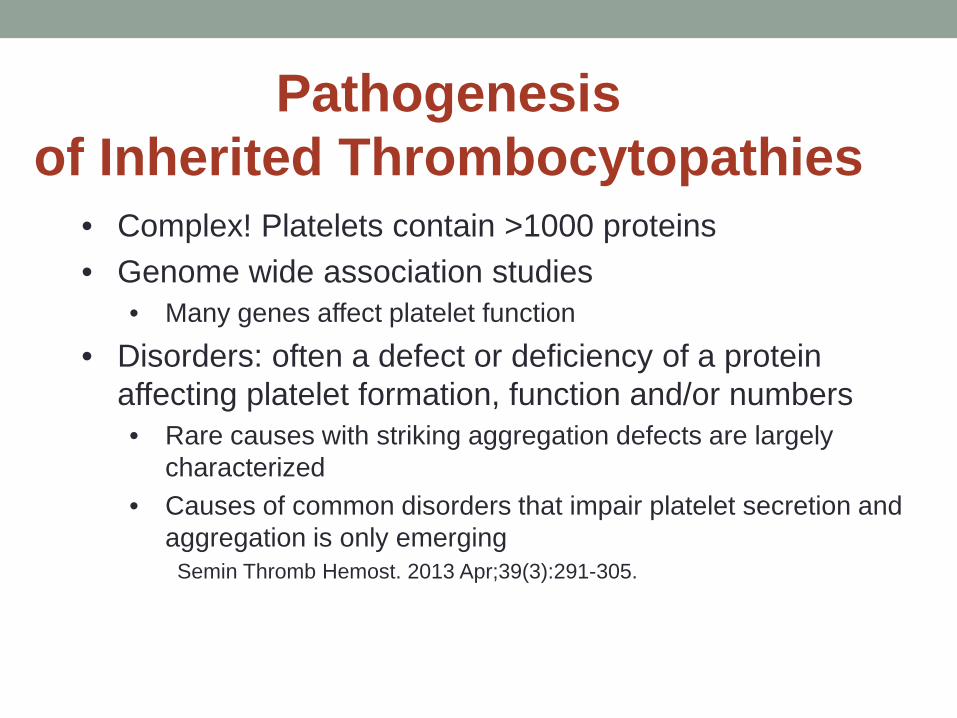
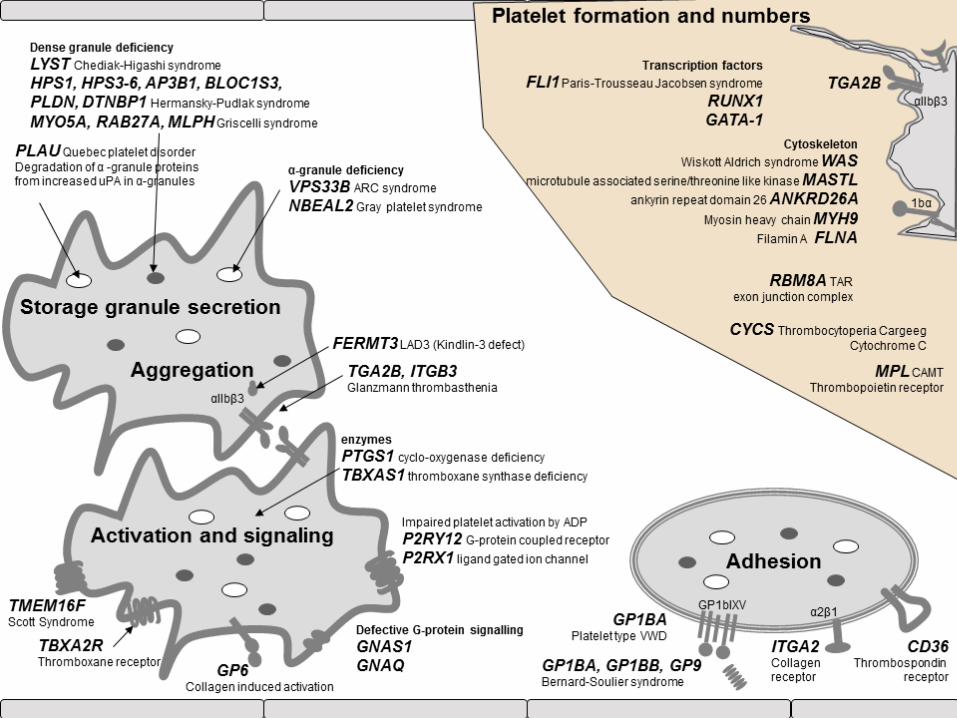
Pathogenesis of Inherited Thrombocytopathies
• Complex! Platelets contain >1000 proteins • Genome wide association studies
• Many genes affect platelet function
• Disorders: often a defect or deficiency of a protein affecting platelet formation, function and/or numbers • Rare causes with striking aggregation defects are largely
characterized • Causes of common disorders that impair platelet secretion and
aggregation is only emerging Semin Thromb Hemost. 2013 Apr;39(3):291-305.
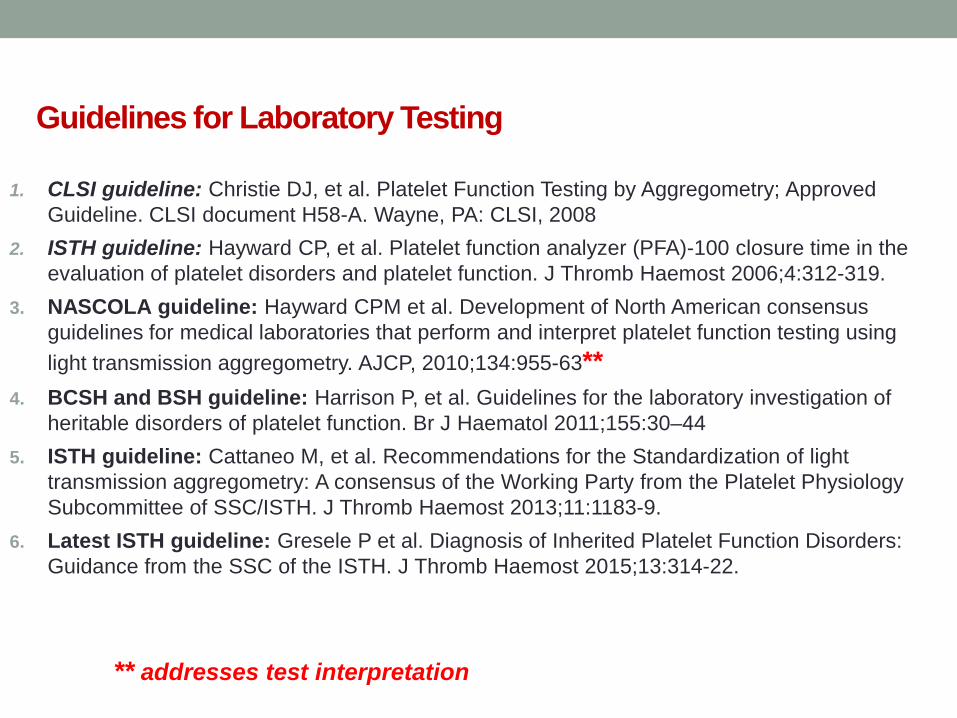
Guidelines for Laboratory Testing
1. CLSI guideline: Christie DJ, et al. Platelet Function Testing by Aggregometry; Approved Guideline. CLSI document H58-A. Wayne, PA: CLSI, 2008
2. ISTH guideline: Hayward CP, et al. Platelet function analyzer (PFA)-100 closure time in the evaluation of platelet disorders and platelet function. J Thromb Haemost 2006;4:312-319.
3. NASCOLA guideline: Hayward CPM et al. Development of North American consensus guidelines for medical laboratories that perform and interpret platelet function testing using light transmission aggregometry. AJCP, 2010;134:955-63**
4. BCSH and BSH guideline: Harrison P, et al. Guidelines for the laboratory investigation of heritable disorders of platelet function. Br J Haematol 2011;155:30–44
5. ISTH guideline: Cattaneo M, et al. Recommendations for the Standardization of light transmission aggregometry: A consensus of the Working Party from the Platelet Physiology Subcommittee of SSC/ISTH. J Thromb Haemost 2013;11:1183-9.
6. Latest ISTH guideline: Gresele P et al. Diagnosis of Inherited Platelet Function Disorders: Guidance from the SSC of the ISTH. J Thromb Haemost 2015;13:314-22.
** addresses test interpretation
Platelet function analyzer (PFA)-100 closure time guideline
• Key recommendations related to inherited platelet disorders • Test: considered optional
• Insufficient sensitivity and specificity to be used for screening to determine which individuals need further testing for platelet disorders • Is this followed in all practice settings?
• Abnormal findings can reflect other conditions • Anemia, von Willebrand disease, etc.
• Uncertain role in predicting clinical outcomes and/or therapy monitoring for other disorders
Light transmittance platelet aggregometry • Important assay for diagnosing platelet disorders • Detects many but not all platelet function disorders
Aggregometry: Realities of Practice
• Need better method standardization • Laboratories have greater difficult with aggregometry
interpretation than with interpreting other platelet tests (e.g., electron microscopy tests for platelet dense granule deficiency)
• Performance is particularly problematic for interpreting common aggregation findings and abnormalities
Hayward, Moffat, Plumhoff, Timleck, Hoffman, Spitzer, Van Cott, Meijer. STH 2012;38(6):622-31
Sensitivity and Specificity of LTA as an Initial Test for Bleeding Disorders
• Hamilton Regional Laboratory Medicine Program (HRLMP) Study
• Approach • Estimated sensitivities and specificities of lab tests for
bleeding disorder diagnosis, using a prospective cohort study design (Hayward, Moffat, Liu. STH 2012;38(7):742-52)
• Standardized panel of initial investigations • Light transmission aggregometry (LTA) included in the
panel to assess for platelet disorders at the same time as testing for VWD and coagulation defects
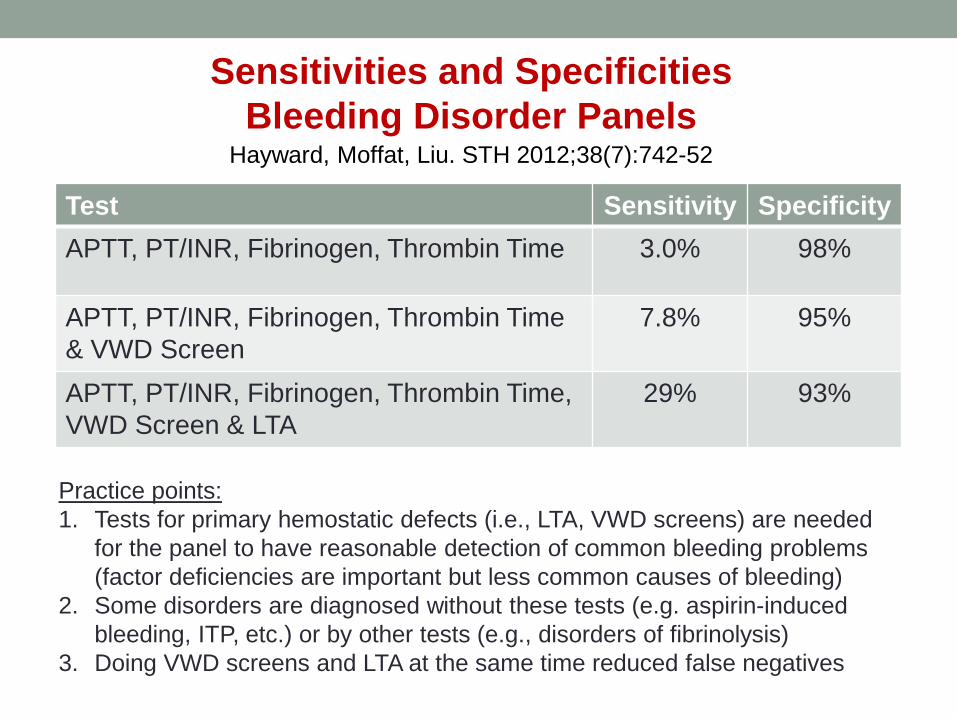
Sensitivities and Specificities Bleeding Disorder Panels
Hayward, Moffat, Liu. STH 2012;38(7):742-52
Test Sensitivity Specificity APTT, PT/INR, Fibrinogen, Thrombin Time 3.0% 98%
APTT, PT/INR, Fibrinogen, Thrombin Time & VWD Screen
7.8% 95%
APTT, PT/INR, Fibrinogen, Thrombin Time, VWD Screen & LTA
29% 93%
Practice points: 1. Tests for primary hemostatic defects (i.e., LTA, VWD screens) are needed
for the panel to have reasonable detection of common bleeding problems (factor deficiencies are important but less common causes of bleeding)
2. Some disorders are diagnosed without these tests (e.g. aspirin-induced bleeding, ITP, etc.) or by other tests (e.g., disorders of fibrinolysis)
3. Doing VWD screens and LTA at the same time reduced false negatives
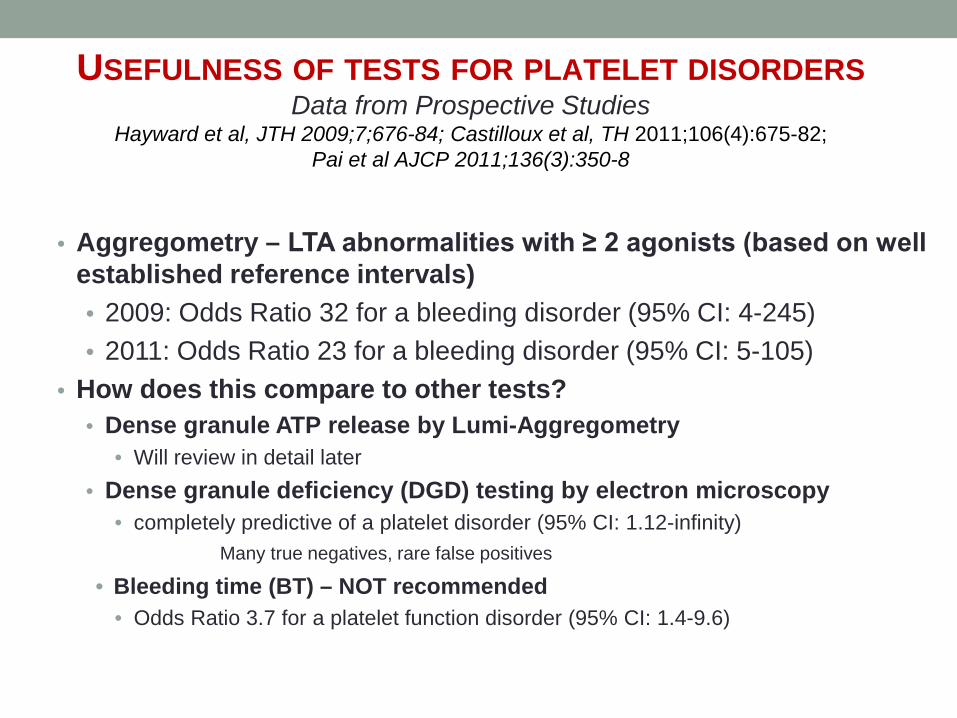
USEFULNESS OF TESTS FOR PLATELET DISORDERS Data from Prospective Studies
Hayward et al, JTH 2009;7;676-84; Castilloux et al, TH 2011;106(4):675-82; Pai et al AJCP 2011;136(3):350-8
• Aggregometry – LTA abnormalities with ≥ 2 agonists (based on well
established reference intervals) • 2009: Odds Ratio 32 for a bleeding disorder (95% CI: 4-245) • 2011: Odds Ratio 23 for a bleeding disorder (95% CI: 5-105)
• How does this compare to other tests? • Dense granule ATP release by Lumi-Aggregometry
• Will review in detail later • Dense granule deficiency (DGD) testing by electron microscopy
• completely predictive of a platelet disorder (95% CI: 1.12-infinity) Many true negatives, rare false positives
• Bleeding time (BT) – NOT recommended • Odds Ratio 3.7 for a platelet function disorder (95% CI: 1.4-9.6)
14
Principle of aggregation tests Test evaluates platelet aggregate formation, in response to multiple agonists, using either: • Platelet rich plasma (PRP) - optical or light transmission
(LTA) method (“Born” aggregometry) • When platelets aggregate, the percentage of light transmission
through the sample increases
• Whole blood - electrical impedance methods • When platelet stick to the electrode, it changes the impedance • Not identical to LTA
• e.g., with collagen, both platelets and WBC stick to the electrode • Has not been validated as much as LTA for diagnostic purposes
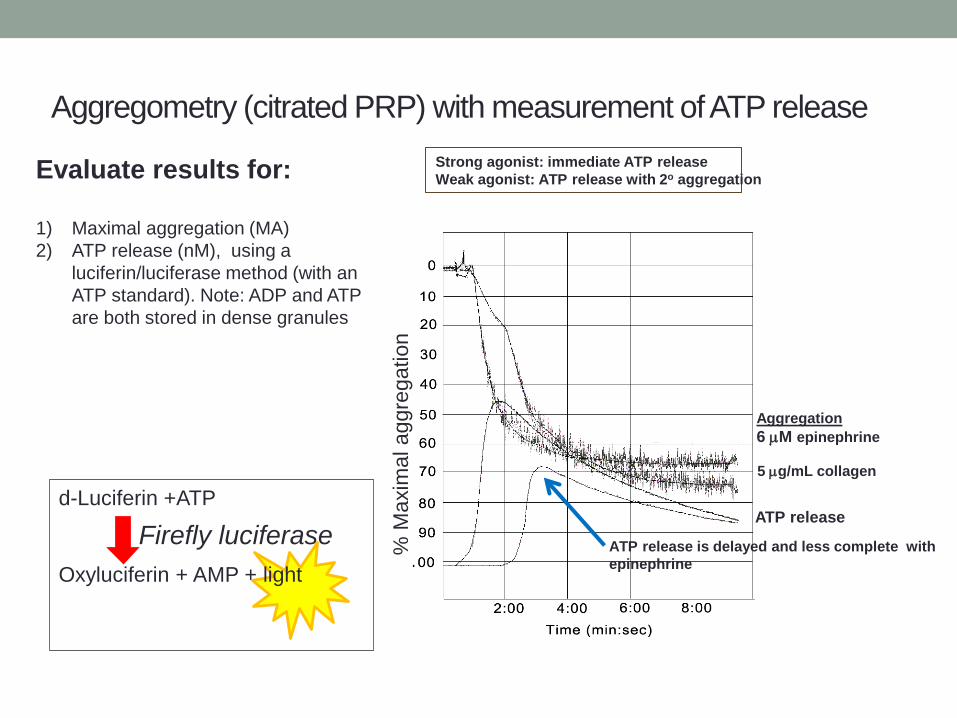
Aggregometry (citrated PRP) with measurement of ATP release
Evaluate results for: 1) Maximal aggregation (MA) 2) ATP release (nM), using a
luciferin/luciferase method (with an ATP standard). Note: ADP and ATP are both stored in dense granules
ATP release is delayed and less complete with epinephrine
Aggregation 6 µM epinephrine
5 µg/mL collagen
ATP release
% M
axim
al a
ggre
gatio
n
d-Luciferin +ATP Oxyluciferin + AMP + light
Firefly luciferase
Strong agonist: immediate ATP release Weak agonist: ATP release with 2o aggregation
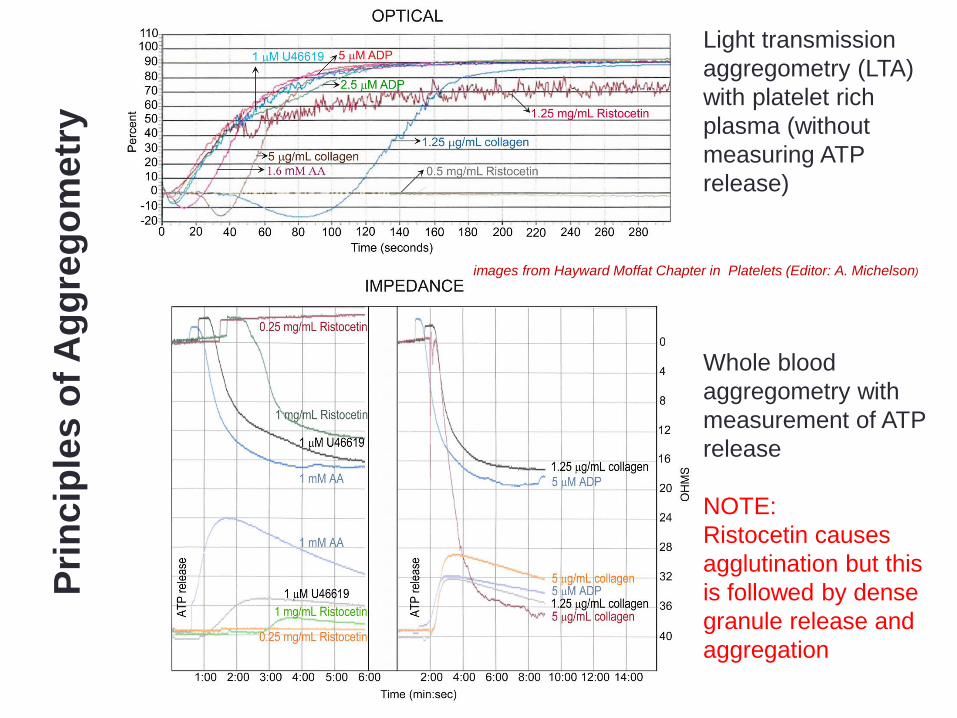
Whole blood aggregometry with measurement of ATP release NOTE: Ristocetin causes agglutination but this is followed by dense granule release and aggregation
Prin
cipl
es o
f Agg
rego
met
ry
Light transmission aggregometry (LTA) with platelet rich plasma (without measuring ATP release)
images from Hayward Moffat Chapter in Platelets (Editor: A. Michelson)
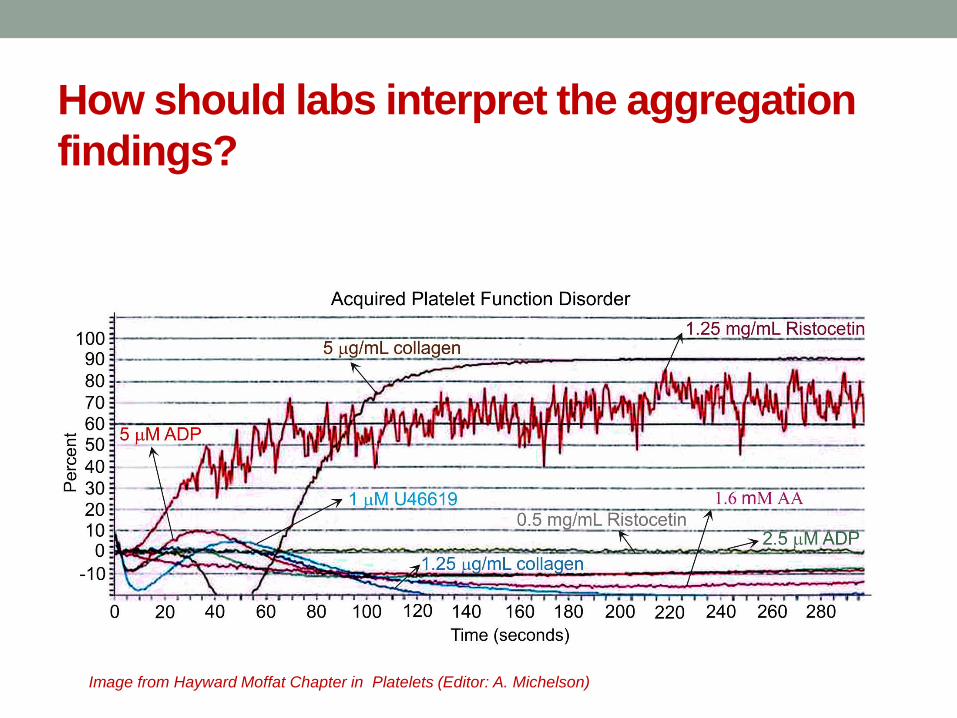
How should labs interpret the aggregation findings?
Image from Hayward Moffat Chapter in Platelets (Editor: A. Michelson)
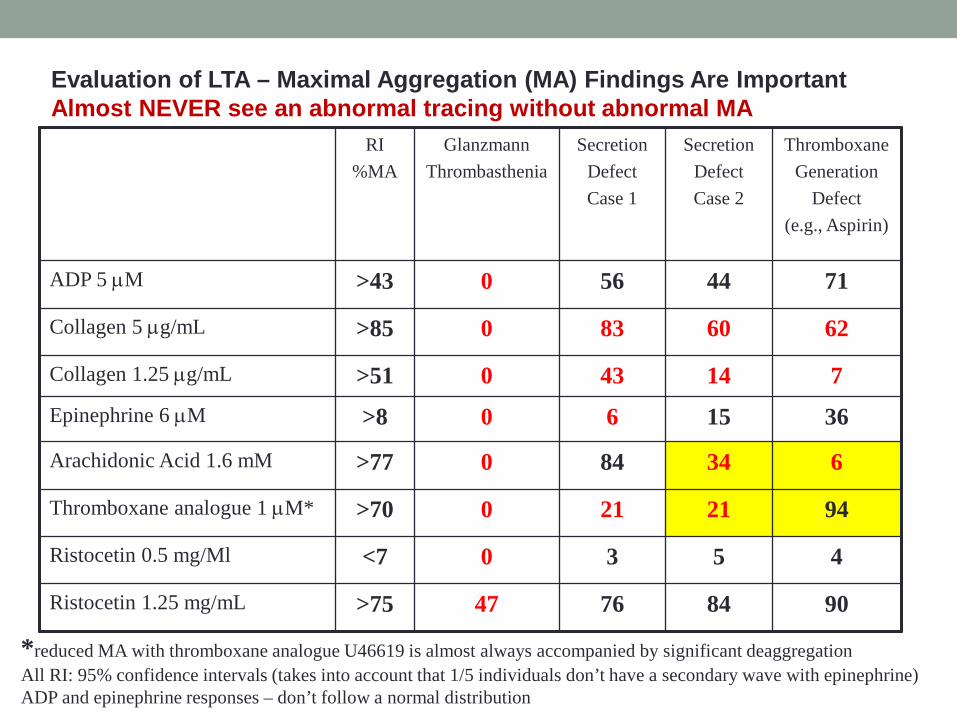
RI %MA
Glanzmann Thrombasthenia
Secretion Defect Case 1
Secretion Defect Case 2
Thromboxane Generation
Defect (e.g., Aspirin)
ADP 5 µM >43 0 56 44 71
Collagen 5 µg/mL >85 0 83 60 62
Collagen 1.25 µg/mL >51 0 43 14 7 Epinephrine 6 µM >8 0 6 15 36
Arachidonic Acid 1.6 mM >77 0 84 34 6
Thromboxane analogue 1 µM* >70 0 21 21 94
Ristocetin 0.5 mg/Ml <7 0 3 5 4
Ristocetin 1.25 mg/mL >75 47 76 84 90
Evaluation of LTA – Maximal Aggregation (MA) Findings Are Important Almost NEVER see an abnormal tracing without abnormal MA
*reduced MA with thromboxane analogue U46619 is almost always accompanied by significant deaggregation All RI: 95% confidence intervals (takes into account that 1/5 individuals don’t have a secondary wave with epinephrine) ADP and epinephrine responses – don’t follow a normal distribution
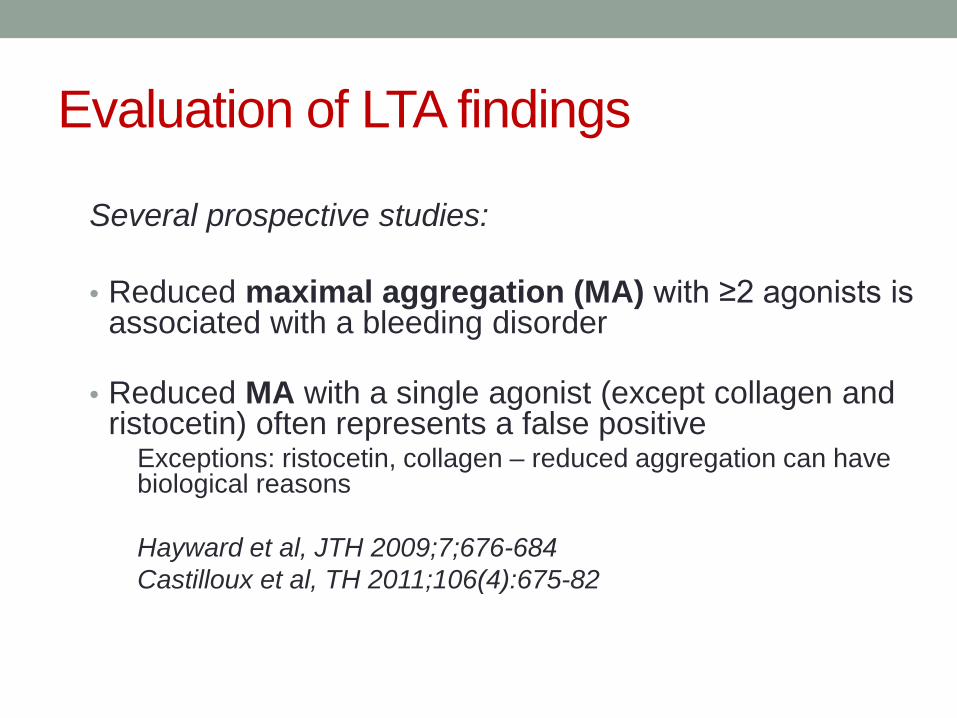
Evaluation of LTA findings Several prospective studies: • Reduced maximal aggregation (MA) with ≥2 agonists is
associated with a bleeding disorder
• Reduced MA with a single agonist (except collagen and ristocetin) often represents a false positive
Exceptions: ristocetin, collagen – reduced aggregation can have biological reasons Hayward et al, JTH 2009;7;676-684 Castilloux et al, TH 2011;106(4):675-82
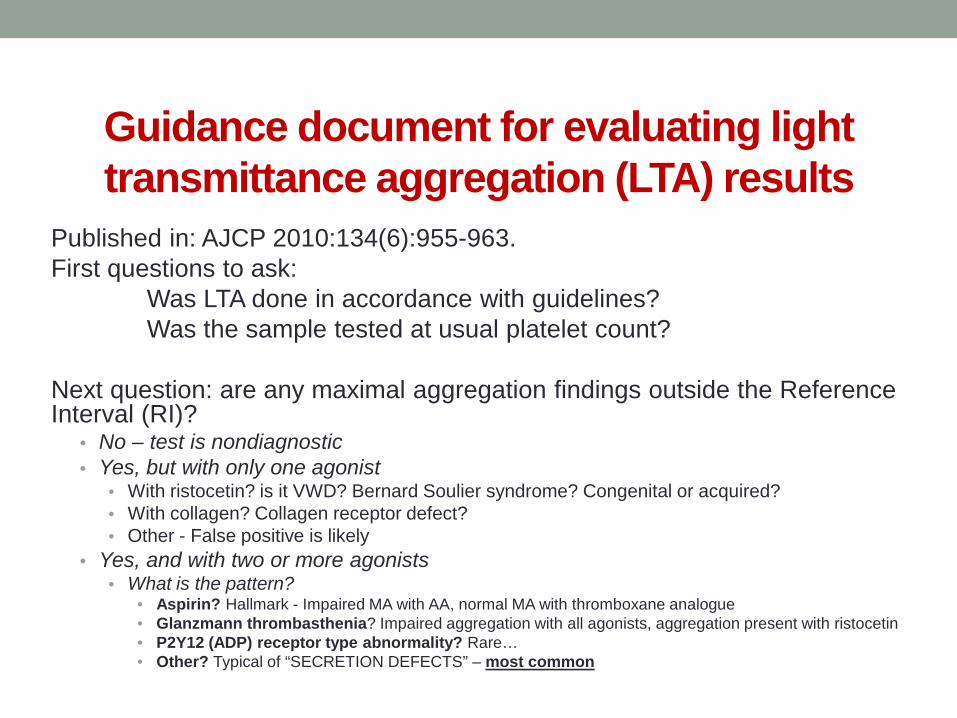
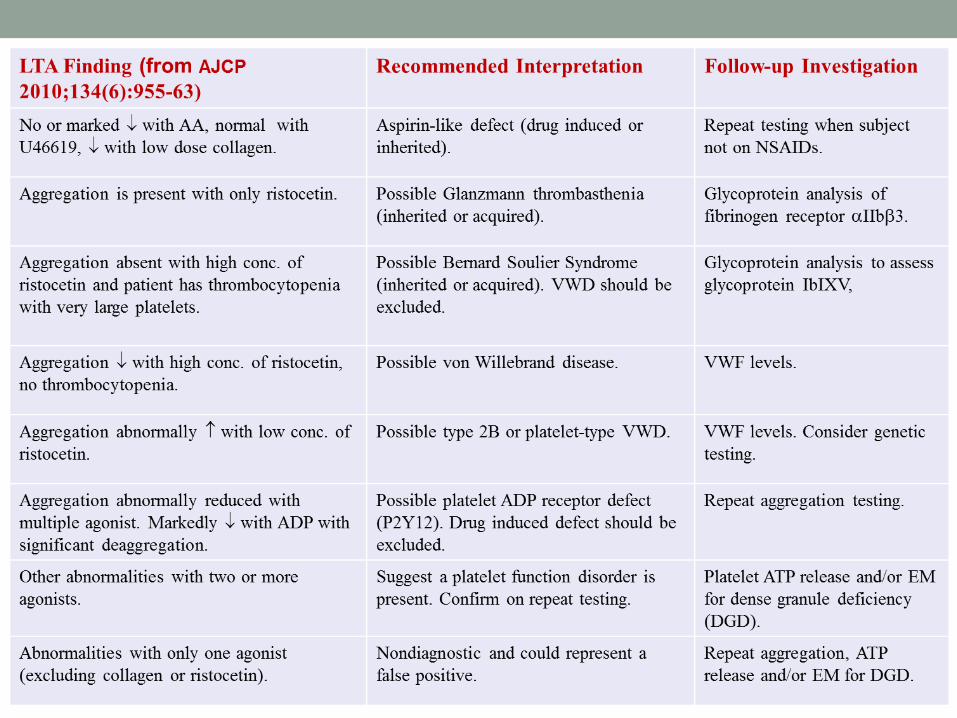
Guidance document for evaluating light transmittance aggregation (LTA) results
Published in: AJCP 2010:134(6):955-963. First questions to ask: Was LTA done in accordance with guidelines? Was the sample tested at usual platelet count? Next question: are any maximal aggregation findings outside the Reference Interval (RI)?
• No – test is nondiagnostic • Yes, but with only one agonist
• With ristocetin? is it VWD? Bernard Soulier syndrome? Congenital or acquired? • With collagen? Collagen receptor defect? • Other - False positive is likely
• Yes, and with two or more agonists • What is the pattern?
• Aspirin? Hallmark - Impaired MA with AA, normal MA with thromboxane analogue • Glanzmann thrombasthenia? Impaired aggregation with all agonists, aggregation present with ristocetin • P2Y12 (ADP) receptor type abnormality? Rare… • Other? Typical of “SECRETION DEFECTS” – most common
Nor
mal
agg
rega
tion
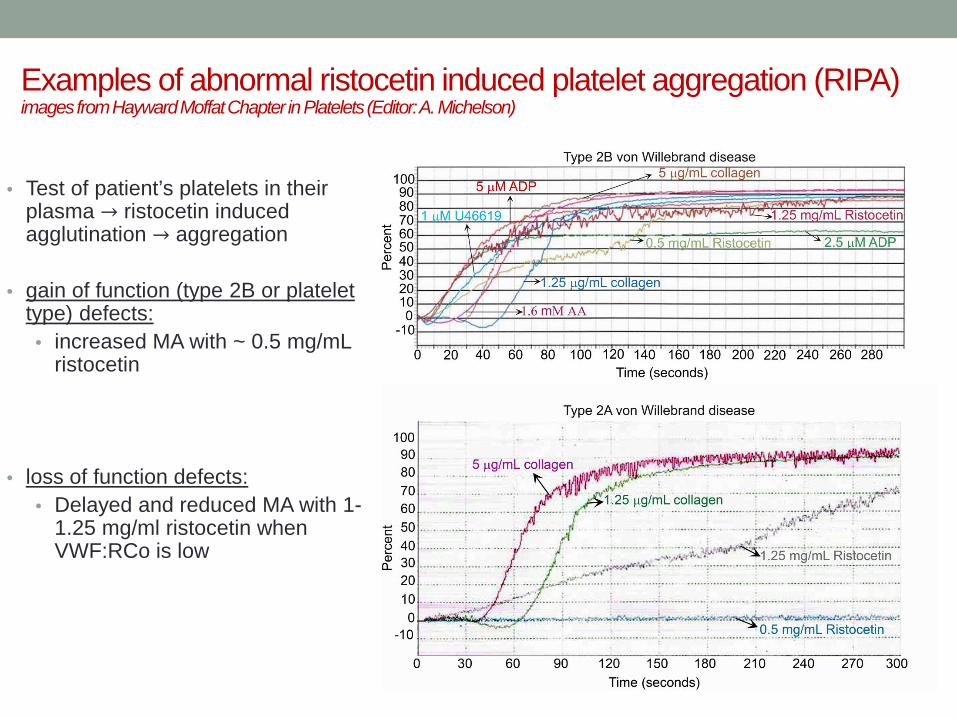
Examples of abnormal ristocetin induced platelet aggregation (RIPA) images from Hayward Moffat Chapter in Platelets (Editor: A. Michelson)
• Test of patient’s platelets in their
plasma → ristocetin induced agglutination → aggregation
• gain of function (type 2B or platelet
type) defects: • increased MA with ~ 0.5 mg/mL
ristocetin
• loss of function defects: • Delayed and reduced MA with 1-
1.25 mg/ml ristocetin when VWF:RCo is low
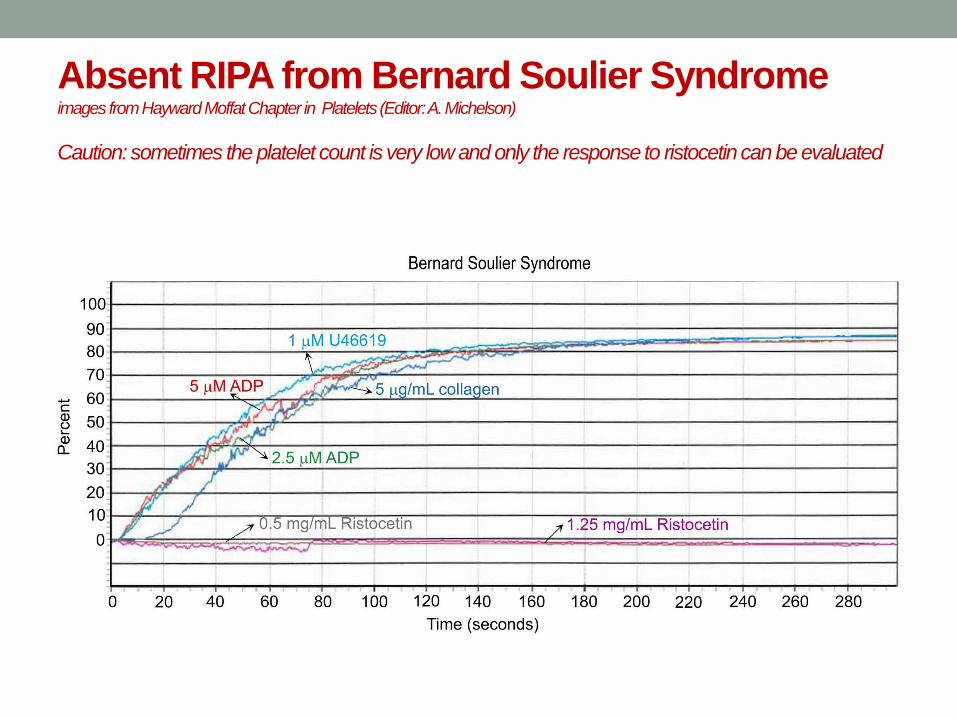
Absent RIPA from Bernard Soulier Syndrome images from Hayward Moffat Chapter in Platelets (Editor: A. Michelson) Caution: sometimes the platelet count is very low and only the response to ristocetin can be evaluated
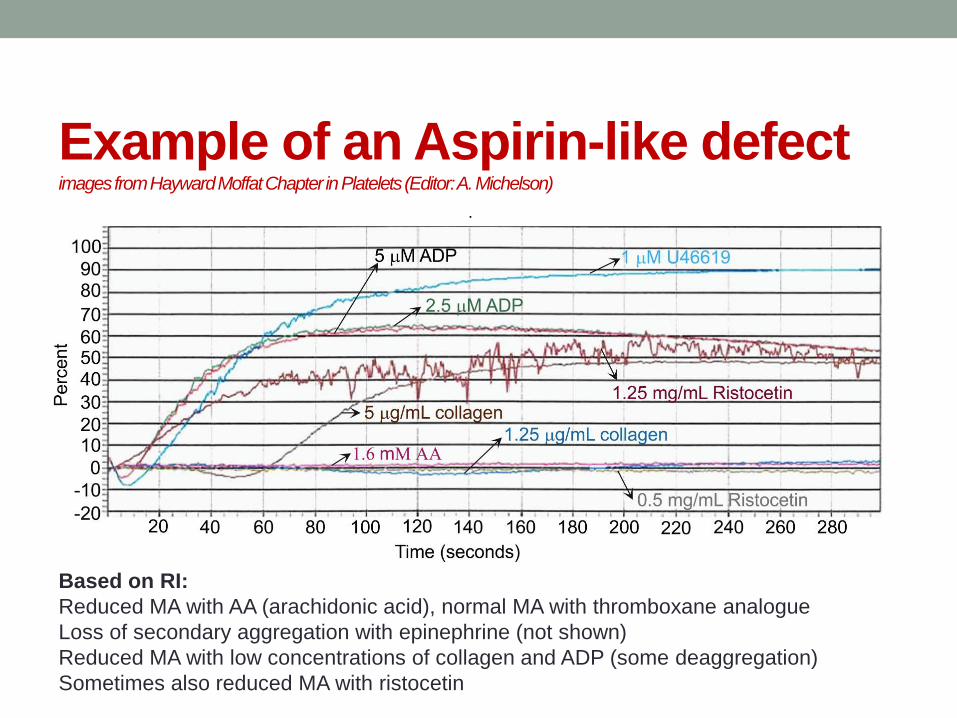
Example of an Aspirin-like defect images from Hayward Moffat Chapter in Platelets (Editor: A. Michelson)
Based on RI: Reduced MA with AA (arachidonic acid), normal MA with thromboxane analogue Loss of secondary aggregation with epinephrine (not shown) Reduced MA with low concentrations of collagen and ADP (some deaggregation) Sometimes also reduced MA with ristocetin
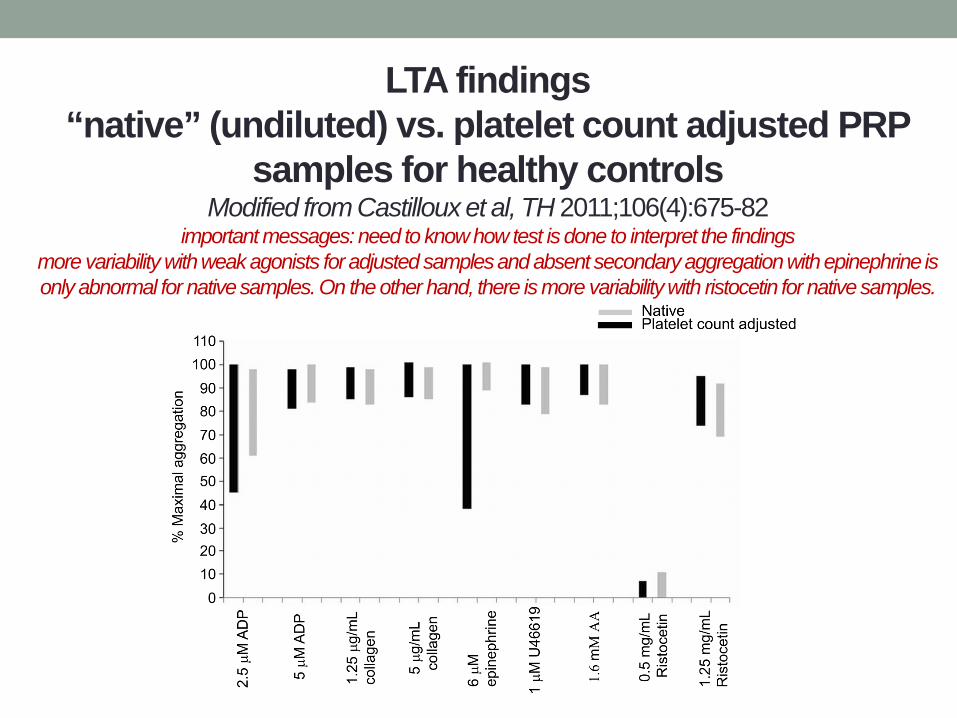
LTA findings “native” (undiluted) vs. platelet count adjusted PRP
samples for healthy controls Modified from Castilloux et al, TH 2011;106(4):675-82
important messages: need to know how test is done to interpret the findings more variability with weak agonists for adjusted samples and absent secondary aggregation with epinephrine is only abnormal for native samples. On the other hand, there is more variability with ristocetin for native samples.
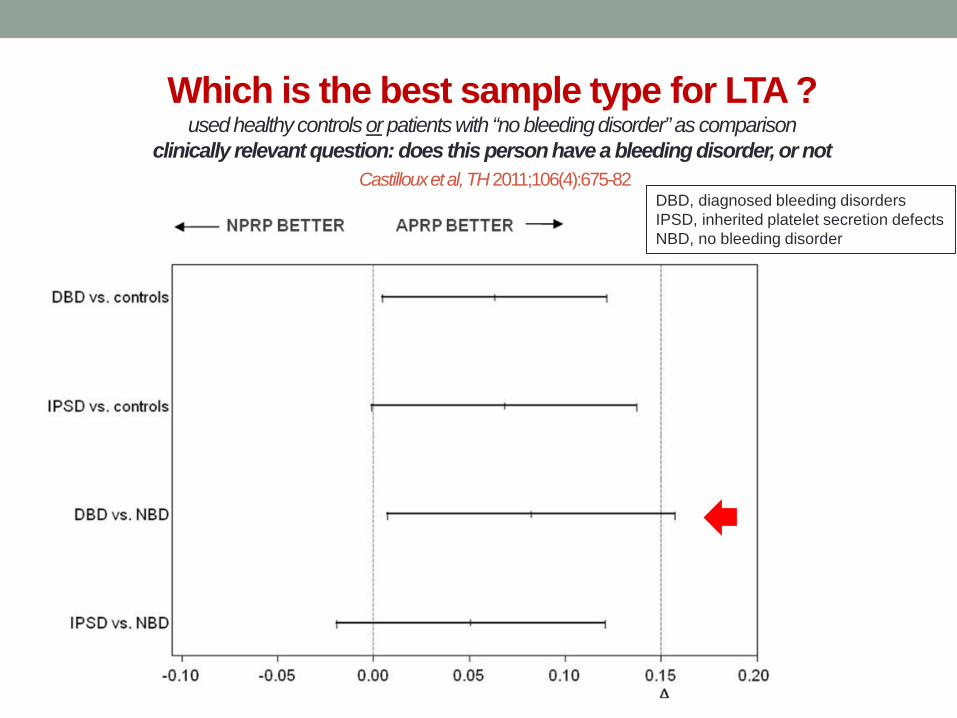
DBD, diagnosed bleeding disorders IPSD, inherited platelet secretion defects NBD, no bleeding disorder
Which is the best sample type for LTA ? used healthy controls or patients with “no bleeding disorder” as comparison
clinically relevant question: does this person have a bleeding disorder, or not Castilloux et al, TH 2011;106(4):675-82
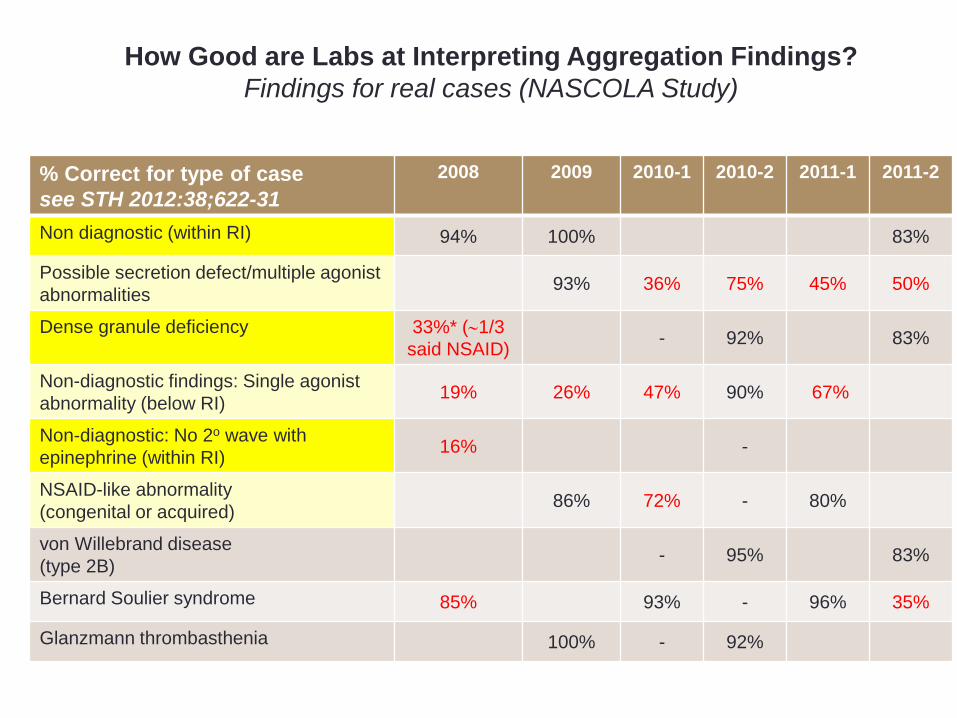
% Correct for type of case see STH 2012:38;622-31
2008 2009 2010-1 2010-2 2011-1 2011-2
Non diagnostic (within RI) 94% 100% 83%
Possible secretion defect/multiple agonist abnormalities 93% 36% 75% 45% 50%
Dense granule deficiency 33%* (∼1/3 said NSAID) - 92% 83%
Non-diagnostic findings: Single agonist abnormality (below RI) 19% 26% 47% 90% 67%
Non-diagnostic: No 2o wave with epinephrine (within RI) 16% -
NSAID-like abnormality (congenital or acquired) 86% 72% - 80%
von Willebrand disease (type 2B) - 95% 83%
Bernard Soulier syndrome 85% 93% - 96% 35%
Glanzmann thrombasthenia 100% - 92%
How Good are Labs at Interpreting Aggregation Findings? Findings for real cases (NASCOLA Study)
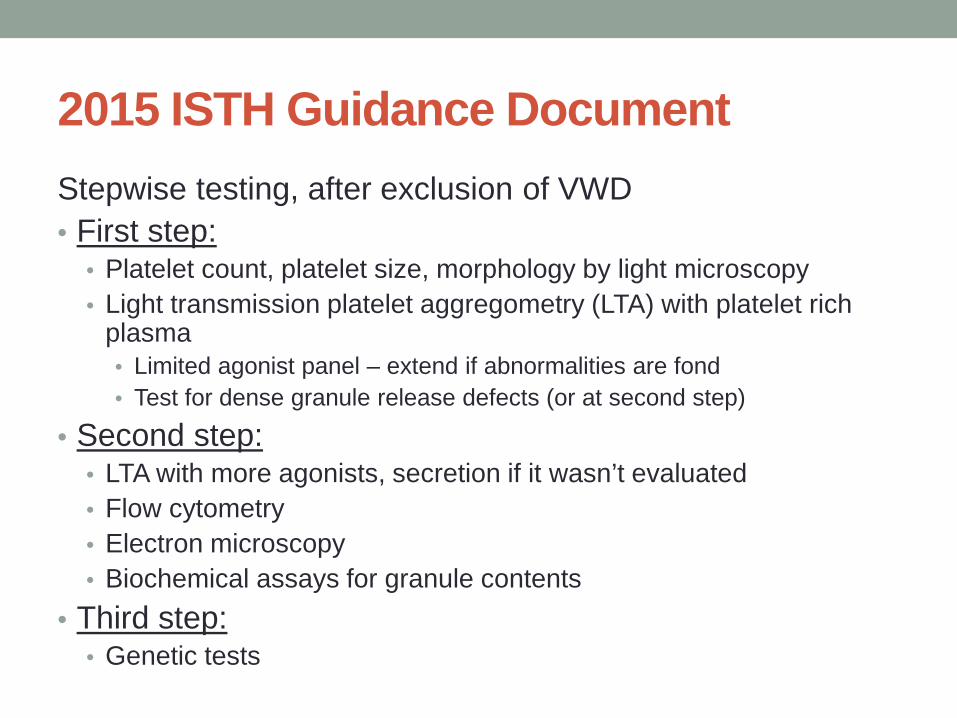
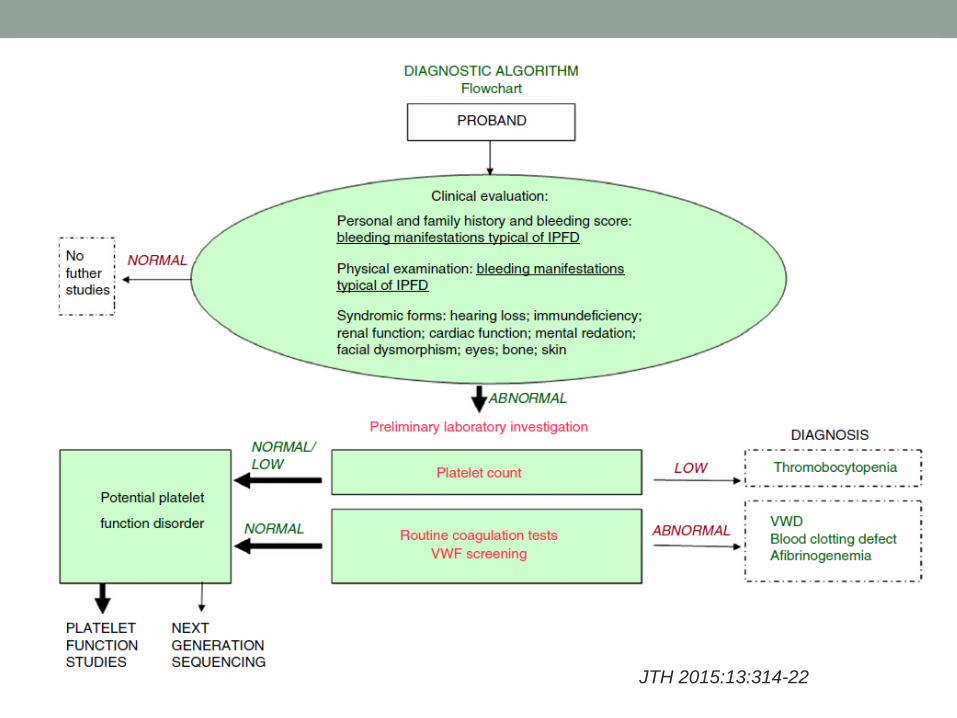
2015 ISTH Guidance Document Stepwise testing, after exclusion of VWD • First step:
• Platelet count, platelet size, morphology by light microscopy • Light transmission platelet aggregometry (LTA) with platelet rich
plasma • Limited agonist panel – extend if abnormalities are fond • Test for dense granule release defects (or at second step)
• Second step: • LTA with more agonists, secretion if it wasn’t evaluated • Flow cytometry • Electron microscopy • Biochemical assays for granule contents
• Third step: • Genetic tests
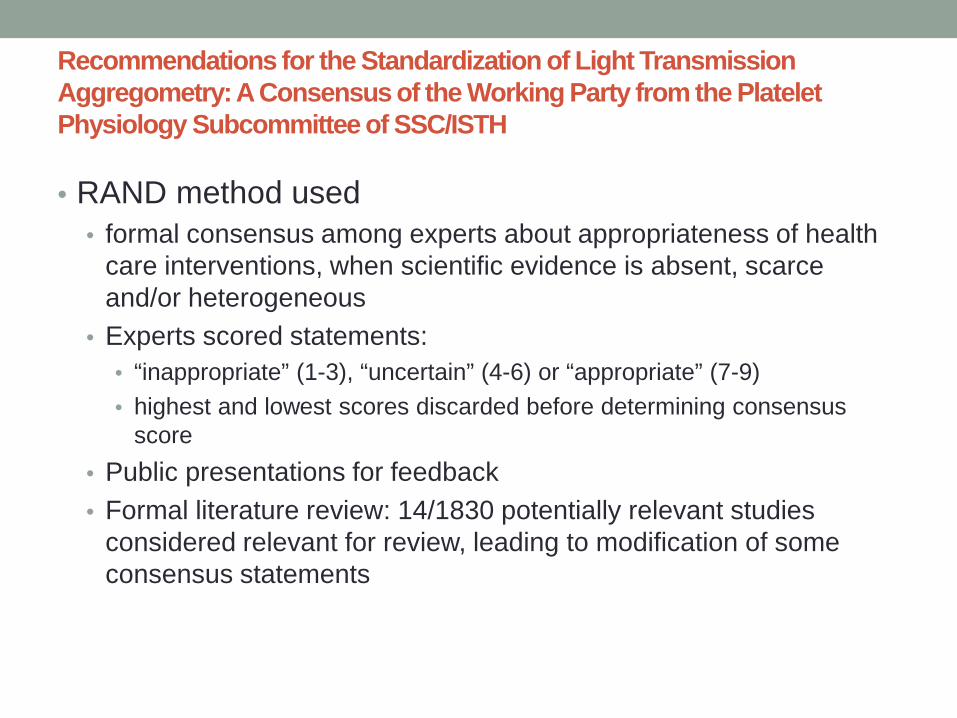
Recommendations for the Standardization of Light Transmission Aggregometry: A Consensus of the Working Party from the Platelet Physiology Subcommittee of SSC/ISTH • RAND method used
• formal consensus among experts about appropriateness of health care interventions, when scientific evidence is absent, scarce and/or heterogeneous
• Experts scored statements: • “inappropriate” (1-3), “uncertain” (4-6) or “appropriate” (7-9) • highest and lowest scores discarded before determining consensus
score • Public presentations for feedback • Formal literature review: 14/1830 potentially relevant studies
considered relevant for review, leading to modification of some consensus statements
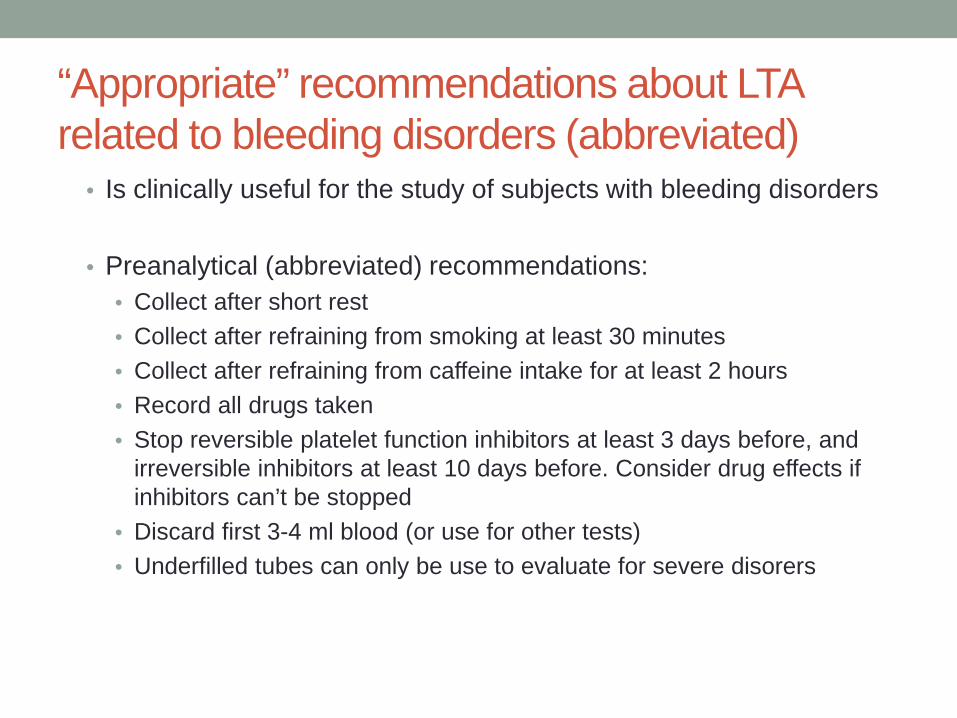
“Appropriate” recommendations about LTA related to bleeding disorders (abbreviated)
• Is clinically useful for the study of subjects with bleeding disorders
• Preanalytical (abbreviated) recommendations: • Collect after short rest • Collect after refraining from smoking at least 30 minutes • Collect after refraining from caffeine intake for at least 2 hours • Record all drugs taken • Stop reversible platelet function inhibitors at least 3 days before, and
irreversible inhibitors at least 10 days before. Consider drug effects if inhibitors can’t be stopped
• Discard first 3-4 ml blood (or use for other tests) • Underfilled tubes can only be use to evaluate for severe disorers
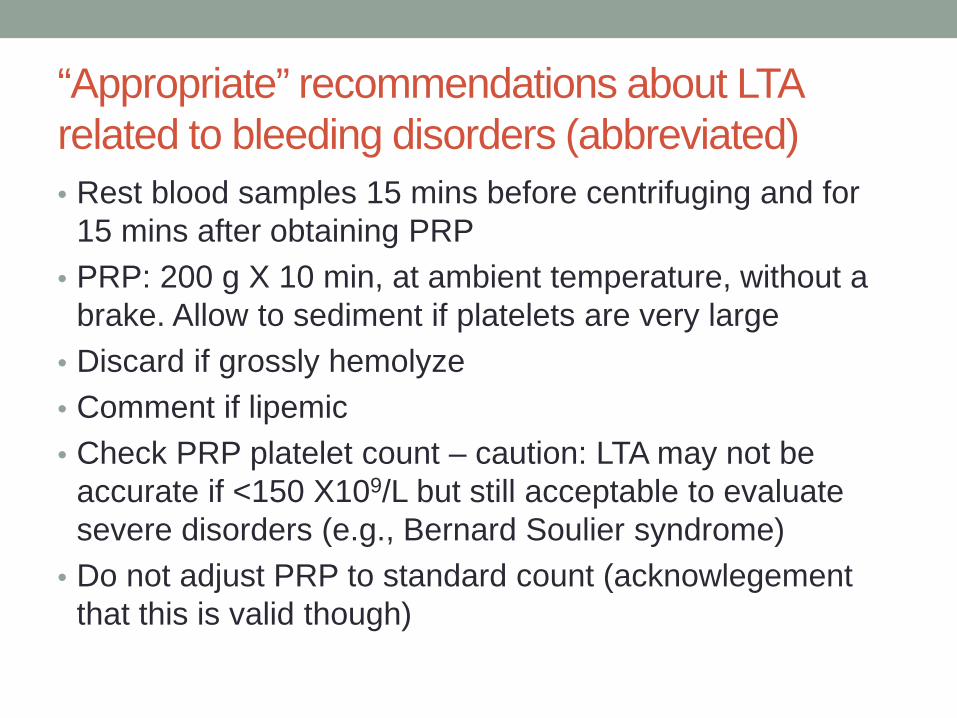
“Appropriate” recommendations about LTA related to bleeding disorders (abbreviated) • Rest blood samples 15 mins before centrifuging and for
15 mins after obtaining PRP • PRP: 200 g X 10 min, at ambient temperature, without a
brake. Allow to sediment if platelets are very large • Discard if grossly hemolyze • Comment if lipemic • Check PRP platelet count – caution: LTA may not be
accurate if <150 X109/L but still acceptable to evaluate severe disorders (e.g., Bernard Soulier syndrome)
• Do not adjust PRP to standard count (acknowlegement that this is valid though)
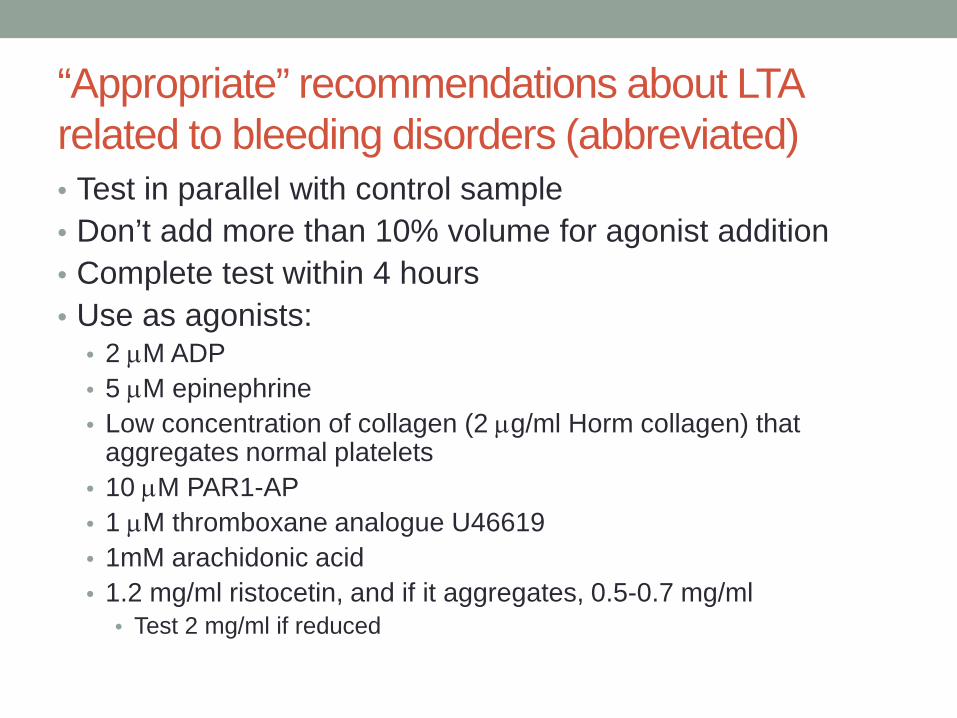
“Appropriate” recommendations about LTA related to bleeding disorders (abbreviated) • Test in parallel with control sample • Don’t add more than 10% volume for agonist addition • Complete test within 4 hours • Use as agonists:
• 2 µM ADP • 5 µM epinephrine • Low concentration of collagen (2 µg/ml Horm collagen) that
aggregates normal platelets • 10 µM PAR1-AP • 1 µM thromboxane analogue U46619 • 1mM arachidonic acid • 1.2 mg/ml ristocetin, and if it aggregates, 0.5-0.7 mg/ml
• Test 2 mg/ml if reduced
“Appropriate” recommendations about LTA related to bleeding disorders (abbreviated) • Evaluate:
• Presence of shape range • Length of lag phase • Slope of aggregation • Maximal, final and dis- aggregation, if there is secondary
aggregation with epinephrine • Perform a visual inspection of tracing
Expert Panel for this Working Party: P. Gresele, P. Harrison, C. Gachet, C. Hayward, D. Kenny, D. Mezzano, A.D. Mumford, D. Nugent, A.T. Nurden, M. Cattaneo
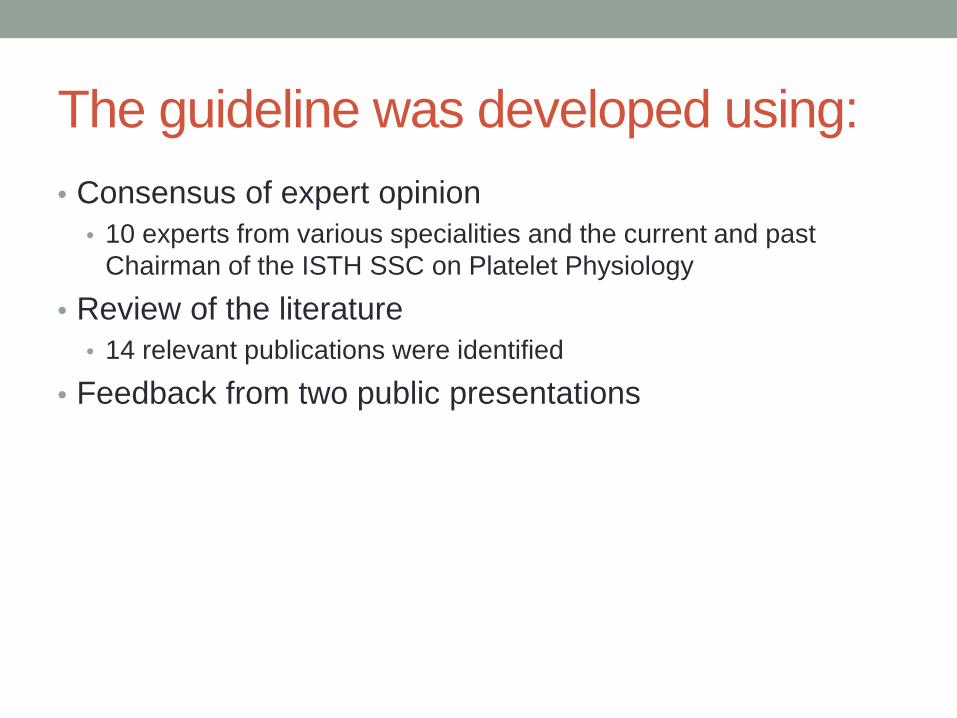
The guideline was developed using: • Consensus of expert opinion
• 10 experts from various specialities and the current and past Chairman of the ISTH SSC on Platelet Physiology
• Review of the literature • 14 relevant publications were identified
• Feedback from two public presentations
JTH 2015:13:314-22
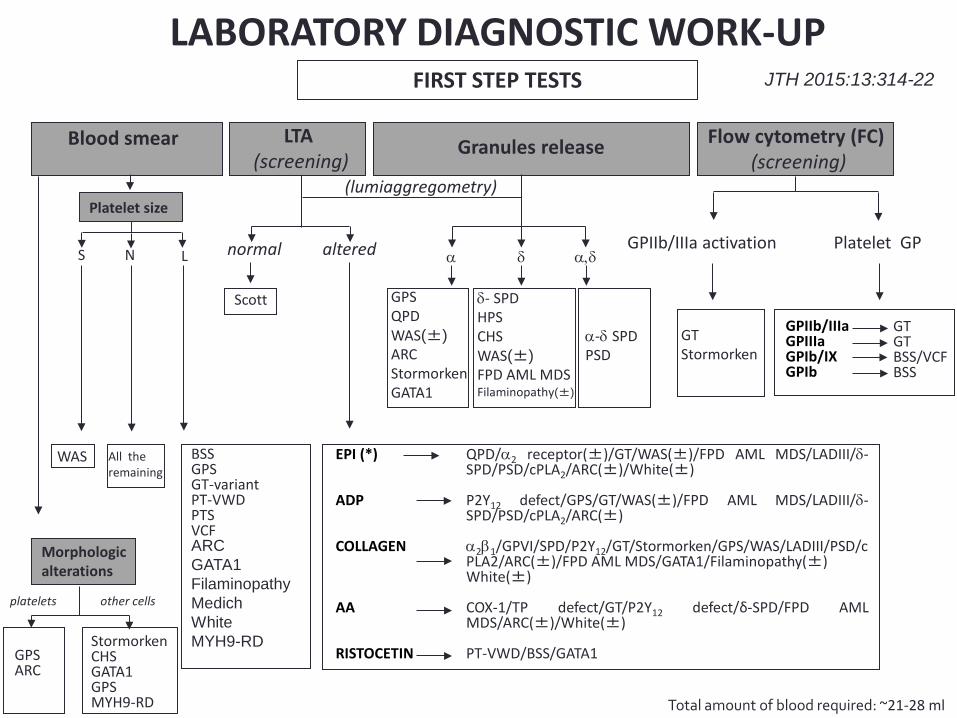
GT Stormorken
δ- SPD HPS CHS WAS(±) FPD AML MDS Filaminopathy(±)
α-δ SPD PSD
GPS QPD WAS(±) ARC Stormorken GATA1
BSS GPS GT-variant PT-VWD PTS VCF ARC GATA1 Filaminopathy Medich White MYH9-RD
FIRST STEP TESTS
S N
WAS All the remaining
L normal altered
Scott
QPD/α2 receptor(±)/GT/WAS(±)/FPD AML MDS/LADIII/δ-SPD/PSD/cPLA2/ARC(±)/White(±) P2Y12 defect/GPS/GT/WAS(±)/FPD AML MDS/LADIII/δ-SPD/PSD/cPLA2/ARC(±) α2β1/GPVI/SPD/P2Y12/GT/Stormorken/GPS/WAS/LADIII/PSD/cPLA2/ARC(±)/FPD AML MDS/GATA1/Filaminopathy(±) White(±) COX-1/TP defect/GT/P2Y12 defect/δ-SPD/FPD AML MDS/ARC(±)/White(±) PT-VWD/BSS/GATA1
EPI (*) ADP COLLAGEN AA RISTOCETIN
α δ α,δ Platelet GP GPIIb/IIIa activation
GT GT BSS/VCF BSS
GPIIb/IIIa GPIIIa GPIb/IX GPIb
LTA (screening)
Granules release Flow cytometry (FC) (screening)
Platelet size
Morphologic alterations
GPS ARC
LABORATORY DIAGNOSTIC WORK-UP
(lumiaggregometry)
Total amount of blood required: ~21-28 ml
Blood smear
Stormorken CHS GATA1 GPS MYH9-RD
platelets other cells
JTH 2015:13:314-22
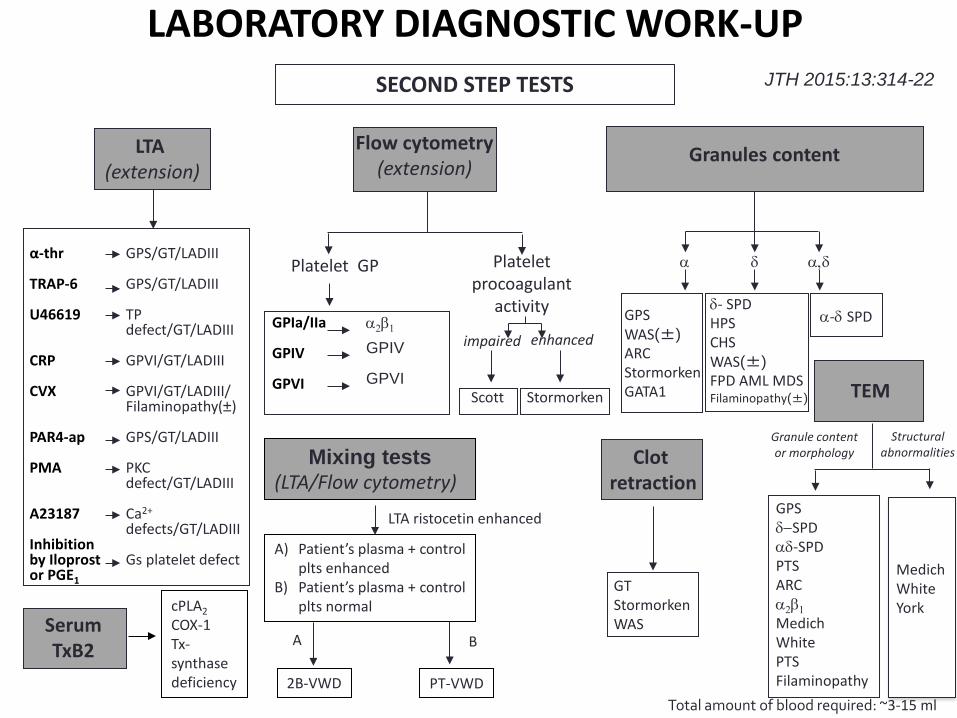
Serum TxB2
GPS δ−SPD αδ-SPD PTS ARC α2β1 Medich White PTS Filaminopathy
α-thr TRAP-6 U46619 CRP CVX PAR4-ap PMA A23187 Inhibition by Iloprost or PGE1 GT
Stormorken WAS
δ- SPD HPS CHS WAS(±) FPD AML MDS Filaminopathy(±)
LABORATORY DIAGNOSTIC WORK-UP
cPLA2 COX-1 Tx- synthase deficiency
LTA (extension)
GPS/GT/LADIII GPS/GT/LADIII TP defect/GT/LADIII GPVI/GT/LADIII GPVI/GT/LADIII/ Filaminopathy(±) GPS/GT/LADIII PKC defect/GT/LADIII Ca2+ defects/GT/LADIII Gs platelet defect
Clot retraction
SECOND STEP TESTS
LTA ristocetin enhanced
Mixing tests (LTA/Flow cytometry)
PT-VWD 2B-VWD
A) Patient’s plasma + control plts enhanced
B) Patient’s plasma + control plts normal
A B
Flow cytometry (extension)
Stormorken Scott
α2β1 GPIV GPVI
Platelet GP Platelet procoagulant
activity GPIa/IIa GPIV GPVI
enhanced impaired
TEM
Medich White York
Granule content or morphology
Structural abnormalities
Total amount of blood required: ~3-15 ml
α-δ SPD GPS WAS(±) ARC Stormorken GATA1
α δ α,δ
Granules content
JTH 2015:13:314-22
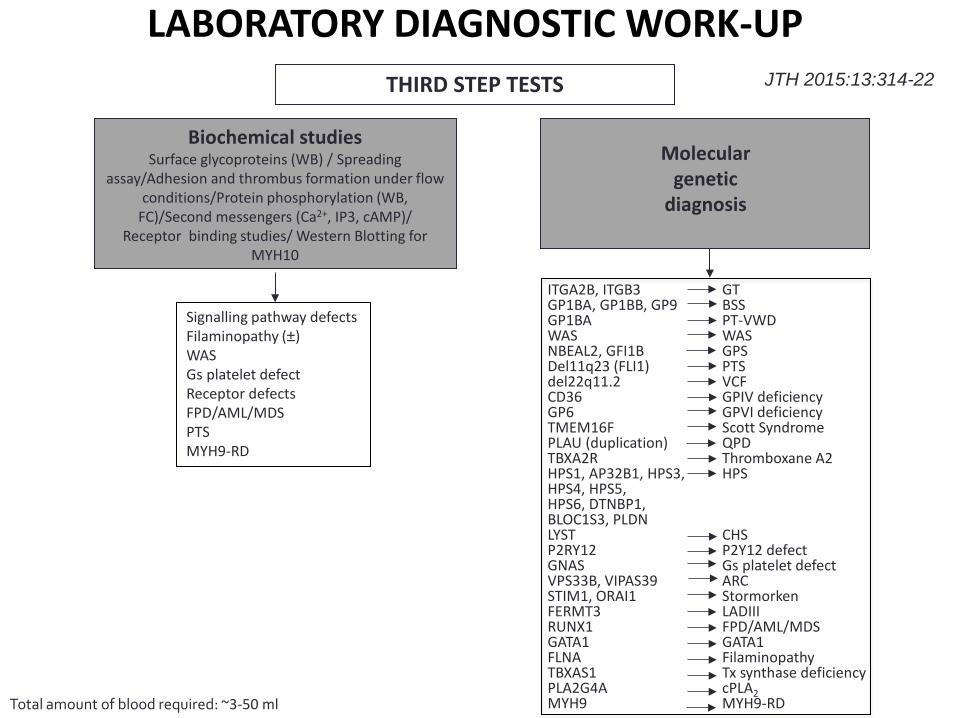
Biochemical studies Surface glycoproteins (WB) / Spreading
assay/Adhesion and thrombus formation under flow conditions/Protein phosphorylation (WB,
FC)/Second messengers (Ca2+, IP3, cAMP)/ Receptor binding studies/ Western Blotting for
MYH10
Signalling pathway defects Filaminopathy (±) WAS Gs platelet defect Receptor defects FPD/AML/MDS PTS MYH9-RD
GT BSS PT-VWD WAS GPS PTS VCF GPIV deficiency GPVI deficiency Scott Syndrome QPD Thromboxane A2 HPS CHS P2Y12 defect Gs platelet defect ARC Stormorken LADIII FPD/AML/MDS GATA1 Filaminopathy Tx synthase deficiency cPLA2 MYH9-RD
ITGA2B, ITGB3 GP1BA, GP1BB, GP9 GP1BA WAS NBEAL2, GFI1B Del11q23 (FLI1) del22q11.2 CD36 GP6 TMEM16F PLAU (duplication) TBXA2R HPS1, AP32B1, HPS3, HPS4, HPS5, HPS6, DTNBP1, BLOC1S3, PLDN LYST P2RY12 GNAS VPS33B, VIPAS39 STIM1, ORAI1 FERMT3 RUNX1 GATA1 FLNA TBXAS1 PLA2G4A MYH9
LABORATORY DIAGNOSTIC WORK-UP THIRD STEP TESTS
Molecular genetic
diagnosis
Total amount of blood required: ~3-50 ml
JTH 2015:13:314-22
Comments on latest guideline • Use of many laboratory-developed tests
• Research vs. clinical laboratory setting
• Applicability to clinical laboratory setting
• Are laboratories following this recent guideline? • See: Moffat et al, Poster Session II, 1045, Friday May 13
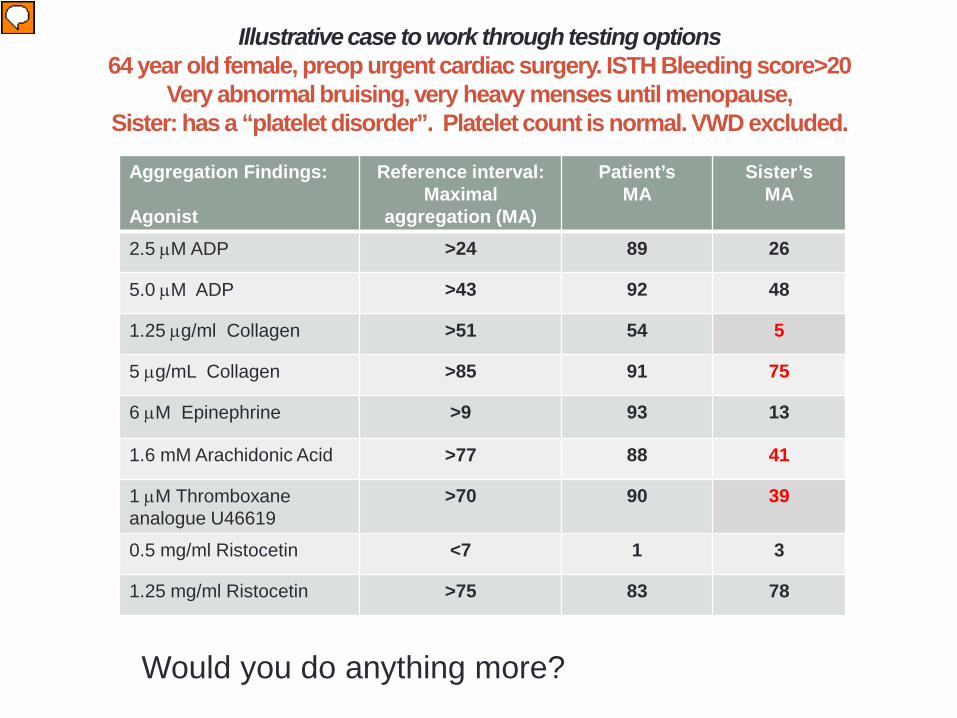
Illustrative case to work through testing options 64 year old female, preop urgent cardiac surgery. ISTH Bleeding score>20
Very abnormal bruising, very heavy menses until menopause, Sister: has a “platelet disorder”. Platelet count is normal. VWD excluded.
Aggregation Findings: Agonist
Reference interval: Maximal
aggregation (MA)
Patient’s MA
Sister’s MA
2.5 µM ADP >24 89 26
5.0 µM ADP >43 92 48
1.25 µg/ml Collagen >51 54 5
5 µg/mL Collagen >85 91 75
6 µM Epinephrine >9 93 13
1.6 mM Arachidonic Acid >77 88 41
1 µM Thromboxane analogue U46619
>70 90 39
0.5 mg/ml Ristocetin <7 1 3
1.25 mg/ml Ristocetin >75 83 78
Would you do anything more?
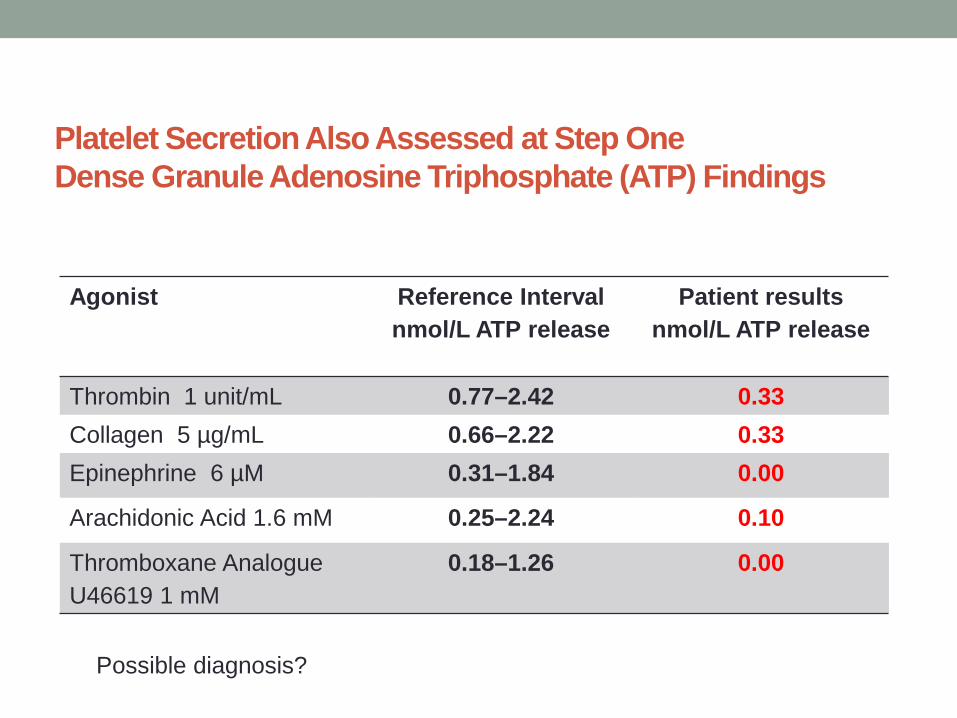
Platelet Secretion Also Assessed at Step One Dense Granule Adenosine Triphosphate (ATP) Findings
Agonist Reference Interval nmol/L ATP release
Patient results nmol/L ATP release
Thrombin 1 unit/mL 0.77–2.42 0.33 Collagen 5 µg/mL 0.66–2.22 0.33 Epinephrine 6 µM 0.31–1.84 0.00
Arachidonic Acid 1.6 mM 0.25–2.24 0.10
Thromboxane Analogue U46619 1 mM
0.18–1.26 0.00
Possible diagnosis?
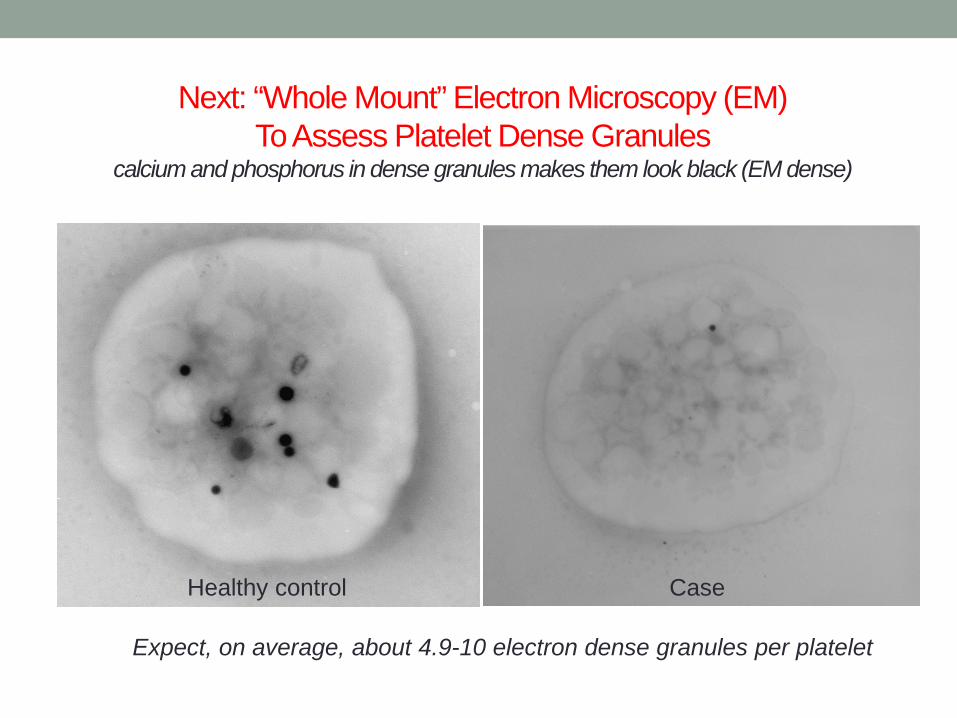
Next: “Whole Mount” Electron Microscopy (EM) To Assess Platelet Dense Granules
calcium and phosphorus in dense granules makes them look black (EM dense)
Healthy control Case
Expect, on average, about 4.9-10 electron dense granules per platelet
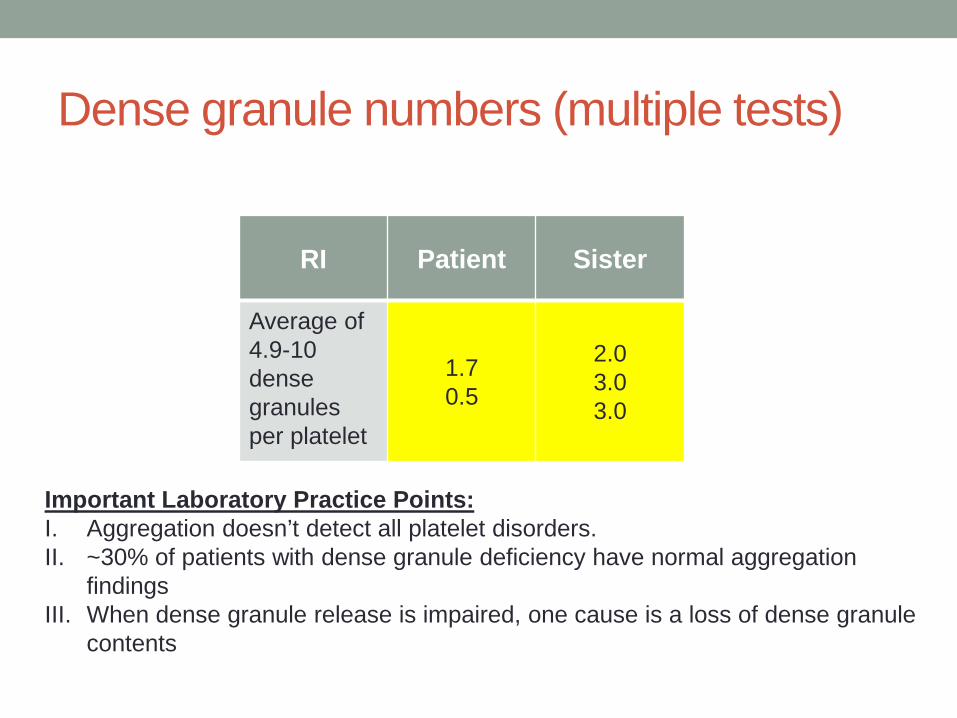
Dense granule numbers (multiple tests)
RI Patient Sister
Average of 4.9-10 dense granules per platelet
1.7 0.5
2.0 3.0 3.0
Important Laboratory Practice Points: I. Aggregation doesn’t detect all platelet disorders. II. ~30% of patients with dense granule deficiency have normal aggregation
findings III. When dense granule release is impaired, one cause is a loss of dense granule
contents
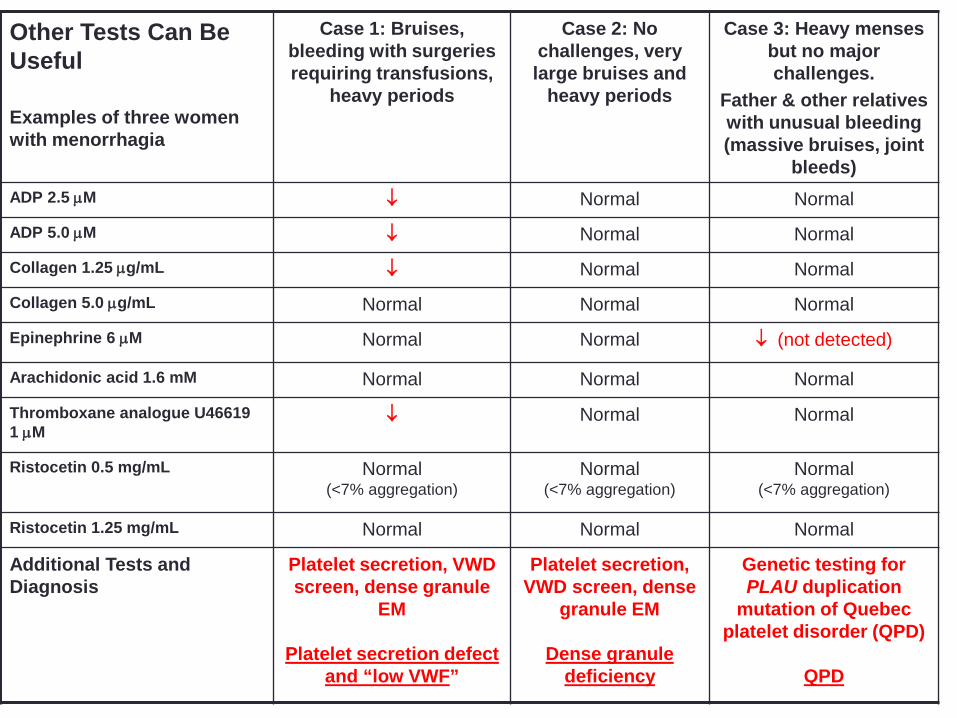
Other Tests Can Be Useful Examples of three women with menorrhagia
Case 1: Bruises, bleeding with surgeries requiring transfusions,
heavy periods
Case 2: No challenges, very large bruises and
heavy periods
Case 3: Heavy menses but no major challenges.
Father & other relatives with unusual bleeding (massive bruises, joint
bleeds) ADP 2.5 µM ↓ Normal Normal
ADP 5.0 µM ↓ Normal Normal
Collagen 1.25 µg/mL ↓ Normal Normal
Collagen 5.0 µg/mL Normal Normal Normal
Epinephrine 6 µM Normal Normal ↓ (not detected)
Arachidonic acid 1.6 mM Normal Normal Normal
Thromboxane analogue U46619 1 µM
↓ Normal Normal
Ristocetin 0.5 mg/mL Normal (<7% aggregation)
Normal (<7% aggregation)
Normal (<7% aggregation)
Ristocetin 1.25 mg/mL Normal Normal Normal
Additional Tests and Diagnosis
Platelet secretion, VWD screen, dense granule
EM
Platelet secretion defect and “low VWF”
Platelet secretion, VWD screen, dense
granule EM
Dense granule deficiency
Genetic testing for PLAU duplication
mutation of Quebec platelet disorder (QPD)
QPD
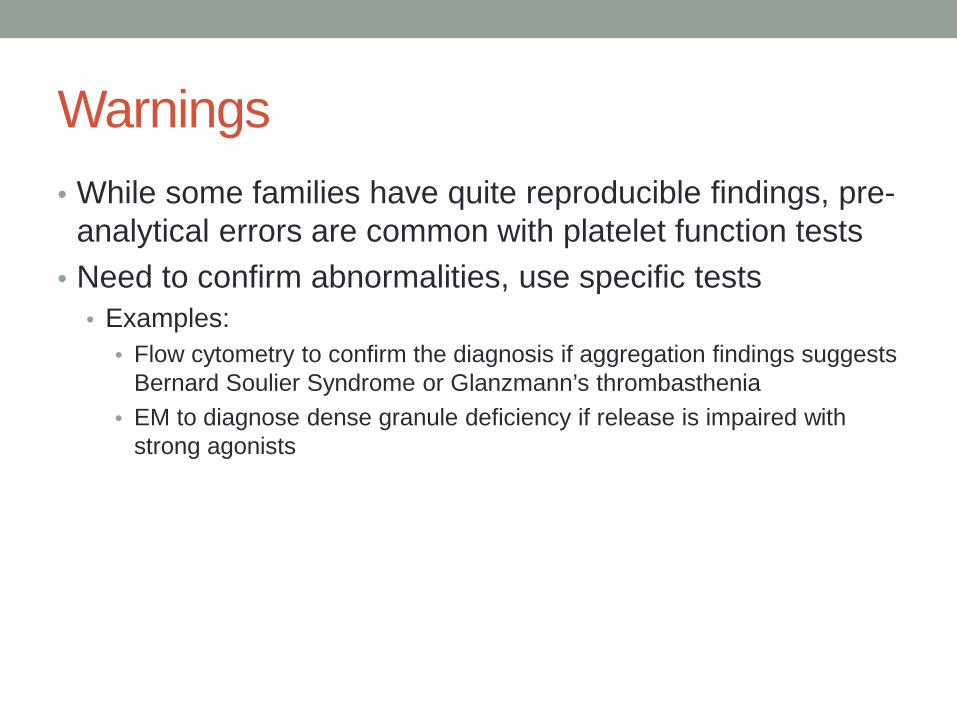
Warnings • While some families have quite reproducible findings, pre-
analytical errors are common with platelet function tests • Need to confirm abnormalities, use specific tests
• Examples: • Flow cytometry to confirm the diagnosis if aggregation findings suggests
Bernard Soulier Syndrome or Glanzmann’s thrombasthenia • EM to diagnose dense granule deficiency if release is impaired with
strong agonists
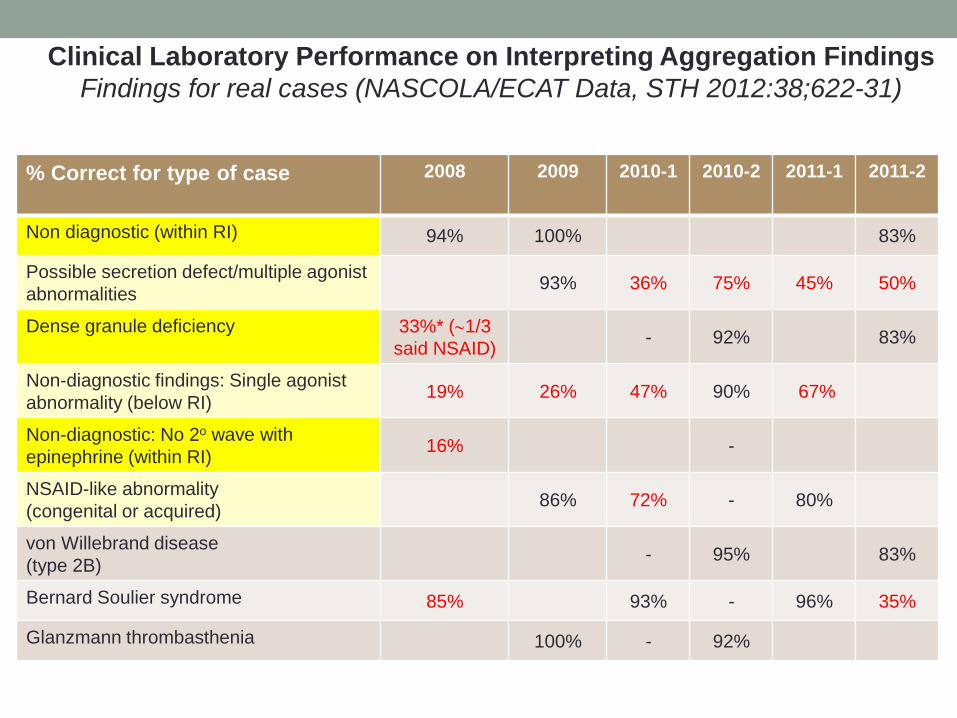
% Correct for type of case
2008 2009 2010-1 2010-2 2011-1 2011-2
Non diagnostic (within RI) 94% 100% 83%
Possible secretion defect/multiple agonist abnormalities 93% 36% 75% 45% 50%
Dense granule deficiency 33%* (∼1/3 said NSAID) - 92% 83%
Non-diagnostic findings: Single agonist abnormality (below RI) 19% 26% 47% 90% 67%
Non-diagnostic: No 2o wave with epinephrine (within RI) 16% -
NSAID-like abnormality (congenital or acquired) 86% 72% - 80%
von Willebrand disease (type 2B) - 95% 83%
Bernard Soulier syndrome 85% 93% - 96% 35%
Glanzmann thrombasthenia 100% - 92%
Clinical Laboratory Performance on Interpreting Aggregation Findings Findings for real cases (NASCOLA/ECAT Data, STH 2012:38;622-31)
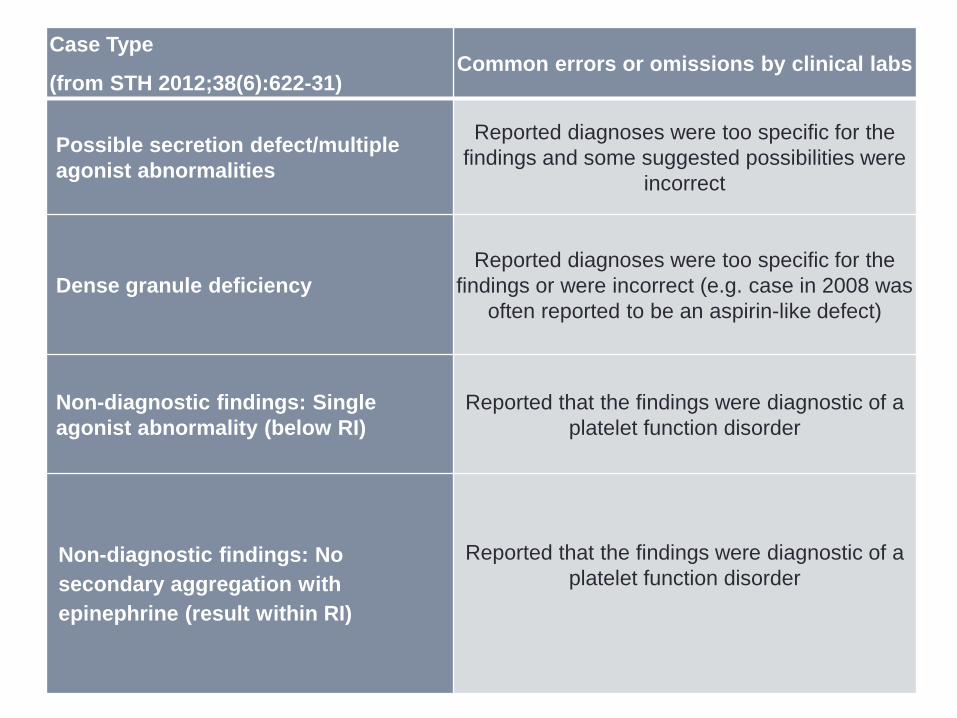
Case Type
(from STH 2012;38(6):622-31) Common errors or omissions by clinical labs
Possible secretion defect/multiple agonist abnormalities
Reported diagnoses were too specific for the findings and some suggested possibilities were
incorrect
Dense granule deficiency Reported diagnoses were too specific for the
findings or were incorrect (e.g. case in 2008 was often reported to be an aspirin-like defect)
Non-diagnostic findings: Single agonist abnormality (below RI)
Reported that the findings were diagnostic of a platelet function disorder
Non-diagnostic findings: No secondary aggregation with epinephrine (result within RI)
Reported that the findings were diagnostic of a platelet function disorder
Usefulness of assessing dense granule ATP release for diagnosing platelet function disorders?
• Lumi-aggregometry assessment of platelet dense granule adenosine triphosphate (ATP) release is widely used for diagnosing platelet function disorders
• Recent ISTH guidelines recommend this testing be done as part of the diagnostic-work up of platelet function disorders
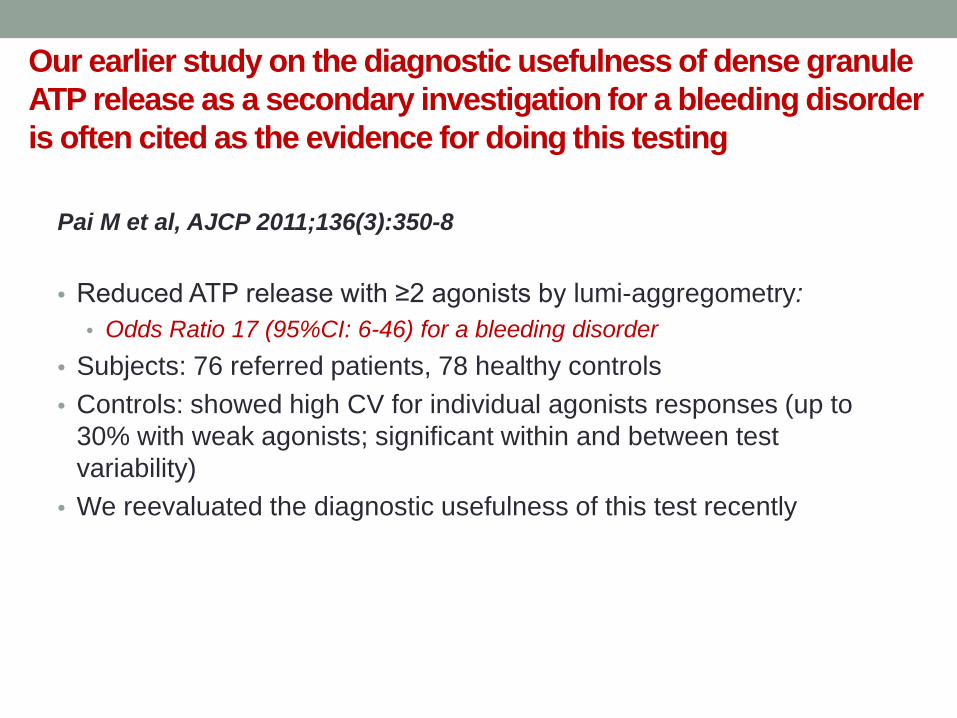
Our earlier study on the diagnostic usefulness of dense granule ATP release as a secondary investigation for a bleeding disorder is often cited as the evidence for doing this testing
Pai M et al, AJCP 2011;136(3):350-8 • Reduced ATP release with ≥2 agonists by lumi-aggregometry:
• Odds Ratio 17 (95%CI: 6-46) for a bleeding disorder • Subjects: 76 referred patients, 78 healthy controls • Controls: showed high CV for individual agonists responses (up to
30% with weak agonists; significant within and between test variability)
• We reevaluated the diagnostic usefulness of this test recently
Re-evaluation of the diagnostic usefulness of ATP release Badin et al, submitted (presented at THSNA two weeks ago)
• Looked at a larger number of subjects, and the consistency of test findings
• Evaluated two cohorts, 150 unique patient subjects
Latest study findings 1. Platelet dense granule ATP release findings are often
inconsistent amongst patients tested for a bleeding disorder AND consistent abnormalities are not predictive of a bleeding disorder (or increased bleeding scores)
not surprising given the reported high coefficient of variation for healthy control tests
2. Our study raises questions about whether it is appropriate to use (or recommend) a test with such variability for diagnostic purposes
other publications: tests with CV >20% should not be used for diagnostic purposes

Acknowledgments: Colleagues and Collaborators
Springtime Bliss Cathy Hayward
Recommended