L aboratory of P hysical and A nalytical C hemistry
KULeuven
Department of Chemistry
Laboratory for Physical and Analytical Chemistry (LPAC)
Celestijnenlaan 200 F
3001 Leuven
Belgium
Tel: 0032 16 32 7376
Fax: 0032 16 32 7992
www.chem.kuleuven.be/research/LPAC/index.htm
General MeetingLeuven, 23/11/2005
Frank De Smedt
Hans Vankerckhoven
Prof. C. Vinckier
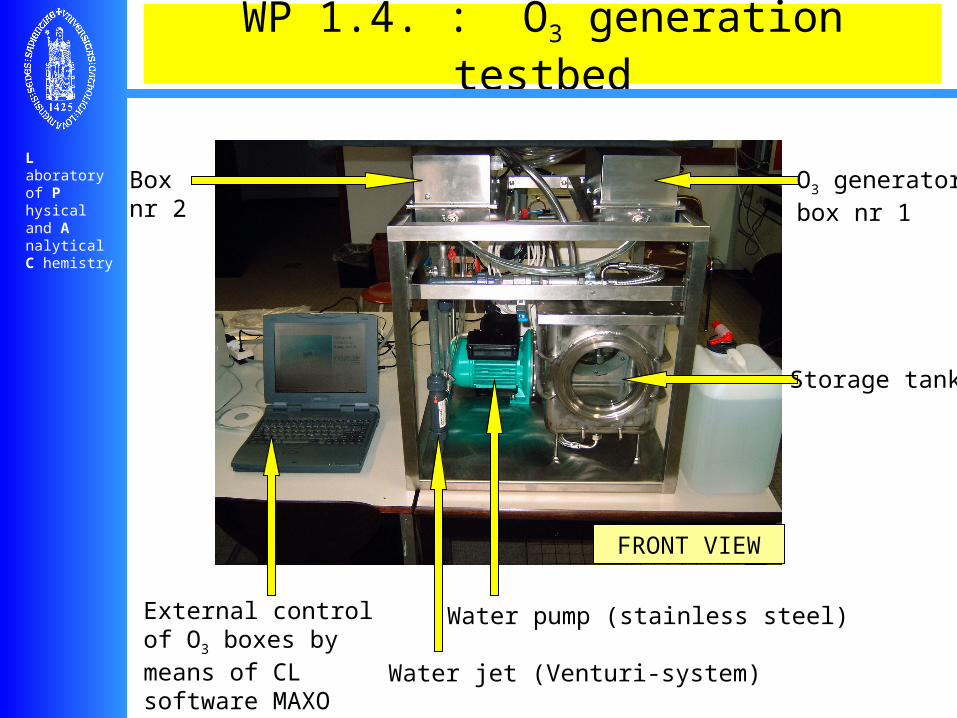
WP 1.4. : O3 generation testbed
L aboratory of P hysical and A nalytical C hemistry
O3 generatorbox nr 1
Storage tank
Water jet (Venturi-system)
FRONT VIEW
External control of O3 boxes by means of CL software MAXO
Boxnr 2
Water pump (stainless steel)
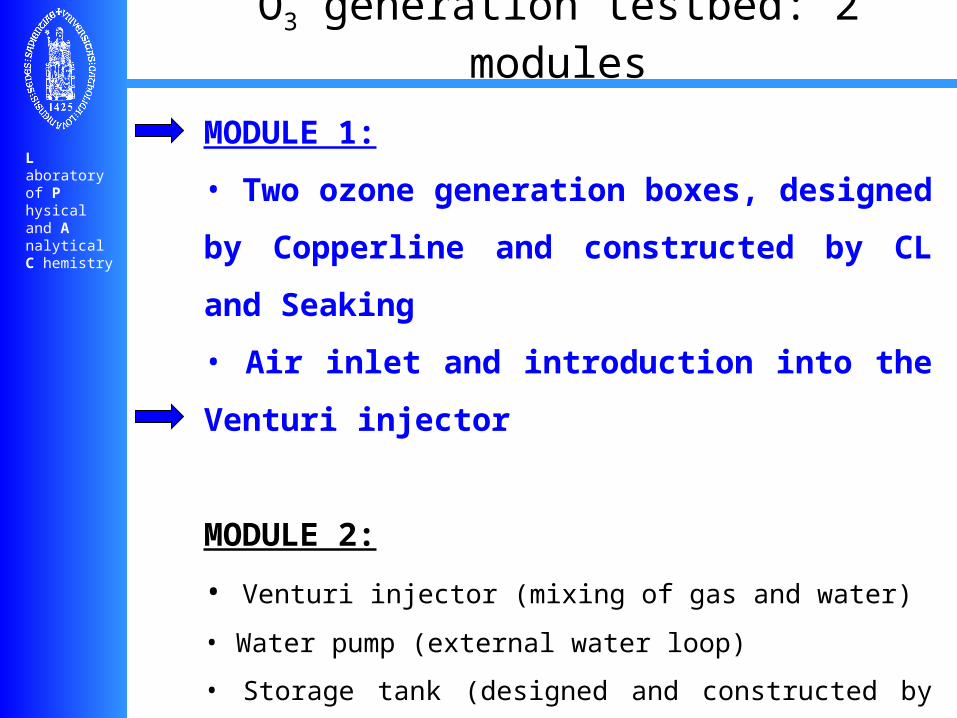
O3 generation testbed: 2 modules
L aboratory of P hysical and A nalytical C hemistry
MODULE 1:
• Two ozone generation boxes, designed by
Copperline and constructed by CL and Seaking
• Air inlet and introduction into the Venturi injector
MODULE 2:
• Venturi injector (mixing of gas and water)
• Water pump (external water loop)
• Storage tank (designed and constructed by Copperline and
Seaking)
see 2nd Technical meeting (Offenburg) + Report W.P. 1.3

WP 1.4. : O3 generation testbed
L aboratory of P hysical and A nalytical C hemistry
OUTLINE
HISTORY
AIR TIGHTNESS
OZONE GAS CONCENTRATION [O3]gas
Pure O2
N2/O2 (air)
Note: target = air as feed gas[O3]gas ≥ 10 g/m3 (0.5 % v/v)

W.P. 1.4: O3 generation testbed
L aboratory of P hysical and A nalytical C hemistry
HISTORY

L aboratory of P hysical and A nalytical C hemistry
W.P. 1.4: O3 generation testbed
CONSTRUCTION: Copperline (ETR) and Seaking
INSTALLATION: beginning of july 2005 at LPAC
(see Minutes of the installation)
LEAKS ! (new type of cover needed)
suggestion for a smaller air corridor
(because of extreme low [O3]gas)
ADAPTATIONS: new cover was constructed and installed
at 2nd Technical meeting (CL-Seaking)
further adaptations to the cover by LPAC
(reinforcement + screws)

L aboratory of P hysical and A nalytical C hemistry
W.P. 1.4: O3 generation testbed
Smaller air corridor(from 2.2 to 0.4 liter)
Additional reinforcement

L aboratory of P hysical and A nalytical C hemistry
AIRTIGHTNESS
W.P. 1.4: O3 generation testbed

L aboratory of P hysical and A nalytical C hemistry
W.P. 1.4: O3 generation testbed
PUMP
VENTURI
WATER
AIRWATER / AIR
PRESSURE METER
FLOW REGULATOR AND METER
FLOW REGULATOR
exhaust
Flow meter
O3 Box
1
2
CHECKING THE AIR TIGHTNESS by
→ air suction (Venturi system)
→ pressure (Mass Flow Controller)
O2
FC
Ventinghood
O3 Box
Flowmeter

L aboratory of P hysical and A nalytical C hemistry
W.P. 1.4: O3 generation testbed
Air tightness of the O3 Boxes with Qwater = 3 l/min and 8 turns of the Venturi regulator. Qair measured by the Schlumberger Flow meter.
Qair (Schlumberger) Relative decrease dm3/hr %
blank 174.97 ± 1.74 Box 1, valve open 175.14 ± 0.82 Box 1, valve closed 103.52 ± 1.15 40.9 Box 2, valve open 153.40 ± 2.71 Box 2, valve closed 74.26 ± 2.00 51.6
RESULTS AND DISCUSSION
Airsuction
Air tightness of O3 Box 2 and Box 1 + 2 as a function of QO2 (Brooks F.C.). Gas flow measured by the Schlumberger flow meter.
QO2 (F.C.) QO2 (Schlumberger) Relative loss
dm3/hr dm3/hr % Box 2
60 60.76 ± 0.36 Test (before O3 Box) 60 57.74 ± 0.28 3.8 30 28.15 ± 0.21 6.2 10 9.00 ± 0.36 10.0 60 53.53 ± 0.28 10.78 80 71.30 ± 0.49 10.88
100 89.87 ± 0.25 10.13 120 106.77 ± 0.87 11.03 140 124.66 ± 1.26 10.96
Box 1 + 2 60 58.06 ± 0. 10 Test (before O3 Box) 60 35.83 ± 0.76 40.3
Airpressure
L aboratory of P hysical and A nalytical C hemistry
OZONE
PRODUCTION
W.P. 1.4: O3 generation testbed

L aboratory of P hysical and A nalytical C hemistry
W.P. 1.4: O3 generation testbed
O3 BOXES CL
Upper part Upper part
MODULE 1
MODULE 2
MODULE 3
PATT-devices:6 per Box
(2 per Module)
Box 1: Module 1 to 3Box 2: Module 4 to 6
L aboratory of P hysical and A nalytical C hemistry
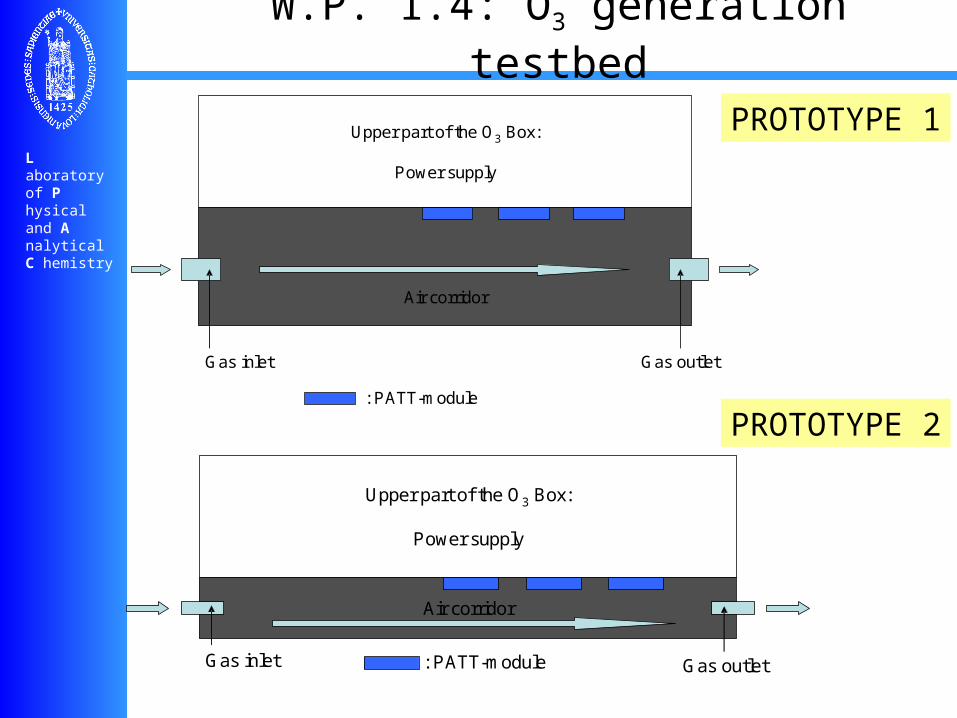
W.P. 1.4: O3 generation testbed
Upper part of the O3 Box:
Power supply
Air corridor
Gas inlet Gas outlet
: PATT-module
PROTOTYPE 1
Upper part of the O3 Box:
Power supply
Air corridor
Gas inlet Gas outlet: PATT-module
PROTOTYPE 2
L aboratory of P hysical and A nalytical C hemistry
W.P. 1.4: O3 generation testbed
O2
FC
Ventinghood
O3 Box
O3
sensor
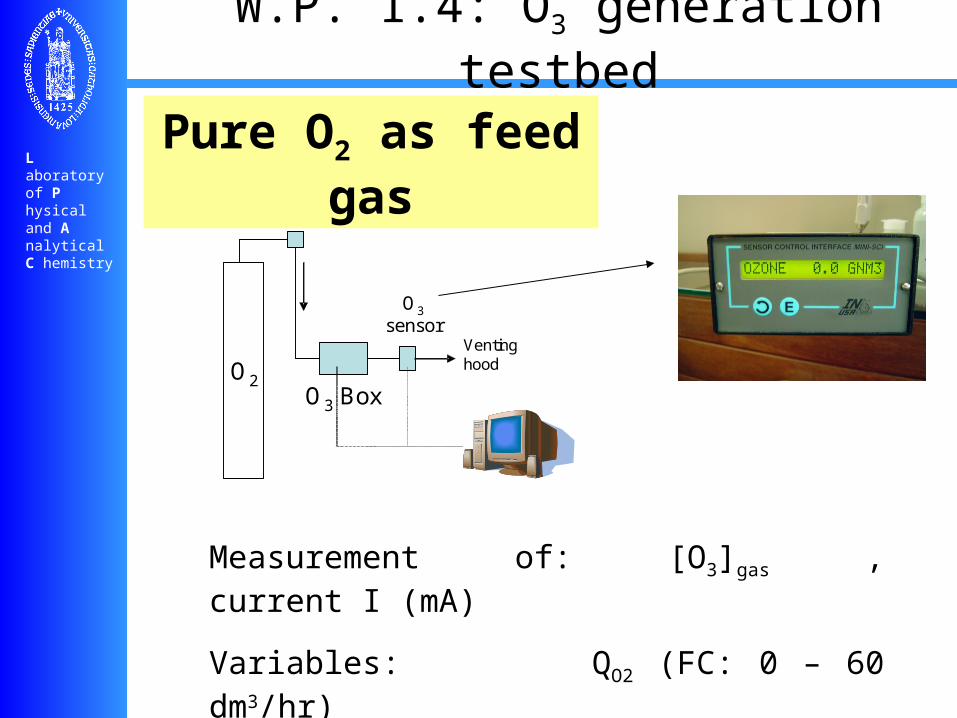
Pure O2 as feed gas
Measurement of: [O3]gas , current I (mA)
Variables: QO2 (FC: 0 – 60 dm3/hr)n° of ModulesPower setting (% P)

L aboratory of P hysical and A nalytical C hemistry
W.P. 1.4: O3 generation testbed
Pure O2
Gas inlet Gasoutlet
: PATT-module
Air corridorO--O
O--OO--O O--OO--O
O--O O--O
O--O
O--O
O--O : O2 molecule : discharge
Reaction Rate constant k units R1 O2 + ε → ε + O + O (1) cm3s-1 R2 O + O2 + O2 → O 3 + O2 6.401 10-35 exp(663/T) cm6s-1 R3 O + O2 + O3 → O 3 + O3 1.45 10-34 exp(663/T) cm6s-1 R4 O + O3 → O 2 + O2 1.9 10-11 exp(-2300/T) cm3s-1 R5 O3 + ε → ε + O + O 2 (2) cm3s-1 R6 O3 + wall → 1.5 O 2 + wall (3) s-1 R7 O + O + O2 → O 2 + O2
L aboratory of P hysical and A nalytical C hemistry
W.P. 1.4: O3 generation testbed
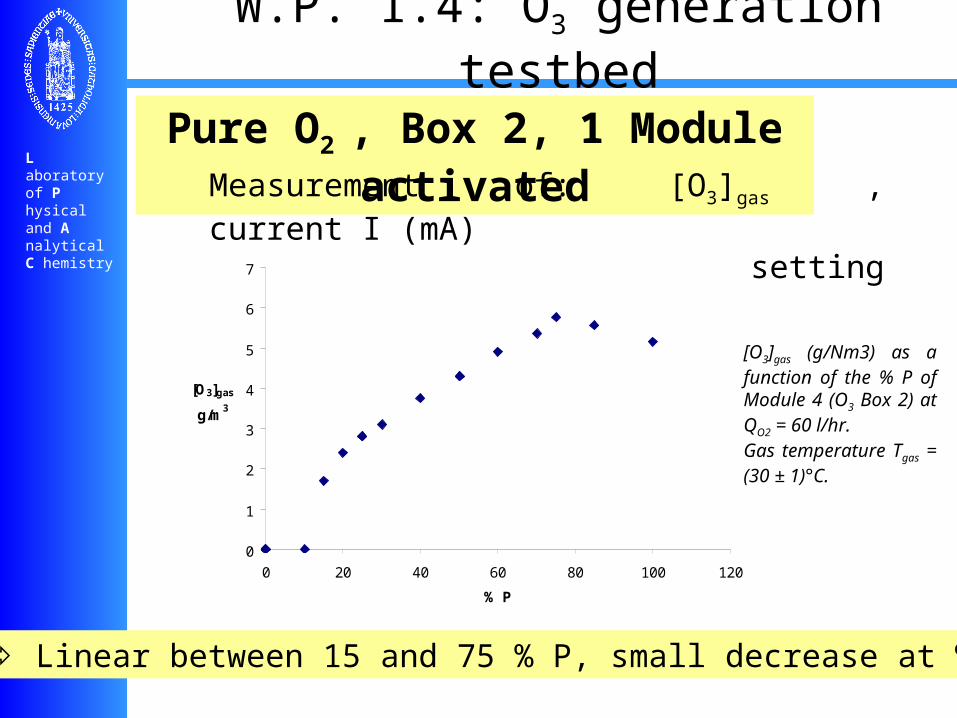
Pure O2 , Box 2, 1 Module activatedMeasurement of: [O3]gas , current I (mA)Variables: Power setting (% P)
0
1
2
3
4
5
6
7
0 20 40 60 80 100 120
% P
[O3]gas
g/m3
[O3]gas (g/Nm3) as a function of the % P of Module 4 (O3 Box 2) at QO2 = 60 l/hr. Gas temperature Tgas = (30 ± 1)°C.
Linear between 15 and 75 % P, small decrease at % P > 75

L aboratory of P hysical and A nalytical C hemistry
W.P. 1.4: O3 generation testbed
0
100
200
300
400
500
600
0 20 40 60 80 100 120
% P
I(mA)
Pure O2 , Box 2, 1 Module activated
I (mA) as a function of the % P of Module 4 (O3 Box 2) at QO2 = 60 l/hr. Gas temperature Tgas = (30 ± 1)°C.
Same trend as with [O3]gas
y = 0.0107x - 0.0031
R2 = 0.9879
0
1
2
3
4
5
6
0 100 200 300 400 500 600
I (mA)
[O3]gas
g/m3
[O3]gas as a function of I (mA) of Module 4 (O3 Box 2) at QO2 = 60 l/hr. Gas temperature Tgas = (30 ± 1)°C.
Linear relationship between [O3]gas and I

L aboratory of P hysical and A nalytical C hemistry
W.P. 1.4: O3 generation testbed
0
1
2
3
4
5
6
0 15 30 45 60 75 90 105 120 135 150
time (minutes)
[O3]gas
g/m3 25 % P
50 % P
85 % P
100% P
Pure O2 , Box 2, 1 Module activated
Time dependence of O3 buildup
First buildup isalways slower
Temperature-effect ?
0
1
2
3
4
5
6
7
0 100 200 300 400 500 600
time (minutes)
[O3]gas
g/m3
10 % P85 % P
75 % P

L aboratory of P hysical and A nalytical C hemistry
W.P. 1.4: O3 generation testbed
Pure O2 , Box 2, 1 Module activated
Reproducibility (from day-to-day) Very reproducible ozone production
0
1
2
3
4
5
6
7
0 20 40 60 80 100
% P
[O3]gas
g/m3
19/10/200520/10/200521/10/200524/10/200528/10/2005
0
1
2
3
4
5
6
7
0 100 200 300 400 500 600
I (mA)
[O3]gas
g/m3
19/10/200520/10/200521/10/200524/10/200528/10/2005

L aboratory of P hysical and A nalytical C hemistry
W.P. 1.4: O3 generation testbed
Pure O2 , Box 2, 3 Modules activatedVariables: n° of Modules, position, Power setting (% P)
15.4
12
8
15.4
10.7 10.55 10.6
15.3
0
2
4
6
8
10
12
14
16
18
75
+7
5+
75
50
+5
0+
50
25
+2
5+
25
10
0+
10
0+
10
0
75
+2
5+
25
25
+2
5+
75
25
+7
5+
25
75
+7
5+
75
[O3]gas
g/m3
Device 4 + 5 + 6 exp
device 4 + 5 + 6 calculated
iModule
gas
n
ifinalgas OO
1
3,3 Cumulative O3 production (n = 3) Position in air corridor of no importance

L aboratory of P hysical and A nalytical C hemistry
W.P. 1.4: O3 generation testbed
Pure O2 , Box 2, 3 Modules activatedVariables: QO2
Exponential dependence of the O3 concentration on QO2
Reproducibility !
0
10
20
30
40
50
60
0 50 100 150 200 250 300 350 400 450 500 550 600
QO2 (l/hr)
[O3]gas
g/m3
24/10/200525/10/200528/10/20054/11/200510/11/2005
5
48.7
L aboratory of P hysical and A nalytical C hemistry
W.P. 1.4: O3 generation testbed
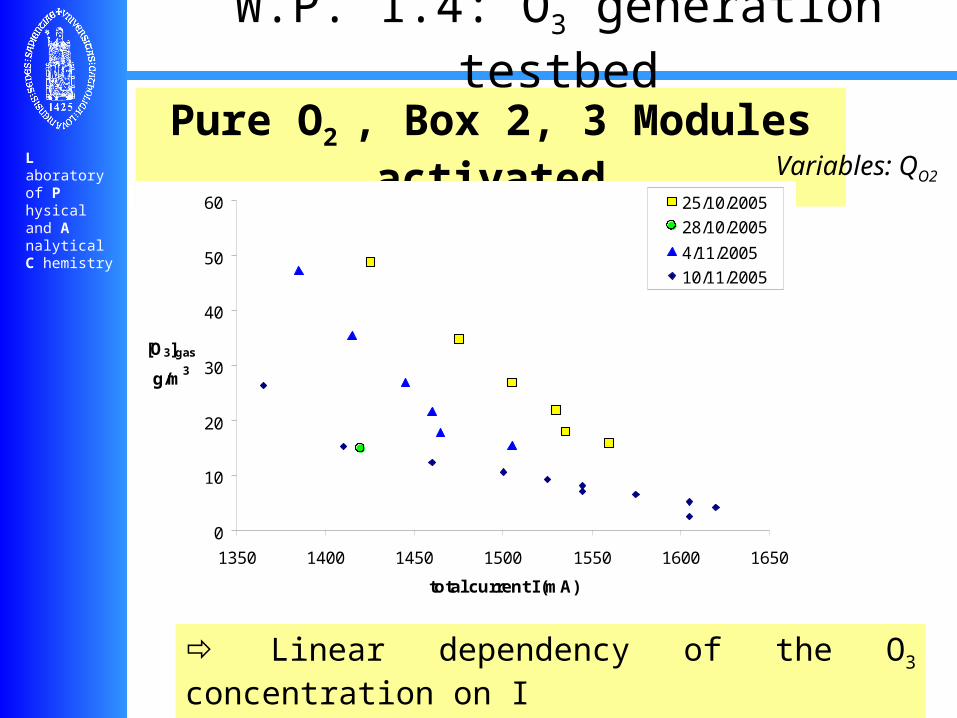
Pure O2 , Box 2, 3 Modules activatedVariables: QO2
Linear dependency of the O3 concentration on I(but different from 1 Module at constant QO2)
0
10
20
30
40
50
60
1350 1400 1450 1500 1550 1600 1650
total current I (mA)
[O3]gas
g/m3
25/10/2005
28/10/2005
4/11/2005
10/11/2005

L aboratory of P hysical and A nalytical C hemistry
W.P. 1.4: O3 generation testbed
Pure O2 , Box 2, 3 Modules activatedCapacity of the ozone generator a.f.o. QO2 (3 Modules at 75% P)
exponential increase of the O3 capacity a.f.o. QO2
0
0.2
0.4
0.6
0.8
1
1.2
1.4
1.6
0 50 100 150 200 250 300 350 400 450 500 550 600
QO2 (l/hr)
O3 capac.g/hr
24/10/2005
25/10/200528/10/2005
4/11/200510/11/2005
Capacity = [O3]gas x QO2
L aboratory of P hysical and A nalytical C hemistry
W.P. 1.4: O3 generation testbed
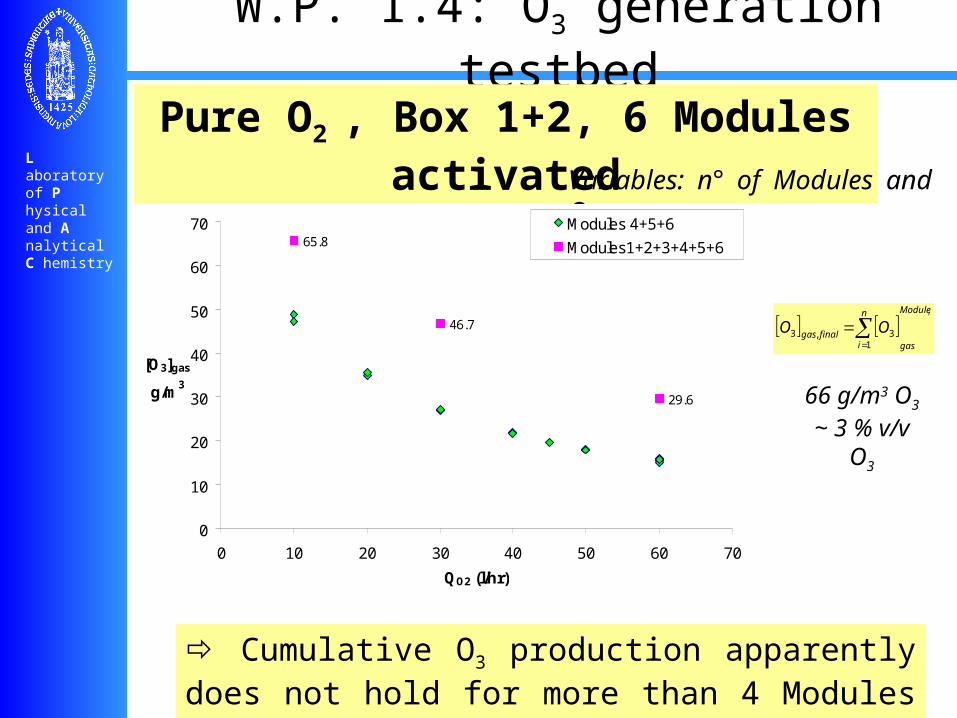
Pure O2 , Box 1+2, 6 Modules activatedVariables: n° of Modules and QO2
iModule
gas
n
ifinalgas OO
1
3,3
Cumulative O3 production apparently does not hold for more than 4 Modules (air tightness problem Box 1?)
65.8
46.7
29.6
0
10
20
30
40
50
60
70
0 10 20 30 40 50 60 70
QO2 (l/hr)
[O3]gas
g/m3
Modules 4+5+6
Modules1+2+3+4+5+6
47.3
30.3
14.9
66 g/m3 O3 ~ 3 % v/v O3
L aboratory of P hysical and A nalytical C hemistry
W.P. 1.4: O3 generation testbed
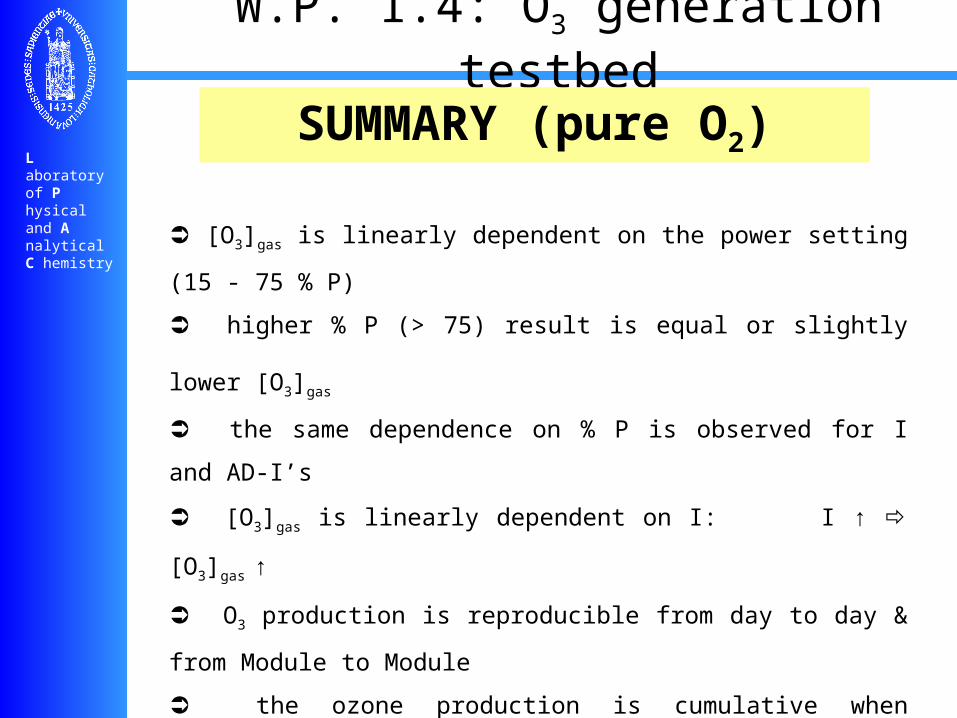
SUMMARY (pure O2)
[O3]gas is linearly dependent on the power setting (15 - 75 % P)
higher % P (> 75) result is equal or slightly lower [O3]gas
the same dependence on % P is observed for I and AD-I’s
[O3]gas is linearly dependent on I: I ↑ [O3]gas ↑
O3 production is reproducible from day to day & from Module to Module
the ozone production is cumulative when multiple Modules are used for
n = 3, but not for n = 6 (Modules in two separate Boxes)
[O3]gas is depending on QO2: QO2 ↓ [O3]gas ↑ (n = 3 and n = 6), again
this production is reproducible from day to day
QO2 ↓ I ↓ [O3]gas ↑
L aboratory of P hysical and A nalytical C hemistry
W.P. 1.4: O3 generation testbed
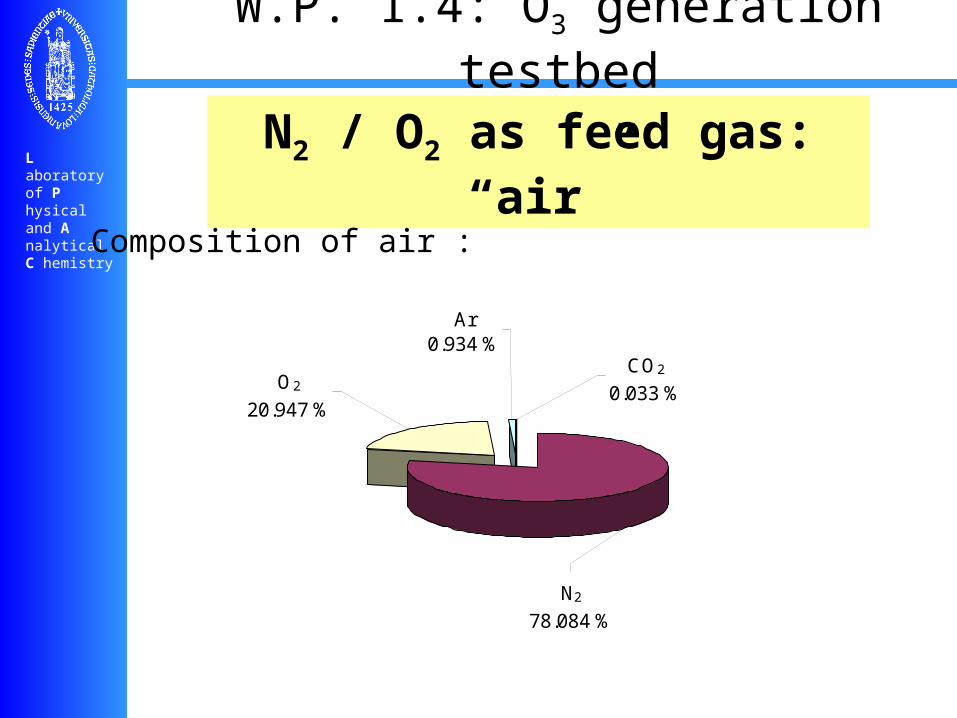
N2 / O2 as feed gas: “air”
N2
78.084 %
Ar0.934 %
O2
20.947 %
CO2
0.033 %
Composition of air :

L aboratory of P hysical and A nalytical C hemistry
W.P. 1.4: O3 generation testbed
N2 / O2
Gas inlet Gasoutlet
: PATT-module
Air corridorN--N
O--ON--N N--NO--O
N--N N--N
O--O
N--N
O--O : O2 moleculeN--N : N2 molecule : discharge
32,arg
232 NONONONNN OOedisch
More details in the LPAC-report
L aboratory of P hysical and A nalytical C hemistry
W.P. 1.4: O3 generation testbed
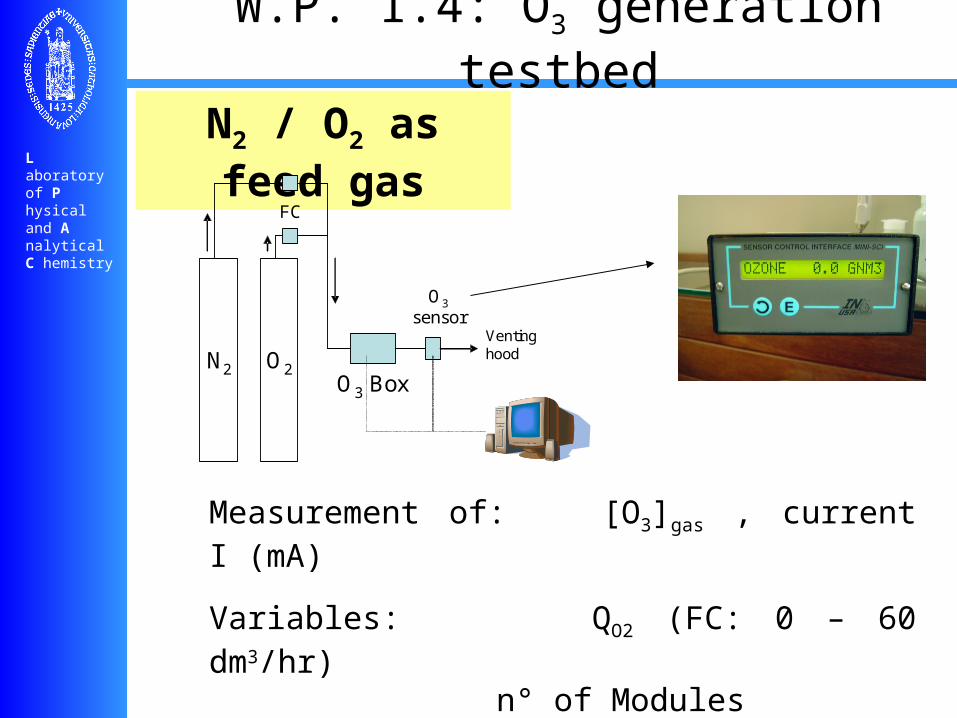
N2 / O2 as feed gas
Measurement of: [O3]gas , current I (mA)
Variables: QO2 (FC: 0 – 60 dm3/hr)n° of ModulesPower setting (% P)composition feed gas (N2 / O2)
O2
FC
Ventinghood
O3 Box
O3
sensor
N2

L aboratory of P hysical and A nalytical C hemistry
W.P. 1.4: O3 generation testbed
N2 / O2 as feed gasVariables: n° of Modules, composition feed gas (N2/O2)
0
5
10
15
20
25
0 10 20 30 40 50 60 70 80 90 100
% O2 (versus N2) (total = 100)
[O3]gas
g/m3
25/10/2005
26/10/2005
28/10/2005
31/10/2005 (Module 4)
[O3]gas as a function of the composition of the feed gas (O2/N2) at 75% P (Modules 4+5+6 of Box 2 and Module 4). Total gas flow = 60 l/hr.
Addition of N2 : Beneficial between 60/40 & 80/20. Identical behavior for 1 or 3 Modules (Box 2).

L aboratory of P hysical and A nalytical C hemistry
W.P. 1.4: O3 generation testbed
0
200
400
600
800
1000
1200
1400
1600
1800
2000
0 20 40 60 80 100% O2 (versus N2) (total = 100)
totalcurrent I
(mA)
25/10/2005
26/10/2005
28/10/2005
0
10
20
30
40
50
60
70
80
90
100
0 20 40 60 80 100
% O2 (versus N2) (total = 100)
AD-i
25/10/2005
26/10/2005
28/10/2005
N2 / O2 as feed gas
Addition of N2 : Modules behave differently then in the absence of N2.
0
100
200
300
400
500
600
700
0 100 200 300 400 500 600
time (minutes)
ImA
Module 4
Module 5
Module 6
100/0
60/40
80/20
90/10

L aboratory of P hysical and A nalytical C hemistry
W.P. 1.4: O3 generation testbed
N2 / O2 as feed gas (versus pure O2): effect of the gas flow
Effect of the gas flow Q : [O3]gas ↓ as Q ↑ (for both) O3 generator capacity ↓ as Q ↓ (more pronounced with pure O2)
0
5
10
15
20
25
30
0 50 100 150 200 250 300
QO2 (lhr)
[O3]gas
g/m3
14/11/2005 21/79
10/11/2005 pure O2
0.0
0.2
0.4
0.6
0.8
1.0
1.2
1.4
1.6
0 50 100 150 200 250 300
QO2 (lhr)
O3 capac.
g/hr
14/11/2005 21/79
10/11/2005 pure O2

L aboratory of P hysical and A nalytical C hemistry
W.P. 1.4: O3 generation testbed
N2 / O2 as feed gas: is the increased O3 gas concentration in the presence of N2 an artefact or real ??
0
1
2
3
4
5
6
0 50 100 150 200 250 300
time (minutes)
[O3]liq
mg/l
15.0 g/Nm3 O3
100/0pH 4.86
19.4 g/Nm3 O3
80/20pH 2.54
15.1 g/Nm3 O3
100/0pH 2.50
no O3
[O3]liq follows [O3]gas (in accordance with Henry’s Law)
Increase ozone production is real ! = N2-effect
Effect on pH and conductivity when N2 is present
L aboratory of P hysical and A nalytical C hemistry
W.P. 1.4: O3 generation testbed
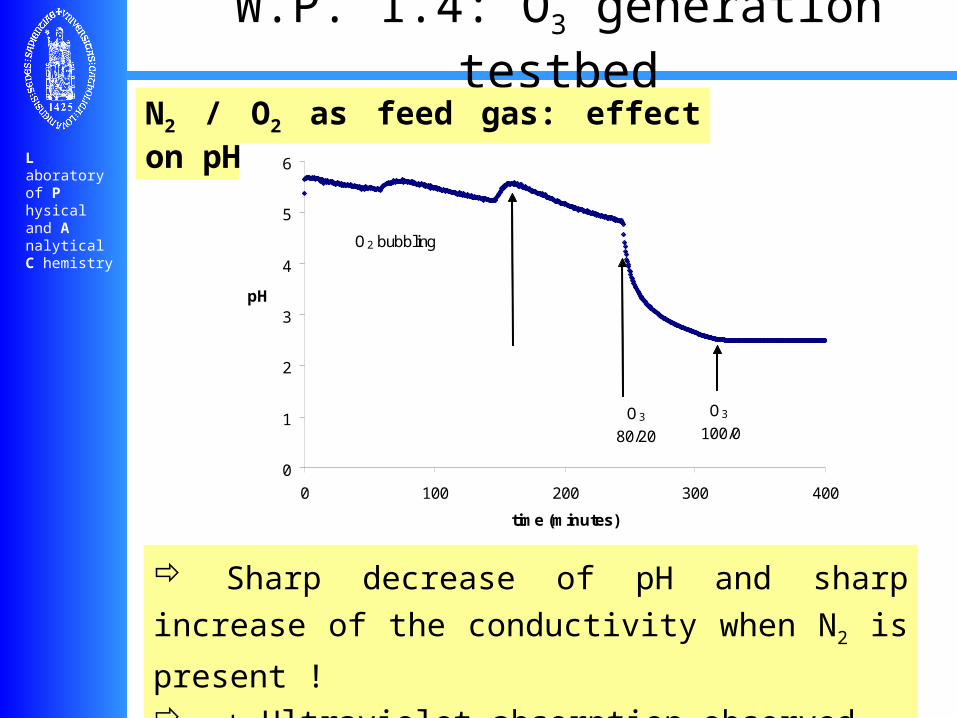
N2 / O2 as feed gas: effect on pH
Sharp decrease of pH and sharp increase of the
conductivity when N2 is present !
+ Ultraviolet absorption observed
0
1
2
3
4
5
6
0 100 200 300 400
time (minutes)
pH
O3
100/0
O3
80/20
O3
100/0
O2 bubbling

L aboratory of P hysical and A nalytical C hemistry
W.P. 1.4: O3 generation testbed
N2 / O2 as feed gas: UV-absorption
Ultraviolet absorption observed at 208 nm, even after
degassing
presence of HNO3
O3-free MilliQ-water after ozonation with N2 presence

L aboratory of P hysical and A nalytical C hemistry
W.P. 1.4: O3 generation testbed
N2O5(g) + H2O(g) → HNO 3 + HNO3 N2O5(g) + 2 H2O(g) → HNO 3 + HNO3 + H2O(g)
N2 / O2 as feed gas:
32,arg
232 NONONONNN OOedisch
NOx is obviously being produced as a by-product
In the presence of water (thus also in the feed gas): formation of acidic acid: corrosion problems possible !!
→ Effect of the presence of N2 during ozone production on pH, conductivity and the UV-absorbance at 208 nm→ Indication that HNO3 is introduced in the water (acidification)
W.P. 1.4 : O3 generation testbed
L aboratory of P hysical and A nalytical C hemistry
General conclusions
Design needs to be improved ! [O3]gas much higher with smaller air corridorStill some leaks in the Box coverMultiple Boxes ? (parallel or in series ?)
Ozone gas concentration / productionWith pure O2: → [O3]gas ~ current I (1 versus 3 Modules)
→ “cumulative” effect of multiple Modules→ [O3]gas ~ 1/ gas flow Q→ capacity O3 generator exponentially
increases as Q increases→ good reproducibility→ position Modules in air corridor of no
importance
W.P. 1.4 : O3 generation testbed
L aboratory of P hysical and A nalytical C hemistry
General conclusions
Ozone gas concentration / production
With N2 / O2: → addition N2 not detrimental (40 – 20 %)
→ [O3]gas ~ current I (different behavior)
→ [O3]gas ~ 1/ gas flow Q
→ capacity O3 generator exponentially
increases as Q increases (less than
pure O2)
→ good reproducibility
→ NOx are formed as by-product
→ HNO3 is formed when water is present
(= acidification + possible corrosion)

L aboratory of P hysical and A nalytical C hemistry
future
* Gas flow path (smaller ?)
* (better) Air tightness & safety aspects
* Geometry of the ozone producing section
* Number of PATT-modules (more in 1 Box ?)
* Electronics of the PATT-modules (delay effects in
the ozone production + faster programming of the
modules)
* Introduction system (see report on Storage tank)
* Compactness of the Box (more compact)
more experiments: O2 + H2O and air as feed gas
W.P. 1.4 : O3 generation testbed
Recommended