KOKSTAD & FRANKLIN INTEGRATED SUSTAINABLE DEVELOPMENT PLAN
STRATEGY DEVELOPMENT PLANIMPLEMENTATION PLAN MONITORING & EVALUATION PLAN
PREPARED BY THE CITY THINK SPACE TEAMFOR THE GREATER KOKSTAD MUNICIPALITY
NOVEMBER 2012
CITY
SPACETHINK
Document prepared by the City Think Space team, including:
City Think Space
Meshfield
Lees & Short Associated Architects
DPA Project Managers & Associates
Dugan Fraser
Palmer Development Group
Jeffares & Green
Emergy
John Spiropolous
November 2012
DOCUMENT PREPARED BY THE CITY THINK SPACE TEAM
KOKSTAD & FRANKLIN INTEGRATED SUSTAINABLE DEVELOPMENT PLAN2
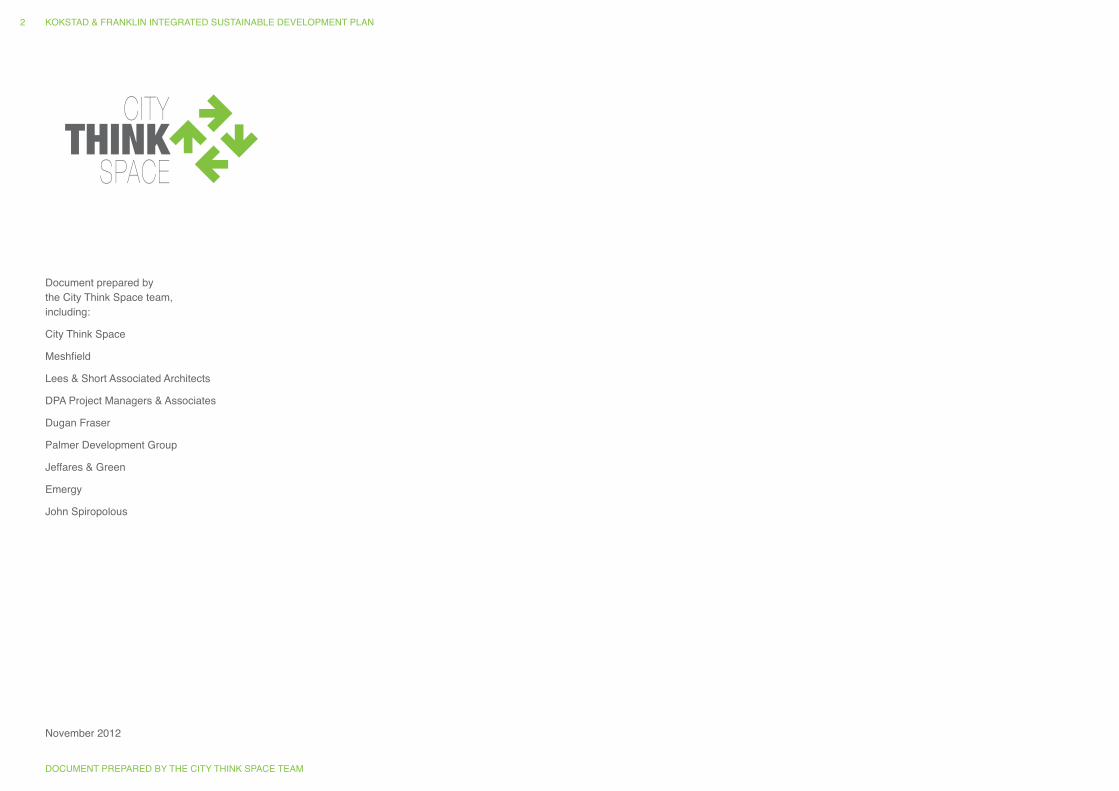
CONTENTS1. INTRODUCTION ..................................... 11
1.1. PURPOSE OF THIS REPORT ................. 11
1.2. STRUCTURE OF THIS REPORT ............. 11
PART I BACKGROUND .......................................12
2. POLICY ALIGNMENT ..............................13
2.1. ALIGNMENT BETWEEN POLICY DIRECTIVES AND THE ISDP ..................13
2.2. HIGH-LEVEL POLICY DIRECTIVES INFORMING THE ISDP ............................13
3. ISDP SUSTAINABILITY FRAMEWORK ..14
4. THE KEY ISSUES ARISING FROM THE STATUS QUO ...........................................14
5. DEVELOPMENT PRINCIPLES ................16
5.1. GUIDING DEVELOPMENT PRINCIPLES 16
5.2. SUSTAINABILITY PRINCIPLES ...............16
5.3. URBAN DESIGN & SETTLEMENT PRINCIPLES ............................................18
6. GREEN AMBASSADOR PROGRAMME .20
6.1. OVERVIEW ...............................................20
6.2. FOUNDATION PHASE PROGRAMME ....20
6.3. CONSOLIDATION PHASE .......................20
6.4. SUSTAIN OUR AFRICA CONFERENCE ..21
7. DEVELOPMENT SCENARIOS ................22
7.1. MUNICIPAL SERVICES FINANCIAL MODEL RESULTS ....................................24
7.2. ECO-FUTURES MODEL RESULTS .........26
8. ISDP STRATEGIC OUTCOMES & STRATEGIES ...........................................28
8.1. DESIRED OUTCOME FOR KOKSTAD AND FRANKLIN ................................................28
8.2. THE 5 MAIN STRATEGIES ......................28
PART II STRATEGY, DEVELOPMENT & IMPLEMENTATION PLAN ....................30
9. THE STORIES ..........................................31
9.1. INSTITUTIONS .........................................33
9.2. CROSSROADS ........................................39
9.3. TOWN .......................................................61
9.4. INFRASTRUCTURE .................................97
9.5. NATURAL RESOURCES ........................ 117
9.6. AGRICULTURE ......................................133
10. IMPLEMENTATION PLAN SYNTHESIS 148
PART III THE WAY FORWARD ............................156
11. MONITORING & EVALUATION .............157
11.1. MONITORING & REPORTING APPROACH ..........................................157
11.2. EVALUATION APPROACH ..................157
11.3. CAPACITY CONSIDERATIONS ...........157
11.4. THE SUSTAINABILITY SURVEY .........157
11.5. THE GREEN AMBASSADORS .............157
11.6. INDICATORS FOR MONITORING & REPORTING PURPOSES .....................157
12. CONCLUSION AND WAY FORWARD ...161
PART IV ANNEXURES & APPENDICES .....................................162
13. ANNEXURES .........................................163
13.1. ANNEXURE A: STAKEHOLDER ENGAGEMENT ...........163
13.2. ANNEXURE B: SCENARIOS ................164
13.3................................................................. ANNEXURE C: PRECEDENT ................168
13.4. ANNEXURE D: POPULATION GROWTH ACCOMMODATED IN THE PLAN ..........178
13.5. ANNEXURE E: STREETS .....................180
13.6. ANNEXURE F: SETTLEMENT RESPONSE PROGRAMME EXPANDED INTRODUCTION ...................................188
14. APPENDICES ........................................192
FINAL STRATEGY, DEVELOPMENT PLAN AND IMPLEMENTATION PLAN REPORT | NOVEMBER 2012
3
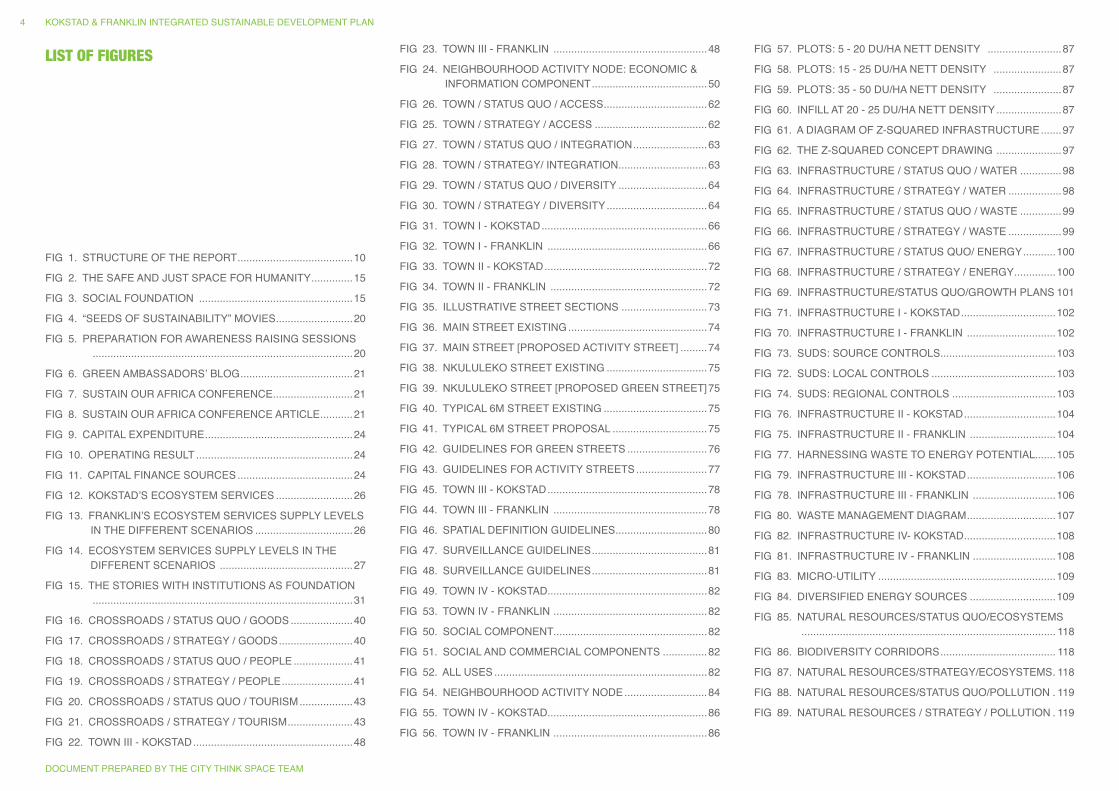
LIST OF FIGURES
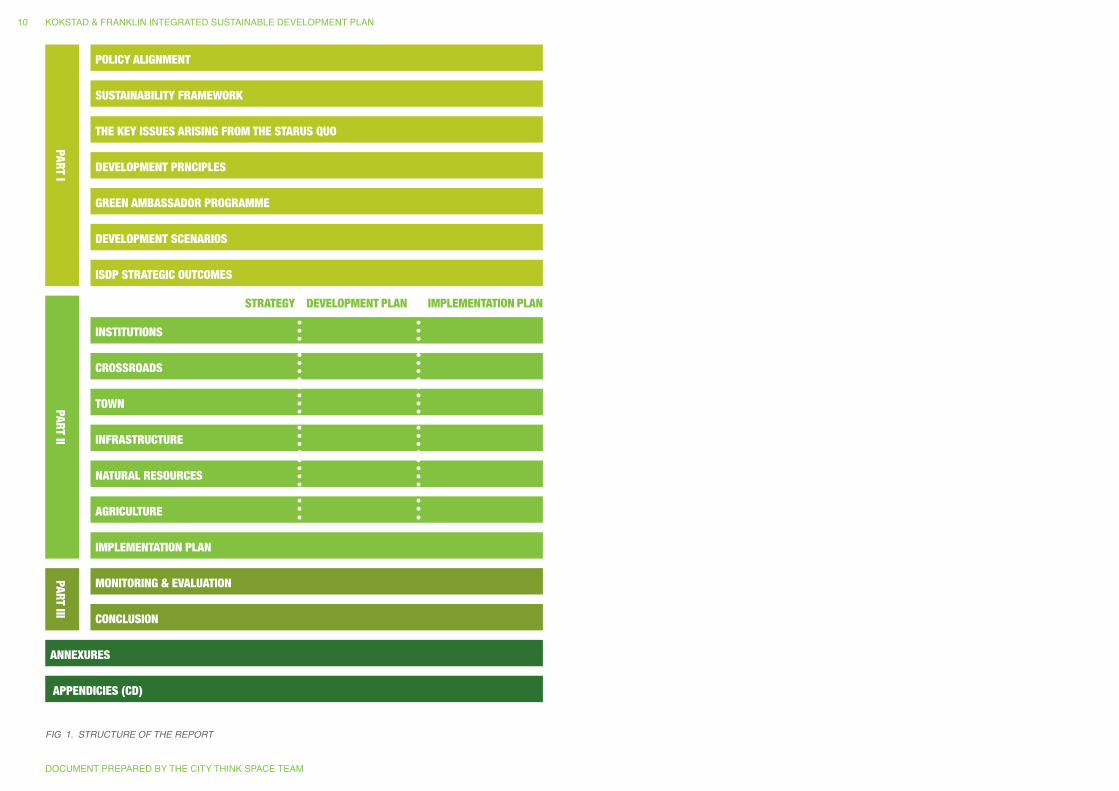
FIG 1. STRUCTURE OF THE REPORT .......................................10
FIG 2. THE SAFE AND JUST SPACE FOR HUMANITY ..............15
FIG 3. SOCIAL FOUNDATION ....................................................15
FIG 4. “SEEDS OF SUSTAINABILITY” MOVIES ..........................20
FIG 5. PREPARATION FOR AWARENESS RAISING SESSIONS ........................................................................................20
FIG 6. GREEN AMBASSADORS’ BLOG ......................................21
FIG 7. SUSTAIN OUR AFRICA CONFERENCE ...........................21
FIG 8. SUSTAIN OUR AFRICA CONFERENCE ARTICLE ...........21
FIG 9. CAPITAL EXPENDITURE ..................................................24
FIG 10. OPERATING RESULT .....................................................24
FIG 11. CAPITAL FINANCE SOURCES .......................................24
FIG 12. KOKSTAD’S ECOSYSTEM SERVICES ..........................26
FIG 13. FRANKLIN’S ECOSYSTEM SERVICES SUPPLY LEVELS IN THE DIFFERENT SCENARIOS .................................26
FIG 14. ECOSYSTEM SERVICES SUPPLY LEVELS IN THE DIFFERENT SCENARIOS .............................................27
FIG 15. THE STORIES WITH INSTITUTIONS AS FOUNDATION ........................................................................................31
FIG 16. CROSSROADS / STATUS QUO / GOODS .....................40
FIG 17. CROSSROADS / STRATEGY / GOODS .........................40
FIG 18. CROSSROADS / STATUS QUO / PEOPLE ....................41
FIG 19. CROSSROADS / STRATEGY / PEOPLE ........................41
FIG 20. CROSSROADS / STATUS QUO / TOURISM ..................43
FIG 21. CROSSROADS / STRATEGY / TOURISM ......................43
FIG 22. TOWN III - KOKSTAD ......................................................48
FIG 23. TOWN III - FRANKLIN ....................................................48
FIG 24. NEIGHBOURHOOD ACTIVITY NODE: ECONOMIC & INFORMATION COMPONENT .......................................50
FIG 26. TOWN / STATUS QUO / ACCESS ...................................62
FIG 25. TOWN / STRATEGY / ACCESS ......................................62
FIG 27. TOWN / STATUS QUO / INTEGRATION .........................63
FIG 28. TOWN / STRATEGY/ INTEGRATION ..............................63
FIG 29. TOWN / STATUS QUO / DIVERSITY ..............................64
FIG 30. TOWN / STRATEGY / DIVERSITY ..................................64
FIG 31. TOWN I - KOKSTAD ........................................................66
FIG 32. TOWN I - FRANKLIN ......................................................66
FIG 33. TOWN II - KOKSTAD .......................................................72
FIG 34. TOWN II - FRANKLIN .....................................................72
FIG 35. ILLUSTRATIVE STREET SECTIONS .............................73
FIG 36. MAIN STREET EXISTING ...............................................74
FIG 37. MAIN STREET [PROPOSED ACTIVITY STREET] .........74
FIG 38. NKULULEKO STREET EXISTING ..................................75
FIG 39. NKULULEKO STREET [PROPOSED GREEN STREET] 75
FIG 40. TYPICAL 6M STREET EXISTING ...................................75
FIG 41. TYPICAL 6M STREET PROPOSAL ................................75
FIG 42. GUIDELINES FOR GREEN STREETS ...........................76
FIG 43. GUIDELINES FOR ACTIVITY STREETS ........................77
FIG 45. TOWN III - KOKSTAD ......................................................78
FIG 44. TOWN III - FRANKLIN ....................................................78
FIG 46. SPATIAL DEFINITION GUIDELINES ...............................80
FIG 47. SURVEILLANCE GUIDELINES .......................................81
FIG 48. SURVEILLANCE GUIDELINES .......................................81
FIG 49. TOWN IV - KOKSTAD......................................................82
FIG 53. TOWN IV - FRANKLIN ....................................................82
FIG 50. SOCIAL COMPONENT....................................................82
FIG 51. SOCIAL AND COMMERCIAL COMPONENTS ...............82
FIG 52. ALL USES ........................................................................82
FIG 54. NEIGHBOURHOOD ACTIVITY NODE ............................84
FIG 55. TOWN IV - KOKSTAD......................................................86
FIG 56. TOWN IV - FRANKLIN ....................................................86
FIG 57. PLOTS: 5 - 20 DU/HA NETT DENSITY .........................87
FIG 58. PLOTS: 15 - 25 DU/HA NETT DENSITY .......................87
FIG 59. PLOTS: 35 - 50 DU/HA NETT DENSITY .......................87
FIG 60. INFILL AT 20 - 25 DU/HA NETT DENSITY ......................87
FIG 61. A DIAGRAM OF Z-SQUARED INFRASTRUCTURE .......97
FIG 62. THE Z-SQUARED CONCEPT DRAWING ......................97
FIG 63. INFRASTRUCTURE / STATUS QUO / WATER ..............98
FIG 64. INFRASTRUCTURE / STRATEGY / WATER ..................98
FIG 65. INFRASTRUCTURE / STATUS QUO / WASTE ..............99
FIG 66. INFRASTRUCTURE / STRATEGY / WASTE ..................99
FIG 67. INFRASTRUCTURE / STATUS QUO/ ENERGY ...........100
FIG 68. INFRASTRUCTURE / STRATEGY / ENERGY ..............100
FIG 69. INFRASTRUCTURE/STATUS QUO/GROWTH PLANS 101
FIG 71. INFRASTRUCTURE I - KOKSTAD ................................102
FIG 70. INFRASTRUCTURE I - FRANKLIN ..............................102
FIG 73. SUDS: SOURCE CONTROLS .......................................103
FIG 72. SUDS: LOCAL CONTROLS ..........................................103
FIG 74. SUDS: REGIONAL CONTROLS ...................................103
FIG 76. INFRASTRUCTURE II - KOKSTAD ...............................104
FIG 75. INFRASTRUCTURE II - FRANKLIN .............................104
FIG 77. HARNESSING WASTE TO ENERGY POTENTIAL .......105
FIG 79. INFRASTRUCTURE III - KOKSTAD ..............................106
FIG 78. INFRASTRUCTURE III - FRANKLIN ............................106
FIG 80. WASTE MANAGEMENT DIAGRAM ..............................107
FIG 82. INFRASTRUCTURE IV- KOKSTAD ...............................108
FIG 81. INFRASTRUCTURE IV - FRANKLIN ............................108
FIG 83. MICRO-UTILITY ............................................................109
FIG 84. DIVERSIFIED ENERGY SOURCES .............................109
FIG 85. NATURAL RESOURCES/STATUS QUO/ECOSYSTEMS ...................................................................................... 118
FIG 86. BIODIVERSITY CORRIDORS ....................................... 118
FIG 87. NATURAL RESOURCES/STRATEGY/ECOSYSTEMS . 118
FIG 88. NATURAL RESOURCES/STATUS QUO/POLLUTION . 119
FIG 89. NATURAL RESOURCES / STRATEGY / POLLUTION . 119
DOCUMENT PREPARED BY THE CITY THINK SPACE TEAM
KOKSTAD & FRANKLIN INTEGRATED SUSTAINABLE DEVELOPMENT PLAN4
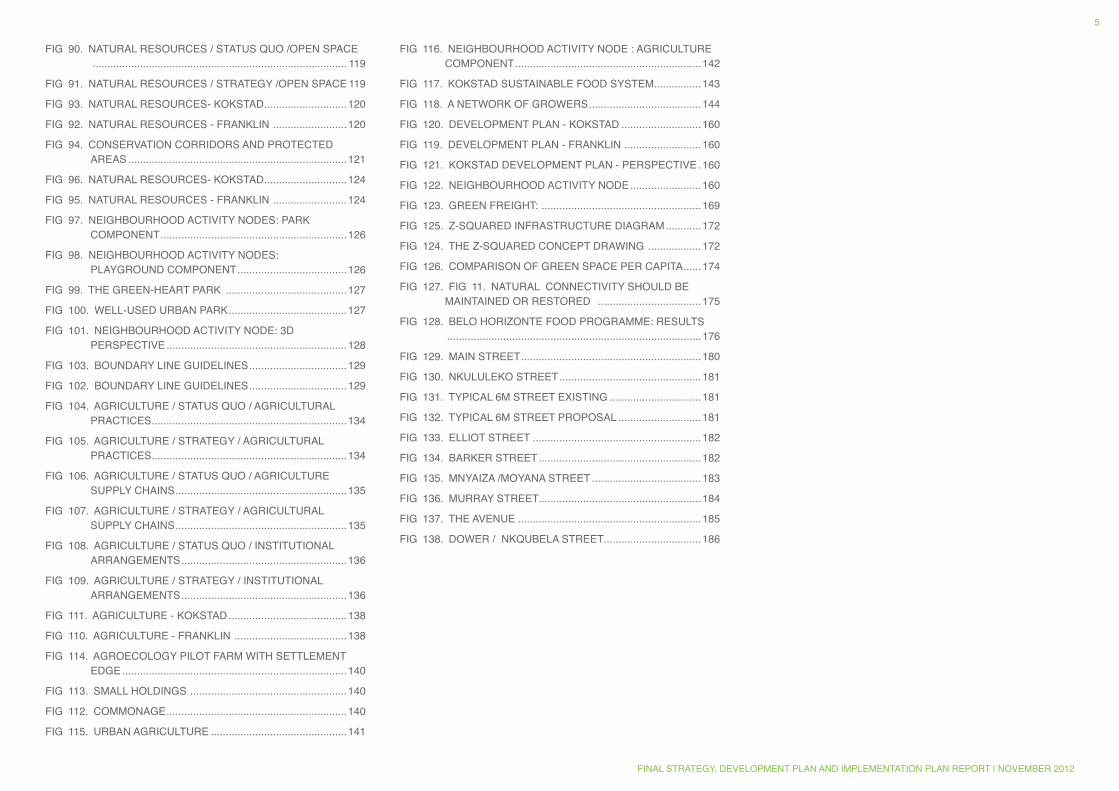
FIG 90. NATURAL RESOURCES / STATUS QUO /OPEN SPACE ...................................................................................... 119
FIG 91. NATURAL RESOURCES / STRATEGY /OPEN SPACE 119
FIG 93. NATURAL RESOURCES- KOKSTAD ............................120
FIG 92. NATURAL RESOURCES - FRANKLIN .........................120
FIG 94. CONSERVATION CORRIDORS AND PROTECTED AREAS ..........................................................................121
FIG 96. NATURAL RESOURCES- KOKSTAD ............................124
FIG 95. NATURAL RESOURCES - FRANKLIN .........................124
FIG 97. NEIGHBOURHOOD ACTIVITY NODES: PARK COMPONENT ...............................................................126
FIG 98. NEIGHBOURHOOD ACTIVITY NODES: PLAYGROUND COMPONENT .....................................126
FIG 99. THE GREEN-HEART PARK .........................................127
FIG 100. WELL-USED URBAN PARK ........................................127
FIG 101. NEIGHBOURHOOD ACTIVITY NODE: 3D PERSPECTIVE .............................................................128
FIG 103. BOUNDARY LINE GUIDELINES .................................129
FIG 102. BOUNDARY LINE GUIDELINES .................................129
FIG 104. AGRICULTURE / STATUS QUO / AGRICULTURAL PRACTICES ..................................................................134
FIG 105. AGRICULTURE / STRATEGY / AGRICULTURAL PRACTICES ..................................................................134
FIG 106. AGRICULTURE / STATUS QUO / AGRICULTURE SUPPLY CHAINS ..........................................................135
FIG 107. AGRICULTURE / STRATEGY / AGRICULTURAL SUPPLY CHAINS ..........................................................135
FIG 108. AGRICULTURE / STATUS QUO / INSTITUTIONAL ARRANGEMENTS ........................................................136
FIG 109. AGRICULTURE / STRATEGY / INSTITUTIONAL ARRANGEMENTS ........................................................136
FIG 111. AGRICULTURE - KOKSTAD ........................................138
FIG 110. AGRICULTURE - FRANKLIN ......................................138
FIG 114. AGROECOLOGY PILOT FARM WITH SETTLEMENT EDGE ............................................................................140
FIG 113. SMALL HOLDINGS .....................................................140
FIG 112. COMMONAGE .............................................................140
FIG 115. URBAN AGRICULTURE ..............................................141
FIG 116. NEIGHBOURHOOD ACTIVITY NODE : AGRICULTURE COMPONENT ...............................................................142
FIG 117. KOKSTAD SUSTAINABLE FOOD SYSTEM................143
FIG 118. A NETWORK OF GROWERS ......................................144
FIG 120. DEVELOPMENT PLAN - KOKSTAD ...........................160
FIG 119. DEVELOPMENT PLAN - FRANKLIN ..........................160
FIG 121. KOKSTAD DEVELOPMENT PLAN - PERSPECTIVE .160
FIG 122. NEIGHBOURHOOD ACTIVITY NODE ........................160
FIG 123. GREEN FREIGHT: ......................................................169
FIG 125. Z-SQUARED INFRASTRUCTURE DIAGRAM ............172
FIG 124. THE Z-SQUARED CONCEPT DRAWING ..................172
FIG 126. COMPARISON OF GREEN SPACE PER CAPITA ......174
FIG 127. FIG 11. NATURAL CONNECTIVITY SHOULD BE MAINTAINED OR RESTORED ...................................175
FIG 128. BELO HORIZONTE FOOD PROGRAMME: RESULTS ......................................................................................176
FIG 129. MAIN STREET .............................................................180
FIG 130. NKULULEKO STREET ................................................181
FIG 131. TYPICAL 6M STREET EXISTING ...............................181
FIG 132. TYPICAL 6M STREET PROPOSAL ............................181
FIG 133. ELLIOT STREET .........................................................182
FIG 134. BARKER STREET .......................................................182
FIG 135. MNYAIZA /MOYANA STREET .....................................183
FIG 136. MURRAY STREET.......................................................184
FIG 137. THE AVENUE ..............................................................185
FIG 138. DOWER / NKQUBELA STREET .................................186
FINAL STRATEGY, DEVELOPMENT PLAN AND IMPLEMENTATION PLAN REPORT | NOVEMBER 2012
5
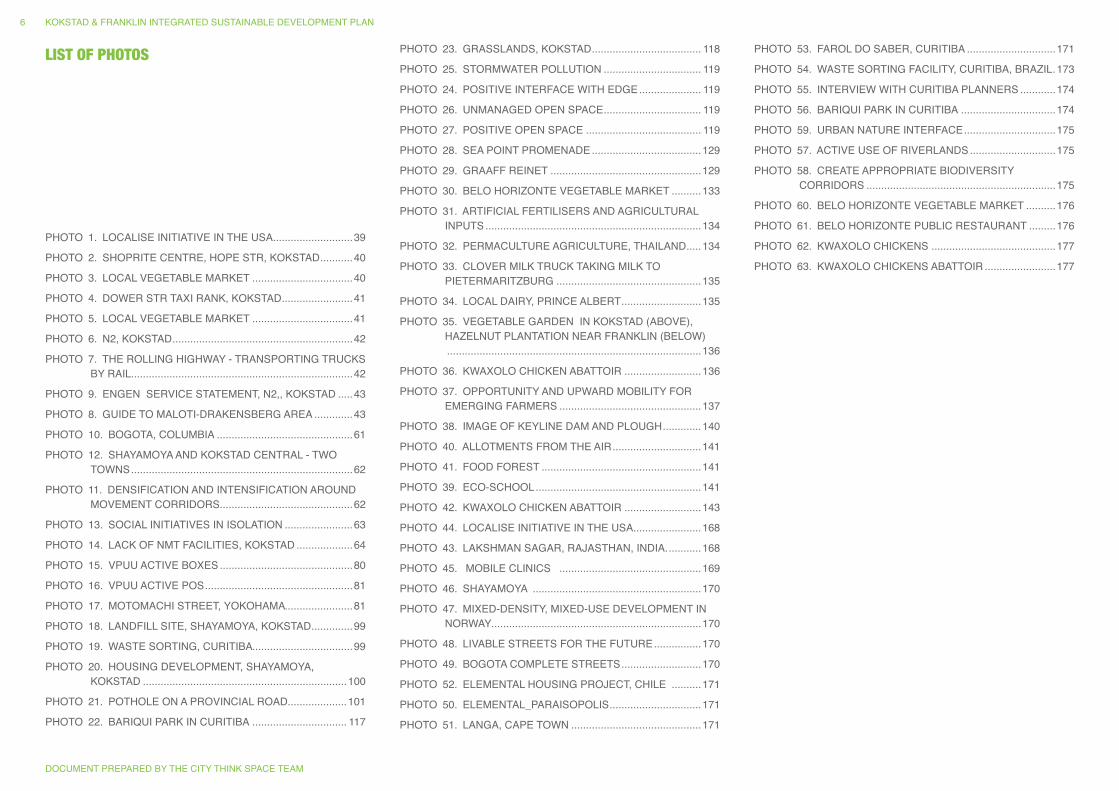
LIST OF PHOTOS
PHOTO 1. LOCALISE INITIATIVE IN THE USA ...........................39
PHOTO 2. SHOPRITE CENTRE, HOPE STR, KOKSTAD ...........40
PHOTO 3. LOCAL VEGETABLE MARKET ..................................40
PHOTO 4. DOWER STR TAXI RANK, KOKSTAD ........................41
PHOTO 5. LOCAL VEGETABLE MARKET ..................................41
PHOTO 6. N2, KOKSTAD .............................................................42
PHOTO 7. THE ROLLING HIGHWAY - TRANSPORTING TRUCKS BY RAIL ...........................................................................42
PHOTO 9. ENGEN SERVICE STATEMENT, N2,, KOKSTAD .....43
PHOTO 8. GUIDE TO MALOTI-DRAKENSBERG AREA .............43
PHOTO 10. BOGOTA, COLUMBIA ..............................................61
PHOTO 12. SHAYAMOYA AND KOKSTAD CENTRAL - TWO TOWNS ...........................................................................62
PHOTO 11. DENSIFICATION AND INTENSIFICATION AROUND MOVEMENT CORRIDORS.............................................62
PHOTO 13. SOCIAL INITIATIVES IN ISOLATION .......................63
PHOTO 14. LACK OF NMT FACILITIES, KOKSTAD ...................64
PHOTO 15. VPUU ACTIVE BOXES .............................................80
PHOTO 16. VPUU ACTIVE POS ..................................................81
PHOTO 17. MOTOMACHI STREET, YOKOHAMA.......................81
PHOTO 18. LANDFILL SITE, SHAYAMOYA, KOKSTAD ..............99
PHOTO 19. WASTE SORTING, CURITIBA ..................................99
PHOTO 20. HOUSING DEVELOPMENT, SHAYAMOYA, KOKSTAD .....................................................................100
PHOTO 21. POTHOLE ON A PROVINCIAL ROAD....................101
PHOTO 22. BARIQUI PARK IN CURITIBA ................................ 117
PHOTO 23. GRASSLANDS, KOKSTAD ..................................... 118
PHOTO 25. STORMWATER POLLUTION ................................. 119
PHOTO 24. POSITIVE INTERFACE WITH EDGE ..................... 119
PHOTO 26. UNMANAGED OPEN SPACE ................................. 119
PHOTO 27. POSITIVE OPEN SPACE ....................................... 119
PHOTO 28. SEA POINT PROMENADE .....................................129
PHOTO 29. GRAAFF REINET ...................................................129
PHOTO 30. BELO HORIZONTE VEGETABLE MARKET ..........133
PHOTO 31. ARTIFICIAL FERTILISERS AND AGRICULTURAL INPUTS .........................................................................134
PHOTO 32. PERMACULTURE AGRICULTURE, THAILAND .....134
PHOTO 33. CLOVER MILK TRUCK TAKING MILK TO PIETERMARITZBURG .................................................135
PHOTO 34. LOCAL DAIRY, PRINCE ALBERT ...........................135
PHOTO 35. VEGETABLE GARDEN IN KOKSTAD (ABOVE), HAZELNUT PLANTATION NEAR FRANKLIN (BELOW) ......................................................................................136
PHOTO 36. KWAXOLO CHICKEN ABATTOIR ..........................136
PHOTO 37. OPPORTUNITY AND UPWARD MOBILITY FOR EMERGING FARMERS ................................................137
PHOTO 38. IMAGE OF KEYLINE DAM AND PLOUGH .............140
PHOTO 40. ALLOTMENTS FROM THE AIR ..............................141
PHOTO 41. FOOD FOREST ......................................................141
PHOTO 39. ECO-SCHOOL ........................................................141
PHOTO 42. KWAXOLO CHICKEN ABATTOIR ..........................143
PHOTO 44. LOCALISE INITIATIVE IN THE USA .......................168
PHOTO 43. LAKSHMAN SAGAR, RAJASTHAN, INDIA. ...........168
PHOTO 45. MOBILE CLINICS ................................................169
PHOTO 46. SHAYAMOYA .........................................................170
PHOTO 47. MIXED-DENSITY, MIXED-USE DEVELOPMENT IN NORWAY .......................................................................170
PHOTO 48. LIVABLE STREETS FOR THE FUTURE ................170
PHOTO 49. BOGOTA COMPLETE STREETS ...........................170
PHOTO 52. ELEMENTAL HOUSING PROJECT, CHILE ..........171
PHOTO 50. ELEMENTAL_PARAISOPOLIS ...............................171
PHOTO 51. LANGA, CAPE TOWN ............................................171
PHOTO 53. FAROL DO SABER, CURITIBA ..............................171
PHOTO 54. WASTE SORTING FACILITY, CURITIBA, BRAZIL .173
PHOTO 55. INTERVIEW WITH CURITIBA PLANNERS ............174
PHOTO 56. BARIQUI PARK IN CURITIBA ................................174
PHOTO 59. URBAN NATURE INTERFACE ...............................175
PHOTO 57. ACTIVE USE OF RIVERLANDS .............................175
PHOTO 58. CREATE APPROPRIATE BIODIVERSITY CORRIDORS ................................................................175
PHOTO 60. BELO HORIZONTE VEGETABLE MARKET ..........176
PHOTO 61. BELO HORIZONTE PUBLIC RESTAURANT .........176
PHOTO 62. KWAXOLO CHICKENS ..........................................177
PHOTO 63. KWAXOLO CHICKENS ABATTOIR ........................177
DOCUMENT PREPARED BY THE CITY THINK SPACE TEAM
KOKSTAD & FRANKLIN INTEGRATED SUSTAINABLE DEVELOPMENT PLAN6

FINAL STRATEGY, DEVELOPMENT PLAN AND IMPLEMENTATION PLAN REPORT | NOVEMBER 2012
7
Dwelling unit density (du/ha): Number of dwelling units per hectare.
Population density: Number of people per hectare (usually calculated by multiplying the number of units by an estimated average household size).
Nett density (du/ha): Number of dwelling units per hectare of land calculated on the basis of land used for residential purposes, including the garden and any off-street parking.
Gross density (du/ha): Number of dwelling units per hectare of land calculated on the basis of all land uses integrated within residential areas - including residential, light industrial, commercial, education, transport and parks - as well as roads. Excluded are land-extensive uses such as agriculture and nature reserves.
Gross base density (du/ha): Number of dwelling units per hectare within the urban edge.
Ecosystem services: Services that are generated by the natural environment, which enhance human well-being, and are directly used by people.
Smart growth: General term for policies that result in more compact, accessible development.
AD – Anaerobic Digesters
BEC – Bicycle Empowerment Centre
BEN – Bicycle Empowerment Network
CBA – Critical Biodiversity Areas
CBD – Central Business District
CFC – Chlorofluorocarbon
CFL – Compact Fluorescent Lamp
CHP – Combined Heat and Power
CLIQ – Community based Learning ICTs and Quality of Life
CRDP – The Comprehensive Rural Development Programme
CRU – Community Residential Units
CSIR – Council for Scientific and Industrial Research
DAFF – Department of Agriculture, Forestry and Fisheries
DBSA – The Development Bank of South Africa
DoHS – Department of Human Settlements
DTI – Department of Trade and Industry
DWA – Department of Water Affairs
ECT – Economic Cooperation Triangle
EPW – Expanded Public Works
EPWP – Expanded Public Works Programme
ESA – Ecological Support Areas
FET – Further Education & Training
FLISP – Finance Linked Individual Subsidy Programme
GA – Green Ambassador
GAP – Green Ambassador Programme
GKM – Greater Kokstad Municipality
IDP – Integrated Development Plan
GLOSSARY ACRONYMS IGR – Intergovernmental Relations
IGRFA – The Intergovernmental Relations Framework Act
IPP – Independent Power Producers
IRDP – Integrated Residential Development Programme
IRP – Integrated Resource Plan
ISDP – Integrated Sustainable Development Plan
IWF – Integrated Waste Facility
IWFM – Integrated Waste Management Facility
KISDP – Kokstad Integrated Sustainable Development Plan
KISS – Kokstad Integrated Sustainable Settlements
KPPCL – The KwaXolo Processing Primary Cooperative Limited
KTO – Kokstad Tourism Organisation
KZN – KwaZulu Natal
LED – Local Economic Development
LPG – Liquefied Petroleum Gas
LUMS – Land Use Management System
LUPDM – Land Use Planning and Decision Making
MDG – Millennium Development Goals
MFMA – Municipal Financial Management Act
MIG – Municipal Infrastructure Grant
MM – Municipal Manager
MoT – Ministry of Transport
MoU – Memorandum of Agreement
MRF – Materials Recycling Facility
MSFM – Municipal Services Financial Model
NAFCOC – National African Federated Chamber of Commerce and Industry
NCCR – The National Climate Change Response
NDP – National Development
NDP – National Development Plan
NDPG – The National Treasury’s Neighbouhood Development Partnership Grant
NEMA – The National Environmental Management Act
NER – National Energy Regulator
NGO – Non-Governmental Organisation
OECD – Organisation for Economic Co-operation and Development
P&DP – Pilot and/or Demonstration Projects
PDP – Project Development Phase
PES – Payment for Ecosystem Services
PGDS – Provincial Growth and Development Strategy
PGWC – Provincial Government of the Western Cape
PIP – Project Implementation Phase
PM – Particular Matter
POS – Public Open Space
PPP – Public-Private Partnership
PTP – Public Transport Plan
PV – Photovoltaic
RDP – Residential Development Plan
SANRAL – South African National Roads Agency Limited
SANS – South African National Standards
SDF – Spatial Development Framework
SHI – Social Housing Initiative
SHRA – South African Heritage Resource Act
SOA – Sustain our Africa
SP – Strategic Planning
DOCUMENT PREPARED BY THE CITY THINK SPACE TEAM
KOKSTAD & FRANKLIN INTEGRATED SUSTAINABLE DEVELOPMENT PLAN8

SuDS – Sustainable Drainage Systems
URZ – Urban Re-structuring Zone
VOC – Volatile Organic Compound
WAS – Waste Activated Sludge
WFW – Working for Water
WRC – Water Research Commission of South Africa
WSA – Water Services Authority
WSUD – Water Sensitive Urban Design
WTW – Water Treatment Works
WWTW – Waste Water Treatment Works
ZW – Zero Waste
FINAL STRATEGY, DEVELOPMENT PLAN AND IMPLEMENTATION PLAN REPORT | NOVEMBER 2012
9
CROSSROADS
INSTITUTIONS
STRATEGY DEVELOPMENT PLAN IMPLEMENTATION PLAN
PART IIPART III
PART I
TOWN
INFRASTRUCTURE
NATURAL RESOURCES
IMPLEMENTATION PLAN
AGRICULTURE
MONITORING & EVALUATION
CONCLUSION
ANNEXURES
APPENDICIES (CD)
GREEN AMBASSADOR PROGRAMME
DEVELOPMENT SCENARIOS
ISDP STRATEGIC OUTCOMES
POLICY ALIGNMENT
SUSTAINABILITY FRAMEWORK
THE KEY ISSUES ARISING FROM THE STARUS QUO
DEVELOPMENT PRNCIPLES
Fig 1. STRUCTURE OF THE REPORT
DOCUMENT PREPARED BY THE CITY THINK SPACE TEAM
KOKSTAD & FRANKLIN INTEGRATED SUSTAINABLE DEVELOPMENT PLAN10
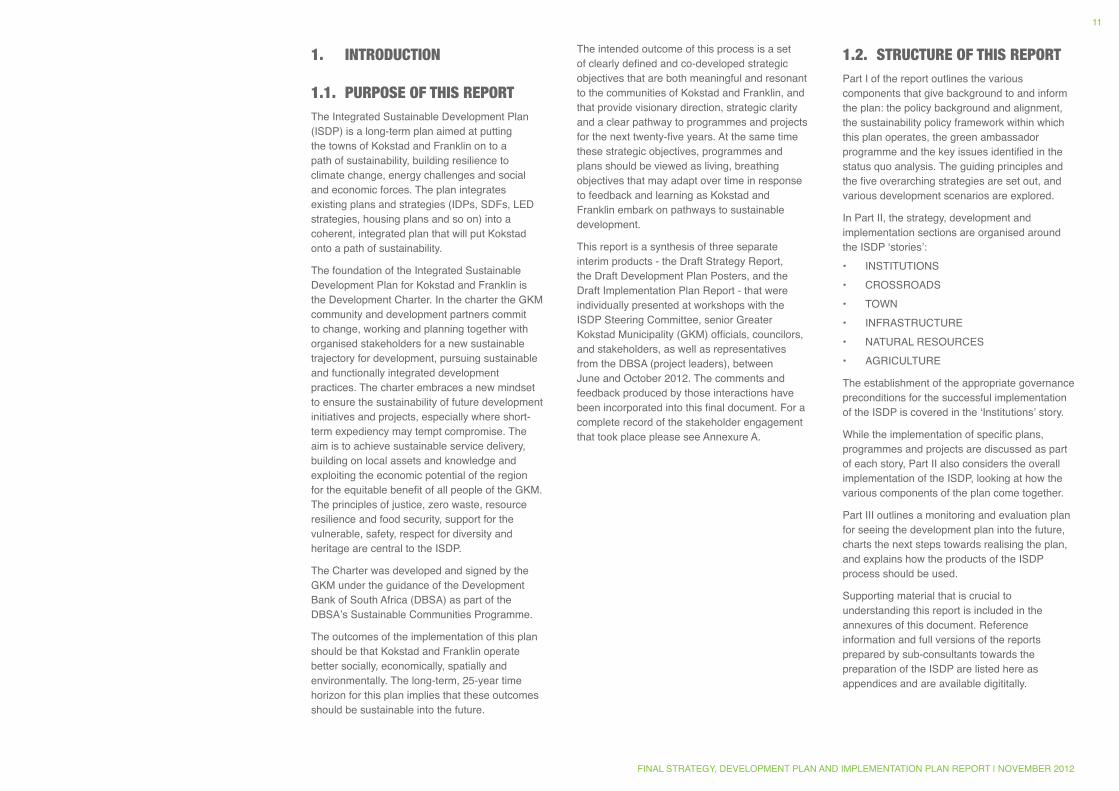
1. INTRODUCTION
1.1. PURPOSE OF THIS REPORTThe Integrated Sustainable Development Plan (ISDP) is a long-term plan aimed at putting the towns of Kokstad and Franklin on to a path of sustainability, building resilience to climate change, energy challenges and social and economic forces. The plan integrates existing plans and strategies (IDPs, SDFs, LED strategies, housing plans and so on) into a coherent, integrated plan that will put Kokstad onto a path of sustainability.
The foundation of the Integrated Sustainable Development Plan for Kokstad and Franklin is the Development Charter. In the charter the GKM community and development partners commit to change, working and planning together with organised stakeholders for a new sustainable trajectory for development, pursuing sustainable and functionally integrated development practices. The charter embraces a new mindset to ensure the sustainability of future development initiatives and projects, especially where short-term expediency may tempt compromise. The aim is to achieve sustainable service delivery, building on local assets and knowledge and exploiting the economic potential of the region for the equitable benefit of all people of the GKM. The principles of justice, zero waste, resource resilience and food security, support for the vulnerable, safety, respect for diversity and heritage are central to the ISDP.
The Charter was developed and signed by the GKM under the guidance of the Development Bank of South Africa (DBSA) as part of the DBSA’s Sustainable Communities Programme.
The outcomes of the implementation of this plan should be that Kokstad and Franklin operate better socially, economically, spatially and environmentally. The long-term, 25-year time horizon for this plan implies that these outcomes should be sustainable into the future.
The intended outcome of this process is a set of clearly defined and co-developed strategic objectives that are both meaningful and resonant to the communities of Kokstad and Franklin, and that provide visionary direction, strategic clarity and a clear pathway to programmes and projects for the next twenty-five years. At the same time these strategic objectives, programmes and plans should be viewed as living, breathing objectives that may adapt over time in response to feedback and learning as Kokstad and Franklin embark on pathways to sustainable development.
This report is a synthesis of three separate interim products - the Draft Strategy Report, the Draft Development Plan Posters, and the Draft Implementation Plan Report - that were individually presented at workshops with the ISDP Steering Committee, senior Greater Kokstad Municipality (GKM) officials, councilors, and stakeholders, as well as representatives from the DBSA (project leaders), between June and October 2012. The comments and feedback produced by those interactions have been incorporated into this final document. For a complete record of the stakeholder engagement that took place please see Annexure A.
1.2. STRUCTURE OF THIS REPORTPart I of the report outlines the various components that give background to and inform the plan: the policy background and alignment, the sustainability policy framework within which this plan operates, the green ambassador programme and the key issues identified in the status quo analysis. The guiding principles and the five overarching strategies are set out, and various development scenarios are explored.
In Part II, the strategy, development and implementation sections are organised around the ISDP ‘stories’:• INSTITUTIONS• CROSSROADS• TOWN• INFRASTRUCTURE• NATURAL RESOURCES • AGRICULTURE
The establishment of the appropriate governance preconditions for the successful implementation of the ISDP is covered in the ‘Institutions’ story.
While the implementation of specific plans, programmes and projects are discussed as part of each story, Part II also considers the overall implementation of the ISDP, looking at how the various components of the plan come together.
Part III outlines a monitoring and evaluation plan for seeing the development plan into the future, charts the next steps towards realising the plan, and explains how the products of the ISDP process should be used.
Supporting material that is crucial to understanding this report is included in the annexures of this document. Reference information and full versions of the reports prepared by sub-consultants towards the preparation of the ISDP are listed here as appendices and are available digititally.
FINAL STRATEGY, DEVELOPMENT PLAN AND IMPLEMENTATION PLAN REPORT | NOVEMBER 2012
11
PART I BACKGROUND
GREEN AMBASSADOR PROGRAMME
DEVELOPMENT SCENARIOS
ISDP OVERARCHING STRATEGIES
POLICY ALIGNMENT
SUSTAINABILITY FRAMEWORK
THE KEY ISSUES ARISING FROM THE STATUS QUO
DEVELOPMENT PRINCIPLES
DOCUMENT PREPARED BY THE CITY THINK SPACE TEAM
KOKSTAD & FRANKLIN INTEGRATED SUSTAINABLE DEVELOPMENT PLAN12
2. POLICY ALIGNMENT
2.1. ALIGNMENT BETWEEN POLICY DIRECTIVES AND THE ISDP
“The purpose of the iDP is to craft a development plan that will truly integrate and harmonize issues and potential of human well-being, economic development and environmental integrity.”
(gKM 2012 iDP, page 27)
The mission statement of Greater Kokstad Municipality echoes this intention:
“Providing sustainable services to communities through optimal and professional deployment of resources and enhancing economic development and a safe and healthy environment”,
In addition to the GKM’s current IDP, the ISDP is also working within the following international, national, KZN Provincial Government and GKM policy directives, including: • The Millennium Development Goals and
Global Sustainability Targets, • The Presidential Strategic Outcomes for
Government, • The development goals for the GKM as
informed by the KZN Provincial Growth and Development Strategy,
• The SDF policy recommendations, • The goals of the GKM LED Masterplan, and• The GKM’s Development Charter
The content of these policies is summarised below.
2.2. HIGH-LEVEL POLICY DIRECTIVES INFORMING THE ISDPA comprehensive outline of all the policy informants to the ISDP is provided in the Kokstad and Franklin ISDP Status Quo Report. The following are key policies informing the strategies towards sustainability adopted in this report.
The Millennium Development Goals and Global Sustainability Targets:• Eradication of extreme poverty and hunger• Achieve universal primary education• Ensuring education and training• Promote gender equality and empower
women• Reduce child mortality • Improve Maternal health • Combat HIV/Aids, malaria and other
diseases• Ensure environmental sustainability • Develop a global partnership for
development
Presidential Strategic Outcomes for Government:• Improved quality of basic education• A long and healthy life for all South Africans• All people in South Africa are and feel safe• Decent employment through inclusive
economic growth• A skilled and capable workforce to support
an inclusive economic growth path• An efficient competitive and responsive
economic infrastructure network• Vibrant, equitable and sustainable rural
communities with food security for all• Sustainable human settlements and
improved quality of household life• A responsive, accountable, effective and
efficient local government system• Environmental assets and natural resources
that are well protected and continually enhanced
• Create a better South Africa and contribute to a better and safer Africa and the world
• An efficient, effective and development oriented public service and an empowered, fair and inclusive citizenship
The development goals for the GKM were developed based on the provincial goals as outlined in the PGDS and are as follows:
• To ensure human needs and utilization of natural resources are in harmony
• To create safe, healthy and sustainable living environments
• To ensure all work-seekers are employed• To develop a more equitable society• To ensure that all people have access to
basic services• To boost investors’ confidence to invest in
the GKM• To create options for people on where and
how they opt to live, work and play• To provide strong and decisive leadership • To foster social compacts
SDF policy recommendations:• Promote the integration of the social,
economic, institutional and physical aspects of land development.
• Promote integrated land development in rural and urban areas to support each other.
• Promote the availability of residential and employment opportunities in close proximity to or integrated with each other.
• Optimise the use of existing resources including such resources related to agriculture, land, minerals, bulk infrastructure, roads, transportation and social facilities.
• Promote a diverse combination of land uses, also at the level of individual erven or subdivisions of land.
• Discourage the phenomenon of urban sprawl in urban areas and contribute to the development of more compact towns.
• Contribute to the correction of historically distorted spatial patterns of settlement throughout South Africa and the optimum use of existing infrastructure in excess of current needs.
• Encourage environmentally sustainable land development practices and processes.
• Promote sustainable land development at the required scale in that they should promote land development which is within
the fiscal, institutional and administrative means of the Republic; promote the establishment of viable communities;
• Promote the sustained protection of the environment; meet the basic needs of all citizens in an affordable way; and, ensure the safe utilization of land by taking into consideration environmental constraints.
LED Master Plan strategy goals:• Job creation• Human Resource Development• Human and Community Development• Strategic Infrastructure• Response to Climate Change• Governance and Policy• Spatial Equity
Development Charter:
The GKM Development Charter is the foundation and starting point for the ISDP. In summary, the Development Charter states that the GKM community and development partners commit to change, working and planning together with organized stakeholders for a new sustainable trajectory for development, pursuing sustainable and functionally integrated development practices. The signatories embrace a new mindset to ensure the sustainability of future development initiatives and projects...
“especially where short-term expediency may tempt us to compromise. Sustainable service delivery, building on local assets and knowledge and exploiting the economic potential of our region for the equitable benefit of our people are the central aims. The principles of justice, zero waste, resource resilience and food security, support of the vulnerable, safety, respect for diversity and our heritages are the main guides to this process.”
FINAL STRATEGY, DEVELOPMENT PLAN AND IMPLEMENTATION PLAN REPORT | NOVEMBER 2012
13
3. ISDP SUSTAINABILITY FRAMEWORKIt is important to note that most of our current modes of planning and delivering services are framed within the context of an old paradigm that does not necessarily recognise the potential impacts of the current global financial crisis, or the realities of some of the latest climate science. The process of the preparation of the ISDP has acknowledged that the achievement of desired outcomes is going to require quite radical thinking for an emerging new paradigm.
To facilitate this shift in thinking, the ISDP processes has used a visual framework (Oxfam GB, 2012) that works with the idea of environmental boundaries and social foundations, each forming an edge to the doughnut, with a “safe and just space for humanity” situated between the two edges, “within the doughnut”. A solid social foundation will only be achieved when basic human needs are met for all, globally. The environmental ceiling forms the outer edge of the doughnut. There are nine planetary boundaries that, if transgressed, could push the earth system into a new state that is no longer able to support human and other life.
The aim of the ISDP is to develop strategies and plans that help to move Kokstad’s stories (the essence or lifeblood of Kokstad) towards the safe and just space for humanity. To do this requires the development of shared sustainability goals that are meaningful to all stakeholders and contextually relevant. At the core, the over-arching sustainability goal for Kokstad and Franklin is to foster resilience and agility in the face of impending global climate change, energy and financial shocks and that can both meet the social foundation and stay within the environmental ceiling.
For a full explanation of the Sustainability Framework, please see the Status Quo report for this plan.
4. THE KEY ISSUES ARISING FROM THE STATUS QUOThe ISDP Status Quo report evaluated the current situation in Kokstad and Franklin in relation to the ISDP Sustainability Framework and in terms of the stories. The following statements provide a high level synopsis of the main outcomes of the status quo report.
INSTITUTIONSThe GKM as a municipality is highly committed and very efficient at achieving their determined goals. They are also financially sound.
However, some of their goals are misguided in terms of a long-term sustainability perspective. Many actions are based on standard practices that are not sustainable. There is also a lack of overall vision within the municipality - plans are made on a project-to-project basis and are often reactive to outside influences. Local government institutions and functions are not sufficiently collaborative; they do not cooperate or work cross-functionally.
CROSSROADSKokstad has an important regional role in terms of the economy, education, housing and social services making it highly dependant on regional commuting and freight movement and exposed to high commuting costs and negative impacts of vehicular traffic.
TOWNKokstad town has many unique and attractive qualities, with easy access to social facilities and shops, and strong links to nature and surrounding farmland. However it is spatially and socially fragmented with disparities between the ‘old’ town and the newer areas. There is a high demand for accommodation and growth in the town.
There is opportunity for future growth to build on the existing attractive qualities, making use
of heritage features and landmarks to ensure inclusion and empowerment of residents and build a strong sense of identity with Kokstad.
INFRASTRUCTUREKokstad and Franklin experience challenges around lack of basic infrastructure, degrading infrastructure, pollution of rivers, institutional alignment and management of service provision, inability to pay for basic services and a perception of high rates. The MSFM indicates budget capacity within Kokstad but there needs to be a focus on rehabilitation of infrastructure. There is a need to recycle to minimise space required for landfill sites, augment the fresh water supply, and reduce pollution of the natural resources.
NATURAL RESOURCESKokstad and Franklin have a rich abundance of unique and attractive natural resources, cultural resources and open space amenities that could be used and enhanced to optimise the quality and experience of the towns. However these are under threat from pollution, over extraction of water, erosion, land-use change and climate change.
AGRICULTUREKokstad has a very strong agricultural foundation based on milk, meat and maize and this base forms a critical part of the local economy. Agriculture is under threat because it is heavily reliant on external inputs - high input, high energy, high carbon. This makes it vulnerable, lacking resilience, and increasingly uncompetitive in global markets.
Opportunities exist to diversify the crop base, experiment with new crops, build small-scale community based projects and investigate agri-processing.
DOCUMENT PREPARED BY THE CITY THINK SPACE TEAM
KOKSTAD & FRANKLIN INTEGRATED SUSTAINABLE DEVELOPMENT PLAN14
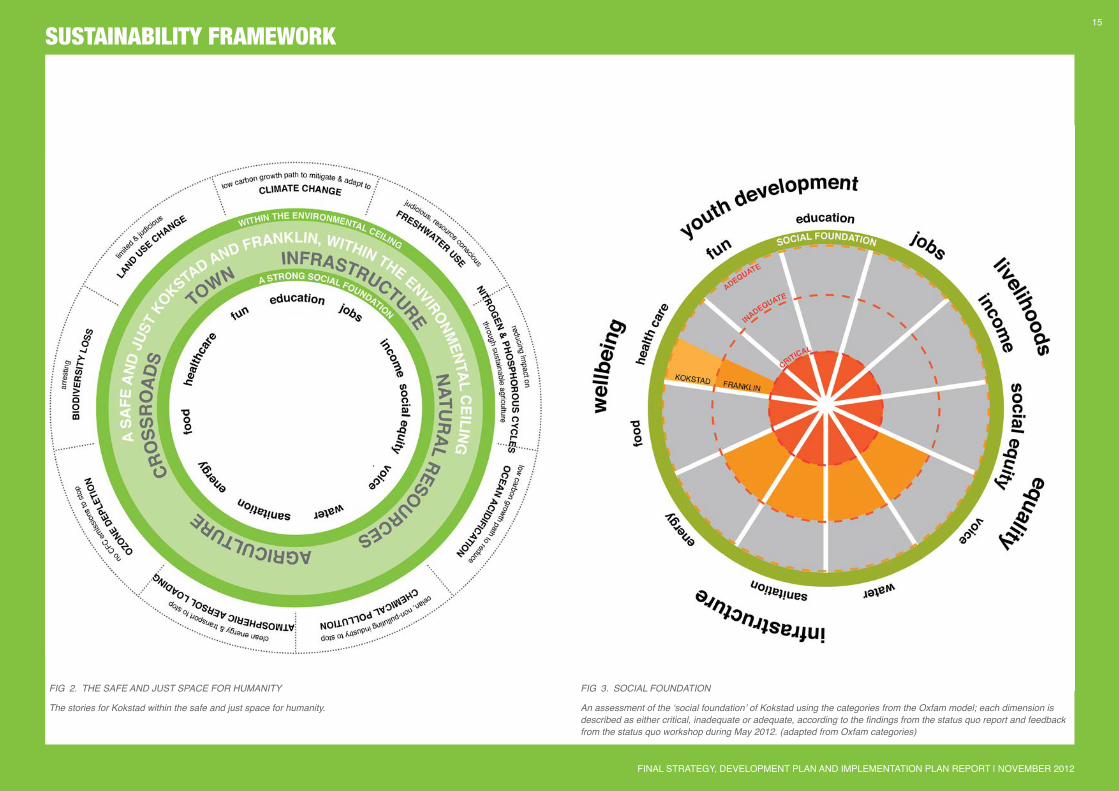
Fig 2. THE SAFE AND JUST SPACE FOR HUMANiTY
The stories for Kokstad within the safe and just space for humanity.
Fig 3. SOCiAL FOUNDATiON
An assessment of the ‘social foundation’ of Kokstad using the categories from the Oxfam model; each dimension is described as either critical, inadequate or adequate, according to the findings from the status quo report and feedback from the status quo workshop during May 2012. (adapted from Oxfam categories)
SUSTAINABILITY FRAMEWORK
FINAL STRATEGY, DEVELOPMENT PLAN AND IMPLEMENTATION PLAN REPORT | NOVEMBER 2012
15
5. DEVELOPMENT PRINCIPLESThis section sets out the overarching guiding development principles, the sustainability principles, and the urban design principles that have informed the strategies and plans of the ISDP.
5.1. GUIDING DEVELOPMENT PRINCIPLES
RESILIENCE & AGILITYResilience is about the capacity to withstand shocks and disturbances such as climate change or economic crises, and to use such events to catalyse renewal, novelty and innovation. It is about taking stock in diversity and spreading the risks. Resilience thinking helps us avoid the trap of simply rebuilding and repairing flawed structures of the past – be it around economic strategies, city development plans or infrastructure management. Resilience encourages us to anticipate, adapt, learn and transform human actions according to changes that take place.
JUSTICE & EQUITYA socially just society is based on the principles of equality and solidarity, understands and values human rights, and recognizes the dignity of every human being. Social justice means that the rights of all people in a community are considered in a fair and equitable manner. While equal opportunity targets everyone in the community, social justice targets the marginalised and disadvantaged groups of people in our society. Public policies should ensure that all people have equal access to education, health care, employment, and basic services.
Social equity implies fair access to livelihood, education, and resources; full participation in the political and cultural life of the community; and self-determination in meeting fundamental needs. Social equity is the cornerstone of society, which cannot be maintained for a few
at the expense of the many. Increased equity results in decreased spending on prisons, security enforcement, welfare, and social services. It also creates new potential markets.
Inequities magnify the challenge of creating reliable prosperity in several ways. Those who are marginalized may be tempted to eat into reserves of nature and society to meet immediate needs, while those with abundant choices may seek conspicuous forms of consumption which — unintentionally — have the same depleting effect.
INTEGRATIONIntegration – whether spatial, sectoral or socio-economic - is fundamental to sustainable development. Segregated societies – whether segregated by income or ethnicity - are not and cannot be sustainable. At a project level, sustainable projects need to ensure integration of all development issues including transport, planning, economic development, etc. Vertical integration among the various levels of government and bodies involved in territorial governance (local, regional, national, private sector, civil society, etc.), and horizontal integration, among the various sectors of public action, are also key to achieving sustainable development.
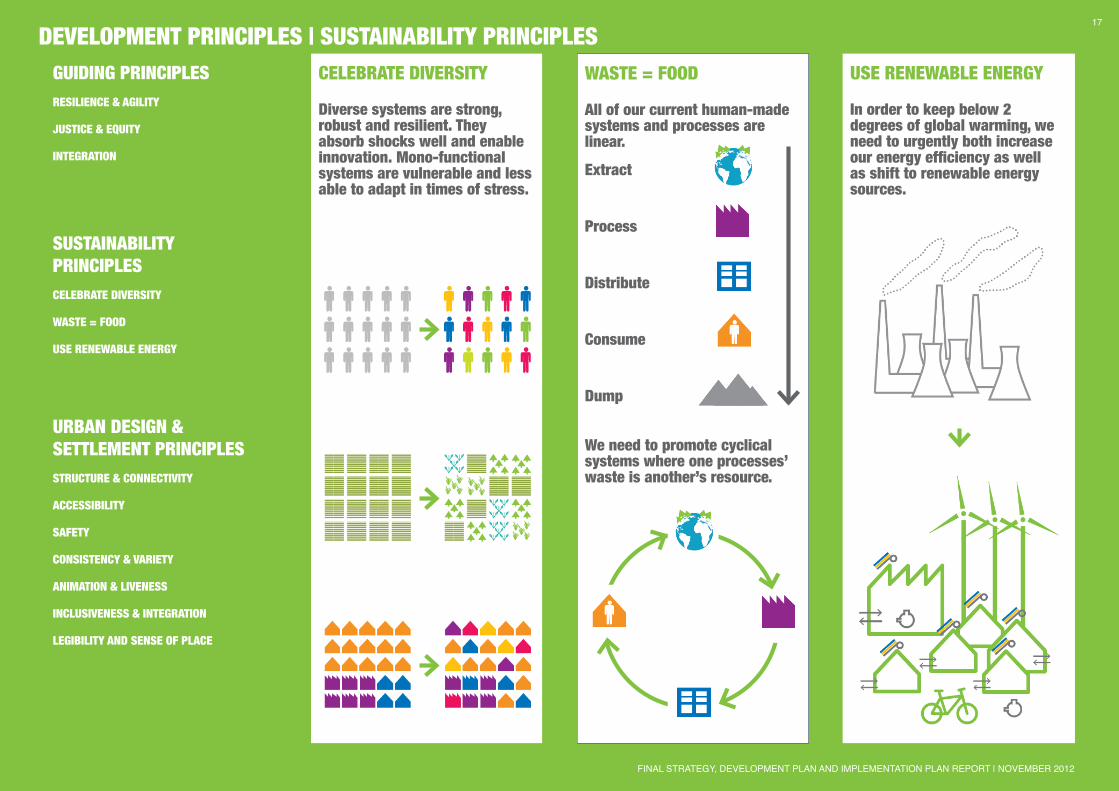
5.2. SUSTAINABILITY PRINCIPLES
CELEBRATE DIVERSITYNatural systems function and flourish through complexity. Diverse systems are strong, robust and resilient. They absorb shocks well and enable innovation. Mono-functional systems are vulnerable and less able to adapt in times of stress. Compared to the standard solutions of the industrial revolution and to the uniformity promoted through globalization, nature supports an almost unending abundance of variety and diversity. How we go about manufacturing products and finding solutions to problems must be similarly tackled with the same flair for diversity and variety? To concentrate on only the one criterion is to create instability and imbalance in a wider context.
WASTE = FOODThe processes of every single organism in a living system contribute to the health and well-being of the system as a whole. The leaves of a tree, for example, its “waste”, fall to the ground where they are broken down and become nutrients for other organisms. Microbes feed off this organic “waste” and, as a result, return many valuable nutrients to the soil that the tree can profit from. The “waste” of one organism is thus nutrients for another – a cyclical system.
By contrast, almost all of our current human-made systems and processes are linear. They are throughput systems with a beginning and an end, with resources being transformed into waste at a rapid rate. To be sustainable, we need to work towards emulating nature’s cyclical systems - to ensure that the waste produced by every industrial process is a resource (‘food’) for another industry.
USE RENEWABLE ENERGYOur global economy runs on fossil fuels (coal, oil, gas). These release large and unsustainable quantities of carbon dioxide into the atmosphere.
The first industrial revolution obtained its energy predominantly from the reservoirs of the past. Fossil fuels were used that had been created millions of years ago. Nuclear energy places great strains and very dangerous responsibilities on many future generations. Systems that are driven using solar energy are systems that are using today’s energy without having to put the futures of our children and their children at risk. It is most certainly within the capabilities of today’s technology to profitably incorporate the use of and reliance on solar energy into the design of production systems. The direct capture of solar, wind and hydro energy are possibilities.
These sustainability principles have been adapted from Cradle to Cradle (http://wisle.org/theme).
DOCUMENT PREPARED BY THE CITY THINK SPACE TEAM
KOKSTAD & FRANKLIN INTEGRATED SUSTAINABLE DEVELOPMENT PLAN16
DEVELOPMENT PRINCIPLES | SUSTAINABILITY PRINCIPLESCELEBRATE DIVERSITY
Diverse systems are strong, robust and resilient. They absorb shocks well and enable innovation. Mono-functional systems are vulnerable and less able to adapt in times of stress.
WASTE = FOOD
All of our current human-made systems and processes are linear.
Extract
Process
Distribute
Consume
Dump
We need to promote cyclical systems where one processes’ waste is another’s resource.
USE RENEWABLE ENERGY
In order to keep below 2 degrees of global warming, we need to urgently both increase our energy efficiency as well as shift to renewable energy sources.
GUIDING PRINCIPLESRESILIENCE & AGILITY
JUSTICE & EQUITY
INTEGRATION
SUSTAINABILITY PRINCIPLESCELEBRATE DIVERSITY
WASTE = FOOD
USE RENEWABLE ENERGY
URBAN DESIGN & SETTLEMENT PRINCIPLESSTRUCTURE & CONNECTIVITY
ACCESSIBILITY
SAFETY
CONSISTENCY & VARIETY
ANIMATION & LIVENESS
INCLUSIVENESS & INTEGRATION
LEGIBILITY AND SENSE OF PLACE
FINAL STRATEGY, DEVELOPMENT PLAN AND IMPLEMENTATION PLAN REPORT | NOVEMBER 2012
17
services, facilities, employment, training and recreation, including through a choice of safe and efficient transport modes (e.g. public transport, private vehicle, bicycle, walking and wheelchair). Accessibility also comprises of convenient and dignified access to private and public spaces for people with impaired mobility.
If a public environment is valued, attractive and well used, then people must be able to get to it and move around in it with ease. Physical access combined with the ability to see into and understand places that cannot be physically reached are crucial qualities of a public environment. Support for different modes of travel and communication is essential. Good access depends above all on walking, but routes for bikes, prams, wheelchairs, cars and public transport are also important, as are connections between them. A choice of routes is important, to support different modes of travel, to link different destinations, to provide different experiences, and to ensure the capacity to avoid lonely places at night or other temporary impediments.
Physical access needs to be supported by confident belief that a place can be reached. People do not go where they think they cannot go. Good public spaces invite freedom of access and avoid implicit limits, exclusivity or coercion. Visual access implies direct sightlines or unfolding views, signs or other visual cues, and being able to see other people, all of which help us to negotiate a place. Without these invitations and reassurances, even the most comprehensive street system can remain uninviting.
Provide ease, safety and choice of access for all people.
SAFETYDesign for safety is not merely about installing handrails and warning signs. A more basic concern is to create places where people can use their own natural aptitudes to keep themselves and others safe from harm. This requires support for human abilities of perception, as well as acknowledgement that
some people suffer from impaired eyesight or other abilities, and so require other cues to help them understand their environment.
Safety is supported when people can see potential threats, judge risks, escape if a threat is perceived, seek assistance and give aid if needed. This is supported by views into and through spaces; by multiple access routes into and out of spaces; by mixed land uses that mean other people are around all the time; and by windows and activities in buildings located to overlook streets and other public spaces. Without denying the value of a charming surprise or vistas that unfold dramatically, logic and predictability in design are important to support our ability to interpret what we hear and see, and to reasonably anticipate what is around the corner.
Design spaces that minimise risks of personal harm and support safe.
CONSISTENCY & VARIETYVariety in an urban environment is valued, for intellectual and aesthetic stimulation and as an expression of diversity in our society. But too much variety is chaotic. Rigid uniformity is rarely tolerated but neither is anarchy. Towns need a balance of individuality and community, of logic and feeling, of order and random incident. In many cases, a town’s public realm provides coherence and order while countless private ventures introduce variety and interest. One condition benefits from the other. A simple grid of streets could seem dull and repetitive without the accents and originality of individual buildings and visual cues to the activity they contain; but a town could be hopelessly confusing without the unifying influence of a pattern of streets and public spaces.
Balance order and diversity in the interests of appreciating both.
ANIMATION & LIVELINESSCities and towns are intended for human use, and urban spaces are safer and more attractive
when they are being used. Active, safe, well-used public spaces don’t happen by chance. Good urban design introduces, maintains and intensifies human activity within the public realm. Active building frontages are created by orienting public aspects of private land uses toward streets and other spaces. Activities in and overlooking public spaces contribute to passive surveillance, providing eyes on the street that increase personal safety and help prevent crime. Activation also extends to people on the move; the simple presence of people walking through urban spaces is one of the principal – if often unacknowledged – engines of public life.
Animation involves more subtle processes. It too is concerned with the activity of a place and its evident social life, but intervenes in the management and use of spaces rather than only considering their built form. Comfortable and interesting spaces support public use and – sometimes – the life of a public space happens of its own accord when people simply move in and use it without waiting for an invitation. However, staged activities or other inducements are often necessary catalysts to prompt people to discover and use the public realm to its fullest potential. Careful attention to the processes of activation and animation creates opportunities for civic interaction and community development, and contributes to the visibility and sharing of culture.
Stimulate activity and a sense of vitality in public places.
INCLUSIVENESS & INTERACTIONProvided they respect others, everyone has the right to use and enjoy public space, regardless of mobility, gender or socio-economic status. People meet there as fellow citizens. Interaction, even among strangers, exposes people to cultural diversity. People are entertained by other people. They learn from one another, increase their sophistication and tolerance, and explore shared values. They are confronted by differences, inequities and weaknesses in our society and, while this may seem threatening, it
5.3. URBAN DESIGN & SETTLEMENT PRINCIPLESA number of key principles underpin the approach to the urban design and settlement planning aspects of the ISDP.
STRUCTURE & CONNECTIVITY‘Structure’ refers to the way an urban area is physically put together – its layout, shapes of land parcels, routes of movement, street patterns and networks of public spaces. A town is more than the sum of these parts; connections between the parts make a coherent, functioning whole. These connections are supported by interlinked streets, which are accessible to everyone and so unite the entire town or city, giving them a fundamental influence. The structure of streets and other spaces and their interaction with local topography affect almost all other qualities of an urban area.
A good urban structure provides a unifying setting for diverse activities and buildings and allows easy access between them. It can assist contact and engagement between people and this is important for a good public environment. More extensive and integrated street networks provide greater connectivity, increasing potential interaction, exchange and choice among cities’ inhabitants. This usually varies with the intensity of development.
Activities, traffic and buildings come and go, but the organisation of streets and other public infrastructure is difficult to change. A good structure supports current activities and also provides the potential for changes in use and redevelopment. A good structure allows for change while it itself remains stable.
Organise places so their parts relate well to each other.
ACCESSIBILITYAccessibility is based on the systematic and principled enabling of equitable access to
DOCUMENT PREPARED BY THE CITY THINK SPACE TEAM
KOKSTAD & FRANKLIN INTEGRATED SUSTAINABLE DEVELOPMENT PLAN18
can lead to some greater understanding of their responsibilities towards fellow citizens. Meeting acquaintances gives opportunities for sharing information and other kinds of support, and it promotes community cohesion and social health. Good urban design supports this civic interaction. It ensures equity of access throughout the public environment for all people. It encourages the orientation of activities towards the public realm rather than into private enclaves. It treats citizens as the collective owners of public space, and encourages them to use it in comfort and without sanction.
Create places where all people are free to encounter each other as equals.
LEGIBILITY AND SENSE OF PLACE‘Legibility’ concerns people’s ability to read the urban environment – to interpret what they see, to get useful information. Which streets lead through an area rather than running into a barrier? Where is it dangerous to walk? Reading is affected by legibility. As with prose, city spaces can be poorly organised or cluttered so that important information is hidden. Features with particular meanings may be used in confusing ways. A well-designed city, like good writing, needs to be intelligible to its audience, the public.
Places are valued because of the individual qualities that make them distinctive from other places – because of their character. The form and character of urban areas is an expression of our needs and aspirations. In addition to our own will, it can express our respect for nature, heritage and other people. Sense of place or the identity of a city can be closely linked to our own sense of identity; both shape each other. Urban design should understand, protect, develop and celebrate local character.
Recognise and enhance the qualities that give places legibility and a valued identity.
These urban design and settlement principles have been adapted from the Urban Design Charter for Victoria (www.dpcd.vic.gov.au).
FINAL STRATEGY, DEVELOPMENT PLAN AND IMPLEMENTATION PLAN REPORT | NOVEMBER 2012
19
6. GREEN AMBASSADOR PROGRAMME
6.1. OVERVIEWAs has been described in the Status Quo report, the Green Ambassador Programme (GAP) is an innovative initiative that forms a key part of the ISDP process. The purpose of the programme is to provide skills transfer and development in the arena of sustainable development and citizen journalism to local youth, whilst at the same time generating information and feedback about local conditions, aspirations and culture for use by the ISDP project team and the Greater Kokstad Municipality (GKM).
The training programme has two parts to it:
1) The Foundation Phase training. This took place over the Status Quo phase of the ISDP, as well as at the beginning of the Strategy phase.
2) The Consolidation Phase training: this took place over the Strategy Development Phase, the Development Plan phase as well as the Implementation Plan phase.
6.2. FOUNDATION PHASE PROGRAMMEThe 3 month long foundation phase of the GA program, which was funded by the ISDP budget, commenced in April 2012 and was concluded on 21 June 2012.
The final outputs by the Green Ambassadors for this phase included: • 4 household surveys about water, energy,
food, social capital, employment and other relevant issues
• 16 short movies about community life and sustainability issues in Kokstad and Franklin
• A series of photo essays on Food Security
• Regular contribution to a blog communicating sustainability issues that affect the Kokstad and Franklin communities – citizen journalism (www.gkm-ga.blogspot.com)
6.3. CONSOLIDATION PHASE
6.3.1. “SEEDS OF SUSTAINABILITY” MOVIESOne of the main foci of the consolidation phase of the Green Ambassador training was for each green ambassador to make a minimum of 2 movies showcasing inspirational projects in Kokstad, Franklin and environs that are already examples of local sustainability. During the month of July, the Green Ambassadors researched their topics and identified a range of possibilities. Each idea was discussed and explored during the two-day Meshfield training session that took place on the 30th and 31st July 2012, with the Green Ambassadors motivating why they thought their choices were examples of sustainable development. In this way, their knowledge of sustainability was tested. The final topics were agreed to and then the GAs went on to film and edit their movies over the months of August and September, with some fine-tuning (particularly sub-titling) taking place in October. Dominique Vandenhout from the Media Academy continued to provide mentoring support to the GAs.
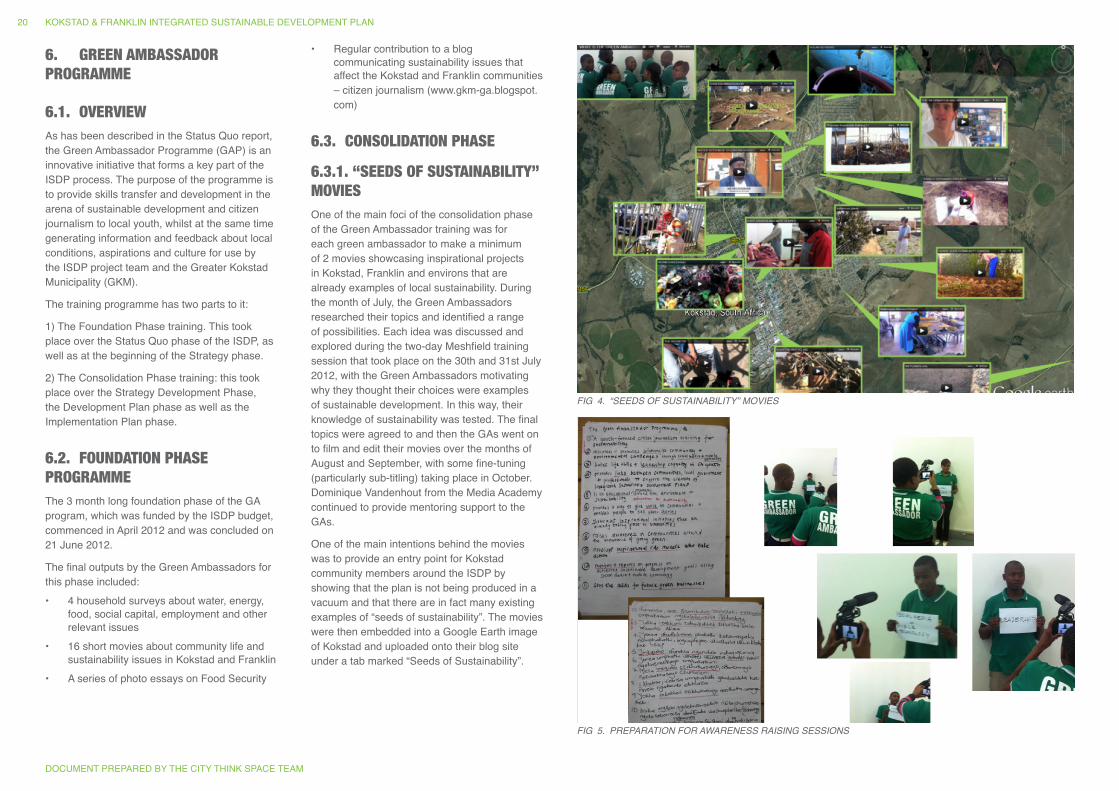
One of the main intentions behind the movies was to provide an entry point for Kokstad community members around the ISDP by showing that the plan is not being produced in a vacuum and that there are in fact many existing examples of “seeds of sustainability”. The movies were then embedded into a Google Earth image of Kokstad and uploaded onto their blog site under a tab marked “Seeds of Sustainability”.
Fig 4. “SEEDS OF SUSTAiNABiLiTY” MOViES
Fig 5. PREPARATiON FOR AWARENESS RAiSiNg SESSiONS
DOCUMENT PREPARED BY THE CITY THINK SPACE TEAM
KOKSTAD & FRANKLIN INTEGRATED SUSTAINABLE DEVELOPMENT PLAN20
6.3.2. SUSTAINABILITY TRAINING SESSIONS AND MENTORINGFive days of Meshfield sustainability training took place during the consolidation phase. The first training session took place over two days on 30th/31st July. In addition to defining and refining the subject matter for the “seeds of sustainability” movies, the GAs also explored and tested their knowledge of the ISDP content that was being generated by the ISDP professional team, as well as attending all the ISDP sessions that took place in Kokstad over this period. Links between movie ideas, the stories that were identified in the STATUS QUO report, as well as the key STRATEGIES were made, and in this way, the GA understanding of key sustainability concepts was deepened.
The second training session took place over three days – 17-19th September 2012. Here the focus was on revision of key concepts, as well as an in-depth reflection into “What is the Green Ambassador Programme”? The GAs spent a full day exploring this question, developing a series of responses and translating their responses into isiXhosa. They then filmed themselves responding to this question, and their finished movie has been posted up on their blog (on the “seeds of sustainability” map).
The GAs also all watched each others’ movies and used these as training material in preparation for the awareness raising sessions that they will be doing with Kokstad citizens in the months of November, December and January.
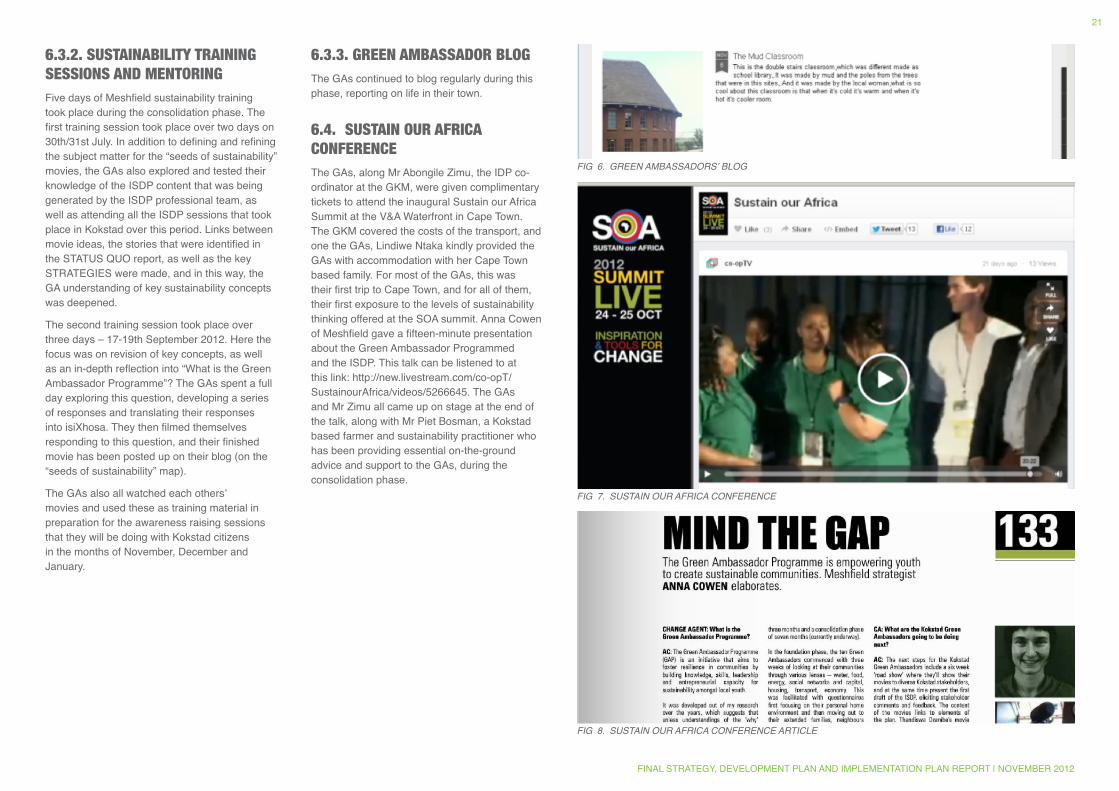
6.3.3. GREEN AMBASSADOR BLOGThe GAs continued to blog regularly during this phase, reporting on life in their town.
6.4. SUSTAIN OUR AFRICA CONFERENCEThe GAs, along Mr Abongile Zimu, the IDP co-ordinator at the GKM, were given complimentary tickets to attend the inaugural Sustain our Africa Summit at the V&A Waterfront in Cape Town. The GKM covered the costs of the transport, and one the GAs, Lindiwe Ntaka kindly provided the GAs with accommodation with her Cape Town based family. For most of the GAs, this was their first trip to Cape Town, and for all of them, their first exposure to the levels of sustainability thinking offered at the SOA summit. Anna Cowen of Meshfield gave a fifteen-minute presentation about the Green Ambassador Programmed and the ISDP. This talk can be listened to at this link: http://new.livestream.com/co-opT/SustainourAfrica/videos/5266645. The GAs and Mr Zimu all came up on stage at the end of the talk, along with Mr Piet Bosman, a Kokstad based farmer and sustainability practitioner who has been providing essential on-the-ground advice and support to the GAs, during the consolidation phase.
Fig 6. gREEN AMBASSADORS’ BLOg
Fig 7. SUSTAiN OUR AFRiCA CONFERENCE
Fig 8. SUSTAiN OUR AFRiCA CONFERENCE ARTiCLE
FINAL STRATEGY, DEVELOPMENT PLAN AND IMPLEMENTATION PLAN REPORT | NOVEMBER 2012
21
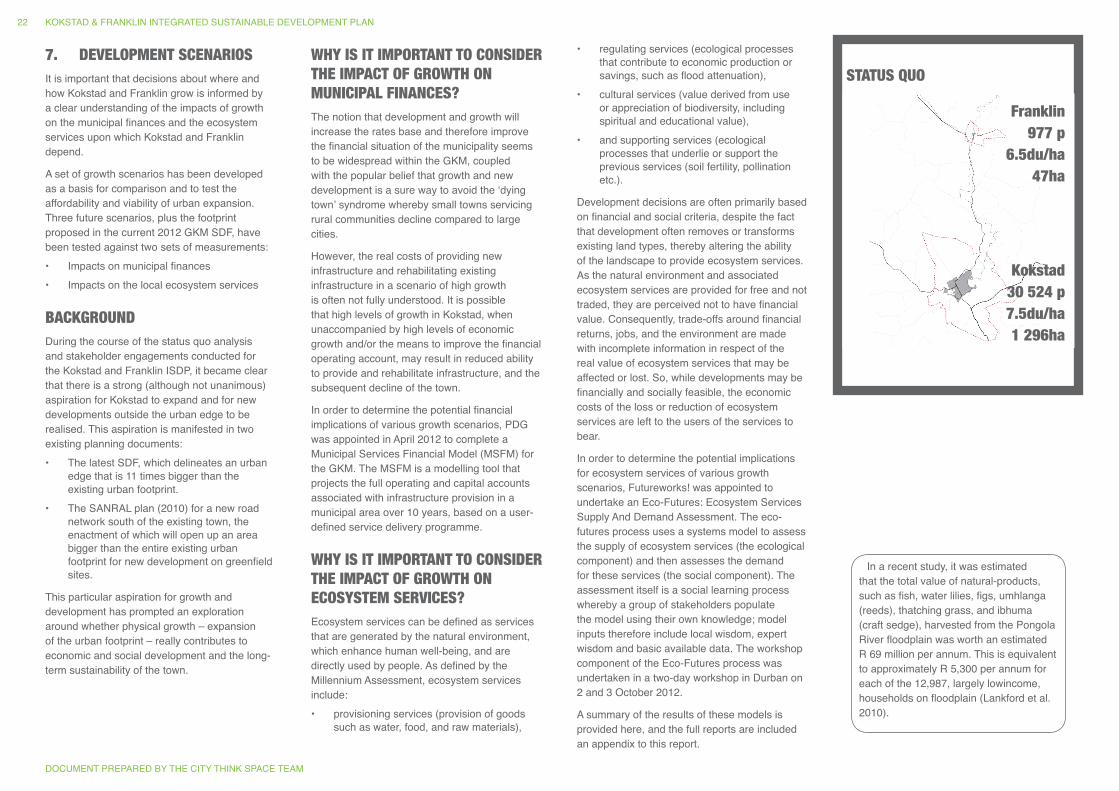
Franklin977 p
6.5du/ha47ha
Kokstad30 524 p7.5du/ha1 296ha
STATUS QUO7. DEVELOPMENT SCENARIOSIt is important that decisions about where and how Kokstad and Franklin grow is informed by a clear understanding of the impacts of growth on the municipal finances and the ecosystem services upon which Kokstad and Franklin depend.
A set of growth scenarios has been developed as a basis for comparison and to test the affordability and viability of urban expansion. Three future scenarios, plus the footprint proposed in the current 2012 GKM SDF, have been tested against two sets of measurements:• Impacts on municipal finances• Impacts on the local ecosystem services
BACKGROUNDDuring the course of the status quo analysis and stakeholder engagements conducted for the Kokstad and Franklin ISDP, it became clear that there is a strong (although not unanimous) aspiration for Kokstad to expand and for new developments outside the urban edge to be realised. This aspiration is manifested in two existing planning documents:• The latest SDF, which delineates an urban
edge that is 11 times bigger than the existing urban footprint.
• The SANRAL plan (2010) for a new road network south of the existing town, the enactment of which will open up an area bigger than the entire existing urban footprint for new development on greenfield sites.
This particular aspiration for growth and development has prompted an exploration around whether physical growth – expansion of the urban footprint – really contributes to economic and social development and the long-term sustainability of the town.
WHY IS IT IMPORTANT TO CONSIDER THE IMPACT OF GROWTH ON MUNICIPAL FINANCES?The notion that development and growth will increase the rates base and therefore improve the financial situation of the municipality seems to be widespread within the GKM, coupled with the popular belief that growth and new development is a sure way to avoid the ‘dying town’ syndrome whereby small towns servicing rural communities decline compared to large cities.
However, the real costs of providing new infrastructure and rehabilitating existing infrastructure in a scenario of high growth is often not fully understood. It is possible that high levels of growth in Kokstad, when unaccompanied by high levels of economic growth and/or the means to improve the financial operating account, may result in reduced ability to provide and rehabilitate infrastructure, and the subsequent decline of the town.
In order to determine the potential financial implications of various growth scenarios, PDG was appointed in April 2012 to complete a Municipal Services Financial Model (MSFM) for the GKM. The MSFM is a modelling tool that projects the full operating and capital accounts associated with infrastructure provision in a municipal area over 10 years, based on a user-defined service delivery programme.
WHY IS IT IMPORTANT TO CONSIDER THE IMPACT OF GROWTH ON ECOSYSTEM SERVICES?Ecosystem services can be defined as services that are generated by the natural environment, which enhance human well-being, and are directly used by people. As defined by the Millennium Assessment, ecosystem services include:• provisioning services (provision of goods
such as water, food, and raw materials),
• regulating services (ecological processes that contribute to economic production or savings, such as flood attenuation),
• cultural services (value derived from use or appreciation of biodiversity, including spiritual and educational value),
• and supporting services (ecological processes that underlie or support the previous services (soil fertility, pollination etc.).
Development decisions are often primarily based on financial and social criteria, despite the fact that development often removes or transforms existing land types, thereby altering the ability of the landscape to provide ecosystem services. As the natural environment and associated ecosystem services are provided for free and not traded, they are perceived not to have financial value. Consequently, trade-offs around financial returns, jobs, and the environment are made with incomplete information in respect of the real value of ecosystem services that may be affected or lost. So, while developments may be financially and socially feasible, the economic costs of the loss or reduction of ecosystem services are left to the users of the services to bear.
In order to determine the potential implications for ecosystem services of various growth scenarios, Futureworks! was appointed to undertake an Eco-Futures: Ecosystem Services Supply And Demand Assessment. The eco-futures process uses a systems model to assess the supply of ecosystem services (the ecological component) and then assesses the demand for these services (the social component). The assessment itself is a social learning process whereby a group of stakeholders populate the model using their own knowledge; model inputs therefore include local wisdom, expert wisdom and basic available data. The workshop component of the Eco-Futures process was undertaken in a two-day workshop in Durban on 2 and 3 October 2012.
A summary of the results of these models is provided here, and the full reports are included an appendix to this report.
In a recent study, it was estimated that the total value of natural-products, such as fish, water lilies, figs, umhlanga (reeds), thatching grass, and ibhuma (craft sedge), harvested from the Pongola River floodplain was worth an estimated R 69 million per annum. This is equivalent to approximately R 5,300 per annum for each of the 12,987, largely lowincome, households on floodplain (Lankford et al. 2010).
DOCUMENT PREPARED BY THE CITY THINK SPACE TEAM
KOKSTAD & FRANKLIN INTEGRATED SUSTAINABLE DEVELOPMENT PLAN22
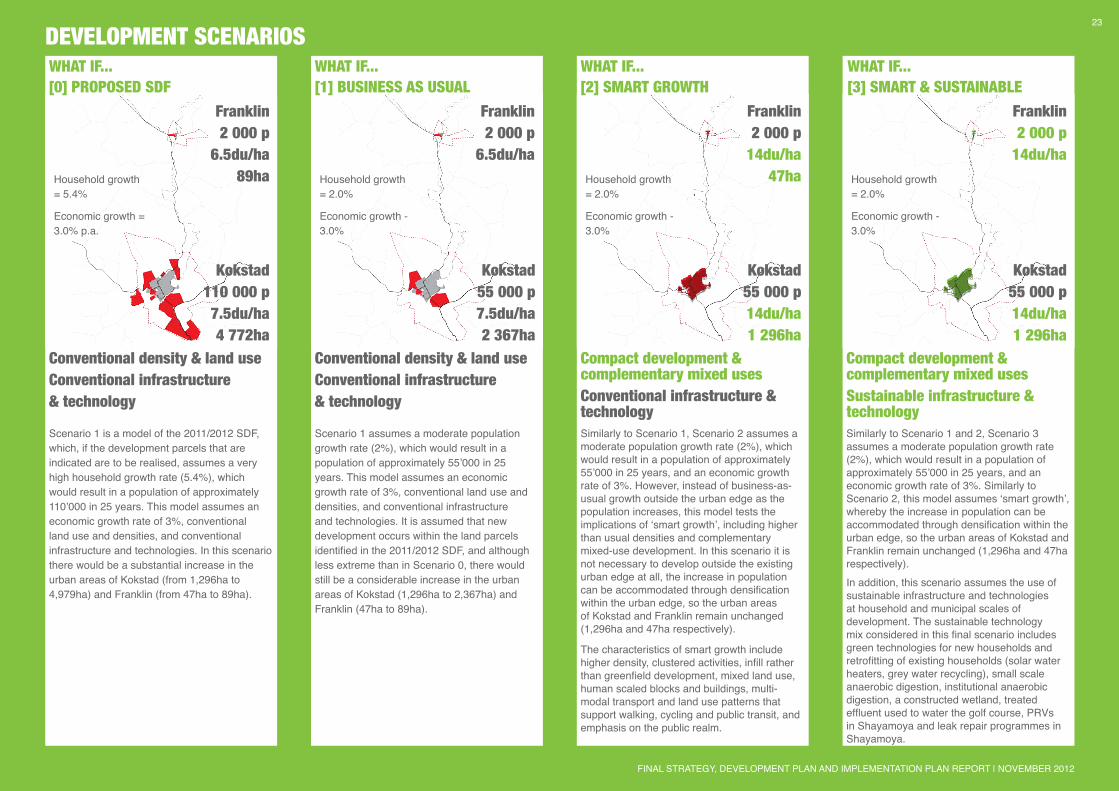
Conventional density & land useConventional infrastructure & technology
Scenario 1 is a model of the 2011/2012 SDF, which, if the development parcels that are indicated are to be realised, assumes a very high household growth rate (5.4%), which would result in a population of approximately 110’000 in 25 years. This model assumes an economic growth rate of 3%, conventional land use and densities, and conventional infrastructure and technologies. In this scenario there would be a substantial increase in the urban areas of Kokstad (from 1,296ha to 4,979ha) and Franklin (from 47ha to 89ha).
Household growth = 5.4%
Economic growth = 3.0% p.a.
Conventional density & land useConventional infrastructure & technology
Scenario 1 assumes a moderate population growth rate (2%), which would result in a population of approximately 55’000 in 25 years. This model assumes an economic growth rate of 3%, conventional land use and densities, and conventional infrastructure and technologies. It is assumed that new development occurs within the land parcels identified in the 2011/2012 SDF, and although less extreme than in Scenario 0, there would still be a considerable increase in the urban areas of Kokstad (1,296ha to 2,367ha) and Franklin (47ha to 89ha).
Household growth = 2.0%
Economic growth - 3.0%
Compact development & complementary mixed usesConventional infrastructure & technologySimilarly to Scenario 1, Scenario 2 assumes a moderate population growth rate (2%), which would result in a population of approximately 55’000 in 25 years, and an economic growth rate of 3%. However, instead of business-as-usual growth outside the urban edge as the population increases, this model tests the implications of ‘smart growth’, including higher than usual densities and complementary mixed-use development. In this scenario it is not necessary to develop outside the existing urban edge at all, the increase in population can be accommodated through densification within the urban edge, so the urban areas of Kokstad and Franklin remain unchanged (1,296ha and 47ha respectively).
The characteristics of smart growth include higher density, clustered activities, infill rather than greenfield development, mixed land use, human scaled blocks and buildings, multi-modal transport and land use patterns that support walking, cycling and public transit, and emphasis on the public realm.
Household growth = 2.0%
Economic growth - 3.0%
Compact development & complementary mixed usesSustainable infrastructure & technologySimilarly to Scenario 1 and 2, Scenario 3 assumes a moderate population growth rate (2%), which would result in a population of approximately 55’000 in 25 years, and an economic growth rate of 3%. Similarly to Scenario 2, this model assumes ‘smart growth’, whereby the increase in population can be accommodated through densification within the urban edge, so the urban areas of Kokstad and Franklin remain unchanged (1,296ha and 47ha respectively). In addition, this scenario assumes the use of sustainable infrastructure and technologies at household and municipal scales of development. The sustainable technology mix considered in this final scenario includes green technologies for new households and retrofitting of existing households (solar water heaters, grey water recycling), small scale anaerobic digestion, institutional anaerobic digestion, a constructed wetland, treated effluent used to water the golf course, PRVs in Shayamoya and leak repair programmes in Shayamoya.
Household growth = 2.0%
Economic growth - 3.0%
Franklin2 000 p
6.5du/ha89ha
Franklin2 000 p
6.5du/ha
Franklin2 000 p
14du/ha47ha
Franklin2 000 p
14du/ha
Kokstad110 000 p7.5du/ha4 772ha
Kokstad55 000 p7.5du/ha2 367ha
Kokstad55 000 p14du/ha1 296ha
Kokstad55 000 p14du/ha1 296ha
DEVELOPMENT SCENARIOS WHAT IF...WHAT IF...[1] BUSINESS AS USUAL[0] PROPOSED SDF
WHAT IF... WHAT IF...[2] SMART GROWTH [3] SMART & SUSTAINABLE
FINAL STRATEGY, DEVELOPMENT PLAN AND IMPLEMENTATION PLAN REPORT | NOVEMBER 2012
23
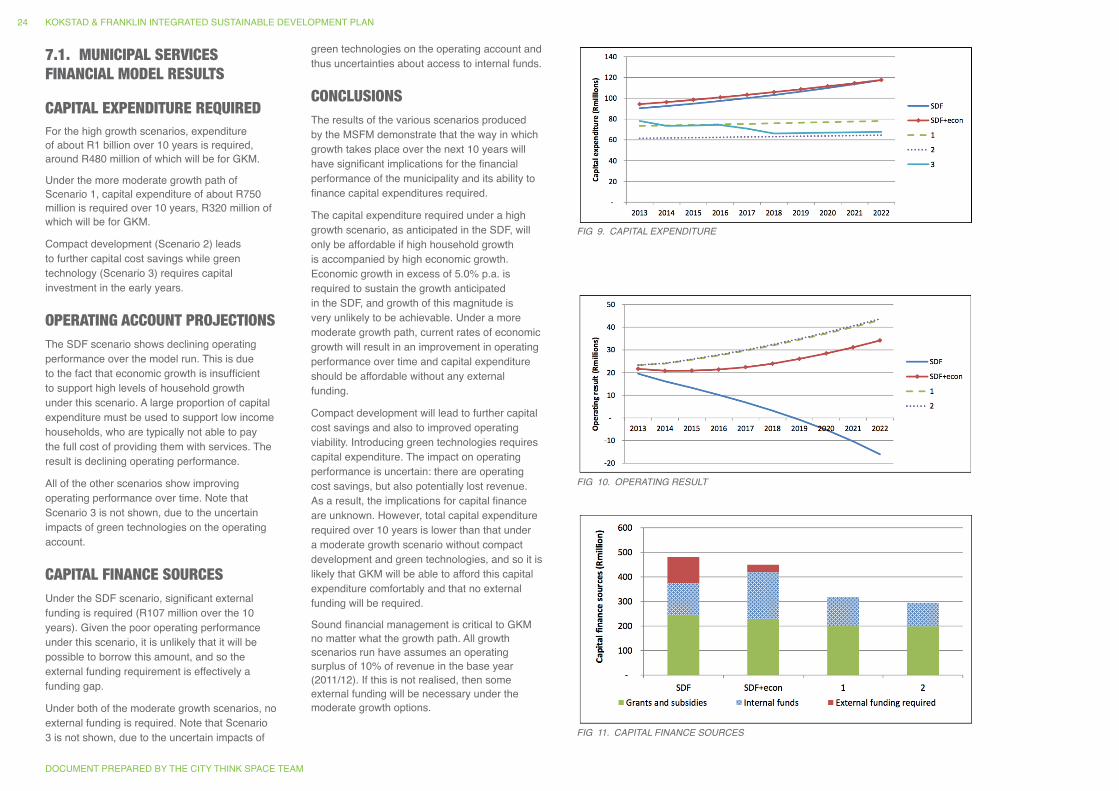
7.1. MUNICIPAL SERVICES FINANCIAL MODEL RESULTS
CAPITAL EXPENDITURE REQUIRED For the high growth scenarios, expenditure of about R1 billion over 10 years is required, around R480 million of which will be for GKM.
Under the more moderate growth path of Scenario 1, capital expenditure of about R750 million is required over 10 years, R320 million of which will be for GKM.
Compact development (Scenario 2) leads to further capital cost savings while green technology (Scenario 3) requires capital investment in the early years.
OPERATING ACCOUNT PROJECTIONSThe SDF scenario shows declining operating performance over the model run. This is due to the fact that economic growth is insufficient to support high levels of household growth under this scenario. A large proportion of capital expenditure must be used to support low income households, who are typically not able to pay the full cost of providing them with services. The result is declining operating performance.
All of the other scenarios show improving operating performance over time. Note that Scenario 3 is not shown, due to the uncertain impacts of green technologies on the operating account.
CAPITAL FINANCE SOURCESUnder the SDF scenario, significant external funding is required (R107 million over the 10 years). Given the poor operating performance under this scenario, it is unlikely that it will be possible to borrow this amount, and so the external funding requirement is effectively a funding gap.
Under both of the moderate growth scenarios, no external funding is required. Note that Scenario 3 is not shown, due to the uncertain impacts of
green technologies on the operating account and thus uncertainties about access to internal funds.
CONCLUSIONSThe results of the various scenarios produced by the MSFM demonstrate that the way in which growth takes place over the next 10 years will have significant implications for the financial performance of the municipality and its ability to finance capital expenditures required.
The capital expenditure required under a high growth scenario, as anticipated in the SDF, will only be affordable if high household growth is accompanied by high economic growth. Economic growth in excess of 5.0% p.a. is required to sustain the growth anticipated in the SDF, and growth of this magnitude is very unlikely to be achievable. Under a more moderate growth path, current rates of economic growth will result in an improvement in operating performance over time and capital expenditure should be affordable without any external funding.
Compact development will lead to further capital cost savings and also to improved operating viability. Introducing green technologies requires capital expenditure. The impact on operating performance is uncertain: there are operating cost savings, but also potentially lost revenue. As a result, the implications for capital finance are unknown. However, total capital expenditure required over 10 years is lower than that under a moderate growth scenario without compact development and green technologies, and so it is likely that GKM will be able to afford this capital expenditure comfortably and that no external funding will be required.
Sound financial management is critical to GKM no matter what the growth path. All growth scenarios run have assumes an operating surplus of 10% of revenue in the base year (2011/12). If this is not realised, then some external funding will be necessary under the moderate growth options.
Fig 9. CAPiTAL EXPENDiTURE
Fig 10. OPERATiNg RESULT
Fig 11. CAPiTAL FiNANCE SOURCES
DOCUMENT PREPARED BY THE CITY THINK SPACE TEAM
KOKSTAD & FRANKLIN INTEGRATED SUSTAINABLE DEVELOPMENT PLAN24
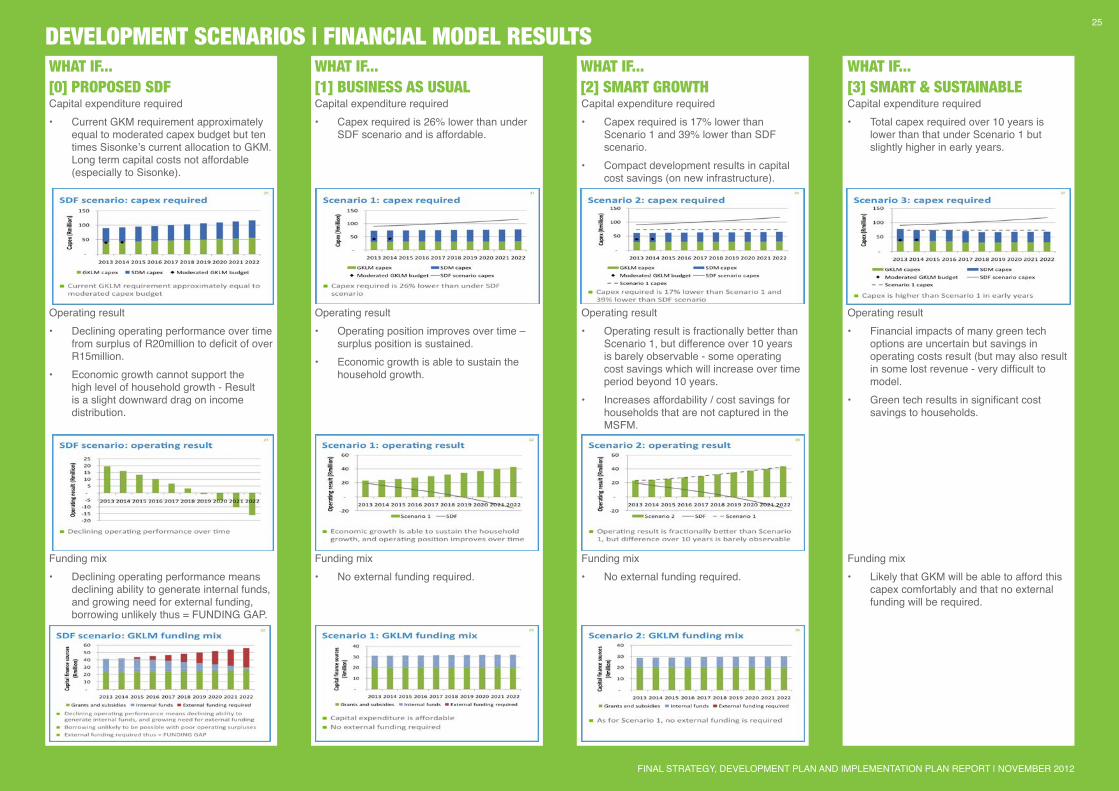
Operating result• Declining operating performance over time
from surplus of R20million to deficit of over R15million.
• Economic growth cannot support the high level of household growth - Result is a slight downward drag on income distribution.
Funding mix• Declining operating performance means
declining ability to generate internal funds, and growing need for external funding, borrowing unlikely thus = FUNDING GAP.
Capital expenditure required• Current GKM requirement approximately
equal to moderated capex budget but ten times Sisonke’s current allocation to GKM. Long term capital costs not affordable (especially to Sisonke).
Operating result• Operating position improves over time –
surplus position is sustained.• Economic growth is able to sustain the
household growth.
Funding mix• No external funding required.
Capital expenditure required• Capex required is 26% lower than under
SDF scenario and is affordable.
Operating result • Operating result is fractionally better than
Scenario 1, but difference over 10 years is barely observable - some operating cost savings which will increase over time period beyond 10 years.
• Increases affordability / cost savings for households that are not captured in the MSFM.
Funding mix • No external funding required.
Capital expenditure required• Capex required is 17% lower than
Scenario 1 and 39% lower than SDF scenario.
• Compact development results in capital cost savings (on new infrastructure).
Operating result• Financial impacts of many green tech
options are uncertain but savings in operating costs result (but may also result in some lost revenue - very difficult to model.
• Green tech results in significant cost savings to households.
Funding mix• Likely that GKM will be able to afford this
capex comfortably and that no external funding will be required.
Capital expenditure required• Total capex required over 10 years is
lower than that under Scenario 1 but slightly higher in early years.
DEVELOPMENT SCENARIOS | FINANCIAL MODEL RESULTSWHAT IF...WHAT IF...[1] BUSINESS AS USUAL[0] PROPOSED SDF
WHAT IF... WHAT IF...[2] SMART GROWTH [3] SMART & SUSTAINABLE
FINAL STRATEGY, DEVELOPMENT PLAN AND IMPLEMENTATION PLAN REPORT | NOVEMBER 2012
25
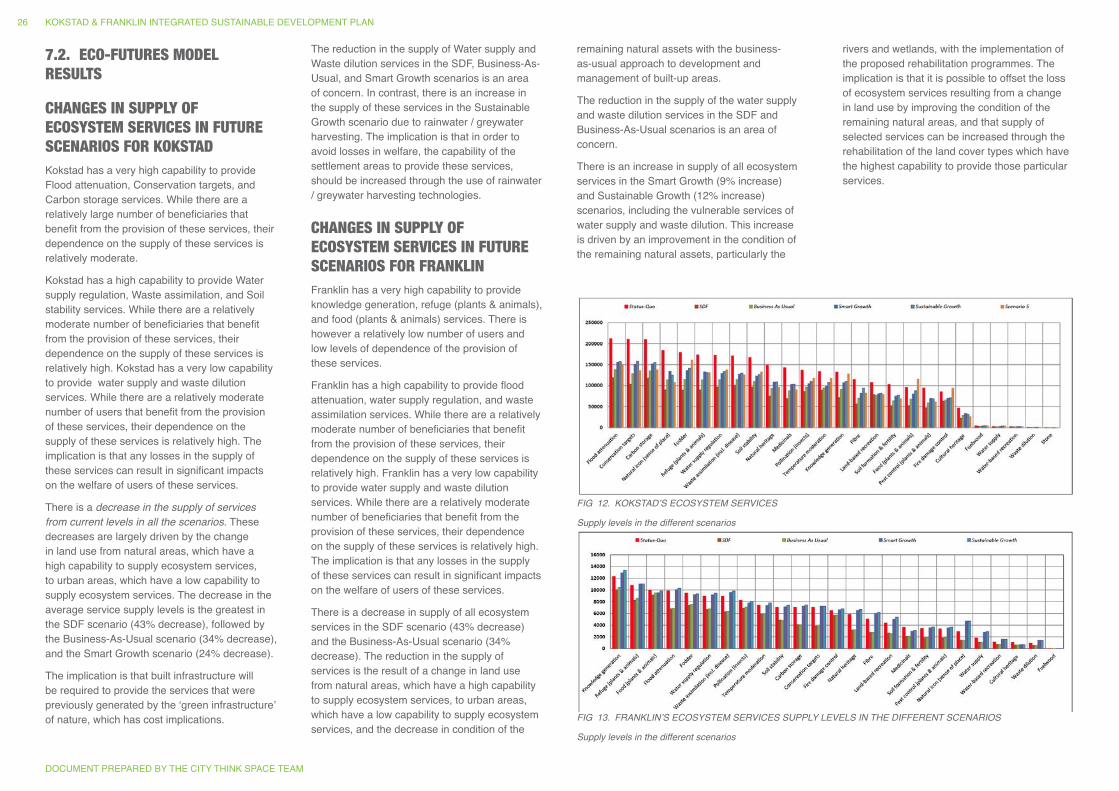
7.2. ECO-FUTURES MODEL RESULTS
CHANGES IN SUPPLY OF ECOSYSTEM SERVICES IN FUTURE SCENARIOS FOR KOKSTADKokstad has a very high capability to provide Flood attenuation, Conservation targets, and Carbon storage services. While there are a relatively large number of beneficiaries that benefit from the provision of these services, their dependence on the supply of these services is relatively moderate.
Kokstad has a high capability to provide Water supply regulation, Waste assimilation, and Soil stability services. While there are a relatively moderate number of beneficiaries that benefit from the provision of these services, their dependence on the supply of these services is relatively high. Kokstad has a very low capability to provide water supply and waste dilution services. While there are a relatively moderate number of users that benefit from the provision of these services, their dependence on the supply of these services is relatively high. The implication is that any losses in the supply of these services can result in significant impacts on the welfare of users of these services.
There is a decrease in the supply of services from current levels in all the scenarios. These decreases are largely driven by the change in land use from natural areas, which have a high capability to supply ecosystem services, to urban areas, which have a low capability to supply ecosystem services. The decrease in the average service supply levels is the greatest in the SDF scenario (43% decrease), followed by the Business-As-Usual scenario (34% decrease), and the Smart Growth scenario (24% decrease).
The implication is that built infrastructure will be required to provide the services that were previously generated by the ‘green infrastructure’ of nature, which has cost implications.
The reduction in the supply of Water supply and Waste dilution services in the SDF, Business-As-Usual, and Smart Growth scenarios is an area of concern. In contrast, there is an increase in the supply of these services in the Sustainable Growth scenario due to rainwater / greywater harvesting. The implication is that in order to avoid losses in welfare, the capability of the settlement areas to provide these services, should be increased through the use of rainwater / greywater harvesting technologies.
CHANGES IN SUPPLY OF ECOSYSTEM SERVICES IN FUTURE SCENARIOS FOR FRANKLINFranklin has a very high capability to provide knowledge generation, refuge (plants & animals), and food (plants & animals) services. There is however a relatively low number of users and low levels of dependence of the provision of these services.
Franklin has a high capability to provide flood attenuation, water supply regulation, and waste assimilation services. While there are a relatively moderate number of beneficiaries that benefit from the provision of these services, their dependence on the supply of these services is relatively high. Franklin has a very low capability to provide water supply and waste dilution services. While there are a relatively moderate number of beneficiaries that benefit from the provision of these services, their dependence on the supply of these services is relatively high. The implication is that any losses in the supply of these services can result in significant impacts on the welfare of users of these services.
There is a decrease in supply of all ecosystem services in the SDF scenario (43% decrease) and the Business-As-Usual scenario (34% decrease). The reduction in the supply of services is the result of a change in land use from natural areas, which have a high capability to supply ecosystem services, to urban areas, which have a low capability to supply ecosystem services, and the decrease in condition of the
remaining natural assets with the business-as-usual approach to development and management of built-up areas.
The reduction in the supply of the water supply and waste dilution services in the SDF and Business-As-Usual scenarios is an area of concern.
There is an increase in supply of all ecosystem services in the Smart Growth (9% increase) and Sustainable Growth (12% increase) scenarios, including the vulnerable services of water supply and waste dilution. This increase is driven by an improvement in the condition of the remaining natural assets, particularly the
rivers and wetlands, with the implementation of the proposed rehabilitation programmes. The implication is that it is possible to offset the loss of ecosystem services resulting from a change in land use by improving the condition of the remaining natural areas, and that supply of selected services can be increased through the rehabilitation of the land cover types which have the highest capability to provide those particular services.
Fig 12. KOKSTAD’S ECOSYSTEM SERViCES
Supply levels in the different scenarios
Fig 13. FRANKLiN’S ECOSYSTEM SERViCES SUPPLY LEVELS iN THE DiFFERENT SCENARiOS
Supply levels in the different scenarios
DOCUMENT PREPARED BY THE CITY THINK SPACE TEAM
KOKSTAD & FRANKLIN INTEGRATED SUSTAINABLE DEVELOPMENT PLAN26
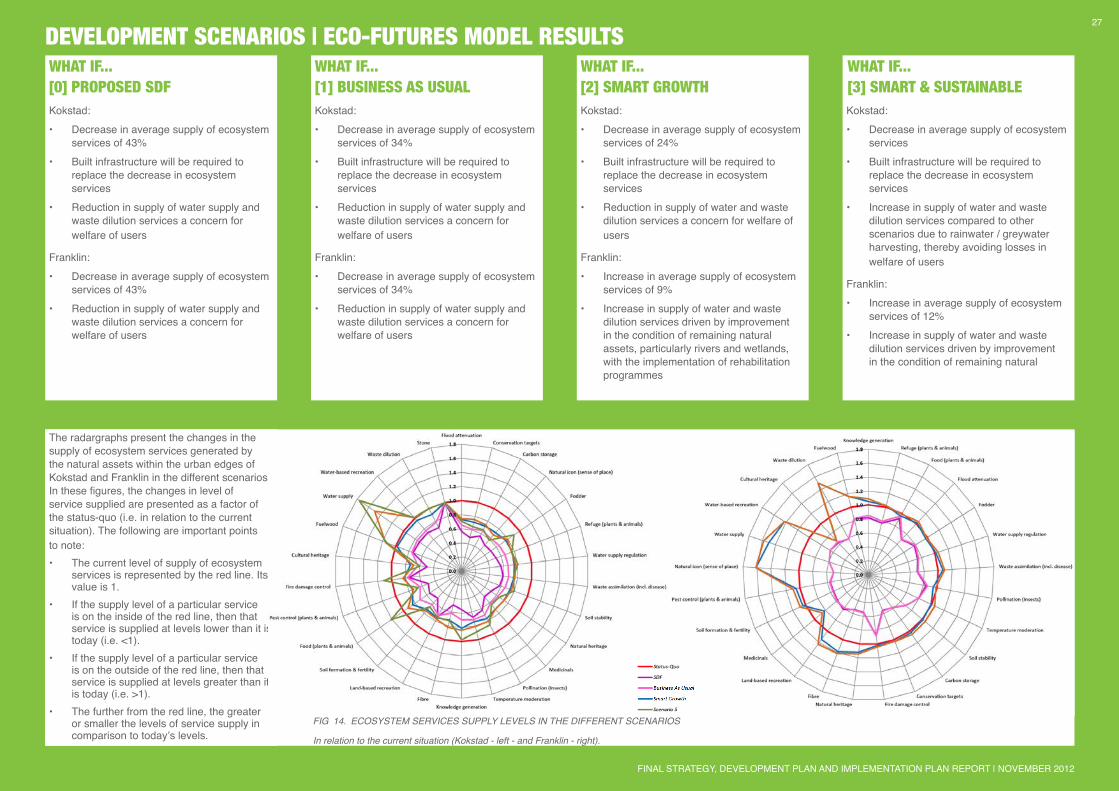
Fig 14. ECOSYSTEM SERViCES SUPPLY LEVELS iN THE DiFFERENT SCENARiOS
in relation to the current situation (Kokstad - left - and Franklin - right).
Kokstad:• Decrease in average supply of ecosystem
services of 43%• Built infrastructure will be required to
replace the decrease in ecosystem services
• Reduction in supply of water supply and waste dilution services a concern for welfare of users
Franklin:• Decrease in average supply of ecosystem
services of 43%• Reduction in supply of water supply and
waste dilution services a concern for welfare of users
Kokstad:• Decrease in average supply of ecosystem
services of 34%• Built infrastructure will be required to
replace the decrease in ecosystem services
• Reduction in supply of water supply and waste dilution services a concern for welfare of users
Franklin:• Decrease in average supply of ecosystem
services of 34%• Reduction in supply of water supply and
waste dilution services a concern for welfare of users
Kokstad:• Decrease in average supply of ecosystem
services of 24%• Built infrastructure will be required to
replace the decrease in ecosystem services
• Reduction in supply of water and waste dilution services a concern for welfare of users
Franklin:• Increase in average supply of ecosystem
services of 9%• Increase in supply of water and waste
dilution services driven by improvement in the condition of remaining natural assets, particularly rivers and wetlands, with the implementation of rehabilitation programmes
Kokstad:• Decrease in average supply of ecosystem
services• Built infrastructure will be required to
replace the decrease in ecosystem services
• Increase in supply of water and waste dilution services compared to other scenarios due to rainwater / greywater harvesting, thereby avoiding losses in welfare of users
Franklin:• Increase in average supply of ecosystem
services of 12%• Increase in supply of water and waste
dilution services driven by improvement in the condition of remaining natural
WHAT IF...WHAT IF...[1] BUSINESS AS USUAL[0] PROPOSED SDF
WHAT IF... WHAT IF...[2] SMART GROWTH [3] SMART & SUSTAINABLE
The radargraphs present the changes in the supply of ecosystem services generated by the natural assets within the urban edges of Kokstad and Franklin in the different scenarios. In these figures, the changes in level of service supplied are presented as a factor of the status-quo (i.e. in relation to the current situation). The following are important points to note:• The current level of supply of ecosystem
services is represented by the red line. Its value is 1.
• If the supply level of a particular service is on the inside of the red line, then that service is supplied at levels lower than it is today (i.e. <1).
• If the supply level of a particular service is on the outside of the red line, then that service is supplied at levels greater than it is today (i.e. >1).
• The further from the red line, the greater or smaller the levels of service supply in comparison to today’s levels.
DEVELOPMENT SCENARIOS | ECO-FUTURES MODEL RESULTS
FINAL STRATEGY, DEVELOPMENT PLAN AND IMPLEMENTATION PLAN REPORT | NOVEMBER 2012
27
8. ISDP STRATEGIC OUTCOMES & STRATEGIESIt is essential that the strategies for the ISDP are focused and directed by a clear goal rather than a long shopping list of everyone’s pet projects. An outcomes-based approach has been used to ensure that the selected strategies will contribute to achieving results that are in everyone’s interests.
8.1. DESIRED OUTCOME FOR KOKSTAD AND FRANKLIN A working statement of the desired outcome of the ISDP has been developed. This tries to distil the key policy and stakeholder sentiments encountered in the project. It reads as follows:
Future Kokstad and Franklin are safe and just with a strong social foundation where poverty and inequality is eradicated and all human needs are met, in dynamic balance with the finite environmental resource base that supports all life.
8.2. THE 5 MAIN STRATEGIESThis report proposes 5 strategies twoards the achievement of the overall outcome statement. Each of the proposed strategies draw on leading edge sustainability theory and successful practical application in many different, yet relevant contexts. They are viewed as part of an integrated whole, gaining strength and durability through their complementary interactions. Working together, they provide a focus for plans and project that can create a SAFE and JUST Kokstad and Franklin that is: • living within the environmental limits of a
finite planet • underpinned by a strong social foundation • where human needs are being met in an
equitable way.
The 5 main strategies identified for Kokstad and Franklin are:
1. Localise
2. Develop, Contain and Safeguard
3. Develop Skills and Promote Innovation
4. Diversify and Intensify
5. Promote Access, Identity and Integration
DOCUMENT PREPARED BY THE CITY THINK SPACE TEAM
KOKSTAD & FRANKLIN INTEGRATED SUSTAINABLE DEVELOPMENT PLAN28
Future Kokstad & Franklin are
safe and just with a strong social
foundation where poverty and inequality
is eradicated and all human needs
are met, in dynamic balance with the
finite environmental resource base that
supports all life.
1. LOCALISE
Localise markets, businesses, building, agriculture, industries and technologies and skills to build a strong and equitable local economy that reduces poverty, is resilient to energy and price shocks, diminishing resources and climate change.
2. DEVELOP, CONTAIN AND SAFEGUARD
Grow within available resource limits, and ensure access to resources for the poor. Contain the negative impacts of development and settlement to protect the natural resource and agricultural base of Kokstad and Franklin and optimise ecosystem services potential for all.
3. DEVELOP SKILLS AND PROMOTE INNOVATION
Make Kokstad a centre of skills development and innovation in sustainable development, sustainable agriculture, and the green economy, with high quality affordable access to information, training and technology.
4. DIVERSIFY AND INTENSIFY
Increase the range, mix and intensity of opportunity, accommodation, services and amenities, and entertainment in Kokstad, making Kokstad a livelier place with increased choice and diversity for everyone.
5. PROMOTE ACCESS, IDENTITY AND INTEGRATION
Promote Kokstad and Franklin as places with a strong, united sense of identity. Build a new heart for “one Kokstad” to promote a sense of belonging and to integrate the town. Ensure equitable access to opportunities and services. Inspire involvement in civic ‘projects’ by all segments of the population.
Kokstad and Franklin’s economies are resilient and localised.
Kokstad and Franklin grow within their resource limits and the negative consequences of development are contained.
Appropriate skills development for all the people of Kokstad and Franklin is prioritised. Access to information and technology for sustainable development is easy and affordable.
Kokstad and Franklin are lively and interesting with a wide range of economic and social choices and opportunities.
The people of Kokstad and Franklin are proud to belong and there is equitable and affordable access to opportunity.
STRATEGIC OUTCOMES & STRATEGIES TOWARDS SUSTAINABILITY
FINAL STRATEGY, DEVELOPMENT PLAN AND IMPLEMENTATION PLAN REPORT | NOVEMBER 2012
29STRATEGIC OUTCOM
ESSTRATEGIES
PART II STRATEGY, DEVELOPMENT & IMPLEMENTATION PLAN
CROSSROADS
INSTITUTIONS
STRATEGY DEVELOPMENT PLAN IMPLEMENTATION PLAN
TOWN
INFRASTRUCTURE
NATURAL RESOURCES
IMPLEMENTATION PLAN
AGRICULTURE
DOCUMENT PREPARED BY THE CITY THINK SPACE TEAM
KOKSTAD & FRANKLIN INTEGRATED SUSTAINABLE DEVELOPMENT PLAN30
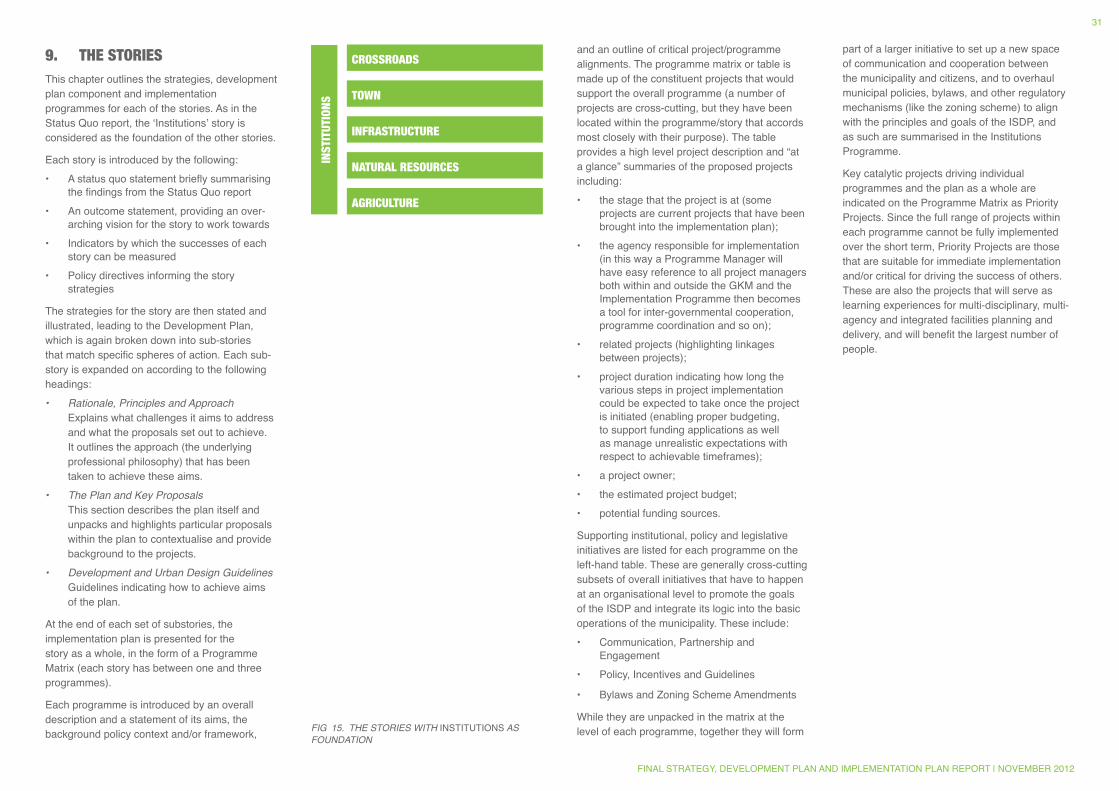
CROSSROADS
INST
ITUT
IONS
TOWN
INFRASTRUCTURE
NATURAL RESOURCES
AGRICULTURE
Fig 15. THE STORiES WiTH INSTITUTIONS AS FOUNDATiON
9. THE STORIESThis chapter outlines the strategies, development plan component and implementation programmes for each of the stories. As in the Status Quo report, the ‘Institutions’ story is considered as the foundation of the other stories.
Each story is introduced by the following:• A status quo statement briefly summarising
the findings from the Status Quo report• An outcome statement, providing an over-
arching vision for the story to work towards• Indicators by which the successes of each
story can be measured• Policy directives informing the story
strategies
The strategies for the story are then stated and illustrated, leading to the Development Plan, which is again broken down into sub-stories that match specific spheres of action. Each sub-story is expanded on according to the following headings:• Rationale, Principles and Approach
Explains what challenges it aims to address and what the proposals set out to achieve. It outlines the approach (the underlying professional philosophy) that has been taken to achieve these aims.
• The Plan and Key ProposalsThis section describes the plan itself and unpacks and highlights particular proposals within the plan to contextualise and provide background to the projects.
• Development and Urban Design guidelinesGuidelines indicating how to achieve aims of the plan.
At the end of each set of substories, the implementation plan is presented for the story as a whole, in the form of a Programme Matrix (each story has between one and three programmes).
Each programme is introduced by an overall description and a statement of its aims, the background policy context and/or framework,
and an outline of critical project/programme alignments. The programme matrix or table is made up of the constituent projects that would support the overall programme (a number of projects are cross-cutting, but they have been located within the programme/story that accords most closely with their purpose). The table provides a high level project description and “at a glance” summaries of the proposed projects including:• the stage that the project is at (some
projects are current projects that have been brought into the implementation plan);
• the agency responsible for implementation (in this way a Programme Manager will have easy reference to all project managers both within and outside the GKM and the Implementation Programme then becomes a tool for inter-governmental cooperation, programme coordination and so on);
• related projects (highlighting linkages between projects);
• project duration indicating how long the various steps in project implementation could be expected to take once the project is initiated (enabling proper budgeting, to support funding applications as well as manage unrealistic expectations with respect to achievable timeframes);
• a project owner;• the estimated project budget;• potential funding sources.
Supporting institutional, policy and legislative initiatives are listed for each programme on the left-hand table. These are generally cross-cutting subsets of overall initiatives that have to happen at an organisational level to promote the goals of the ISDP and integrate its logic into the basic operations of the municipality. These include: • Communication, Partnership and
Engagement• Policy, Incentives and Guidelines
• Bylaws and Zoning Scheme Amendments
While they are unpacked in the matrix at the level of each programme, together they will form
part of a larger initiative to set up a new space of communication and cooperation between the municipality and citizens, and to overhaul municipal policies, bylaws, and other regulatory mechanisms (like the zoning scheme) to align with the principles and goals of the ISDP, and as such are summarised in the Institutions Programme.
Key catalytic projects driving individual programmes and the plan as a whole are indicated on the Programme Matrix as Priority Projects. Since the full range of projects within each programme cannot be fully implemented over the short term, Priority Projects are those that are suitable for immediate implementation and/or critical for driving the success of others. These are also the projects that will serve as learning experiences for multi-disciplinary, multi-agency and integrated facilities planning and delivery, and will benefit the largest number of people.
FINAL STRATEGY, DEVELOPMENT PLAN AND IMPLEMENTATION PLAN REPORT | NOVEMBER 2012
31
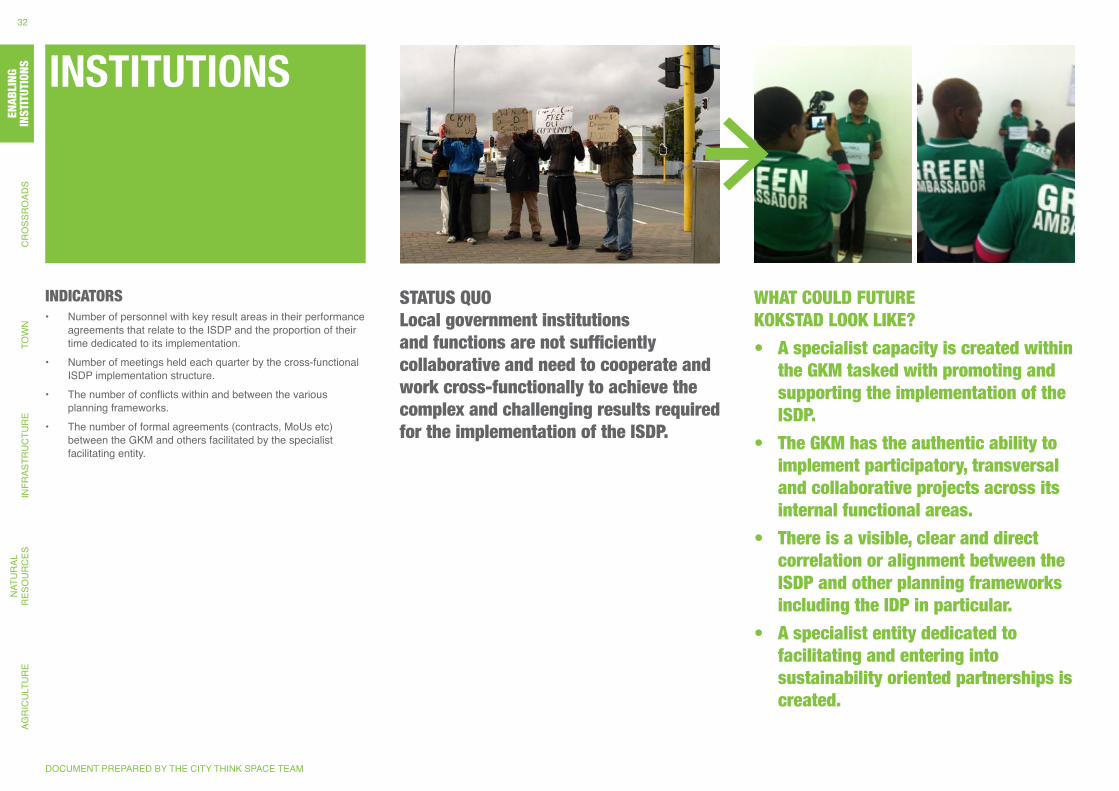
INSTITUTIONS
STATUS QUO Local government institutions and functions are not sufficiently collaborative and need to cooperate and work cross-functionally to achieve the complex and challenging results required for the implementation of the ISDP.
WHAT COULD FUTURE KOKSTAD LOOK LIKE?
• A specialist capacity is created within the GKM tasked with promoting and supporting the implementation of the ISDP.
• The GKM has the authentic ability to implement participatory, transversal and collaborative projects across its internal functional areas.
• There is a visible, clear and direct correlation or alignment between the ISDP and other planning frameworks including the IDP in particular.
• A specialist entity dedicated to facilitating and entering into sustainability oriented partnerships is created.
INDICATORS • Number of personnel with key result areas in their performance
agreements that relate to the ISDP and the proportion of their time dedicated to its implementation.
• Number of meetings held each quarter by the cross-functional ISDP implementation structure.
• The number of conflicts within and between the various planning frameworks.
• The number of formal agreements (contracts, MoUs etc) between the GKM and others facilitated by the specialist facilitating entity.
DOCUMENT PREPARED BY THE CITY THINK SPACE TEAM
AGR
ICU
LTU
RE
NAT
UR
AL
RES
OU
RC
ESIN
FRAS
TRU
CTU
RE
TOW
NC
RO
SSR
OAD
SEN
ABLI
NG
INST
ITU
TIO
NS
32EN
ABLI
NG
INST
ITUT
IONS
9.1. INSTITUTIONSThis story is primarily concerned with the relationship between the GKM and other spheres of government, as well as the relationships between the GKM, business, civil society and individual citizens. The current situation, in which there is limited interaction and little collaborative work, should change into one characterised by partnerships and cooperation.
9.1.1. POLICY DIRECTION INFORMING INSTITUTIONAL AND GOVERNANCE SUPPORTKey policies and acts that inform this plan are:• The Constitution binds all spheres of
government and organs of state in each sphere of government to three basic principles:
- A common loyalty to the Republic as a whole. This mean that all spheres are committed to secure the well-being of the people of the Republic and, to that end, must provide effective, transparent, accountable and coherent government for the Republic as a whole.
- The distinctiveness of the spheres should be respected. A sphere must remain within its constitutional mandate, and when exercising those powers, must not do so in a manner that encroaches on the geographical, functional or institutional integrity of another sphere, except where specifically directed otherwise.
- The spheres of government must take concrete steps to realise cooperative government by fostering friendly relations; assisting and supporting one another; informing one another of, and consulting one another on, matters of common interest; coordinating their actions and legislation with one another; and adhering to agreed procedures.
• The Municipal Financial Management Act (MFMA) emphasises accountability, oversight and transparency, and there will be more clarity over roles and responsibilities of municipal councils.
The legislation promotes a more strategic approach to financial management, linking the municipal budget, the IDP and resources. It also advocates a separation of oversight, fiduciary, operational and other responsibilities of the various stakeholders in order to develop more operational accountability. Operational efficiency is improved as managers have the authority to run their operations, subject to clear statements of policy and strategy.
• The Municipal Structures Act of 1998 (as amended in 2000) set out a standard division of powers which allocated to district municipalities key areas such as water, sanitation, bulk electricity, municipal health services and other functions servicing the entire district (such as fire-fighting, passenger transport, markets, promotion of tourism etc). The remaining functions were assigned to local municipalities.
• In compliance with the basic constitutional provisions and requirements in respect of municipal service provision, the Local Government: Municipal Systems Act determines specific duties and requirements for all municipalities, which must be complied with. As a general duty, a municipality must give effect to the provisions of the Constitution and must:
- give priority to the basic needs of the local community
- promote the development of the local community
- ensure that all members of the local community have access to at least the minimum level of basic services
• It requires that municipal services are equitable and accessible; provided in a manner that is conducive to prudent, economic, efficient and effective use of available resources and the improvement of standards and quality over time; financially sustainable; environmentally sustainable; regularly reviewed with a view to upgrading, extension and improvement.
• The Intergovernmental Relations Framework Act (IGRFA) of 2005 sketches out a broad statutory framework for the practice of IGR, provides for the
establishment of IG forums and provides a basic framework for the settlement of IG disputes. With the increased formalisation in the regulatory environment, there is a shift of emphasis to IG instruments facilitating the effective practice of IGR.
STATUS QUO CONTEXT: GKM at present has a limited strategic and operational policy making capacity. Its plans have a very limited transversal or integrated component and tend to be overly financially oriented without enough attention to the performance dimension. GKM’s approach to local regulations focuses on enforcement and regulation that stifles local innovation and creativity. While the GKM is in a relatively good position from a financial perspective, it urgently needs to be directing resources at the maintenance of its infrastructure.
The GKM’s tendency to separate work functions into separate and distinct units that communicate and collaborate across functions inadequately is a major concern. Also, it does not successfully collaborate with its local stakeholders effectively, leading to charges that it is aloof and distant. The Sisonke District Council’s poor performance in the management of Kokstad’s water supply and the Province’s equally problematic performance in the management of its roads are major stumbling blocks. The GKM invests resources in the development of its human capital but it is not clear that enough of a return is being achieved on this significant investment.
From a performance measurement and management perspective the GKM has significant room for improvement: the indicators used to assess performance are largely generic and insufficiently customised to the specific local context and management responses to reports are muted and often altogether silent. Information is not managed well within the municipality itself and the silo-based approach to its dissemination exacerbates the problem. Kokstad’s ability to generate, manage and disseminate knowledge does not harness the
possibilities presented by technology or social networking.
Efforts to reach out to stakeholders and communities are not adequate and do not create the necessary sense of inclusion or responsiveness. Advocacy efforts are muted and delayed, with local and provincial government speaking to communities without authentically listening or incorporating what is said in plans and programmes.
STRATEGIC FOCUS: The focus is to build the GKM’s ability to enter into and deliver on partnerships, which will be a very challenging task, given the prevailing practices and its constraining policy framework. An important requirement is to create specialist capacities that will firstly take responsibility for driving the implementation of the ISDP and secondly to act as a facilitator of partnerships with external stakeholders. As part of this overall approach, GKM needs to be identifying ways in which it can reduce its dependence on other spheres of government, especially with regard to its relationship to the Sisonke District Council regarding water and sanitation and the provincial government regarding roads.
9.1.2. INSTITUTIONS AND GOVERNANCE DEVELOPMENT PLAN
RATIONALE AND APPROACHKokstad’s currently has a major advantage in that it serves as an important service centre, providing government and private services to a range of service users. It has successfully managed to retain its effective character and it is widely regarded as a functional, well-performing community.
However, there are limits to its control and autonomy in important areas that affect its ability to ensure its sustainability. The aim is to build strong, purposeful partnerships and collaborate with other towns in order to build on competitive regional advantages. This has been shown to
KOKSTAD & FRANKLIN INTEGRATED SUSTAINABLE DEVELOPMENT PLAN
FINAL STRATEGY, DEVELOPMENT PLAN AND IMPLEMENTATION PLAN REPORT | NOVEMBER 2012
33
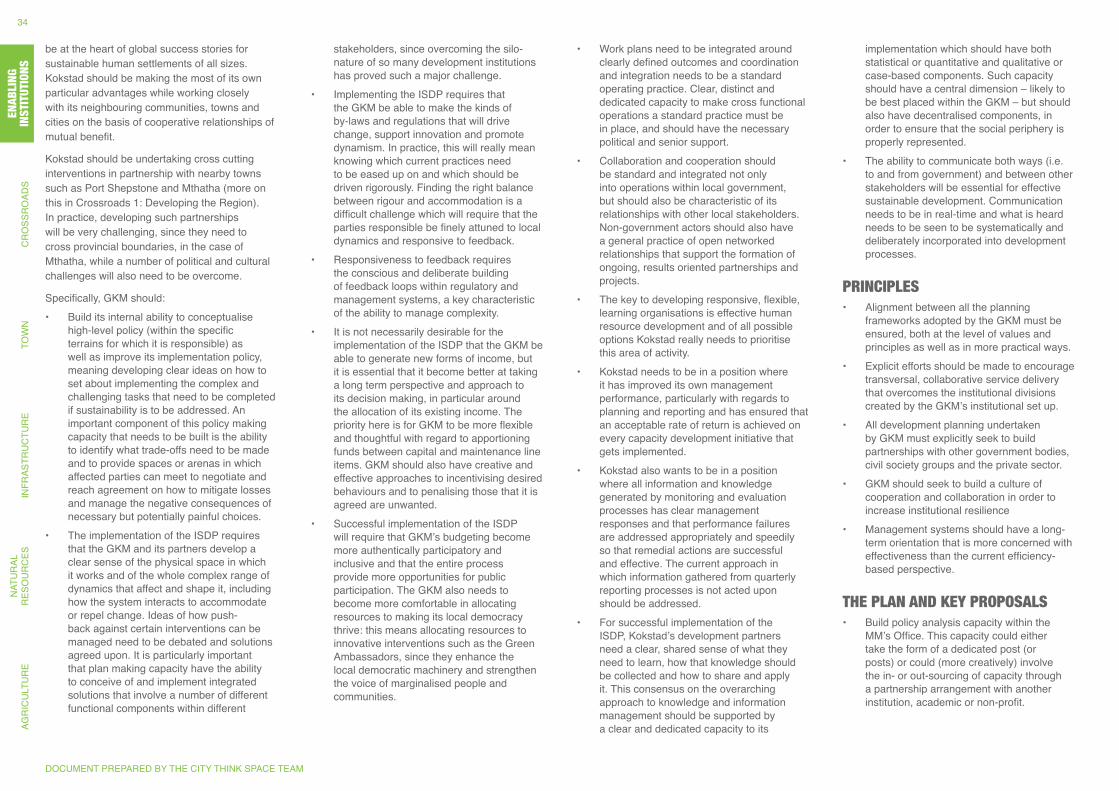
be at the heart of global success stories for sustainable human settlements of all sizes. Kokstad should be making the most of its own particular advantages while working closely with its neighbouring communities, towns and cities on the basis of cooperative relationships of mutual benefit.
Kokstad should be undertaking cross cutting interventions in partnership with nearby towns such as Port Shepstone and Mthatha (more on this in Crossroads 1: Developing the Region). In practice, developing such partnerships will be very challenging, since they need to cross provincial boundaries, in the case of Mthatha, while a number of political and cultural challenges will also need to be overcome.
Specifically, GKM should: • Build its internal ability to conceptualise
high-level policy (within the specific terrains for which it is responsible) as well as improve its implementation policy, meaning developing clear ideas on how to set about implementing the complex and challenging tasks that need to be completed if sustainability is to be addressed. An important component of this policy making capacity that needs to be built is the ability to identify what trade-offs need to be made and to provide spaces or arenas in which affected parties can meet to negotiate and reach agreement on how to mitigate losses and manage the negative consequences of necessary but potentially painful choices.
• The implementation of the ISDP requires that the GKM and its partners develop a clear sense of the physical space in which it works and of the whole complex range of dynamics that affect and shape it, including how the system interacts to accommodate or repel change. Ideas of how push-back against certain interventions can be managed need to be debated and solutions agreed upon. It is particularly important that plan making capacity have the ability to conceive of and implement integrated solutions that involve a number of different functional components within different
stakeholders, since overcoming the silo-nature of so many development institutions has proved such a major challenge.
• Implementing the ISDP requires that the GKM be able to make the kinds of by-laws and regulations that will drive change, support innovation and promote dynamism. In practice, this will really mean knowing which current practices need to be eased up on and which should be driven rigorously. Finding the right balance between rigour and accommodation is a difficult challenge which will require that the parties responsible be finely attuned to local dynamics and responsive to feedback.
• Responsiveness to feedback requires the conscious and deliberate building of feedback loops within regulatory and management systems, a key characteristic of the ability to manage complexity.
• It is not necessarily desirable for the implementation of the ISDP that the GKM be able to generate new forms of income, but it is essential that it become better at taking a long term perspective and approach to its decision making, in particular around the allocation of its existing income. The priority here is for GKM to be more flexible and thoughtful with regard to apportioning funds between capital and maintenance line items. GKM should also have creative and effective approaches to incentivising desired behaviours and to penalising those that it is agreed are unwanted.
• Successful implementation of the ISDP will require that GKM’s budgeting become more authentically participatory and inclusive and that the entire process provide more opportunities for public participation. The GKM also needs to become more comfortable in allocating resources to making its local democracy thrive: this means allocating resources to innovative interventions such as the Green Ambassadors, since they enhance the local democratic machinery and strengthen the voice of marginalised people and communities.
• Work plans need to be integrated around clearly defined outcomes and coordination and integration needs to be a standard operating practice. Clear, distinct and dedicated capacity to make cross functional operations a standard practice must be in place, and should have the necessary political and senior support.
• Collaboration and cooperation should be standard and integrated not only into operations within local government, but should also be characteristic of its relationships with other local stakeholders. Non-government actors should also have a general practice of open networked relationships that support the formation of ongoing, results oriented partnerships and projects.
• The key to developing responsive, flexible, learning organisations is effective human resource development and of all possible options Kokstad really needs to prioritise this area of activity.
• Kokstad needs to be in a position where it has improved its own management performance, particularly with regards to planning and reporting and has ensured that an acceptable rate of return is achieved on every capacity development initiative that gets implemented.
• Kokstad also wants to be in a position where all information and knowledge generated by monitoring and evaluation processes has clear management responses and that performance failures are addressed appropriately and speedily so that remedial actions are successful and effective. The current approach in which information gathered from quarterly reporting processes is not acted upon should be addressed.
• For successful implementation of the ISDP, Kokstad’s development partners need a clear, shared sense of what they need to learn, how that knowledge should be collected and how to share and apply it. This consensus on the overarching approach to knowledge and information management should be supported by a clear and dedicated capacity to its
implementation which should have both statistical or quantitative and qualitative or case-based components. Such capacity should have a central dimension – likely to be best placed within the GKM – but should also have decentralised components, in order to ensure that the social periphery is properly represented.
• The ability to communicate both ways (i.e. to and from government) and between other stakeholders will be essential for effective sustainable development. Communication needs to be in real-time and what is heard needs to be seen to be systematically and deliberately incorporated into development processes.
PRINCIPLES • Alignment between all the planning
frameworks adopted by the GKM must be ensured, both at the level of values and principles as well as in more practical ways.
• Explicit efforts should be made to encourage transversal, collaborative service delivery that overcomes the institutional divisions created by the GKM’s institutional set up.
• All development planning undertaken by GKM must explicitly seek to build partnerships with other government bodies, civil society groups and the private sector.
• GKM should seek to build a culture of cooperation and collaboration in order to increase institutional resilience
• Management systems should have a long-term orientation that is more concerned with effectiveness than the current efficiency-based perspective.
THE PLAN AND KEY PROPOSALS• Build policy analysis capacity within the
MM’s Office. This capacity could either take the form of a dedicated post (or posts) or could (more creatively) involve the in- or out-sourcing of capacity through a partnership arrangement with another institution, academic or non-profit.
DOCUMENT PREPARED BY THE CITY THINK SPACE TEAM
AGR
ICU
LTU
RE
NAT
UR
AL
RES
OU
RC
ESIN
FRAS
TRU
CTU
RE
TOW
NC
RO
SSR
OAD
SEN
ABLI
NG
INST
ITU
TIO
NS
34EN
ABLI
NG
INST
ITUT
IONS
• Enhance and increase the capacity of the Town and Regional Planning component of the GKM and encourage other key stakeholders, particularly the Chamber of Business to commission and fund research and related projects that contribute to improvements in this regard. Include this area of work within the scope of the Policy Analysis component in the MM’s Office proposed above.
• Investigate the possibility of having some policy related work outsourced to local organisations and representative bodes to ensure their voice is also heard and their interests represented.
• A systematic and thorough review of all existing regulations should be commissioned from an independent, unaffiliated specialist and recommendations made on what needs to be added, removed and changed. A long-term agenda in this regard should form part of the IDP and the ISDP.
• GKM should have a public process to assist with the development of its own fiscal and financial model in which the source of resources and the proportion of resources to be allocated to specific issues is clearly stated. The performance of this model should be reviewed and it should be adjusted every five years.
• The GKM should consider the possibility of undertaking a comprehensive change management or transformation programme that has four distinct components:
- Re-engineering of all appropriate products and their underlying business processes
- Re-organisation, involving the reconfiguration of the GKM to meet the revised developmental needs of the Council in order to achieve its IDP and ISDP goals
- Performance management, involving the implementation of a number of interventions that seek to understand the reasons for performance levels and to improve the current situation and
- Culture change, which will involve undertaking research to understand the current culture of the GKM and to identify processes and structures that can assist in making it more developmental, progressive and inclusive. (All four change management components would need to interact with one another for maximum effectiveness and could be an initiative undertaken over a number of years.)
• The creation of a knowledge or information centre that would both facilitate learning and house evidence collected through research, analysis and monitoring and evaluation processes. Such a facility should have both a knowledge generation and a dissemination function, and its communication strategies should be geared towards the provision of feedback loops and ensuring that Voice is provided to sectors that are traditionally marginalised and excluded.
• Capacity to engage with and consult communities needs to be built. This should draw on the Green Ambassador experience and could, for example, involve scaling the programme up so that it better represents the full diversity present in Kokstad. Other sectors of the Kokstad community should also be prevailed upon to find advocacy mechanisms and systems.
KOKSTAD & FRANKLIN INTEGRATED SUSTAINABLE DEVELOPMENT PLAN
FINAL STRATEGY, DEVELOPMENT PLAN AND IMPLEMENTATION PLAN REPORT | NOVEMBER 2012
35
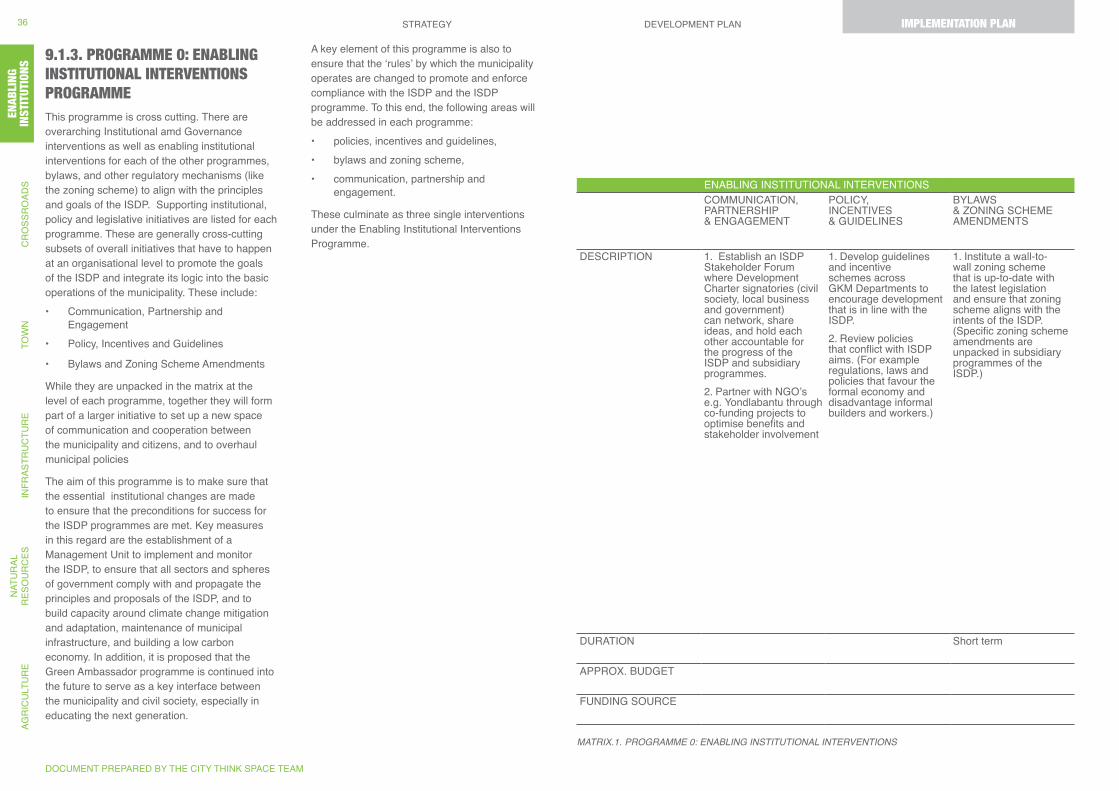
9.1.3. PROGRAMME 0: ENABLING INSTITUTIONAL INTERVENTIONS PROGRAMMEThis programme is cross cutting. There are overarching Institutional amd Governance interventions as well as enabling institutional interventions for each of the other programmes, bylaws, and other regulatory mechanisms (like the zoning scheme) to align with the principles and goals of the ISDP. Supporting institutional, policy and legislative initiatives are listed for each programme. These are generally cross-cutting subsets of overall initiatives that have to happen at an organisational level to promote the goals of the ISDP and integrate its logic into the basic operations of the municipality. These include: • Communication, Partnership and
Engagement• Policy, Incentives and Guidelines
• Bylaws and Zoning Scheme Amendments
While they are unpacked in the matrix at the level of each programme, together they will form part of a larger initiative to set up a new space of communication and cooperation between the municipality and citizens, and to overhaul municipal policies
The aim of this programme is to make sure that the essential institutional changes are made to ensure that the preconditions for success for the ISDP programmes are met. Key measures in this regard are the establishment of a Management Unit to implement and monitor the ISDP, to ensure that all sectors and spheres of government comply with and propagate the principles and proposals of the ISDP, and to build capacity around climate change mitigation and adaptation, maintenance of municipal infrastructure, and building a low carbon economy. In addition, it is proposed that the Green Ambassador programme is continued into the future to serve as a key interface between the municipality and civil society, especially in educating the next generation.
MATRiX.1. PROgRAMME 0: ENABLiNg iNSTiTUTiONAL iNTERVENTiONS
ENABLING INSTITUTIONAL INTERVENTIONSCOMMUNICATION, PARTNERSHIP & ENGAGEMENT
POLICY, INCENTIVES & GUIDELINES
BYLAWS & ZONING SCHEME AMENDMENTS
DESCRIPTION 1. Establish an ISDP Stakeholder Forum where Development Charter signatories (civil society, local business and government) can network, share ideas, and hold each other accountable for the progress of the ISDP and subsidiary programmes.2. Partner with NGO’s e.g. Yondlabantu through co-funding projects to optimise benefits and stakeholder involvement
1. Develop guidelines and incentive schemes across GKM Departments to encourage development that is in line with the ISDP.2. Review policies that conflict with ISDP aims. (For example regulations, laws and policies that favour the formal economy and disadvantage informal builders and workers.)
1. Institute a wall-to-wall zoning scheme that is up-to-date with the latest legislation and ensure that zoning scheme aligns with the intents of the ISDP. (Specific zoning scheme amendments are unpacked in subsidiary programmes of the ISDP.)
DURATION Short term
APPROX. BUDGET
FUNDING SOURCE
A key element of this programme is also to ensure that the ‘rules’ by which the municipality operates are changed to promote and enforce compliance with the ISDP and the ISDP programme. To this end, the following areas will be addressed in each programme:• policies, incentives and guidelines, • bylaws and zoning scheme, • communication, partnership and
engagement.
These culminate as three single interventions under the Enabling Institutional Interventions Programme.
DOCUMENT PREPARED BY THE CITY THINK SPACE TEAM
STRATEGY DEVELOPMENT PLAN IMPLEMENTATION PLANAG
RIC
ULT
UR
EN
ATU
RAL
R
ESO
UR
CES
INFR
ASTR
UC
TUR
ETO
WN
CR
OSS
RO
ADS
ENAB
LIN
GIN
STIT
UTI
ON
S36
ENAB
LING
IN
STIT
UTIO
NSIMPLEMENTATION PLAN
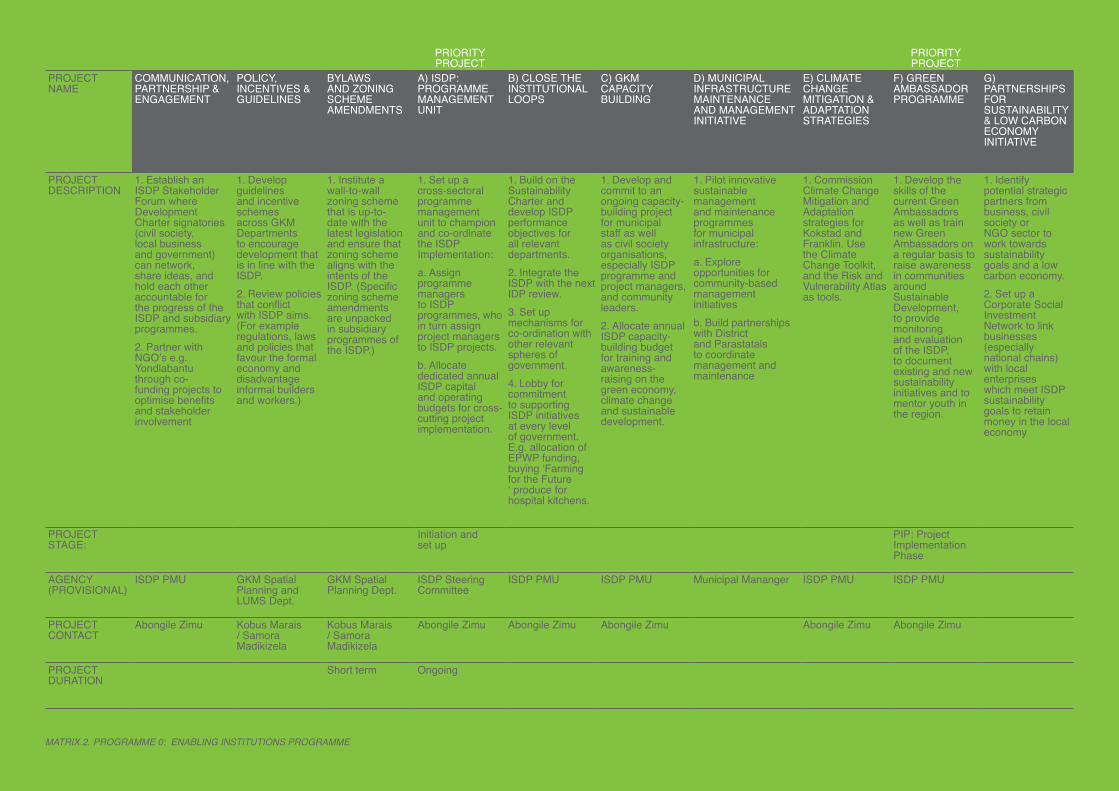
PRIORITY PROJECT
PRIORITY PROJECT
PROJECT NAME
COMMUNICATION, PARTNERSHIP & ENGAGEMENT
POLICY, INCENTIVES & GUIDELINES
BYLAWS AND ZONING SCHEME AMENDMENTS
A) ISDP: PROGRAMME MANAGEMENT UNIT
B) CLOSE THE INSTITUTIONAL LOOPS
C) GKM CAPACITY BUILDING
D) MUNICIPAL INFRASTRUCTURE MAINTENANCE AND MANAGEMENT INITIATIVE
E) CLIMATE CHANGE MITIGATION & ADAPTATION STRATEGIES
F) GREEN AMBASSADOR PROGRAMME
G) PARTNERSHIPS FOR SUSTAINABILITY & LOW CARBON ECONOMY INITIATIVE
PROJECT DESCRIPTION
1. Establish an ISDP Stakeholder Forum where Development Charter signatories (civil society, local business and government) can network, share ideas, and hold each other accountable for the progress of the ISDP and subsidiary programmes. 2. Partner with NGO’s e.g. Yondlabantu through co-funding projects to optimise benefits and stakeholder involvement
1. Develop guidelines and incentive schemes across GKM Departments to encourage development that is in line with the ISDP.2. Review policies that conflict with ISDP aims. (For example regulations, laws and policies that favour the formal economy and disadvantage informal builders and workers.)
1. Institute a wall-to-wall zoning scheme that is up-to-date with the latest legislation and ensure that zoning scheme aligns with the intents of the ISDP. (Specific zoning scheme amendments are unpacked in subsidiary programmes of the ISDP.)
1. Set up a cross-sectoral programme management unit to champion and co-ordinate the ISDP Implementation:a. Assign programme managers to ISDP programmes, who in turn assign project managers to ISDP projects.b. Allocate dedicated annual ISDP capital and operating budgets for cross-cutting project implementation.
1. Build on the Sustainability Charter and develop ISDP performance objectives for all relevant departments. 2. Integrate the ISDP with the next IDP review.3. Set up mechanisms for co-ordination with other relevant spheres of government.4. Lobby for commitment to supporting ISDP initiatives at every level of government. E.g. allocation of EPWP funding, buying ‘Farming for the Future ‘ produce for hospital kitchens.
1. Develop and commit to an ongoing capacity-building project for municipal staff as well as civil society organisations, especially ISDP programme and project managers, and community leaders. 2. Allocate annual ISDP capacity-building budget for training and awareness-raising on the green economy, climate change and sustainable development.
1. Pilot innovative sustainable management and maintenance programmes for municipal infrastructure:a. Explore opportunities for community-based management initiativesb. Build partnerships with District and Parastatals to coordinate management and maintenance
1. Commission Climate Change Mitigation and Adaptation strategies for Kokstad and Franklin. Use the Climate Change Toolkit, and the Risk and Vulnerability Atlas as tools.
1. Develop the skills of the current Green Ambassadors as well as train new Green Ambassadors on a regular basis to raise awareness in communities around Sustainable Development, to provide monitoring and evaluation of the ISDP, to document existing and new sustainability initiatives and to mentor youth in the region.
1. Identify potential strategic partners from business, civil society or NGO sector to work towards sustainability goals and a low carbon economy. 2. Set up a Corporate Social Investment Network to link businesses (especially national chains) with local enterprises which meet ISDP sustainability goals to retain money in the local economy
PROJECT STAGE:
Initiation and set up
PIP: Project Implementation Phase
AGENCY (PROVISIONAL)
ISDP PMU GKM Spatial Planning and LUMS Dept.
GKM Spatial Planning Dept.
ISDP Steering Committee
ISDP PMU ISDP PMU Municipal Mananger ISDP PMU ISDP PMU
PROJECT CONTACT
Abongile Zimu Kobus Marais / Samora Madikizela
Kobus Marais / Samora Madikizela
Abongile Zimu Abongile Zimu Abongile Zimu Abongile Zimu Abongile Zimu
PROJECT DURATION
Short term Ongoing
MATRiX.2. PROgRAMME 0: ENABLiNg iNSTiTUTiONS PROgRAMME
KOKSTAD & FRANKLIN INTEGRATED SUSTAINABLE DEVELOPMENT PLAN
FINAL STRATEGY, DEVELOPMENT PLAN AND IMPLEMENTATION PLAN REPORT | NOVEMBER 2012
37
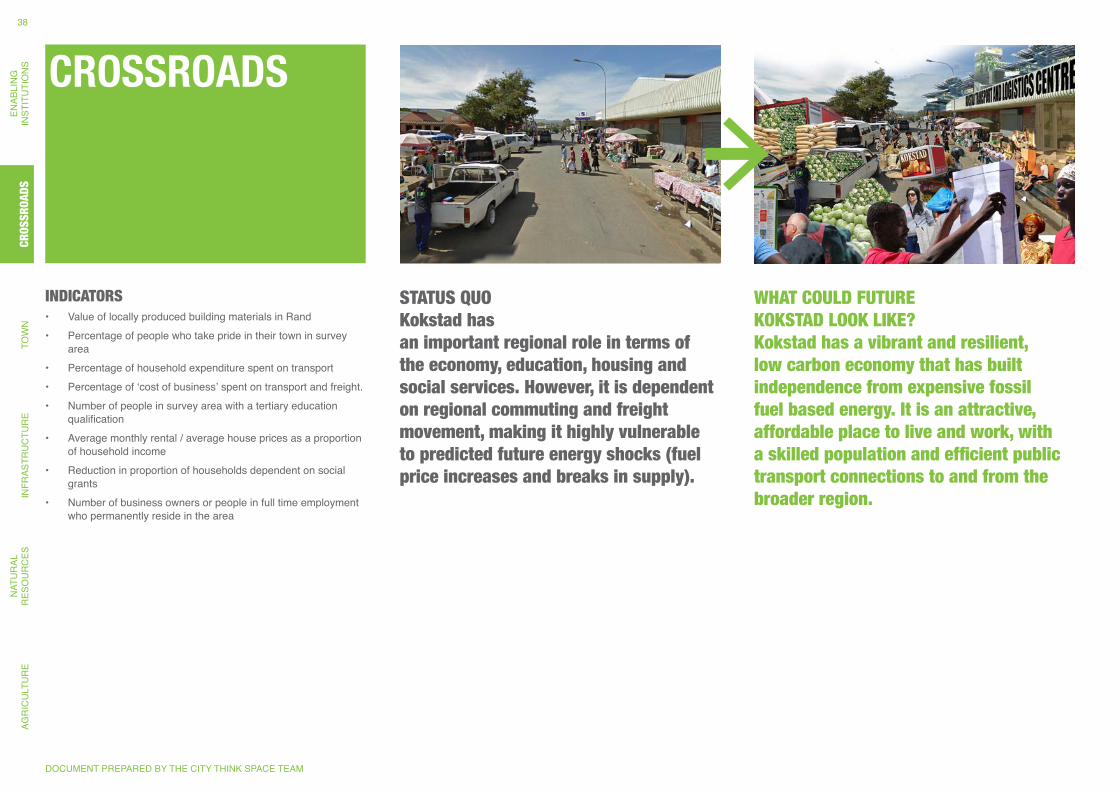
CROSSROADS
STATUS QUO Kokstad has an important regional role in terms of the economy, education, housing and social services. However, it is dependent on regional commuting and freight movement, making it highly vulnerable to predicted future energy shocks (fuel price increases and breaks in supply).
WHAT COULD FUTURE KOKSTAD LOOK LIKE? Kokstad has a vibrant and resilient, low carbon economy that has built independence from expensive fossil fuel based energy. It is an attractive, affordable place to live and work, with a skilled population and efficient public transport connections to and from the broader region.
INDICATORS • Value of locally produced building materials in Rand• Percentage of people who take pride in their town in survey
area• Percentage of household expenditure spent on transport• Percentage of ‘cost of business’ spent on transport and freight.• Number of people in survey area with a tertiary education
qualification• Average monthly rental / average house prices as a proportion
of household income• Reduction in proportion of households dependent on social
grants• Number of business owners or people in full time employment
who permanently reside in the area
DOCUMENT PREPARED BY THE CITY THINK SPACE TEAM
AGR
ICU
LTU
RE
NAT
UR
AL
RES
OU
RC
ESIN
FRAS
TRU
CTU
RE
TOW
NC
RO
SSR
OAD
SEN
ABLI
NG
INST
ITU
TIO
NS
38CR
OSSR
OADS
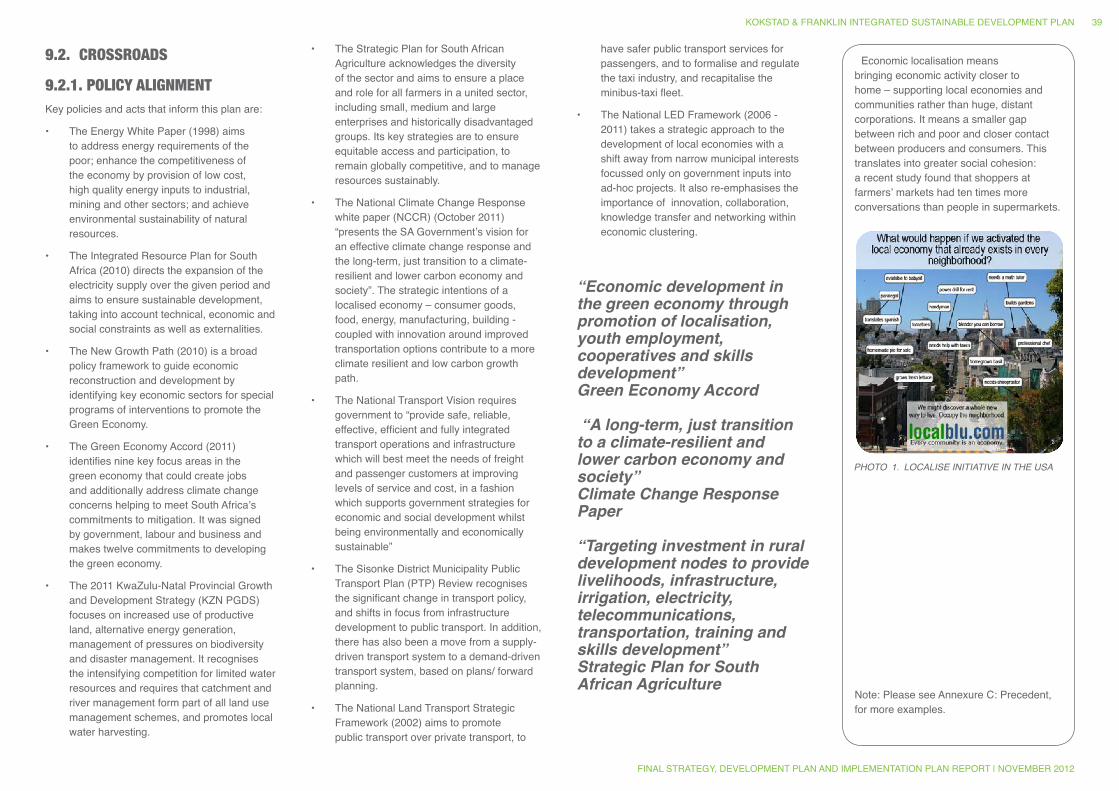
Economic localisation means bringing economic activity closer to home – supporting local economies and communities rather than huge, distant corporations. It means a smaller gap between rich and poor and closer contact between producers and consumers. This translates into greater social cohesion: a recent study found that shoppers at farmers’ markets had ten times more conversations than people in supermarkets.
Note: Please see Annexure C: Precedent, for more examples.
PHOTO 1. LOCALiSE iNiTiATiVE iN THE USA
9.2. CROSSROADS
9.2.1. POLICY ALIGNMENTKey policies and acts that inform this plan are:
• The Energy White Paper (1998) aims to address energy requirements of the poor; enhance the competitiveness of the economy by provision of low cost, high quality energy inputs to industrial, mining and other sectors; and achieve environmental sustainability of natural resources.
• The Integrated Resource Plan for South Africa (2010) directs the expansion of the electricity supply over the given period and aims to ensure sustainable development, taking into account technical, economic and social constraints as well as externalities.
• The New Growth Path (2010) is a broad policy framework to guide economic reconstruction and development by identifying key economic sectors for special programs of interventions to promote the Green Economy.
• The Green Economy Accord (2011) identifies nine key focus areas in the green economy that could create jobs and additionally address climate change concerns helping to meet South Africa’s commitments to mitigation. It was signed by government, labour and business and makes twelve commitments to developing the green economy.
• The 2011 KwaZulu-Natal Provincial Growth and Development Strategy (KZN PGDS) focuses on increased use of productive land, alternative energy generation, management of pressures on biodiversity and disaster management. It recognises the intensifying competition for limited water resources and requires that catchment and river management form part of all land use management schemes, and promotes local water harvesting.
“Economic development in the green economy through promotion of localisation, youth employment, cooperatives and skills development”Green Economy Accord
“A long-term, just transition to a climate-resilient and lower carbon economy and society” Climate Change Response Paper
“Targeting investment in rural development nodes to provide livelihoods, infrastructure, irrigation, electricity, telecommunications, transportation, training and skills development”Strategic Plan for South African Agriculture
• The Strategic Plan for South African Agriculture acknowledges the diversity of the sector and aims to ensure a place and role for all farmers in a united sector, including small, medium and large enterprises and historically disadvantaged groups. Its key strategies are to ensure equitable access and participation, to remain globally competitive, and to manage resources sustainably.
• The National Climate Change Response white paper (NCCR) (October 2011) “presents the SA Government’s vision for an effective climate change response and the long-term, just transition to a climate-resilient and lower carbon economy and society”. The strategic intentions of a localised economy – consumer goods, food, energy, manufacturing, building - coupled with innovation around improved transportation options contribute to a more climate resilient and low carbon growth path.
• The National Transport Vision requires government to “provide safe, reliable, effective, efficient and fully integrated transport operations and infrastructure which will best meet the needs of freight and passenger customers at improving levels of service and cost, in a fashion which supports government strategies for economic and social development whilst being environmentally and economically sustainable”
• The Sisonke District Municipality Public Transport Plan (PTP) Review recognises the significant change in transport policy, and shifts in focus from infrastructure development to public transport. In addition, there has also been a move from a supply-driven transport system to a demand-driven transport system, based on plans/ forward planning.
• The National Land Transport Strategic Framework (2002) aims to promote public transport over private transport, to
have safer public transport services for passengers, and to formalise and regulate the taxi industry, and recapitalise the minibus-taxi fleet.
• The National LED Framework (2006 - 2011) takes a strategic approach to the development of local economies with a shift away from narrow municipal interests focussed only on government inputs into ad-hoc projects. It also re-emphasises the importance of innovation, collaboration, knowledge transfer and networking within economic clustering.
KOKSTAD & FRANKLIN INTEGRATED SUSTAINABLE DEVELOPMENT PLAN
FINAL STRATEGY, DEVELOPMENT PLAN AND IMPLEMENTATION PLAN REPORT | NOVEMBER 2012
39
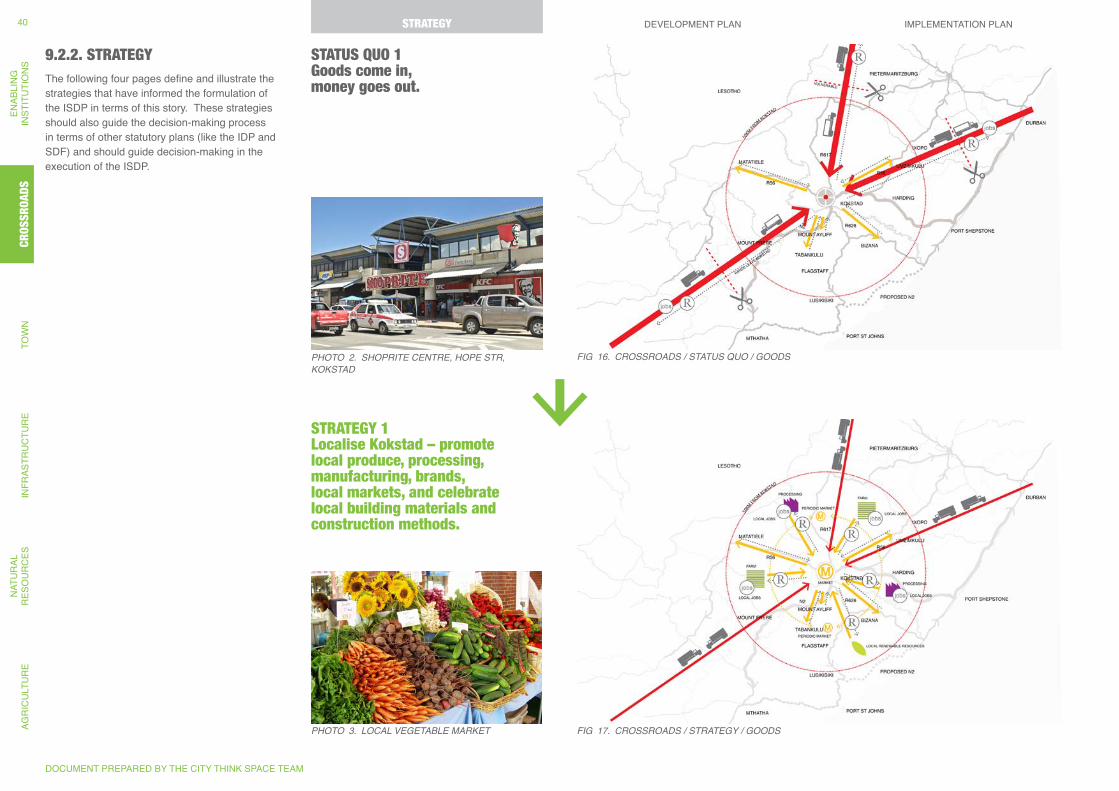
9.2.2. STRATEGYThe following four pages define and illustrate the strategies that have informed the formulation of the ISDP in terms of this story. These strategies should also guide the decision-making process in terms of other statutory plans (like the IDP and SDF) and should guide decision-making in the execution of the ISDP.
STATUS QUO 1 Goods come in, money goes out.
PHOTO 2. SHOPRiTE CENTRE, HOPE STR, KOKSTAD
Fig 16. CROSSROADS / STATUS QUO / gOODS
STRATEGY 1 Localise Kokstad – promote local produce, processing, manufacturing, brands, local markets, and celebrate local building materials and construction methods.
PHOTO 3. LOCAL VEgETABLE MARKET Fig 17. CROSSROADS / STRATEgY / gOODS
DOCUMENT PREPARED BY THE CITY THINK SPACE TEAM
STRATEGY DEVELOPMENT PLAN IMPLEMENTATION PLANAG
RIC
ULT
UR
EN
ATU
RAL
R
ESO
UR
CES
INFR
ASTR
UC
TUR
ETO
WN
CR
OSS
RO
ADS
ENAB
LIN
GIN
STIT
UTI
ON
S40
CROS
SROA
DSSTRATEGY
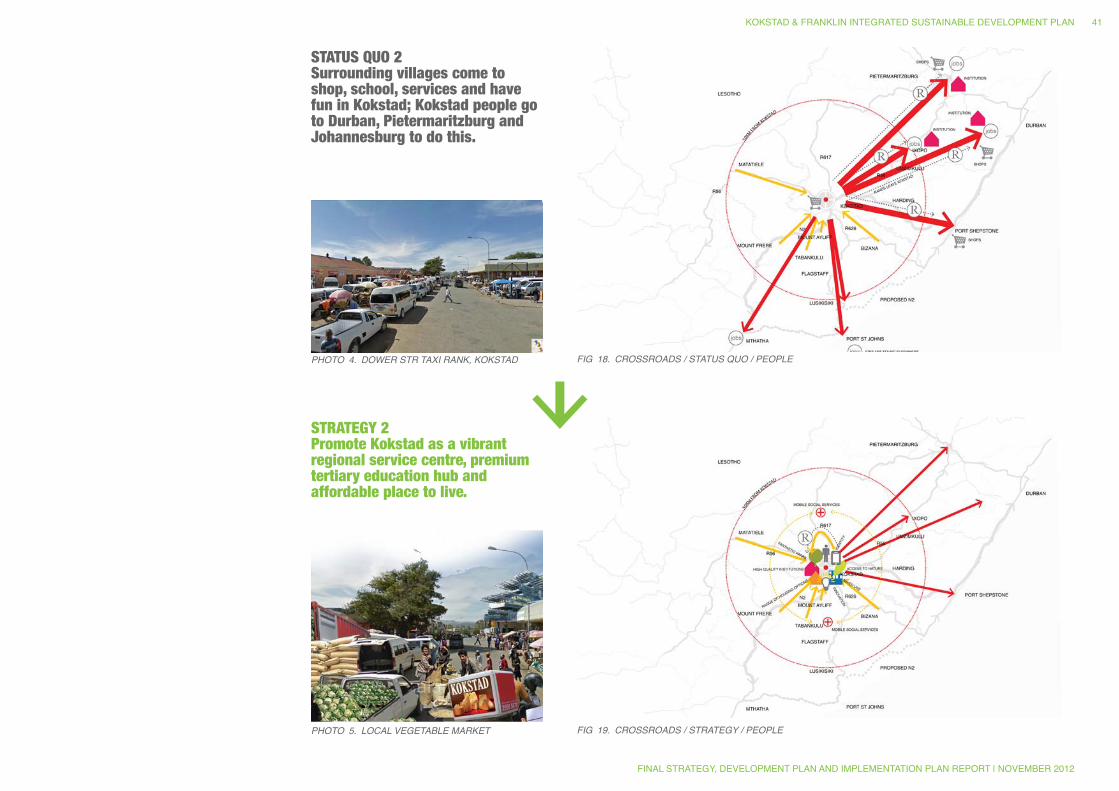
STATUS QUO 2 Surrounding villages come to shop, school, services and have fun in Kokstad; Kokstad people go to Durban, Pietermaritzburg and Johannesburg to do this.
PHOTO 4. DOWER STR TAXi RANK, KOKSTAD Fig 18. CROSSROADS / STATUS QUO / PEOPLE
STRATEGY 2 Promote Kokstad as a vibrant regional service centre, premium tertiary education hub and affordable place to live.
PHOTO 5. LOCAL VEgETABLE MARKET Fig 19. CROSSROADS / STRATEgY / PEOPLE
KOKSTAD & FRANKLIN INTEGRATED SUSTAINABLE DEVELOPMENT PLAN
FINAL STRATEGY, DEVELOPMENT PLAN AND IMPLEMENTATION PLAN REPORT | NOVEMBER 2012
41
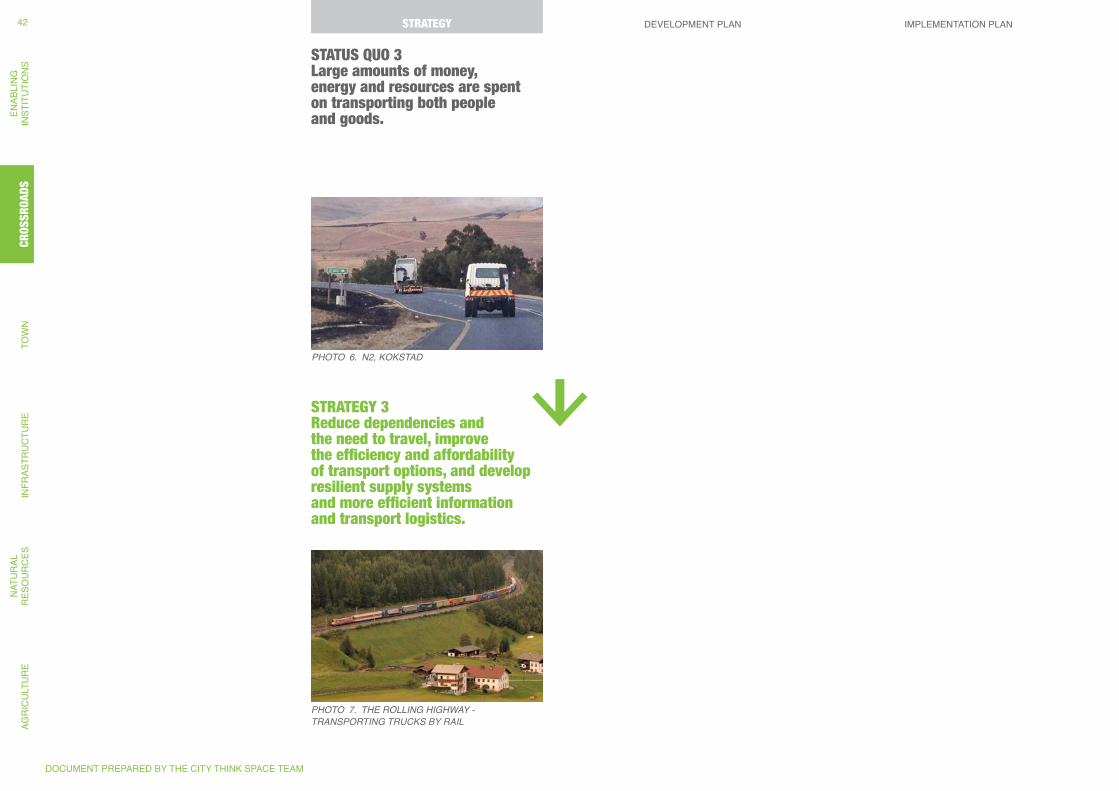
STATUS QUO 3 Large amounts of money, energy and resources are spent on transporting both people and goods.
PHOTO 6. N2, KOKSTAD
STRATEGY 3 Reduce dependencies and the need to travel, improve the efficiency and affordability of transport options, and develop resilient supply systems and more efficient information and transport logistics.
PHOTO 7. THE ROLLiNg HigHWAY - TRANSPORTiNg TRUCKS BY RAiL
DOCUMENT PREPARED BY THE CITY THINK SPACE TEAM
STRATEGY DEVELOPMENT PLAN IMPLEMENTATION PLANAG
RIC
ULT
UR
EN
ATU
RAL
R
ESO
UR
CES
INFR
ASTR
UC
TUR
ETO
WN
CR
OSS
RO
ADS
ENAB
LIN
GIN
STIT
UTI
ON
S42
CROS
SROA
DSSTRATEGY
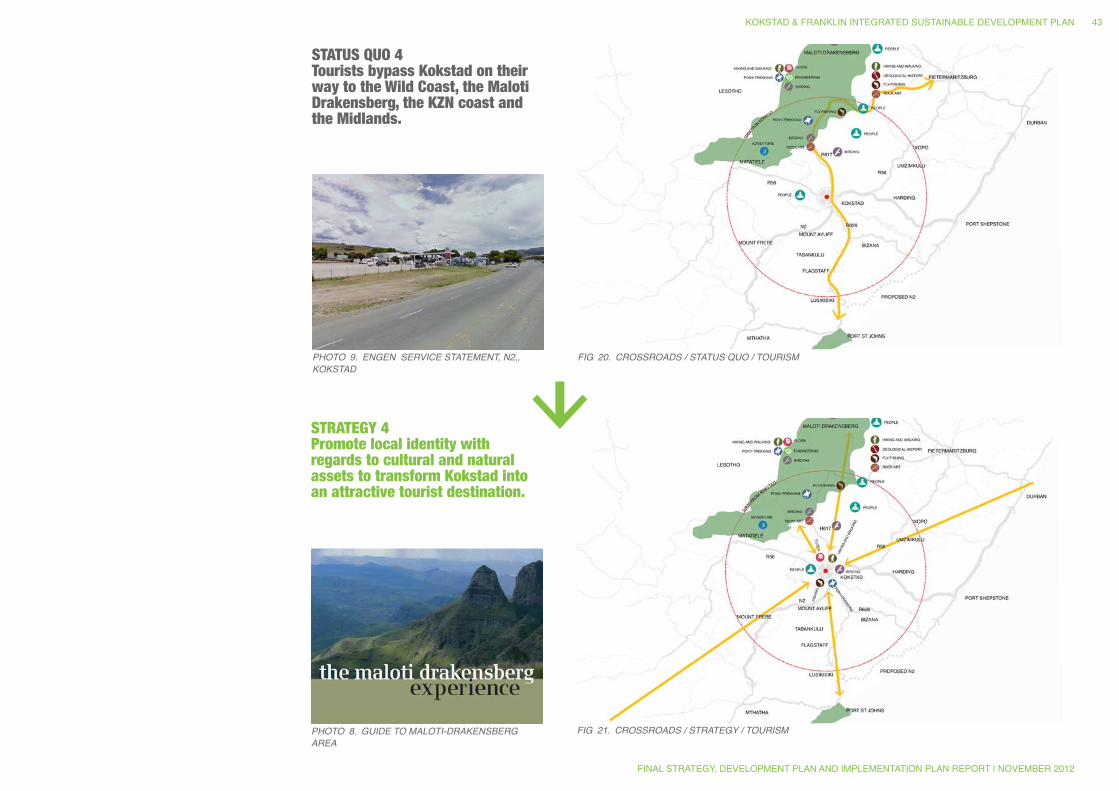
STATUS QUO 4 Tourists bypass Kokstad on their way to the Wild Coast, the Maloti Drakensberg, the KZN coast and the Midlands.
PHOTO 9. ENgEN SERViCE STATEMENT, N2,, KOKSTAD
Fig 20. CROSSROADS / STATUS QUO / TOURiSM
STRATEGY 4 Promote local identity with regards to cultural and natural assets to transform Kokstad into an attractive tourist destination.
PHOTO 8. gUiDE TO MALOTi-DRAKENSBERg AREA
Fig 21. CROSSROADS / STRATEgY / TOURiSM
KOKSTAD & FRANKLIN INTEGRATED SUSTAINABLE DEVELOPMENT PLAN
FINAL STRATEGY, DEVELOPMENT PLAN AND IMPLEMENTATION PLAN REPORT | NOVEMBER 2012
43
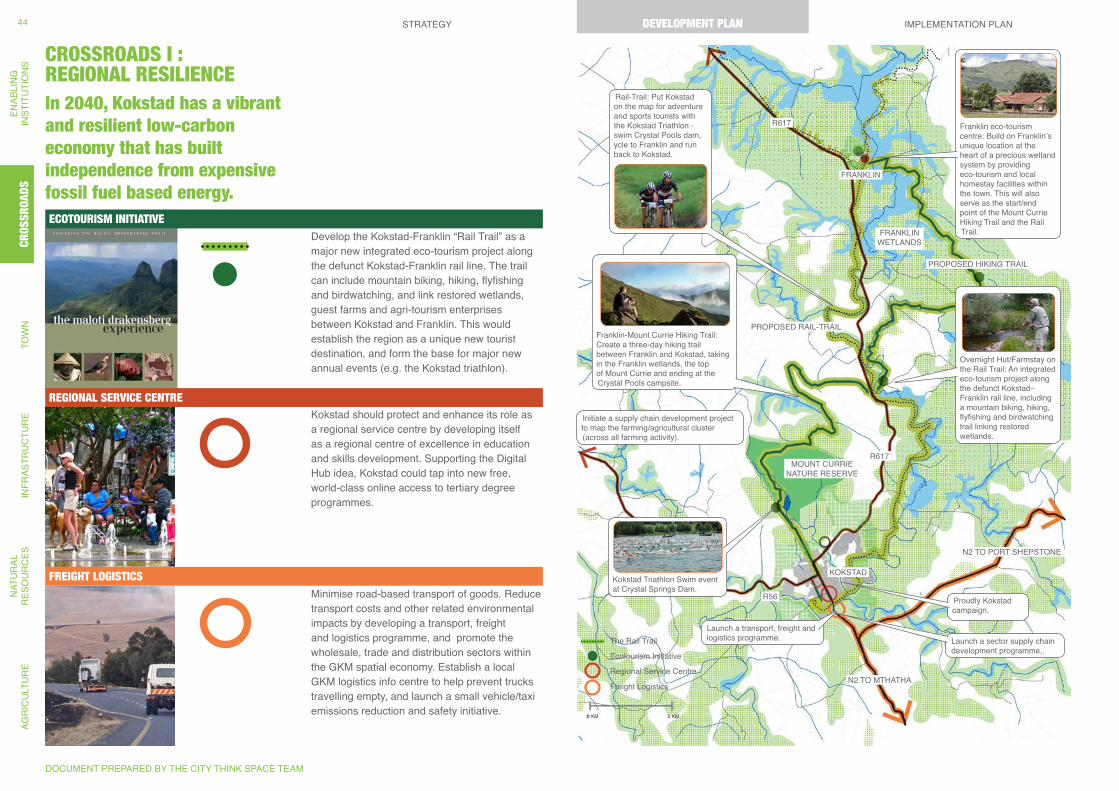
FRANKLIN
FRANKLIN WETLANDS
R617
R617
PROPOSED HIKING TRAIL
PROPOSED RAIL-TRAIL
MOUNT CURRIE NATURE RESERVE
N2 TO PORT SHEPSTONE
N2 TO MTHATHA
R56
KOKSTAD
Regional Service Centre
Freight Logistics
Ecotourism Initiative
The Rail Trail
Initiate a supply chain development project to map the farming/agricultural cluster (across all farming activity).
Proudly Kokstad campaign.
Launch a transport, freight and logistics programme. Launch a sector supply chain
development programme,.
Overnight Hut/Farmstay on the Rail Trail: An integrated eco-tourism project along the defunct Kokstad–Franklin rail line, including a mountain biking, hiking, flyfishing and birdwatching trail linking restored wetlands.
Franklin-Mount Currie Hiking Trail: Create a three-day hiking trail between Franklin and Kokstad, taking in the Franklin wetlands, the top of Mount Currie and ending at the Crystal Pools campsite.
Kokstad Triathlon Swim event at Crystal Springs Dam.
Rail-Trail: Put Kokstad on the map for adventure and sports tourists with the Kokstad Triathlon - swim Crystal Pools dam, ycle to Franklin and run back to Kokstad.
Franklin eco-tourism centre: Build on Franklin’s unique location at the heart of a precious wetland system by providing eco-tourism and local homestay facilities within the town. This will also serve as the start/end point of the Mount Currie Hiking Trail and the Rail Trail.
CROSSROADS I : REGIONAL RESILIENCEIn 2040, Kokstad has a vibrant and resilient low-carbon economy that has built independence from expensive fossil fuel based energy.
Develop the Kokstad-Franklin “Rail Trail” as a major new integrated eco-tourism project along the defunct Kokstad-Franklin rail line. The trail can include mountain biking, hiking, flyfishing and birdwatching, and link restored wetlands, guest farms and agri-tourism enterprises between Kokstad and Franklin. This would establish the region as a unique new tourist destination, and form the base for major new annual events (e.g. the Kokstad triathlon).
Kokstad should protect and enhance its role as a regional service centre by developing itself as a regional centre of excellence in education and skills development. Supporting the Digital Hub idea, Kokstad could tap into new free, world-class online access to tertiary degree programmes.
Minimise road-based transport of goods. Reduce transport costs and other related environmental impacts by developing a transport, freight and logistics programme, and promote the wholesale, trade and distribution sectors within the GKM spatial economy. Establish a local GKM logistics info centre to help prevent trucks travelling empty, and launch a small vehicle/taxi emissions reduction and safety initiative.
FREIGHT LOGISTICS
REGIONAL SERVICE CENTRE
ECOTOURISM INITIATIVE
DOCUMENT PREPARED BY THE CITY THINK SPACE TEAM
STRATEGY DEVELOPMENT PLAN IMPLEMENTATION PLANAG
RIC
ULT
UR
EN
ATU
RAL
R
ESO
UR
CES
INFR
ASTR
UC
TUR
ETO
WN
CR
OSS
RO
ADS
ENAB
LIN
GIN
STIT
UTI
ON
S44 DEVELOPMENT PLAN
CROS
SROA
DS
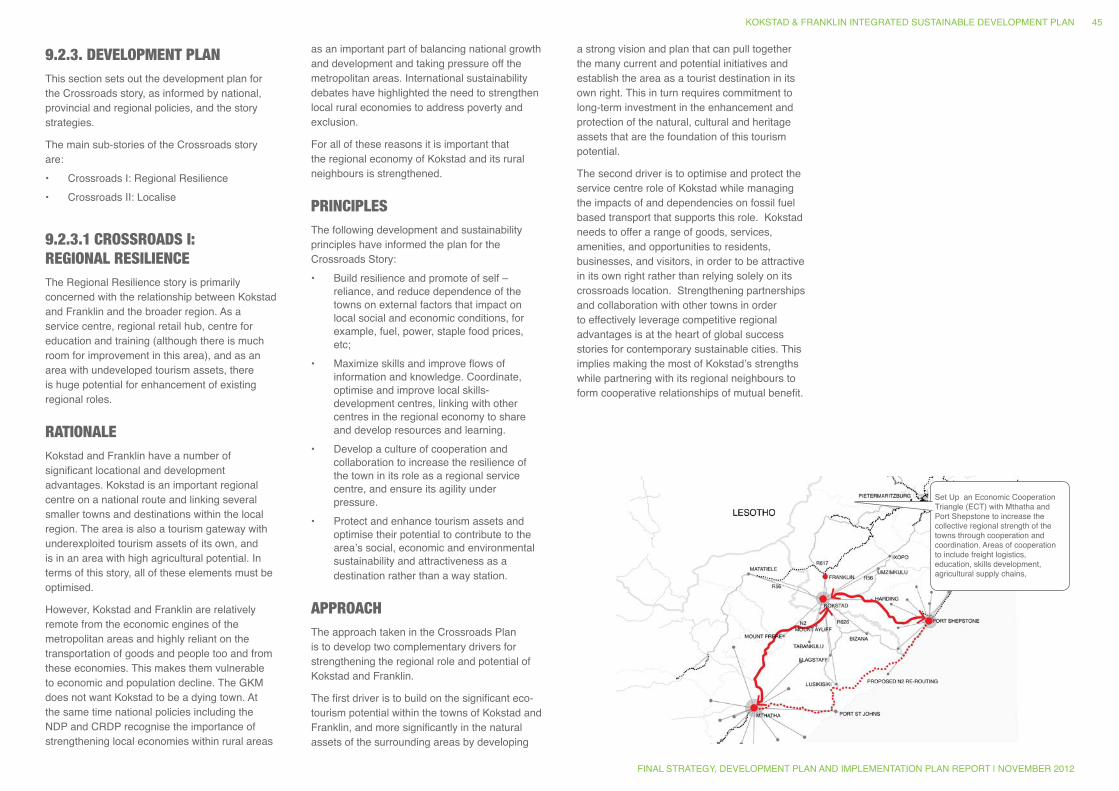
Set Up an Economic Cooperation Triangle (ECT) with Mthatha and Port Shepstone to increase the collective regional strength of the towns through cooperation and coordination. Areas of cooperation to include freight logistics, education, skills development, agricultural supply chains,
9.2.3. DEVELOPMENT PLANThis section sets out the development plan for the Crossroads story, as informed by national, provincial and regional policies, and the story strategies.
The main sub-stories of the Crossroads story are:• Crossroads I: Regional Resilience• Crossroads II: Localise
9.2.3.1 CROSSROADS I: REGIONAL RESILIENCEThe Regional Resilience story is primarily concerned with the relationship between Kokstad and Franklin and the broader region. As a service centre, regional retail hub, centre for education and training (although there is much room for improvement in this area), and as an area with undeveloped tourism assets, there is huge potential for enhancement of existing regional roles.
RATIONALEKokstad and Franklin have a number of significant locational and development advantages. Kokstad is an important regional centre on a national route and linking several smaller towns and destinations within the local region. The area is also a tourism gateway with underexploited tourism assets of its own, and is in an area with high agricultural potential. In terms of this story, all of these elements must be optimised.
However, Kokstad and Franklin are relatively remote from the economic engines of the metropolitan areas and highly reliant on the transportation of goods and people too and from these economies. This makes them vulnerable to economic and population decline. The GKM does not want Kokstad to be a dying town. At the same time national policies including the NDP and CRDP recognise the importance of strengthening local economies within rural areas
as an important part of balancing national growth and development and taking pressure off the metropolitan areas. International sustainability debates have highlighted the need to strengthen local rural economies to address poverty and exclusion.
For all of these reasons it is important that the regional economy of Kokstad and its rural neighbours is strengthened.
PRINCIPLES The following development and sustainability principles have informed the plan for the Crossroads Story:• Build resilience and promote of self –
reliance, and reduce dependence of the towns on external factors that impact on local social and economic conditions, for example, fuel, power, staple food prices, etc;
• Maximize skills and improve flows of information and knowledge. Coordinate, optimise and improve local skills-development centres, linking with other centres in the regional economy to share and develop resources and learning.
• Develop a culture of cooperation and collaboration to increase the resilience of the town in its role as a regional service centre, and ensure its agility under pressure.
• Protect and enhance tourism assets and optimise their potential to contribute to the area’s social, economic and environmental sustainability and attractiveness as a destination rather than a way station.
APPROACHThe approach taken in the Crossroads Plan is to develop two complementary drivers for strengthening the regional role and potential of Kokstad and Franklin.
The first driver is to build on the significant eco-tourism potential within the towns of Kokstad and Franklin, and more significantly in the natural assets of the surrounding areas by developing
a strong vision and plan that can pull together the many current and potential initiatives and establish the area as a tourist destination in its own right. This in turn requires commitment to long-term investment in the enhancement and protection of the natural, cultural and heritage assets that are the foundation of this tourism potential.
The second driver is to optimise and protect the service centre role of Kokstad while managing the impacts of and dependencies on fossil fuel based transport that supports this role. Kokstad needs to offer a range of goods, services, amenities, and opportunities to residents, businesses, and visitors, in order to be attractive in its own right rather than relying solely on its crossroads location. Strengthening partnerships and collaboration with other towns in order to effectively leverage competitive regional advantages is at the heart of global success stories for contemporary sustainable cities. This implies making the most of Kokstad’s strengths while partnering with its regional neighbours to form cooperative relationships of mutual benefit.
KOKSTAD & FRANKLIN INTEGRATED SUSTAINABLE DEVELOPMENT PLAN
FINAL STRATEGY, DEVELOPMENT PLAN AND IMPLEMENTATION PLAN REPORT | NOVEMBER 2012
45
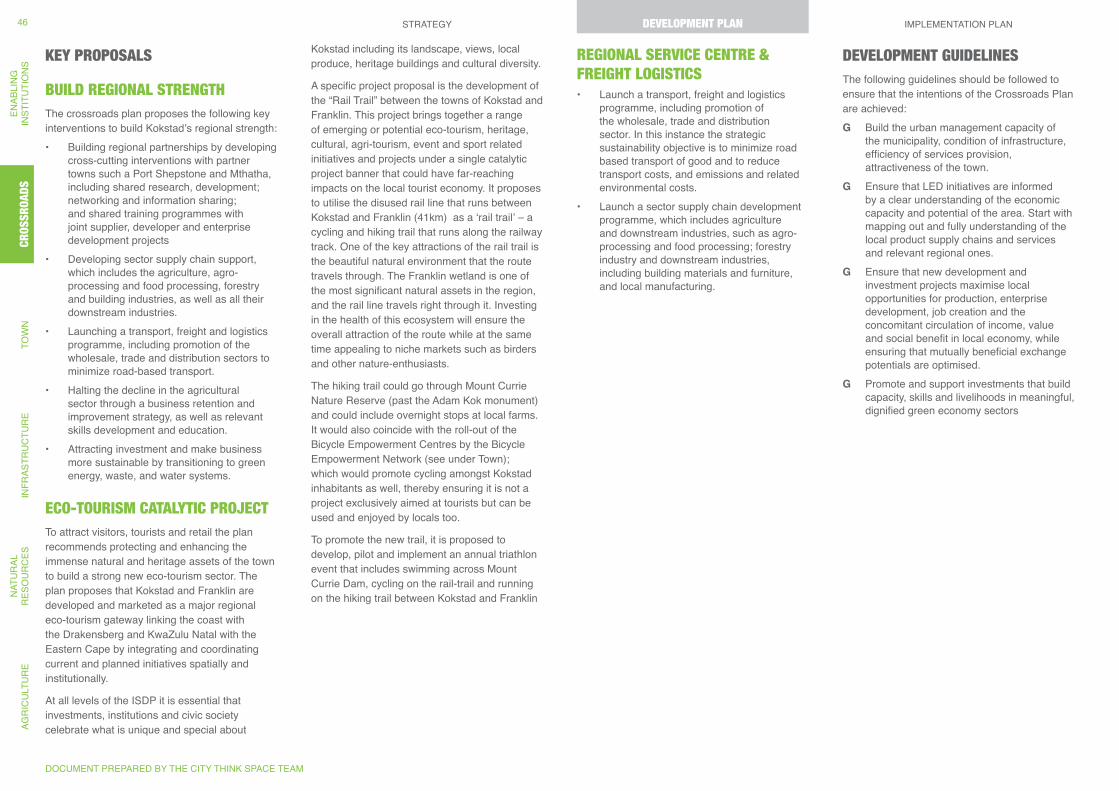
KEY PROPOSALS
BUILD REGIONAL STRENGTHThe crossroads plan proposes the following key interventions to build Kokstad’s regional strength:• Building regional partnerships by developing
cross-cutting interventions with partner towns such a Port Shepstone and Mthatha, including shared research, development; networking and information sharing; and shared training programmes with joint supplier, developer and enterprise development projects
• Developing sector supply chain support, which includes the agriculture, agro-processing and food processing, forestry and building industries, as well as all their downstream industries.
• Launching a transport, freight and logistics programme, including promotion of the wholesale, trade and distribution sectors to minimize road-based transport.
• Halting the decline in the agricultural sector through a business retention and improvement strategy, as well as relevant skills development and education.
• Attracting investment and make business more sustainable by transitioning to green energy, waste, and water systems.
ECO-TOURISM CATALYTIC PROJECTTo attract visitors, tourists and retail the plan recommends protecting and enhancing the immense natural and heritage assets of the town to build a strong new eco-tourism sector. The plan proposes that Kokstad and Franklin are developed and marketed as a major regional eco-tourism gateway linking the coast with the Drakensberg and KwaZulu Natal with the Eastern Cape by integrating and coordinating current and planned initiatives spatially and institutionally.
At all levels of the ISDP it is essential that investments, institutions and civic society celebrate what is unique and special about
Kokstad including its landscape, views, local produce, heritage buildings and cultural diversity.
A specific project proposal is the development of the “Rail Trail” between the towns of Kokstad and Franklin. This project brings together a range of emerging or potential eco-tourism, heritage, cultural, agri-tourism, event and sport related initiatives and projects under a single catalytic project banner that could have far-reaching impacts on the local tourist economy. It proposes to utilise the disused rail line that runs between Kokstad and Franklin (41km) as a ‘rail trail’ – a cycling and hiking trail that runs along the railway track. One of the key attractions of the rail trail is the beautiful natural environment that the route travels through. The Franklin wetland is one of the most significant natural assets in the region, and the rail line travels right through it. Investing in the health of this ecosystem will ensure the overall attraction of the route while at the same time appealing to niche markets such as birders and other nature-enthusiasts.
The hiking trail could go through Mount Currie Nature Reserve (past the Adam Kok monument) and could include overnight stops at local farms. It would also coincide with the roll-out of the Bicycle Empowerment Centres by the Bicycle Empowerment Network (see under Town); which would promote cycling amongst Kokstad inhabitants as well, thereby ensuring it is not a project exclusively aimed at tourists but can be used and enjoyed by locals too.
To promote the new trail, it is proposed to develop, pilot and implement an annual triathlon event that includes swimming across Mount Currie Dam, cycling on the rail-trail and running on the hiking trail between Kokstad and Franklin
REGIONAL SERVICE CENTRE & FREIGHT LOGISTICS• Launch a transport, freight and logistics
programme, including promotion of the wholesale, trade and distribution sector. In this instance the strategic sustainability objective is to minimize road based transport of good and to reduce transport costs, and emissions and related environmental costs.
• Launch a sector supply chain development programme, which includes agriculture and downstream industries, such as agro-processing and food processing; forestry industry and downstream industries, including building materials and furniture, and local manufacturing.
DEVELOPMENT GUIDELINESThe following guidelines should be followed to ensure that the intentions of the Crossroads Plan are achieved:
G Build the urban management capacity of the municipality, condition of infrastructure, efficiency of services provision, attractiveness of the town.
G Ensure that LED initiatives are informed by a clear understanding of the economic capacity and potential of the area. Start with mapping out and fully understanding of the local product supply chains and services and relevant regional ones.
G Ensure that new development and investment projects maximise local opportunities for production, enterprise development, job creation and the concomitant circulation of income, value and social benefit in local economy, while ensuring that mutually beneficial exchange potentials are optimised.
G Promote and support investments that build capacity, skills and livelihoods in meaningful, dignified green economy sectors
DOCUMENT PREPARED BY THE CITY THINK SPACE TEAM
STRATEGY DEVELOPMENT PLAN IMPLEMENTATION PLANAG
RIC
ULT
UR
EN
ATU
RAL
R
ESO
UR
CES
INFR
ASTR
UC
TUR
ETO
WN
CR
OSS
RO
ADS
ENAB
LIN
GIN
STIT
UTI
ON
S46 DEVELOPMENT PLAN
CROS
SROA
DS

KOKSTAD & FRANKLIN INTEGRATED SUSTAINABLE DEVELOPMENT PLAN
FINAL STRATEGY, DEVELOPMENT PLAN AND IMPLEMENTATION PLAN REPORT | NOVEMBER 2012
47
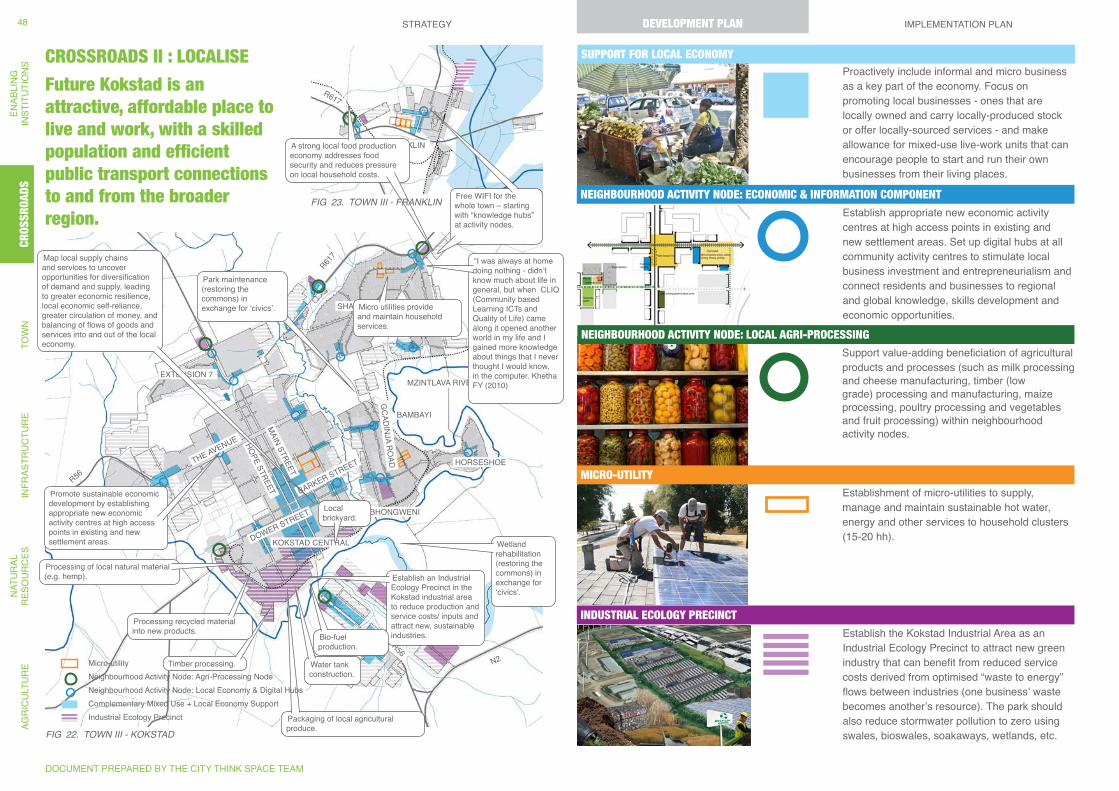
KOKSTAD CENTRAL
THE AVENUE
MAIN STREET
GCADINJA RO
AD
BARKER STREET
HOPE STREET
DOWER STREET
SHAYAMOYA
EXTENSION 7
BAMBAYI
HORSESHOE
BHONGWENI
R56
R617
R617
R56N2
MZINTLAVA RIVER
FRANKLIN
Establish an Industrial Ecology Precinct in the Kokstad industrial area to reduce production and service costs/ inputs and attract new, sustainable industries.
Wetland rehabilitation (restoring the commons) in exchange for ‘civics’.
A strong local food production economy addresses food security and reduces pressure on local household costs.
Map local supply chains and services to uncover opportunities for diversification of demand and supply, leading to greater economic resilience, local economic self-reliance, greater circulation of money, and balancing of flows of goods and services into and out of the local economy.
Free WIFI for the whole town – starting with “knowledge hubs” at activity nodes.
Micro utilities provide and maintain household services.
“I was always at home doing nothing - didn’t know much about life in general, but when CLIQ (Community based Learning ICTs and Quality of Life) came along it opened another world in my life and I gained more knowledge about things that I never thought I would know, in the computer. Khetha FY (2010)
Timber processing.
Local brickyard.
Processing recycled material into new products.
Packaging of local agricultural produce.
Water tank construction.
Bio-fuel production.
Processing of local natural material (e.g. hemp).
Park maintenance (restoring the commons) in exchange for ‘civics’.
Neighbourhood Activity Node: Agri-Processing NodeMicro-utility
Neighbourhood Activity Node: Local Economy & Digital HubsComplementary Mixed Use + Local Economy SupportIndustrial Ecology Precinct
Promote sustainable economic development by establishing appropriate new economic activity centres at high access points in existing and new settlement areas.
Fig 22. TOWN iii - KOKSTAD
CROSSROADS II : LOCALISE
Future Kokstad is an attractive, affordable place to live and work, with a skilled population and efficient public transport connections to and from the broader region. Establish appropriate new economic activity
centres at high access points in existing and new settlement areas. Set up digital hubs at all community activity centres to stimulate local business investment and entrepreneurialism and connect residents and businesses to regional and global knowledge, skills development and economic opportunities.
Support value-adding beneficiation of agricultural products and processes (such as milk processing and cheese manufacturing, timber (low grade) processing and manufacturing, maize processing, poultry processing and vegetables and fruit processing) within neighbourhood activity nodes.
Establishment of micro-utilities to supply, manage and maintain sustainable hot water, energy and other services to household clusters (15-20 hh).
Establish the Kokstad Industrial Area as an Industrial Ecology Precinct to attract new green industry that can benefit from reduced service costs derived from optimised “waste to energy” flows between industries (one business’ waste becomes another’s resource). The park should also reduce stormwater pollution to zero using swales, bioswales, soakaways, wetlands, etc.
INDUSTRIAL ECOLOGY PRECINCT
NEIGHBOURHOOD ACTIVITY NODE: LOCAL AGRI-PROCESSING
MICRO-UTILITY
NEIGHBOURHOOD ACTIVITY NODEFig 23. TOWN iii - FRANKLiN
Proactively include informal and micro business as a key part of the economy. Focus on promoting local businesses - ones that are locally owned and carry locally-produced stock or offer locally-sourced services - and make allowance for mixed-use live-work units that can encourage people to start and run their own businesses from their living places.
SUPPORT FOR LOCAL ECONOMY
NEIGHBOURHOOD ACTIVITY NODE: ECONOMIC & INFORMATION COMPONENT
DOCUMENT PREPARED BY THE CITY THINK SPACE TEAM
STRATEGY DEVELOPMENT PLAN IMPLEMENTATION PLANAG
RIC
ULT
UR
EN
ATU
RAL
R
ESO
UR
CES
INFR
ASTR
UC
TUR
ETO
WN
CR
OSS
RO
ADS
ENAB
LIN
GIN
STIT
UTI
ON
S48 DEVELOPMENT PLAN
CROS
SROA
DS
9.2.3.2 CROSSROADS II: LOCALISEThe Localise Crossroads story is about building resilience from within, and includes developing a robust local economy, civic pride, and practices that optimise the value of local resources in a carefully managed way. It focuses on local economic, social and environmental initiatives that have the potential to create meaningful livelihoods, provide entertainment and activities for the youth of Kokstad and Franklin and attract and retain investment and businesses, especially those related to the green economy. These include significant spatial, including approaches to the spatial structure, land use management and public investment in facilities, space and infrastructure. The proposals contained in the stories that follow have all been informed by the aims of this story so these are not repeated here.
This story will deal with some of the spatial issues that are unique to the Crossroads story but will also touch on associated institutional and sector aspects.
RATIONALEThe challenge is to make Kokstad a viable and attractive place for people to live and work in the long term, reversing the trend of skills and youth leaving if they have the opportunity. Sustainable growth of the population and the local economy, within the limits of the local resource base, is important for the long-term sustainability of the town. There are many ways in which Kokstad and Franklin can innovate to improve and create new local opportunities that also improve the sustainability of the town. Localising is key to building a green economy, the construction, agricultural and retail sectors all provide many obvious opportunities to do so.
PRINCIPLES • Promote local economies to keep money,
skills and goods circulating in the local economy
• Promote green technologies, especially those that build a local skills and manufacturing base
• Promote eco-efficiency, creating more value with less impact to reduce the consumption of resources, reduce environmental costs of doing business and increase service value
• Improve the character and quality of the towns to build citizen pride and investor confidence
• Cascading resource use• Build resilience by promoting
decentralization and semi-decentralisation of economies, technologies and systems and
• Increase service value taking into account user and community needs and providing more appropriate solutions (that often cost less and have greater benefits, such as using wetlands instead of concrete channels to deal with stormwater and at the same time creating a great recreational amenity)
• Promote resource efficiency through green building and sustainable infrastructure options including passive design
• Build a circular economy through food infrastructure that closes waste and nutrient cycles promoting local food production and consumption
APPROACHThe plan is built around the primary strategies of localisation, intensification and diversification. It proposes that the economy is developed to be locally appropriate and responsive, to use resources efficiently and effectively; to conserve and replenish the natural environment; to implement sustainable procurement; and to utilise locally sourced materials and skills.
The Crossroads Local Economy story is based on a “whole systems thinking” approach to sustainably development, where “the interconnections between systems are actively considered, and solutions are sought that address multiple problems at the same time” While this is the ethos of the entire ISDP, it
is particularly relevant here. This suggests reconfiguring Kokstad and Franklin to operate as integrated economic, social and environmental systems and to ensure that new development and investment is thought of as integrated “eco-urbansim” rather than a series of unrelated parts.
With respect to the economy a whole system thinking approach needs to understand local supply chain and services as these will reveal opportunities for diversification of demand and supply which could underpin greater economic resilience, local economic self-reliance, greater circulation of money, and balancing of flows of goods and services into and out of the local economy. Diversification of demand is a function of more people with buying power in the local economy and an increase in demand in a wider range of products services. It is also related to an increase in the variety of suppliers of good and services. The ideas presented in the plan for crossroads are intended to build on this thinking but further detailed analysis of the supply chains and demand should inform the next LED strategy.
KEY PROPOSALS
ENSURE THAT THE SPATIAL STRUCTURE OF THE TOWN ENABLES SUSTAINABLE LOCAL ECONOMIC DEVELOPMENT AND LIVELIHOOD OPPORTUNITIES• Promote sustainable local economic
development by establishing appropriate new economic activity centres at high access points in existing and new settlement areas. This is more sustainable than malls, especially out-of-town malls as these optimize existing infrastructure.
• Proactively include informal and micro business as a key part of the economy. Survivalist businesses are often marginal and vulnerable, and need support, especially given their significant role in reducing poverty and dependence on grants. Equally, these businesses have
significant potential to build the economy and many home based, micro and informal businesses are the foundation of local entrepreneurial development.
DEVELOP AN INDUSTRIAL ECOLOGY PARK• Facilitate green industry through initiating
and supporting an industrial ecology approach and precinct; a national exemplar of a zero waste, resource efficient “industrial ecology”, where one industry’s waste becomes another’s resource.
• Do a materials flows audit to see how different industries’ outputs and inputs can be aligned.
PROMOTE LOCAL ECONOMIES• Promote business and community
transactions that keep money, skills and goods in the local economy
• Build a strong local food production economy to address food security, to reduce pressure on local household costs (food currently accounts for 26% of household expenditure), and to boost the local economy through developing the food sector.
• Map local supply chain and services within the local economy to identify opportunities for diversification of demand and supply and use this understanding to develop new LED strategies and projects that build the local economy
• Introduce a local currency (see ‘civics’ precedent) and use to support local job creation linked to urban management such as open space maintenance, wetland rehabilitation, street cleansing etc
• Establishment a micro-utilities enterprise to supply, manage and maintain sustainable hot water, energy, waste and stormwater management to household clusters (15-20 households). This is a private business promotion with local community micro-enterprises; local established contractors, plumbers and electricians, and suppliers of technology, finance and management
KOKSTAD & FRANKLIN INTEGRATED SUSTAINABLE DEVELOPMENT PLAN
FINAL STRATEGY, DEVELOPMENT PLAN AND IMPLEMENTATION PLAN REPORT | NOVEMBER 2012
49
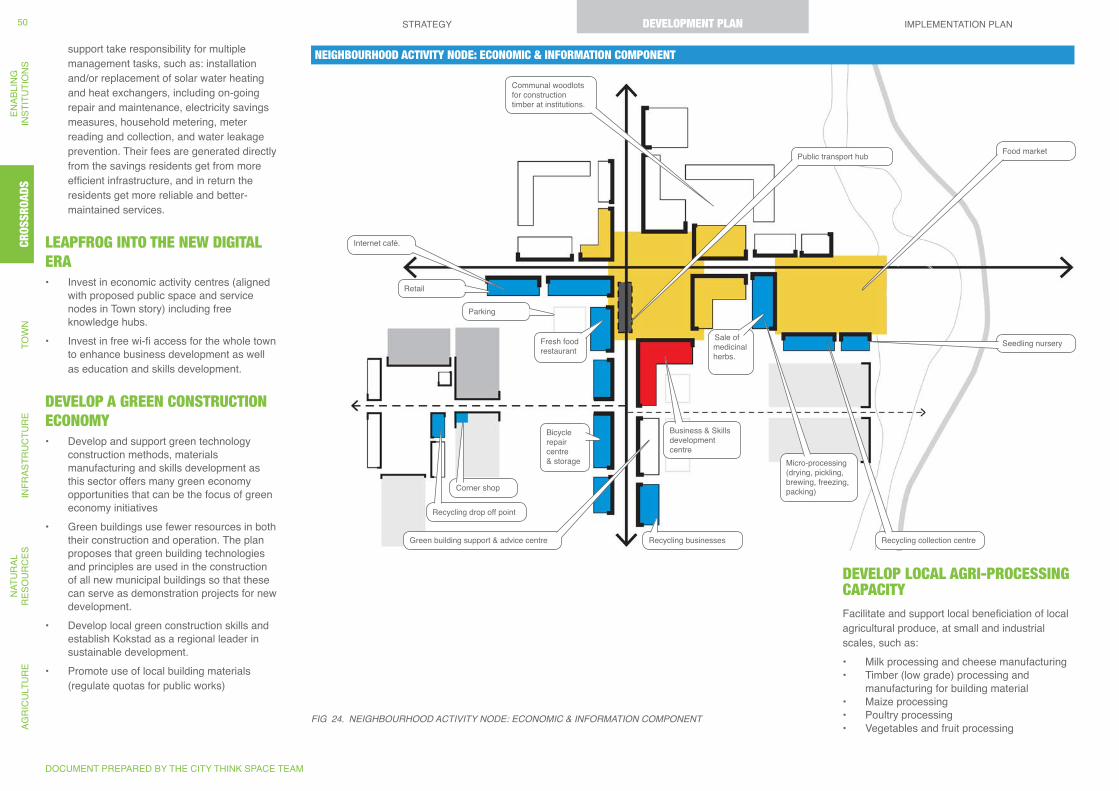
Parking
Retail
Sale of medicinal herbs.
Corner shop
Bicycle repair centre & storage
Fresh food restaurant
Micro-processing (drying, pickling, brewing, freezing, packing)
Business & Skills development centre
Green building support & advice centre Recycling collection centre
Recycling drop off point
Recycling businesses
Food marketPublic transport hub
Internet café.
Seedling nursery
Communal woodlots for construction timber at institutions.
support take responsibility for multiple management tasks, such as: installation and/or replacement of solar water heating and heat exchangers, including on-going repair and maintenance, electricity savings measures, household metering, meter reading and collection, and water leakage prevention. Their fees are generated directly from the savings residents get from more efficient infrastructure, and in return the residents get more reliable and better-maintained services.
LEAPFROG INTO THE NEW DIGITAL ERA• Invest in economic activity centres (aligned
with proposed public space and service nodes in Town story) including free knowledge hubs.
• Invest in free wi-fi access for the whole town to enhance business development as well as education and skills development.
DEVELOP A GREEN CONSTRUCTION ECONOMY• Develop and support green technology
construction methods, materials manufacturing and skills development as this sector offers many green economy opportunities that can be the focus of green economy initiatives
• Green buildings use fewer resources in both their construction and operation. The plan proposes that green building technologies and principles are used in the construction of all new municipal buildings so that these can serve as demonstration projects for new development.
• Develop local green construction skills and establish Kokstad as a regional leader in sustainable development.
• Promote use of local building materials (regulate quotas for public works)
DEVELOP LOCAL AGRI-PROCESSING CAPACITYFacilitate and support local beneficiation of local agricultural produce, at small and industrial scales, such as: • Milk processing and cheese manufacturing• Timber (low grade) processing and
manufacturing for building material• Maize processing• Poultry processing• Vegetables and fruit processing
NEIGHBOURHOOD ACTIVITY NODE: ECONOMIC & INFORMATION COMPONENT
Fig 24. NEigHBOURHOOD ACTiViTY NODE: ECONOMiC & iNFORMATiON COMPONENT
DOCUMENT PREPARED BY THE CITY THINK SPACE TEAM
STRATEGY DEVELOPMENT PLAN IMPLEMENTATION PLANAG
RIC
ULT
UR
EN
ATU
RAL
R
ESO
UR
CES
INFR
ASTR
UC
TUR
ETO
WN
CR
OSS
RO
ADS
ENAB
LIN
GIN
STIT
UTI
ON
S50 DEVELOPMENT PLAN
CROS
SROA
DS
DEVELOPMENT & URBAN DESIGN GUIDELINES
G Encourage investment in, and upgrade of, the existing town rather than support or allow new developments on the fringes that potentially undermine and discourage this through spreading resources too thinly as well as entrenching socio-economic segregation.
G Where such new developments have been approved, mitigation measures, and off-sets, to protect the existing town must be considered. New greenfield developments must comply with green building principles and must be as self-reliant as possible in terms of infrastructure requirements.
G Assess interventions and investments for their potential to facilitate local business opportunities, including home-based, informal, micro businesses and formal large-scale businesses, that use local resources and local labour, and facilitating growing local markets, should drive interventions. Investigate carefully designed incentives programmes.
GREEN BUILDING GUIDELINESRECOMMENDATIONS FOR ENERGY EFFICIENCY
G Install solar hot-water systems or heat pumps.
G Install properly insulated ceilings. G Place and size windows to make optimal
use of natural light, winter heating and ventilation without creating draughts, gaining too much heat in summer or losing heat in winter.
G Avoid the use of air conditioning, or at least ensure that the correct size air conditioner is installed and that use of the unit is minimised.
G Ensure that the building is constructed so as to be tightly sealed to prevent unwanted air flows. Doors and windows must be appropriately sized and fitted with seals.
G Energy-efficient electrical installations should be used.
G Ensure that artificial lighting is designed so that light is focused where necessary, such as on areas where tasks are being performed, with more ambient light elsewhere. Avoid the use of ‘up-lighting’ to reduce light pollution.
G Ensure that energy-efficient light bulbs, such as CFLs or LEDs, are used where possible.
G Consider the installation of independent renewable electricity generators, such as PV panels or wind turbines.
G Further reduce the electrical energy used to heat water by installing geyser blankets, pipe insulation and a geyser timer.
G Install low-flow shower heads. G Recommendations for water efficiency: G Ensure that only water-efficient devices,
such as low-flow taps, low-flow shower heads, washing machines and dishwashers, are used.
G Ensure that all toilets are low-volume (9,5 litres or less), with dual-flush or multi-flush systems.
G Ensure that public buildings and outside taps and showers are fitted with metering-tap buttons, which have set timers to prevent taps from being left on or dripping.
G Design the layout of the plumbing system so as to avoid long pipe runs between the geyser and supply points.
G Reduce hard surfacing to encourage rainwater to seep back into the ground rather than being carried away into the sea by piped drainage systems.
G Design paved areas so that water run-off is slowed down, and use soak-aways or “rain gardens” and permeable paving wherever possible to allow water to filter into the ground.
G Ensure that the optimum pipe size and water pressure are used. A pressure-reducing valve can be installed at a point nearest to where the supply enters the building, to ensure that all water supplies in the building are balanced.
G Install systems for rainwater harvesting and the reuse of grey water where appropriate.
However, ensure that the local ecological system is not polluted and that it is managed correctly.
G Make use of indigenous planting and efficient irrigation methods, such as drip irrigation.
G Use a pool blanket to reduce water loss through evaporation.
G In consultation with the local authority, introduce waterless sanitation and alternative grey-water systems that clean black and grey water, while providing useful by-products such as fertiliser and biogas.
RECOMMENDATIONS FOR WASTE REDUCTION
G Aim for and promote zero waste in the planning, operation, management, maintenance and demolition of a building. Zero waste emulates the closed-loop processes found in nature, taking a ‘cradle-to-cradle’ approach to designing products and buildings.
G Incorporate waste avoidance into the process at the design phase already, by specifying products and materials that have less wasteful production processes and do not create wasteful emissions during construction, maintenance and demolition of a building.
G Ensure that all buildings that are to be demolished compile a demolition plan, outlining how the building material and rubble will be used to avoid waste sent to landfill.
G If waste is created, consider how this can firstly be reused and then recycled to recover the value invested in these materials, rather than losing this value when the resource is simply dumped in a landfill or incinerated.
G Provide waste compactors in buildings where large amounts of waste are created, to save landfill air space and the transport costs associated with waste removal.
G Facilitate the separation of waste at source for composting, reuse and recycling when designing waste management systems. The building management plan should encourage people to recycle their waste.
RECOMMENDATIONS FOR HUMAN HEALTH AND COMFORT
G Reduce the risk of Sick Building Syndrome through natural ventilation, natural light, good acoustics and ergonomics.
G Ensure that microbial growth is prevented by regularly cleaning and servicing air- conditioning equipment and ducts.
G Prevent damp conditions that lead to microbial and bacterial growth, by ensuring exteriors are properly sealed and drained. Rising damp and associated fungal and bacterial growth should also be prevented by using breathable paints, so that water cannot accumulate under the paint surface.
G Avoid building and decorating materials (such as paint, varnished wood and carpets) which may emit high levels of VOCs. Rather use natural wood finishes or paints (which are commercially available) and limit the use of particleboards.
G Ensure that no CFC-based air conditioners are used.
G Encourage the use of organic cleaning products, which do not contain harmful chemicals.
KOKSTAD & FRANKLIN INTEGRATED SUSTAINABLE DEVELOPMENT PLAN
FINAL STRATEGY, DEVELOPMENT PLAN AND IMPLEMENTATION PLAN REPORT | NOVEMBER 2012
51
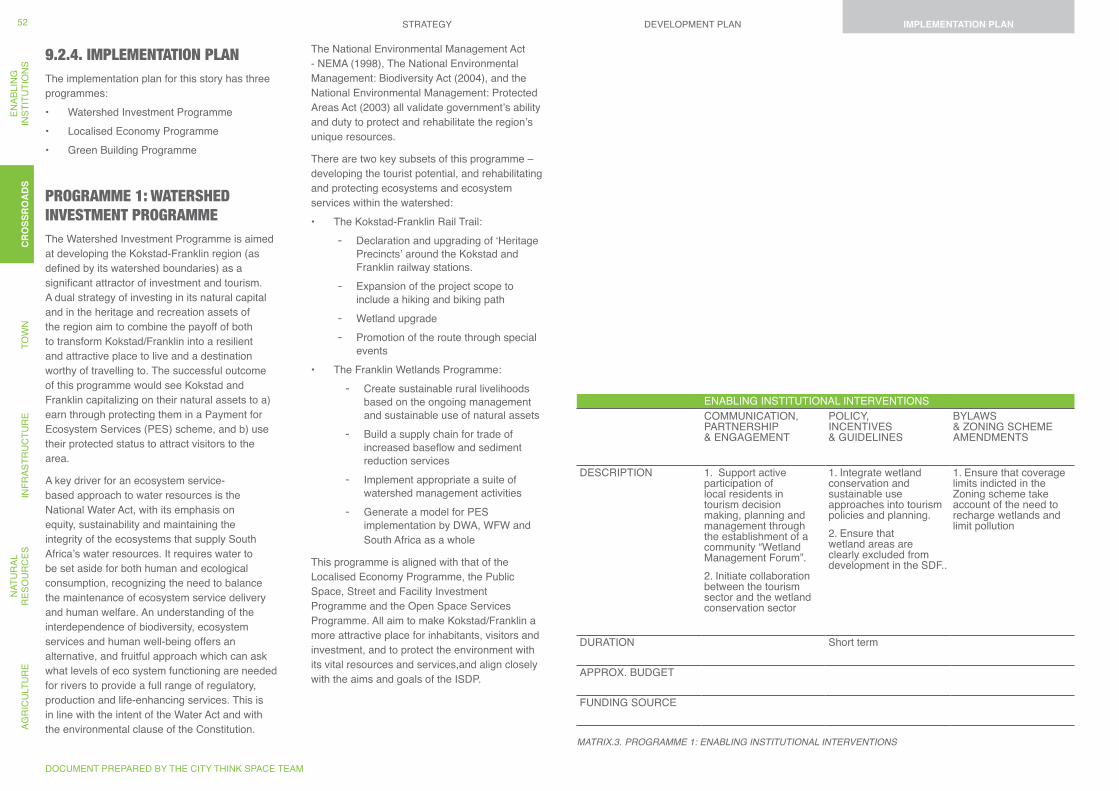
9.2.4. IMPLEMENTATION PLANThe implementation plan for this story has three programmes:• Watershed Investment Programme• Localised Economy Programme• Green Building Programme
PROGRAMME 1: WATERSHED INVESTMENT PROGRAMMEThe Watershed Investment Programme is aimed at developing the Kokstad-Franklin region (as defined by its watershed boundaries) as a significant attractor of investment and tourism. A dual strategy of investing in its natural capital and in the heritage and recreation assets of the region aim to combine the payoff of both to transform Kokstad/Franklin into a resilient and attractive place to live and a destination worthy of travelling to. The successful outcome of this programme would see Kokstad and Franklin capitalizing on their natural assets to a) earn through protecting them in a Payment for Ecosystem Services (PES) scheme, and b) use their protected status to attract visitors to the area.
A key driver for an ecosystem service-based approach to water resources is the National Water Act, with its emphasis on equity, sustainability and maintaining the integrity of the ecosystems that supply South Africa’s water resources. It requires water to be set aside for both human and ecological consumption, recognizing the need to balance the maintenance of ecosystem service delivery and human welfare. An understanding of the interdependence of biodiversity, ecosystem services and human well-being offers an alternative, and fruitful approach which can ask what levels of eco system functioning are needed for rivers to provide a full range of regulatory, production and life-enhancing services. This is in line with the intent of the Water Act and with the environmental clause of the Constitution.
The National Environmental Management Act - NEMA (1998), The National Environmental Management: Biodiversity Act (2004), and the National Environmental Management: Protected Areas Act (2003) all validate government’s ability and duty to protect and rehabilitate the region’s unique resources.
There are two key subsets of this programme – developing the tourist potential, and rehabilitating and protecting ecosystems and ecosystem services within the watershed:• The Kokstad-Franklin Rail Trail:
- Declaration and upgrading of ‘Heritage Precincts’ around the Kokstad and Franklin railway stations.
- Expansion of the project scope to include a hiking and biking path
- Wetland upgrade - Promotion of the route through special
events• The Franklin Wetlands Programme:
- Create sustainable rural livelihoods based on the ongoing management and sustainable use of natural assets
- Build a supply chain for trade of increased baseflow and sediment reduction services
- Implement appropriate a suite of watershed management activities
- Generate a model for PES implementation by DWA, WFW and South Africa as a whole
This programme is aligned with that of the Localised Economy Programme, the Public Space, Street and Facility Investment Programme and the Open Space Services Programme. All aim to make Kokstad/Franklin a more attractive place for inhabitants, visitors and investment, and to protect the environment with its vital resources and services,and align closely with the aims and goals of the ISDP.
ENABLING INSTITUTIONAL INTERVENTIONSCOMMUNICATION, PARTNERSHIP & ENGAGEMENT
POLICY, INCENTIVES & GUIDELINES
BYLAWS & ZONING SCHEME AMENDMENTS
DESCRIPTION 1. Support active participation of local residents in tourism decision making, planning and management through the establishment of a community “Wetland Management Forum”.2. Initiate collaboration between the tourism sector and the wetland conservation sector
1. Integrate wetland conservation and sustainable use approaches into tourism policies and planning. 2. Ensure that wetland areas are clearly excluded from development in the SDF..
1. Ensure that coverage limits indicted in the Zoning scheme take account of the need to recharge wetlands and limit pollution
DURATION Short term
APPROX. BUDGET
FUNDING SOURCE
MATRiX.3. PROgRAMME 1: ENABLiNg iNSTiTUTiONAL iNTERVENTiONS
DOCUMENT PREPARED BY THE CITY THINK SPACE TEAM
STRATEGY DEVELOPMENT PLAN IMPLEMENTATION PLANAG
RIC
ULT
UR
EN
ATU
RAL
R
ESO
UR
CES
INFR
ASTR
UC
TUR
ETO
WN
CR
OSS
RO
ADS
ENAB
LIN
GIN
STIT
UTI
ON
S52
CR
OSS
RO
AD
SIMPLEMENTATION PLAN
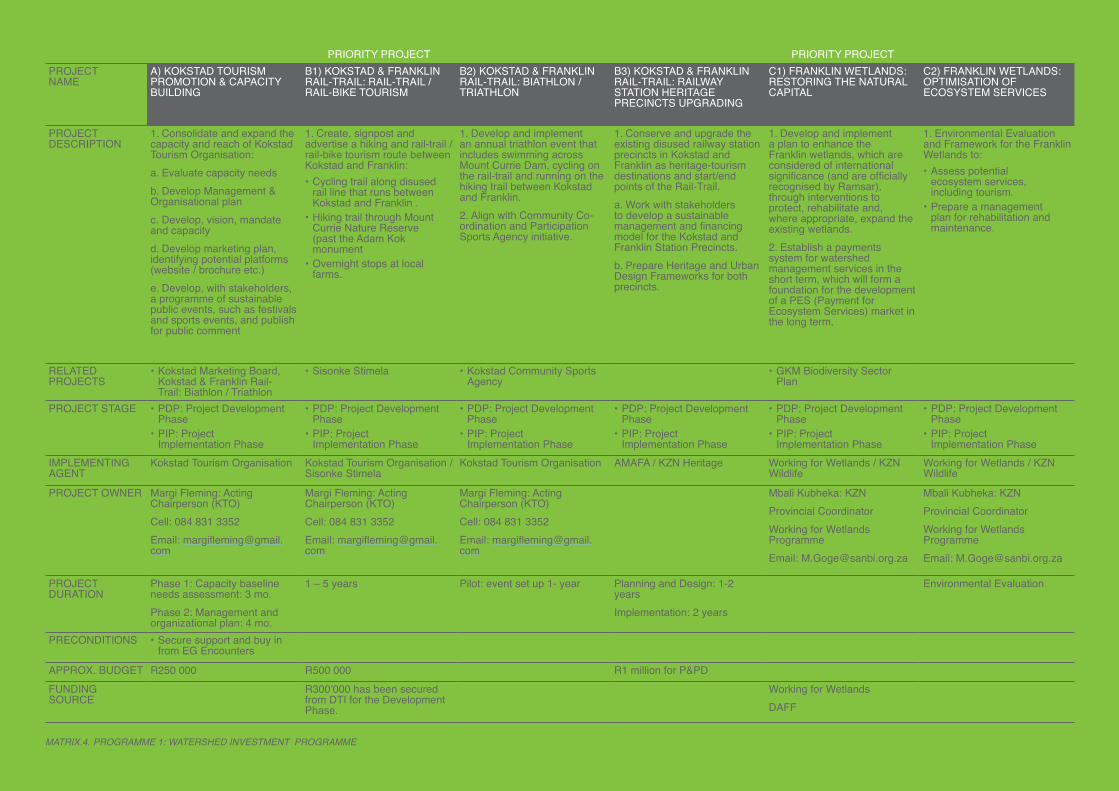
MATRiX.4. PROgRAMME 1: WATERSHED iNVESTMENT PROgRAMME
PRIORITY PROJECT PRIORITY PROJECTPROJECT NAME
A) KOKSTAD TOURISM PROMOTION & CAPACITY BUILDING
B1) KOKSTAD & FRANKLIN RAIL-TRAIL: RAIL-TRAIL / RAIL-BIKE TOURISM
B2) KOKSTAD & FRANKLIN RAIL-TRAIL: BIATHLON / TRIATHLON
B3) KOKSTAD & FRANKLIN RAIL-TRAIL: RAILWAY STATION HERITAGE PRECINCTS UPGRADING
C1) FRANKLIN WETLANDS: RESTORING THE NATURAL CAPITAL
C2) FRANKLIN WETLANDS: OPTIMISATION OF ECOSYSTEM SERVICES
PROJECT DESCRIPTION
1. Consolidate and expand the capacity and reach of Kokstad Tourism Organisation:a. Evaluate capacity needsb. Develop Management & Organisational planc. Develop, vision, mandate and capacityd. Develop marketing plan, identifying potential platforms (website / brochure etc.) e. Develop, with stakeholders, a programme of sustainable public events, such as festivals and sports events, and publish for public comment
1. Create, signpost and advertise a hiking and rail-trail / rail-bike tourism route between Kokstad and Franklin: • Cycling trail along disused
rail line that runs between Kokstad and Franklin .
• Hiking trail through Mount Currie Nature Reserve (past the Adam Kok monument
• Overnight stops at local farms.
1. Develop and implement an annual triathlon event that includes swimming across Mount Currie Dam, cycling on the rail-trail and running on the hiking trail between Kokstad and Franklin. 2. Align with Community Co-ordination and Participation Sports Agency initiative.
1. Conserve and upgrade the existing disused railway station precincts in Kokstad and Franklin as heritage-tourism destinations and start/end points of the Rail-Trail.a. Work with stakeholders to develop a sustainable management and financing model for the Kokstad and Franklin Station Precincts.b. Prepare Heritage and Urban Design Frameworks for both precincts.
1. Develop and implement a plan to enhance the Franklin wetlands, which are considered of international significance (and are officially recognised by Ramsar), through interventions to protect, rehabilitate and, where appropriate, expand the existing wetlands.2. Establish a payments system for watershed management services in the short term, which will form a foundation for the development of a PES (Payment for Ecosystem Services) market in the long term.
1. Environmental Evaluation and Framework for the Franklin Wetlands to: • Assess potential
ecosystem services, including tourism.
• Prepare a management plan for rehabilitation and maintenance.
RELATED PROJECTS
• Kokstad Marketing Board, Kokstad & Franklin Rail-Trail: Biathlon / Triathlon
• Sisonke Stimela • Kokstad Community Sports Agency
• GKM Biodiversity Sector Plan
PROJECT STAGE • PDP: Project Development Phase
• PIP: Project Implementation Phase
• PDP: Project Development Phase
• PIP: Project Implementation Phase
• PDP: Project Development Phase
• PIP: Project Implementation Phase
• PDP: Project Development Phase
• PIP: Project Implementation Phase
• PDP: Project Development Phase
• PIP: Project Implementation Phase
• PDP: Project Development Phase
• PIP: Project Implementation Phase
IMPLEMENTING AGENT
Kokstad Tourism Organisation Kokstad Tourism Organisation / Sisonke Stimela
Kokstad Tourism Organisation AMAFA / KZN Heritage Working for Wetlands / KZN Wildlife
Working for Wetlands / KZN Wildlife
PROJECT OWNER Margi Fleming: Acting Chairperson (KTO)Cell: 084 831 3352Email: [email protected]
Margi Fleming: Acting Chairperson (KTO)Cell: 084 831 3352Email: [email protected]
Margi Fleming: Acting Chairperson (KTO)Cell: 084 831 3352Email: [email protected]
Mbali Kubheka: KZNProvincial CoordinatorWorking for Wetlands ProgrammeEmail: [email protected]
Mbali Kubheka: KZNProvincial Coordinator Working for Wetlands ProgrammeEmail: [email protected]
PROJECT DURATION
Phase 1: Capacity baseline needs assessment: 3 mo.Phase 2: Management and organizational plan: 4 mo.
1 – 5 years Pilot: event set up 1- year Planning and Design: 1-2 yearsImplementation: 2 years
Environmental Evaluation
PRECONDITIONS • Secure support and buy in from EG Encounters
APPROX. BUDGET R250 000 R500 000 R1 million for P&PD FUNDING SOURCE
R300’000 has been secured from DTI for the Development Phase.
Working for WetlandsDAFF
KOKSTAD & FRANKLIN INTEGRATED SUSTAINABLE DEVELOPMENT PLAN
FINAL STRATEGY, DEVELOPMENT PLAN AND IMPLEMENTATION PLAN REPORT | NOVEMBER 2012
53
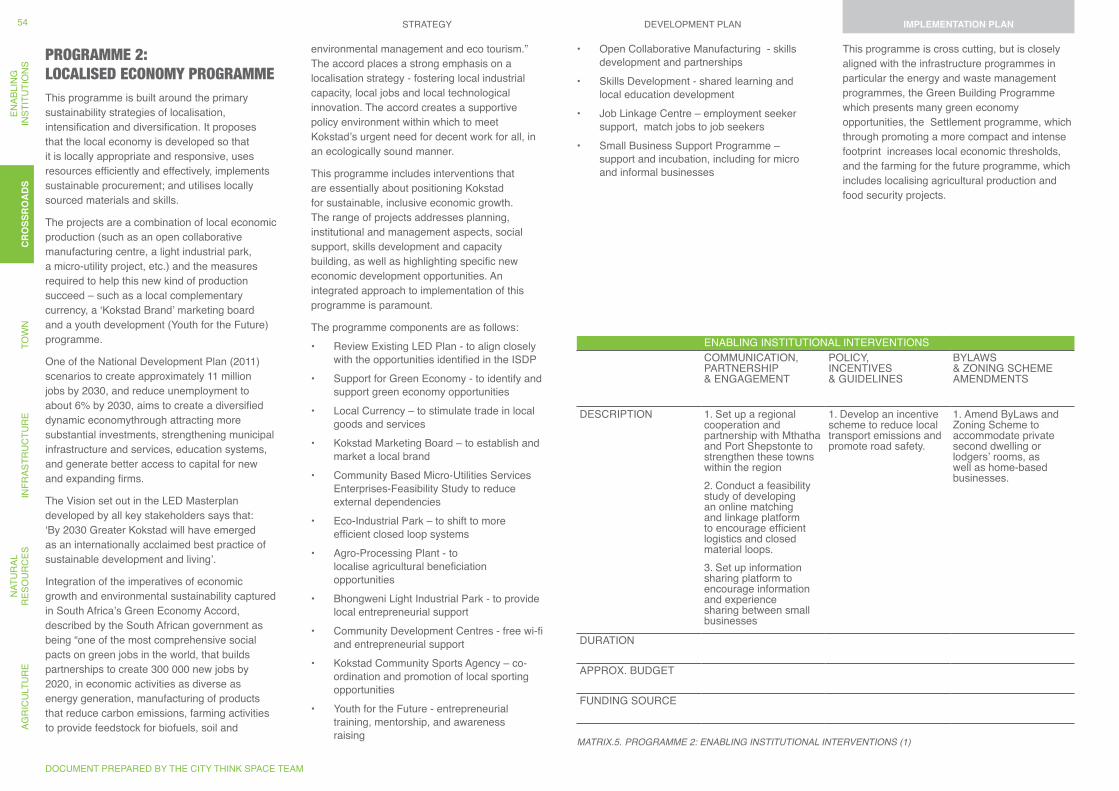
PROGRAMME 2: LOCALISED ECONOMY PROGRAMMEThis programme is built around the primary sustainability strategies of localisation, intensification and diversification. It proposes that the local economy is developed so that it is locally appropriate and responsive, uses resources efficiently and effectively, implements sustainable procurement; and utilises locally sourced materials and skills.
The projects are a combination of local economic production (such as an open collaborative manufacturing centre, a light industrial park, a micro-utility project, etc.) and the measures required to help this new kind of production succeed – such as a local complementary currency, a ‘Kokstad Brand’ marketing board and a youth development (Youth for the Future) programme.
One of the National Development Plan (2011) scenarios to create approximately 11 million jobs by 2030, and reduce unemployment to about 6% by 2030, aims to create a diversified dynamic economythrough attracting more substantial investments, strengthening municipal infrastructure and services, education systems, and generate better access to capital for new and expanding firms.
The Vision set out in the LED Masterplan developed by all key stakeholders says that: ‘By 2030 Greater Kokstad will have emerged as an internationally acclaimed best practice of sustainable development and living’.
Integration of the imperatives of economic growth and environmental sustainability captured in South Africa’s Green Economy Accord, described by the South African government as being “one of the most comprehensive social pacts on green jobs in the world, that builds partnerships to create 300 000 new jobs by 2020, in economic activities as diverse as energy generation, manufacturing of products that reduce carbon emissions, farming activities to provide feedstock for biofuels, soil and
environmental management and eco tourism.” The accord places a strong emphasis on a localisation strategy - fostering local industrial capacity, local jobs and local technological innovation. The accord creates a supportive policy environment within which to meet Kokstad’s urgent need for decent work for all, in an ecologically sound manner.
This programme includes interventions that are essentially about positioning Kokstad for sustainable, inclusive economic growth. The range of projects addresses planning, institutional and management aspects, social support, skills development and capacity building, as well as highlighting specific new economic development opportunities. An integrated approach to implementation of this programme is paramount.
The programme components are as follows:• Review Existing LED Plan - to align closely
with the opportunities identified in the ISDP• Support for Green Economy - to identify and
support green economy opportunities• Local Currency – to stimulate trade in local
goods and services • Kokstad Marketing Board – to establish and
market a local brand• Community Based Micro-Utilities Services
Enterprises-Feasibility Study to reduce external dependencies
• Eco-Industrial Park – to shift to more efficient closed loop systems
• Agro-Processing Plant - to localise agricultural beneficiation opportunities
• Bhongweni Light Industrial Park - to provide local entrepreneurial support
• Community Development Centres - free wi-fi and entrepreneurial support
• Kokstad Community Sports Agency – co-ordination and promotion of local sporting opportunities
• Youth for the Future - entrepreneurial training, mentorship, and awareness raising
• Open Collaborative Manufacturing - skills development and partnerships
• Skills Development - shared learning and local education development
• Job Linkage Centre – employment seeker support, match jobs to job seekers
• Small Business Support Programme – support and incubation, including for micro and informal businesses
MATRiX.5. PROgRAMME 2: ENABLiNg iNSTiTUTiONAL iNTERVENTiONS (1)
This programme is cross cutting, but is closely aligned with the infrastructure programmes in particular the energy and waste management programmes, the Green Building Programme which presents many green economy opportunities, the Settlement programme, which through promoting a more compact and intense footprint increases local economic thresholds, and the farming for the future programme, which includes localising agricultural production and food security projects.
ENABLING INSTITUTIONAL INTERVENTIONSCOMMUNICATION, PARTNERSHIP & ENGAGEMENT
POLICY, INCENTIVES & GUIDELINES
BYLAWS & ZONING SCHEME AMENDMENTS
DESCRIPTION 1. Set up a regional cooperation and partnership with Mthatha and Port Shepstonte to strengthen these towns within the region 2. Conduct a feasibility study of developing an online matching and linkage platform to encourage efficient logistics and closed material loops. 3. Set up information sharing platform to encourage information and experience sharing between small businesses
1. Develop an incentive scheme to reduce local transport emissions and promote road safety.
1. Amend ByLaws and Zoning Scheme to accommodate private second dwelling or lodgers’ rooms, as well as home-based businesses.
DURATION
APPROX. BUDGET
FUNDING SOURCE
DOCUMENT PREPARED BY THE CITY THINK SPACE TEAM
STRATEGY DEVELOPMENT PLAN IMPLEMENTATION PLANAG
RIC
ULT
UR
EN
ATU
RAL
R
ESO
UR
CES
INFR
ASTR
UC
TUR
ETO
WN
CR
OSS
RO
ADS
ENAB
LIN
GIN
STIT
UTI
ON
S54
CR
OSS
RO
AD
SIMPLEMENTATION PLAN
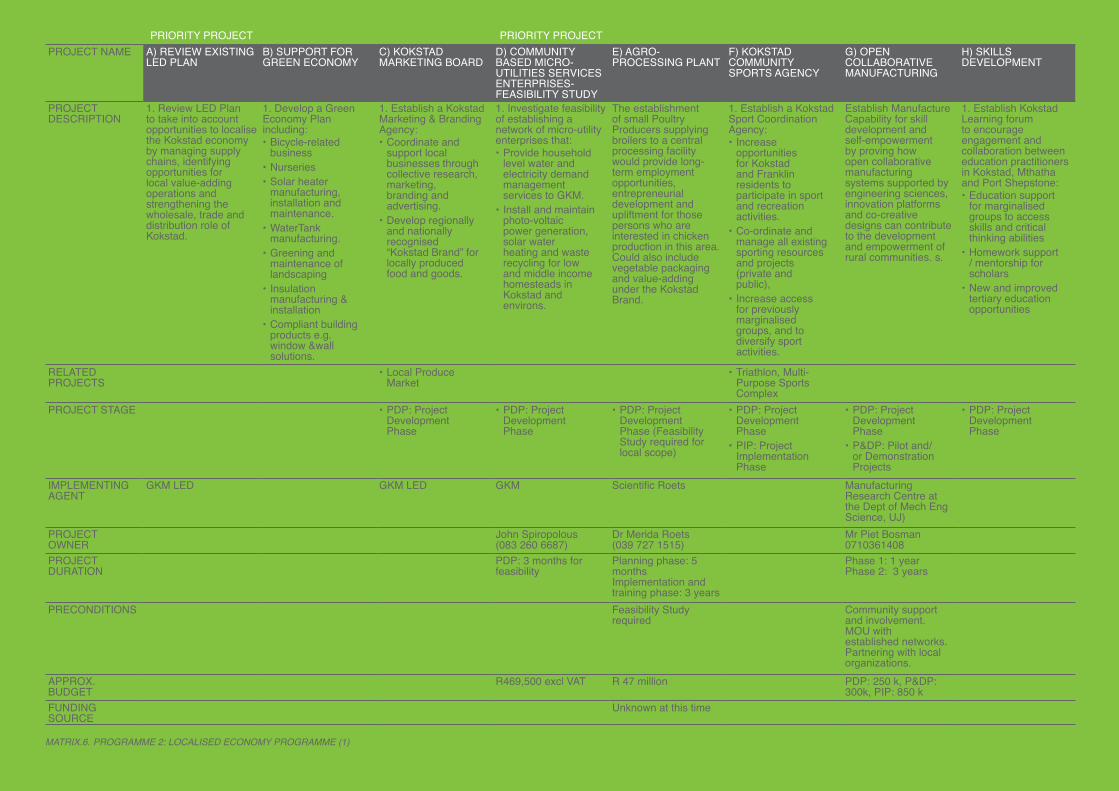
MATRiX.6. PROgRAMME 2: LOCALiSED ECONOMY PROgRAMME (1)
PRIORITY PROJECT PRIORITY PROJECTPROJECT NAME A) REVIEW EXISTING
LED PLANB) SUPPORT FOR GREEN ECONOMY
C) KOKSTAD MARKETING BOARD
D) COMMUNITY BASED MICRO-UTILITIES SERVICES ENTERPRISES-FEASIBILITY STUDY
E) AGRO-PROCESSING PLANT
F) KOKSTAD COMMUNITY SPORTS AGENCY
G) OPEN COLLABORATIVE MANUFACTURING
H) SKILLS DEVELOPMENT
PROJECT DESCRIPTION
1. Review LED Plan to take into account opportunities to localise the Kokstad economy by managing supply chains, identifying opportunities for local value-adding operations and strengthening the wholesale, trade and distribution role of Kokstad.
1. Develop a Green Economy Plan including: • Bicycle-related
business• Nurseries• Solar heater
manufacturing, installation and maintenance.
• WaterTank manufacturing.
• Greening and maintenance of landscaping
• Insulation manufacturing & installation
• Compliant building products e.g. window &wall solutions.
1. Establish a Kokstad Marketing & Branding Agency:• Coordinate and
support local businesses through collective research, marketing, branding and advertising.
• Develop regionally and nationally recognised “Kokstad Brand” for locally produced food and goods.
1. Investigate feasibility of establishing a network of micro-utility enterprises that:• Provide household
level water and electricity demand management services to GKM.
• Install and maintain photo-voltaic power generation, solar water heating and waste recycling for low and middle income homesteads in Kokstad and environs.
The establishment of small Poultry Producers supplying broilers to a central processing facility would provide long-term employment opportunities, entrepreneurial development and upliftment for those persons who are interested in chicken production in this area. Could also include vegetable packaging and value-adding under the Kokstad Brand.
1. Establish a Kokstad Sport Coordination Agency:• Increase
opportunities for Kokstad and Franklin residents to participate in sport and recreation activities.
• Co-ordinate and manage all existing sporting resources and projects (private and public),
• Increase access for previously marginalised groups, and to diversify sport activities.
Establish Manufacture Capability for skill development and self-empowerment by proving how open collaborative manufacturing systems supported by engineering sciences, innovation platforms and co-creative designs can contribute to the development and empowerment of rural communities. s.
1. Establish Kokstad Learning forum to encourage engagement and collaboration between education practitioners in Kokstad, Mthatha and Port Shepstone:• Education support
for marginalised groups to access skills and critical thinking abilities
• Homework support / mentorship for scholars
• New and improved tertiary education opportunities
RELATED PROJECTS
• Local Produce Market
• Triathlon, Multi-Purpose Sports Complex
PROJECT STAGE • PDP: Project Development Phase
• PDP: Project Development Phase
• PDP: Project Development Phase (Feasibility Study required for local scope)
• PDP: Project Development Phase
• PIP: Project Implementation Phase
• PDP: Project Development Phase
• P&DP: Pilot and/or Demonstration Projects
• PDP: Project Development Phase
IMPLEMENTING AGENT
GKM LED GKM LED GKM Scientific Roets Manufacturing Research Centre at the Dept of Mech Eng Science, UJ)
PROJECT OWNER
John Spiropolous (083 260 6687)
Dr Merida Roets (039 727 1515)
Mr Piet Bosman 0710361408
PROJECT DURATION
PDP: 3 months for feasibility
Planning phase: 5 months Implementation and training phase: 3 years
Phase 1: 1 year Phase 2: 3 years
PRECONDITIONS Feasibility Study required
Community support and involvement. MOU with established networks. Partnering with local organizations.
APPROX. BUDGET
R469,500 excl VAT R 47 million PDP: 250 k, P&DP: 300k, PIP: 850 k
FUNDING SOURCE
Unknown at this time
KOKSTAD & FRANKLIN INTEGRATED SUSTAINABLE DEVELOPMENT PLAN
FINAL STRATEGY, DEVELOPMENT PLAN AND IMPLEMENTATION PLAN REPORT | NOVEMBER 2012
55
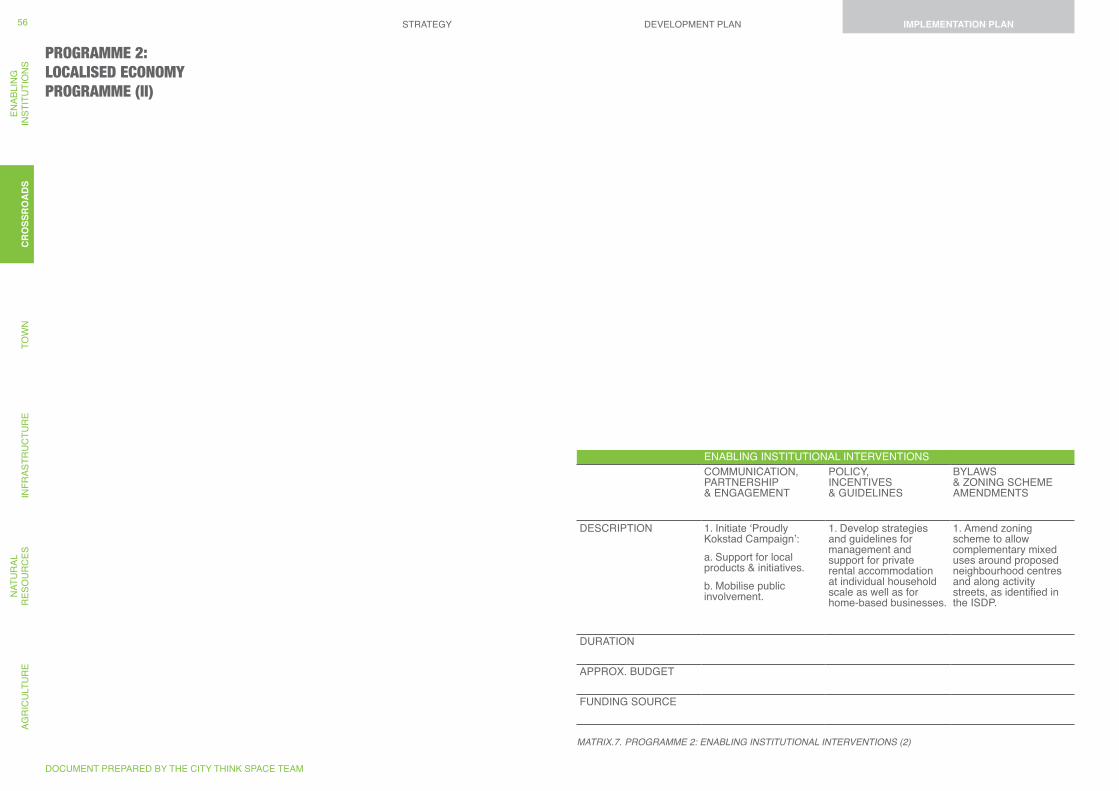
MATRiX.7. PROgRAMME 2: ENABLiNg iNSTiTUTiONAL iNTERVENTiONS (2)
ENABLING INSTITUTIONAL INTERVENTIONSCOMMUNICATION, PARTNERSHIP & ENGAGEMENT
POLICY, INCENTIVES & GUIDELINES
BYLAWS & ZONING SCHEME AMENDMENTS
DESCRIPTION 1. Initiate ‘Proudly Kokstad Campaign’:a. Support for local products & initiatives.b. Mobilise public involvement.
1. Develop strategies and guidelines for management and support for private rental accommodation at individual household scale as well as for home-based businesses.
1. Amend zoning scheme to allow complementary mixed uses around proposed neighbourhood centres and along activity streets, as identified in the ISDP.
DURATION
APPROX. BUDGET
FUNDING SOURCE
PROGRAMME 2: LOCALISED ECONOMY PROGRAMME (II)
DOCUMENT PREPARED BY THE CITY THINK SPACE TEAM
STRATEGY DEVELOPMENT PLAN IMPLEMENTATION PLANAG
RIC
ULT
UR
EN
ATU
RAL
R
ESO
UR
CES
INFR
ASTR
UC
TUR
ETO
WN
CR
OSS
RO
ADS
ENAB
LIN
GIN
STIT
UTI
ON
S56
CR
OSS
RO
AD
SIMPLEMENTATION PLAN
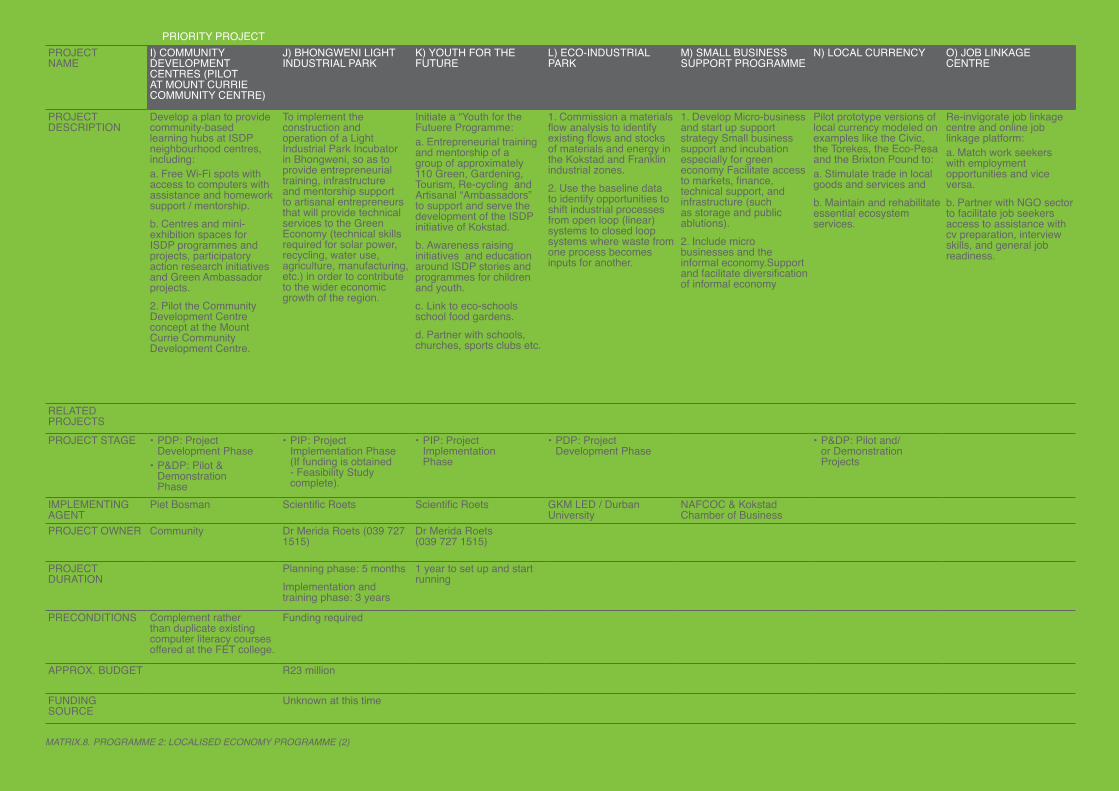
MATRiX.8. PROgRAMME 2: LOCALiSED ECONOMY PROgRAMME (2)
PRIORITY PROJECTPROJECT NAME
I) COMMUNITY DEVELOPMENT CENTRES (PILOT AT MOUNT CURRIE COMMUNITY CENTRE)
J) BHONGWENI LIGHT INDUSTRIAL PARK
K) YOUTH FOR THE FUTURE
L) ECO-INDUSTRIAL PARK
M) SMALL BUSINESS SUPPORT PROGRAMME
N) LOCAL CURRENCY O) JOB LINKAGE CENTRE
PROJECT DESCRIPTION
Develop a plan to provide community-based learning hubs at ISDP neighbourhood centres, including:a. Free Wi-Fi spots with access to computers with assistance and homework support / mentorship.b. Centres and mini-exhibition spaces for ISDP programmes and projects, participatory action research initiatives and Green Ambassador projects.2. Pilot the Community Development Centre concept at the Mount Currie Community Development Centre.
To implement the construction and operation of a Light Industrial Park Incubator in Bhongweni, so as to provide entrepreneurial training, infrastructure and mentorship support to artisanal entrepreneurs that will provide technical services to the Green Economy (technical skills required for solar power, recycling, water use, agriculture, manufacturing, etc.) in order to contribute to the wider economic growth of the region.
Initiate a “Youth for the Futuere Programme:a. Entrepreneurial training and mentorship of a group of approximately 110 Green, Gardening, Tourism, Re-cycling and Artisanal “Ambassadors” to support and serve the development of the ISDP initiative of Kokstad. b. Awareness raising initiatives and education around ISDP stories and programmes for children and youth.c. Link to eco-schools school food gardens.d. Partner with schools, churches, sports clubs etc.
1. Commission a materials flow analysis to identify existing flows and stocks of materials and energy in the Kokstad and Franklin industrial zones. 2. Use the baseline data to identify opportunities to shift industrial processes from open loop (linear) systems to closed loop systems where waste from one process becomes inputs for another.
1. Develop Micro-business and start up support strategy Small business support and incubation especially for green economy Facilitate access to markets, finance, technical support, and infrastructure (such as storage and public ablutions).2. Include micro businesses and the informal economy.Support and facilitate diversification of informal economy
Pilot prototype versions of local currency modeled on examples like the Civic, the Torekes, the Eco-Pesa and the Brixton Pound to: a. Stimulate trade in local goods and services and b. Maintain and rehabilitate essential ecosystem services.
Re-invigorate job linkage centre and online job linkage platform:a. Match work seekers with employment opportunities and vice versa.b. Partner with NGO sector to facilitate job seekers access to assistance with cv preparation, interview skills, and general job readiness.
RELATED PROJECTSPROJECT STAGE • PDP: Project
Development Phase• P&DP: Pilot &
Demonstration Phase
• PIP: Project Implementation Phase (If funding is obtained - Feasibility Study complete).
• PIP: Project Implementation Phase
• PDP: Project Development Phase
• P&DP: Pilot and/or Demonstration Projects
IMPLEMENTING AGENT
Piet Bosman Scientific Roets Scientific Roets GKM LED / Durban University
NAFCOC & Kokstad Chamber of Business
PROJECT OWNER Community Dr Merida Roets (039 727 1515)
Dr Merida Roets (039 727 1515)
PROJECT DURATION
Planning phase: 5 monthsImplementation and training phase: 3 years
1 year to set up and start running
PRECONDITIONS Complement rather than duplicate existing computer literacy courses offered at the FET college.
Funding required
APPROX. BUDGET R23 million
FUNDING SOURCE
Unknown at this time
KOKSTAD & FRANKLIN INTEGRATED SUSTAINABLE DEVELOPMENT PLAN
FINAL STRATEGY, DEVELOPMENT PLAN AND IMPLEMENTATION PLAN REPORT | NOVEMBER 2012
57
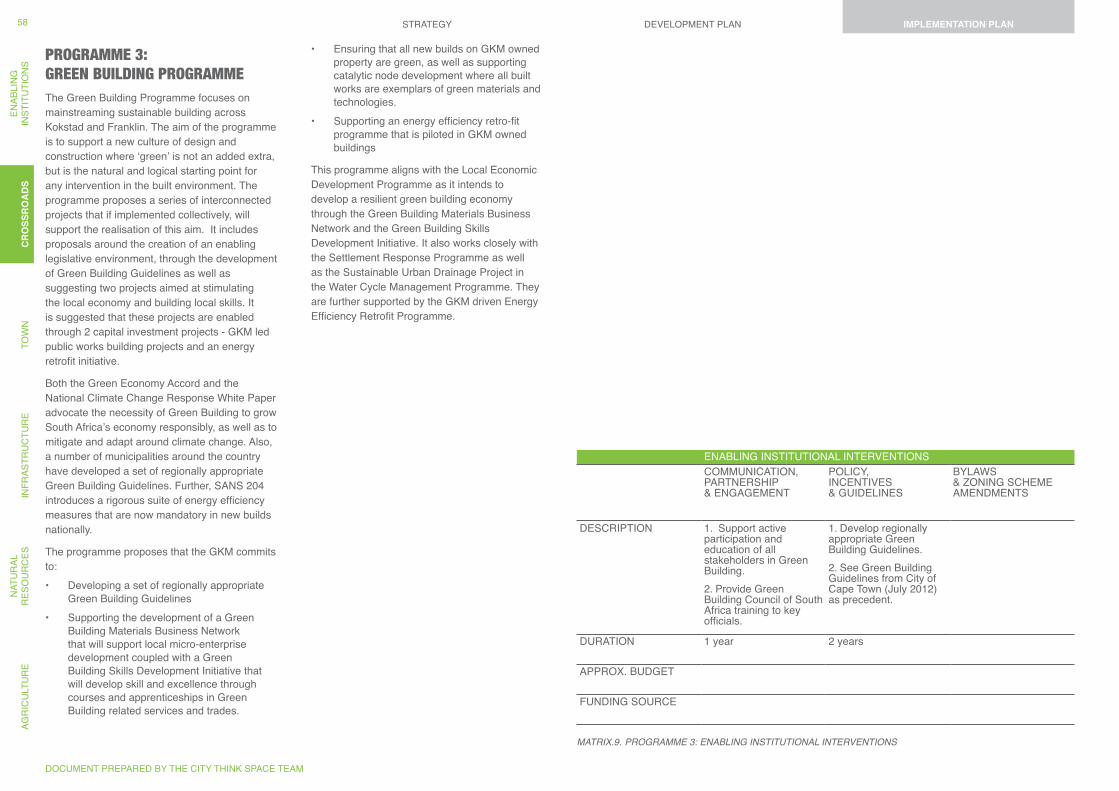
PROGRAMME 3: GREEN BUILDING PROGRAMMEThe Green Building Programme focuses on mainstreaming sustainable building across Kokstad and Franklin. The aim of the programme is to support a new culture of design and construction where ‘green’ is not an added extra, but is the natural and logical starting point for any intervention in the built environment. The programme proposes a series of interconnected projects that if implemented collectively, will support the realisation of this aim. It includes proposals around the creation of an enabling legislative environment, through the development of Green Building Guidelines as well as suggesting two projects aimed at stimulating the local economy and building local skills. It is suggested that these projects are enabled through 2 capital investment projects - GKM led public works building projects and an energy retrofit initiative.
Both the Green Economy Accord and the National Climate Change Response White Paper advocate the necessity of Green Building to grow South Africa’s economy responsibly, as well as to mitigate and adapt around climate change. Also, a number of municipalities around the country have developed a set of regionally appropriate Green Building Guidelines. Further, SANS 204 introduces a rigorous suite of energy efficiency measures that are now mandatory in new builds nationally.
The programme proposes that the GKM commits to: • Developing a set of regionally appropriate
Green Building Guidelines • Supporting the development of a Green
Building Materials Business Network that will support local micro-enterprise development coupled with a Green Building Skills Development Initiative that will develop skill and excellence through courses and apprenticeships in Green Building related services and trades.
• Ensuring that all new builds on GKM owned property are green, as well as supporting catalytic node development where all built works are exemplars of green materials and technologies.
• Supporting an energy efficiency retro-fit programme that is piloted in GKM owned buildings
This programme aligns with the Local Economic Development Programme as it intends to develop a resilient green building economy through the Green Building Materials Business Network and the Green Building Skills Development Initiative. It also works closely with the Settlement Response Programme as well as the Sustainable Urban Drainage Project in the Water Cycle Management Programme. They are further supported by the GKM driven Energy Efficiency Retrofit Programme.
MATRiX.9. PROgRAMME 3: ENABLiNg iNSTiTUTiONAL iNTERVENTiONS
ENABLING INSTITUTIONAL INTERVENTIONSCOMMUNICATION, PARTNERSHIP & ENGAGEMENT
POLICY, INCENTIVES & GUIDELINES
BYLAWS & ZONING SCHEME AMENDMENTS
DESCRIPTION 1. Support active participation and education of all stakeholders in Green Building. 2. Provide Green Building Council of South Africa training to key officials.
1. Develop regionally appropriate Green Building Guidelines. 2. See Green Building Guidelines from City of Cape Town (July 2012) as precedent.
DURATION 1 year 2 years
APPROX. BUDGET
FUNDING SOURCE
DOCUMENT PREPARED BY THE CITY THINK SPACE TEAM
STRATEGY DEVELOPMENT PLAN IMPLEMENTATION PLANAG
RIC
ULT
UR
EN
ATU
RAL
R
ESO
UR
CES
INFR
ASTR
UC
TUR
ETO
WN
CR
OSS
RO
ADS
ENAB
LIN
GIN
STIT
UTI
ON
S58
CR
OSS
RO
AD
SIMPLEMENTATION PLAN
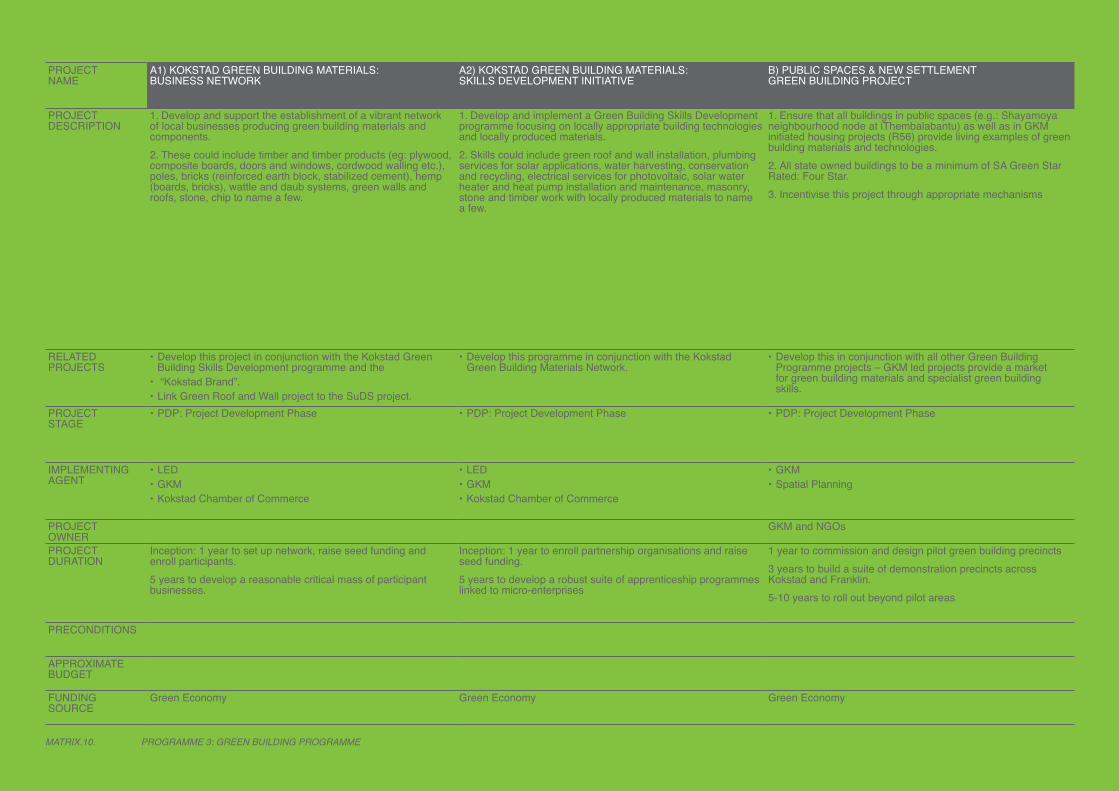
MATRiX.10. PROgRAMME 3: gREEN BUiLDiNg PROgRAMME
PROJECT NAME
A1) KOKSTAD GREEN BUILDING MATERIALS: BUSINESS NETWORK
A2) KOKSTAD GREEN BUILDING MATERIALS: SKILLS DEVELOPMENT INITIATIVE
B) PUBLIC SPACES & NEW SETTLEMENT GREEN BUILDING PROJECT
PROJECT DESCRIPTION
1. Develop and support the establishment of a vibrant network of local businesses producing green building materials and components. 2. These could include timber and timber products (eg: plywood, composite boards, doors and windows, cordwood walling etc.), poles, bricks (reinforced earth block, stabilized cement), hemp (boards, bricks), wattle and daub systems, green walls and roofs, stone, chip to name a few.
1. Develop and implement a Green Building Skills Development programme focusing on locally appropriate building technologies and locally produced materials. 2. Skills could include green roof and wall installation, plumbing services for solar applications, water harvesting, conservation and recycling, electrical services for photovoltaic, solar water heater and heat pump installation and maintenance, masonry, stone and timber work with locally produced materials to name a few.
1. Ensure that all buildings in public spaces (e.g.: Shayamoya neighbourhood node at iThembalabantu) as well as in GKM initiated housing projects (R56) provide living examples of green building materials and technologies. 2. All state owned buildings to be a minimum of SA Green Star Rated: Four Star.3. Incentivise this project through appropriate mechanisms
RELATED PROJECTS
• Develop this project in conjunction with the Kokstad Green Building Skills Development programme and the
• “Kokstad Brand”. • Link Green Roof and Wall project to the SuDS project.
• Develop this programme in conjunction with the Kokstad Green Building Materials Network.
• Develop this in conjunction with all other Green Building Programme projects – GKM led projects provide a market for green building materials and specialist green building skills.
PROJECT STAGE
• PDP: Project Development Phase • PDP: Project Development Phase • PDP: Project Development Phase
IMPLEMENTING AGENT
• LED• GKM• Kokstad Chamber of Commerce
• LED • GKM• Kokstad Chamber of Commerce
• GKM• Spatial Planning
PROJECT OWNER
GKM and NGOs
PROJECT DURATION
Inception: 1 year to set up network, raise seed funding and enroll participants. 5 years to develop a reasonable critical mass of participant businesses.
Inception: 1 year to enroll partnership organisations and raise seed funding.5 years to develop a robust suite of apprenticeship programmes linked to micro-enterprises
1 year to commission and design pilot green building precincts 3 years to build a suite of demonstration precincts across Kokstad and Franklin. 5-10 years to roll out beyond pilot areas
PRECONDITIONS
APPROXIMATE BUDGET
FUNDING SOURCE
Green Economy Green Economy Green Economy
KOKSTAD & FRANKLIN INTEGRATED SUSTAINABLE DEVELOPMENT PLAN
FINAL STRATEGY, DEVELOPMENT PLAN AND IMPLEMENTATION PLAN REPORT | NOVEMBER 2012
59
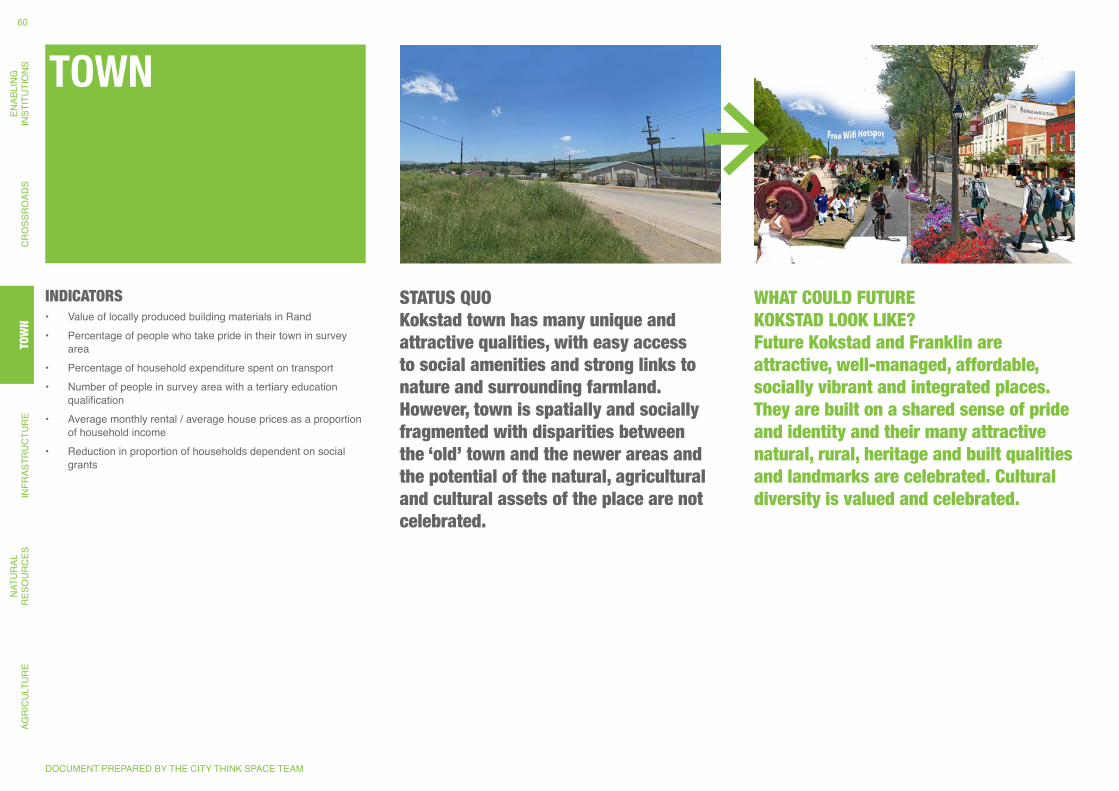
TOWN
STATUS QUO Kokstad town has many unique and attractive qualities, with easy access to social amenities and strong links to nature and surrounding farmland. However, town is spatially and socially fragmented with disparities between the ‘old’ town and the newer areas and the potential of the natural, agricultural and cultural assets of the place are not celebrated.
WHAT COULD FUTURE KOKSTAD LOOK LIKE? Future Kokstad and Franklin are attractive, well-managed, affordable, socially vibrant and integrated places. They are built on a shared sense of pride and identity and their many attractive natural, rural, heritage and built qualities and landmarks are celebrated. Cultural diversity is valued and celebrated.
INDICATORS • Value of locally produced building materials in Rand• Percentage of people who take pride in their town in survey
area• Percentage of household expenditure spent on transport• Number of people in survey area with a tertiary education
qualification• Average monthly rental / average house prices as a proportion
of household income• Reduction in proportion of households dependent on social
grants
DOCUMENT PREPARED BY THE CITY THINK SPACE TEAM
AGR
ICU
LTU
RE
NAT
UR
AL
RES
OU
RC
ESIN
FRAS
TRU
CTU
RE
TOW
NC
RO
SSR
OAD
SEN
ABLI
NG
INST
ITU
TIO
NS
60TO
WN
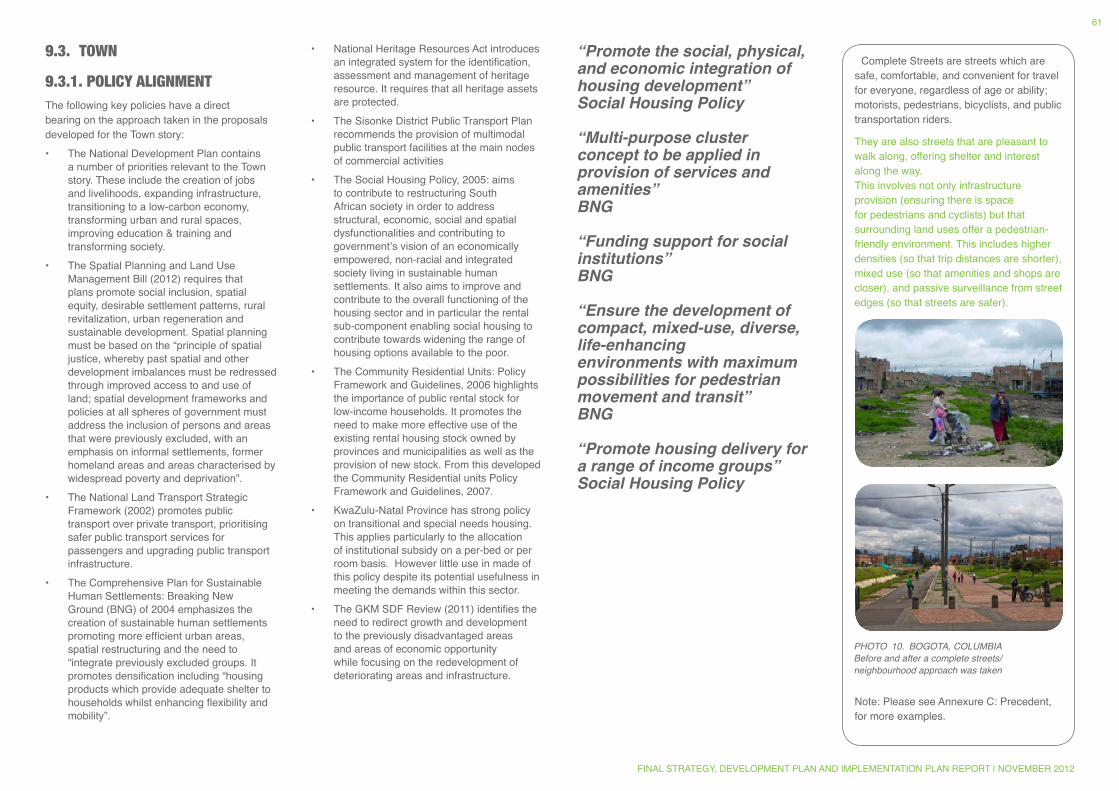
Complete Streets are streets which are safe, comfortable, and convenient for travel for everyone, regardless of age or ability; motorists, pedestrians, bicyclists, and public transportation riders.
They are also streets that are pleasant to walk along, offering shelter and interest along the way. This involves not only infrastructure provision (ensuring there is space for pedestrians and cyclists) but that surrounding land uses offer a pedestrian-friendly environment. This includes higher densities (so that trip distances are shorter), mixed use (so that amenities and shops are closer), and passive surveillance from street edges (so that streets are safer).
Note: Please see Annexure C: Precedent, for more examples.
“Promote the social, physical, and economic integration of housing development”Social Housing Policy
“Multi-purpose cluster concept to be applied in provision of services and amenities”BNG
“Funding support for social institutions”BNG
“Ensure the development of compact, mixed-use, diverse, life-enhancing environments with maximum possibilities for pedestrian movement and transit” BNG
“Promote housing delivery for a range of income groups”Social Housing Policy
PHOTO 10. BOgOTA, COLUMBiABefore and after a complete streets/neighbourhood approach was taken
9.3. TOWN
9.3.1. POLICY ALIGNMENTThe following key policies have a direct bearing on the approach taken in the proposals developed for the Town story:• The National Development Plan contains
a number of priorities relevant to the Town story. These include the creation of jobs and livelihoods, expanding infrastructure, transitioning to a low-carbon economy, transforming urban and rural spaces, improving education & training and transforming society.
• The Spatial Planning and Land Use Management Bill (2012) requires that plans promote social inclusion, spatial equity, desirable settlement patterns, rural revitalization, urban regeneration and sustainable development. Spatial planning must be based on the “principle of spatial justice, whereby past spatial and other development imbalances must be redressed through improved access to and use of land; spatial development frameworks and policies at all spheres of government must address the inclusion of persons and areas that were previously excluded, with an emphasis on informal settlements, former homeland areas and areas characterised by widespread poverty and deprivation”.
• The National Land Transport Strategic Framework (2002) promotes public transport over private transport, prioritising safer public transport services for passengers and upgrading public transport infrastructure.
• The Comprehensive Plan for Sustainable Human Settlements: Breaking New Ground (BNG) of 2004 emphasizes the creation of sustainable human settlements promoting more efficient urban areas, spatial restructuring and the need to “integrate previously excluded groups. It promotes densification including “housing products which provide adequate shelter to households whilst enhancing flexibility and mobility”.
• National Heritage Resources Act introduces an integrated system for the identification, assessment and management of heritage resource. It requires that all heritage assets are protected.
• The Sisonke District Public Transport Plan recommends the provision of multimodal public transport facilities at the main nodes of commercial activities
• The Social Housing Policy, 2005: aims to contribute to restructuring South African society in order to address structural, economic, social and spatial dysfunctionalities and contributing to government’s vision of an economically empowered, non-racial and integrated society living in sustainable human settlements. It also aims to improve and contribute to the overall functioning of the housing sector and in particular the rental sub-component enabling social housing to contribute towards widening the range of housing options available to the poor.
• The Community Residential Units: Policy Framework and Guidelines, 2006 highlights the importance of public rental stock for low-income households. It promotes the need to make more effective use of the existing rental housing stock owned by provinces and municipalities as well as the provision of new stock. From this developed the Community Residential units Policy Framework and Guidelines, 2007.
• KwaZulu-Natal Province has strong policy on transitional and special needs housing. This applies particularly to the allocation of institutional subsidy on a per-bed or per room basis. However little use in made of this policy despite its potential usefulness in meeting the demands within this sector.
• The GKM SDF Review (2011) identifies the need to redirect growth and development to the previously disadvantaged areas and areas of economic opportunity while focusing on the redevelopment of deteriorating areas and infrastructure.
FINAL STRATEGY, DEVELOPMENT PLAN AND IMPLEMENTATION PLAN REPORT | NOVEMBER 2012
61
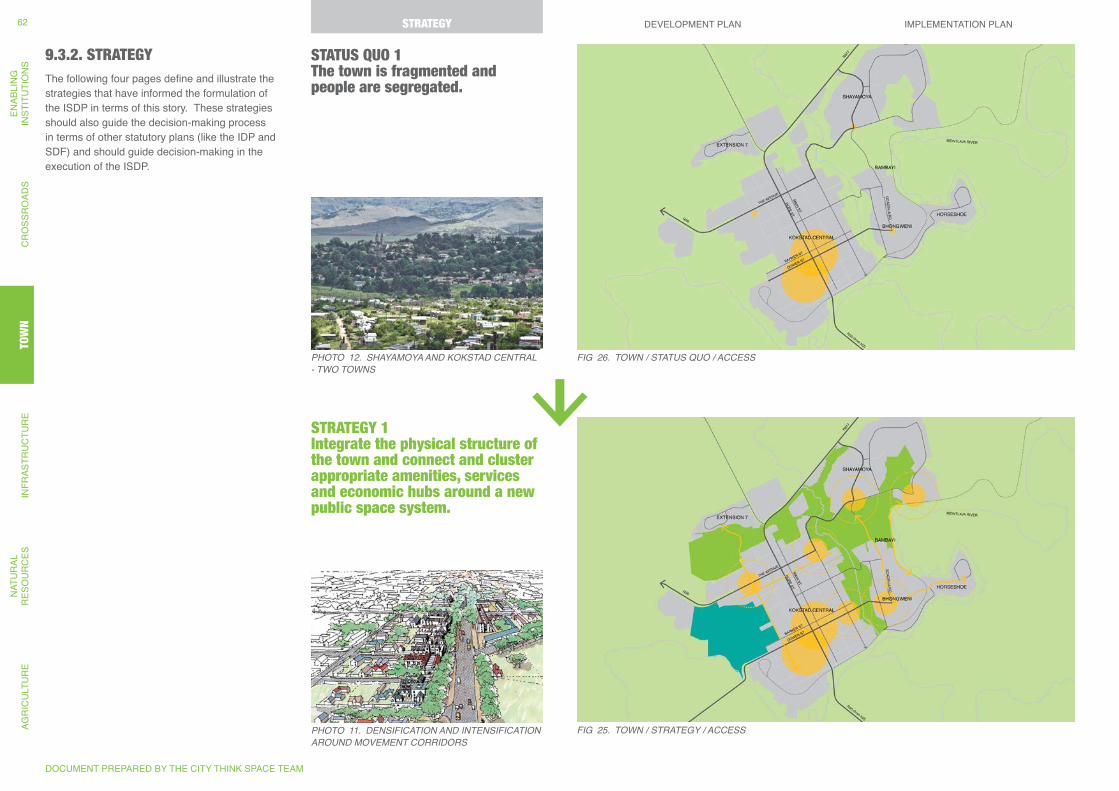
9.3.2. STRATEGYThe following four pages define and illustrate the strategies that have informed the formulation of the ISDP in terms of this story. These strategies should also guide the decision-making process in terms of other statutory plans (like the IDP and SDF) and should guide decision-making in the execution of the ISDP.
STATUS QUO 1 The town is fragmented and people are segregated.
Fig 26. TOWN / STATUS QUO / ACCESSPHOTO 12. SHAYAMOYA AND KOKSTAD CENTRAL - TWO TOWNS
STRATEGY 1 Integrate the physical structure of the town and connect and cluster appropriate amenities, services and economic hubs around a new public space system.
PHOTO 11. DENSiFiCATiON AND iNTENSiFiCATiON AROUND MOVEMENT CORRiDORS
Fig 25. TOWN / STRATEgY / ACCESS
DOCUMENT PREPARED BY THE CITY THINK SPACE TEAM
STRATEGY DEVELOPMENT PLAN IMPLEMENTATION PLANAG
RIC
ULT
UR
EN
ATU
RAL
R
ESO
UR
CES
INFR
ASTR
UC
TUR
ETO
WN
CR
OSS
RO
ADS
ENAB
LIN
GIN
STIT
UTI
ON
S62 STRATEGY
TOW
N
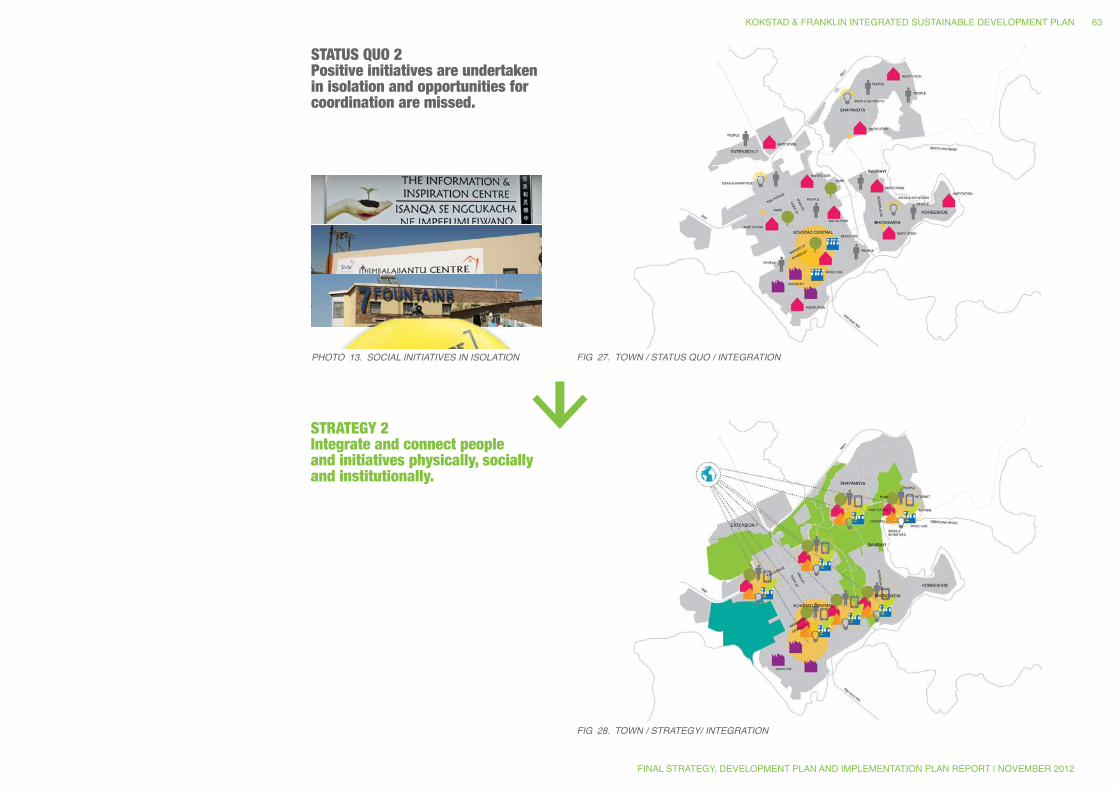
Fig 27. TOWN / STATUS QUO / iNTEgRATiON
STATUS QUO 2 Positive initiatives are undertaken in isolation and opportunities for coordination are missed.
PHOTO 13. SOCiAL iNiTiATiVES iN iSOLATiON
Fig 28. TOWN / STRATEgY/ iNTEgRATiON
STRATEGY 2 Integrate and connect people and initiatives physically, socially and institutionally.
KOKSTAD & FRANKLIN INTEGRATED SUSTAINABLE DEVELOPMENT PLAN
FINAL STRATEGY, DEVELOPMENT PLAN AND IMPLEMENTATION PLAN REPORT | NOVEMBER 2012
63

STATUS QUO 3 Kokstad’s neighbourhoods are mono-functional, mono-density, there are limited housing options, and cars are given priority over people.
PHOTO 14. LACK OF NMT FACiLiTiES, KOKSTAD Fig 29. TOWN / STATUS QUO / DiVERSiTY
STRATEGY 3 Diversify and intensify all parts of town to create complete neighbourhoods that are safe and mixed-use, providing equal access to opportunity.
Fig 30. TOWN / STRATEgY / DiVERSiTY
DOCUMENT PREPARED BY THE CITY THINK SPACE TEAM
STRATEGY DEVELOPMENT PLAN IMPLEMENTATION PLANAG
RIC
ULT
UR
EN
ATU
RAL
R
ESO
UR
CES
INFR
ASTR
UC
TUR
ETO
WN
CR
OSS
RO
ADS
ENAB
LIN
GIN
STIT
UTI
ON
S64 STRATEGY
TOW
N

KOKSTAD & FRANKLIN INTEGRATED SUSTAINABLE DEVELOPMENT PLAN
FINAL STRATEGY, DEVELOPMENT PLAN AND IMPLEMENTATION PLAN REPORT | NOVEMBER 2012
65
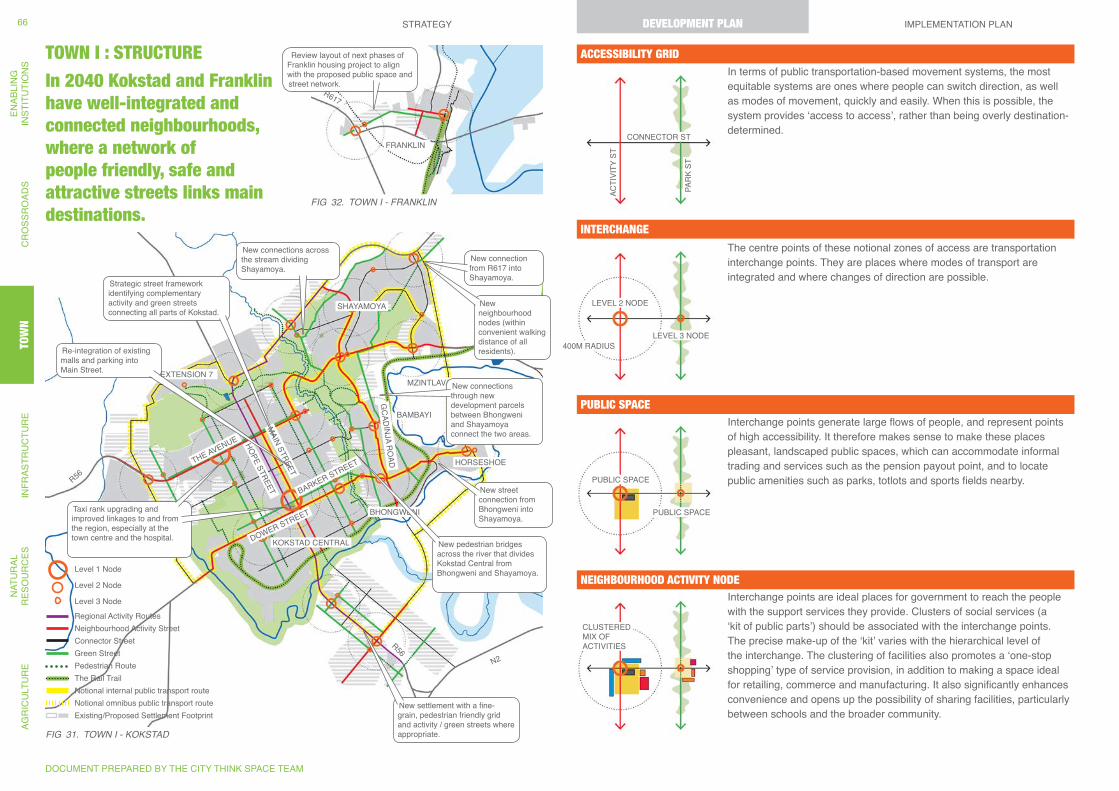
LEVEL 2 NODE
ACTI
VITY
ST
PUBLIC SPACE
CLUSTERED MIX OF ACTIVITIES
LEVEL 3 NODE400M RADIUS
PAR
K ST
PUBLIC SPACE
CONNECTOR ST
KOKSTAD CENTRAL
THE AVENUE
MAIN STREET
GCADINJA RO
AD
BARKER STREET
HOPE STREET
DOWER STREET
SHAYAMOYA
EXTENSION 7
BAMBAYI
HORSESHOE
BHONGWENI
R56
R617
R617
R56N2
MZINTLAVA RIVER
FRANKLIN
Strategic street framework identifying complementary activity and green streets connecting all parts of Kokstad.
New connections across the stream dividing Shayamoya.
Review layout of next phases of Franklin housing project to align with the proposed public space and street network.
New settlement with a fine-grain, pedestrian friendly grid and activity / green streets where appropriate.
New pedestrian bridges across the river that divides Kokstad Central from Bhongweni and Shayamoya.
New connection from R617 into Shayamoya.
New neighbourhood nodes (within convenient walking distance of all residents).
New street connection from Bhongweni into Shayamoya.
New connections through new development parcels between Bhongweni and Shayamoya connect the two areas.
Taxi rank upgrading and improved linkages to and from the region, especially at the town centre and the hospital.
Re-integration of existing malls and parking into Main Street.
The Rail Trail
Existing/Proposed Settlement Footprint
Level 2 Node
Level 1 Node
Level 3 Node
Pedestrian Route
Neighbourhood Activity StreetRegional Activity Routes
Connector Street
Notional internal public transport route
Green Street
Notional omnibus public transport route
TOWN I : STRUCTURE
In 2040 Kokstad and Franklin have well-integrated and connected neighbourhoods, where a network of people friendly, safe and attractive streets links main destinations.
In terms of public transportation-based movement systems, the most equitable systems are ones where people can switch direction, as well as modes of movement, quickly and easily. When this is possible, the system provides ‘access to access’, rather than being overly destination-determined.
The centre points of these notional zones of access are transportation interchange points. They are places where modes of transport are integrated and where changes of direction are possible.
Interchange points generate large flows of people, and represent points of high accessibility. It therefore makes sense to make these places pleasant, landscaped public spaces, which can accommodate informal trading and services such as the pension payout point, and to locate public amenities such as parks, totlots and sports fields nearby.
Interchange points are ideal places for government to reach the people with the support services they provide. Clusters of social services (a ‘kit of public parts’) should be associated with the interchange points. The precise make-up of the ‘kit’ varies with the hierarchical level of the interchange. The clustering of facilities also promotes a ‘one-stop shopping’ type of service provision, in addition to making a space ideal for retailing, commerce and manufacturing. It also significantly enhances convenience and opens up the possibility of sharing facilities, particularly between schools and the broader community.
ACCESSIBILITY GRID
INTERCHANGE
PUBLIC SPACE
NEIGHBOURHOOD ACTIVITY NODE
Fig 31. TOWN i - KOKSTAD
Fig 32. TOWN i - FRANKLiN
DOCUMENT PREPARED BY THE CITY THINK SPACE TEAM
STRATEGY DEVELOPMENT PLAN IMPLEMENTATION PLANAG
RIC
ULT
UR
EN
ATU
RAL
R
ESO
UR
CES
INFR
ASTR
UC
TUR
ETO
WN
CR
OSS
RO
ADS
ENAB
LIN
GIN
STIT
UTI
ON
S66 DEVELOPMENT PLAN
TOW
N
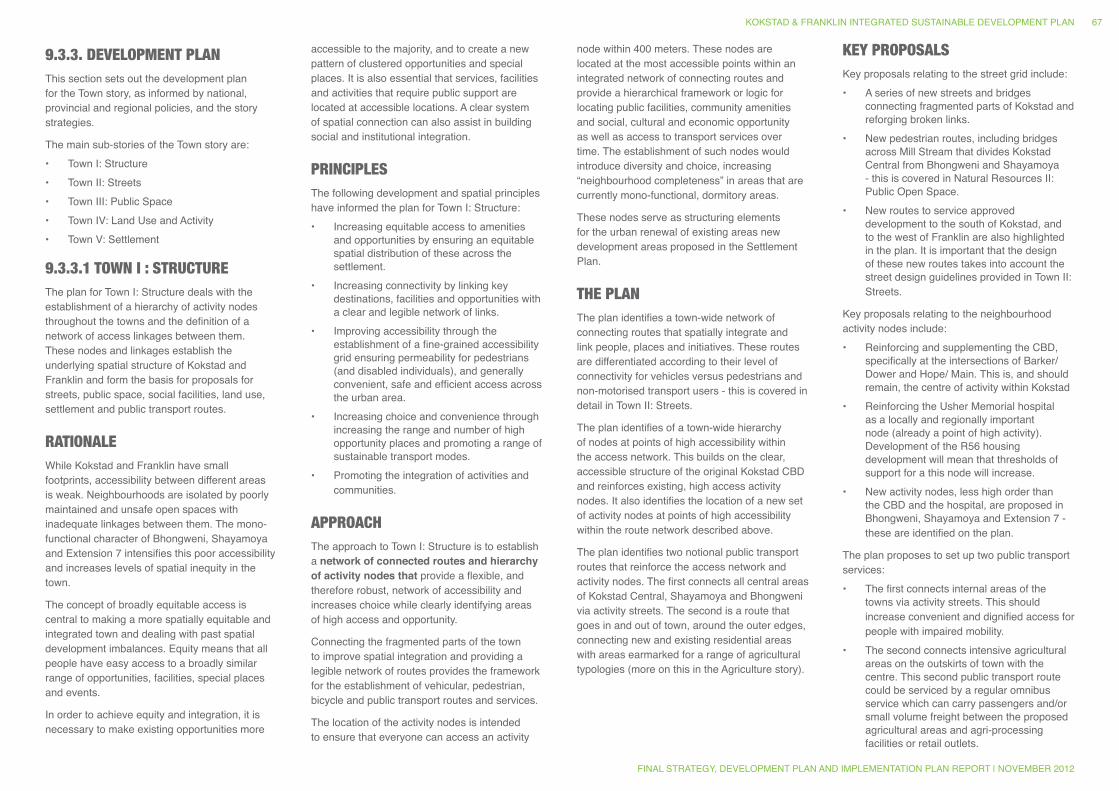
9.3.3. DEVELOPMENT PLANThis section sets out the development plan for the Town story, as informed by national, provincial and regional policies, and the story strategies.
The main sub-stories of the Town story are:• Town I: Structure• Town II: Streets• Town III: Public Space• Town IV: Land Use and Activity• Town V: Settlement
9.3.3.1 TOWN I : STRUCTUREThe plan for Town I: Structure deals with the establishment of a hierarchy of activity nodes throughout the towns and the definition of a network of access linkages between them. These nodes and linkages establish the underlying spatial structure of Kokstad and Franklin and form the basis for proposals for streets, public space, social facilities, land use, settlement and public transport routes.
RATIONALEWhile Kokstad and Franklin have small footprints, accessibility between different areas is weak. Neighbourhoods are isolated by poorly maintained and unsafe open spaces with inadequate linkages between them. The mono-functional character of Bhongweni, Shayamoya and Extension 7 intensifies this poor accessibility and increases levels of spatial inequity in the town.
The concept of broadly equitable access is central to making a more spatially equitable and integrated town and dealing with past spatial development imbalances. Equity means that all people have easy access to a broadly similar range of opportunities, facilities, special places and events.
In order to achieve equity and integration, it is necessary to make existing opportunities more
accessible to the majority, and to create a new pattern of clustered opportunities and special places. It is also essential that services, facilities and activities that require public support are located at accessible locations. A clear system of spatial connection can also assist in building social and institutional integration.
PRINCIPLES The following development and spatial principles have informed the plan for Town I: Structure:• Increasing equitable access to amenities
and opportunities by ensuring an equitable spatial distribution of these across the settlement.
• Increasing connectivity by linking key destinations, facilities and opportunities with a clear and legible network of links.
• Improving accessibility through the establishment of a fine-grained accessibility grid ensuring permeability for pedestrians (and disabled individuals), and generally convenient, safe and efficient access across the urban area.
• Increasing choice and convenience through increasing the range and number of high opportunity places and promoting a range of sustainable transport modes.
• Promoting the integration of activities and communities.
APPROACHThe approach to Town I: Structure is to establish a network of connected routes and hierarchy of activity nodes that provide a flexible, and therefore robust, network of accessibility and increases choice while clearly identifying areas of high access and opportunity.
Connecting the fragmented parts of the town to improve spatial integration and providing a legible network of routes provides the framework for the establishment of vehicular, pedestrian, bicycle and public transport routes and services.
The location of the activity nodes is intended to ensure that everyone can access an activity
node within 400 meters. These nodes are located at the most accessible points within an integrated network of connecting routes and provide a hierarchical framework or logic for locating public facilities, community amenities and social, cultural and economic opportunity as well as access to transport services over time. The establishment of such nodes would introduce diversity and choice, increasing “neighbourhood completeness” in areas that are currently mono-functional, dormitory areas.
These nodes serve as structuring elements for the urban renewal of existing areas new development areas proposed in the Settlement Plan.
THE PLAN The plan identifies a town-wide network of connecting routes that spatially integrate and link people, places and initiatives. These routes are differentiated according to their level of connectivity for vehicles versus pedestrians and non-motorised transport users - this is covered in detail in Town II: Streets.
The plan identifies of a town-wide hierarchy of nodes at points of high accessibility within the access network. This builds on the clear, accessible structure of the original Kokstad CBD and reinforces existing, high access activity nodes. It also identifies the location of a new set of activity nodes at points of high accessibility within the route network described above.
The plan identifies two notional public transport routes that reinforce the access network and activity nodes. The first connects all central areas of Kokstad Central, Shayamoya and Bhongweni via activity streets. The second is a route that goes in and out of town, around the outer edges, connecting new and existing residential areas with areas earmarked for a range of agricultural typologies (more on this in the Agriculture story).
KEY PROPOSALSKey proposals relating to the street grid include:• A series of new streets and bridges
connecting fragmented parts of Kokstad and reforging broken links.
• New pedestrian routes, including bridges across Mill Stream that divides Kokstad Central from Bhongweni and Shayamoya - this is covered in Natural Resources II: Public Open Space.
• New routes to service approved development to the south of Kokstad, and to the west of Franklin are also highlighted in the plan. It is important that the design of these new routes takes into account the street design guidelines provided in Town II: Streets.
Key proposals relating to the neighbourhood activity nodes include:• Reinforcing and supplementing the CBD,
specifically at the intersections of Barker/Dower and Hope/ Main. This is, and should remain, the centre of activity within Kokstad
• Reinforcing the Usher Memorial hospital as a locally and regionally important node (already a point of high activity). Development of the R56 housing development will mean that thresholds of support for a this node will increase.
• New activity nodes, less high order than the CBD and the hospital, are proposed in Bhongweni, Shayamoya and Extension 7 - these are identified on the plan.
The plan proposes to set up two public transport services:• The first connects internal areas of the
towns via activity streets. This should increase convenient and dignified access for people with impaired mobility.
• The second connects intensive agricultural areas on the outskirts of town with the centre. This second public transport route could be serviced by a regular omnibus service which can carry passengers and/or small volume freight between the proposed agricultural areas and agri-processing facilities or retail outlets.
KOKSTAD & FRANKLIN INTEGRATED SUSTAINABLE DEVELOPMENT PLAN
FINAL STRATEGY, DEVELOPMENT PLAN AND IMPLEMENTATION PLAN REPORT | NOVEMBER 2012
67
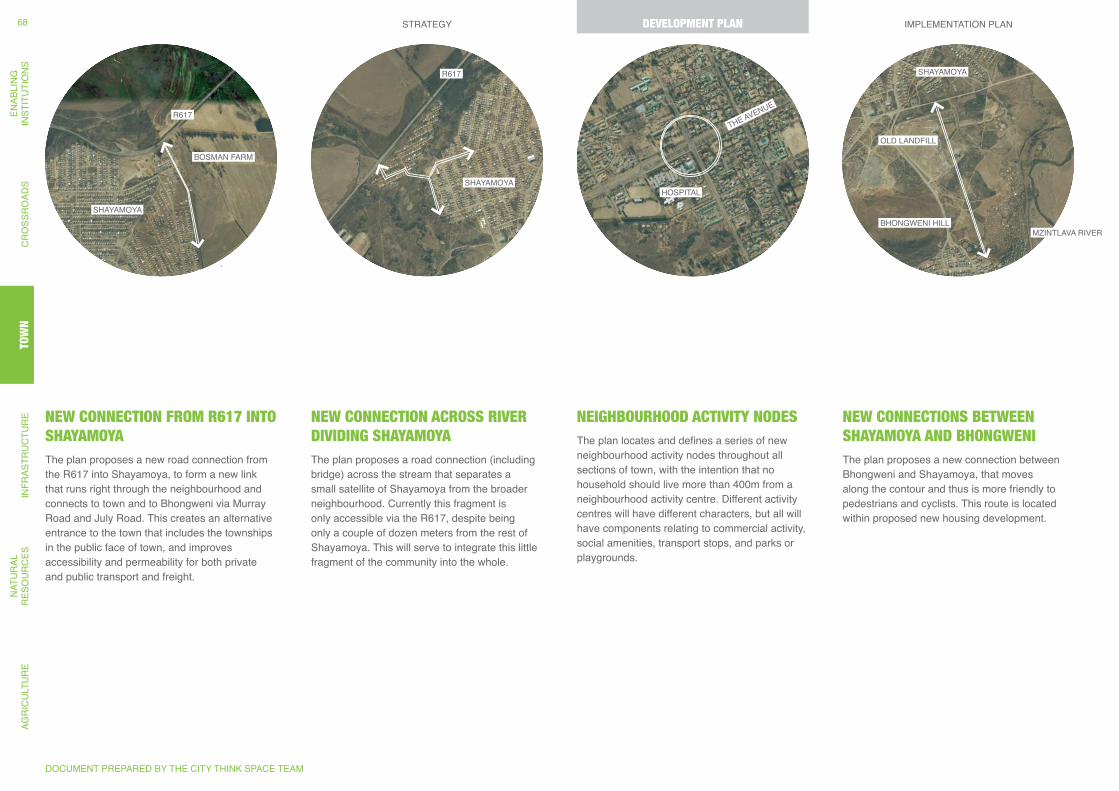
SHAYAMOYA
R617
BOSMAN FARM
R617
SHAYAMOYAHOSPITAL
SHAYAMOYA
BHONGWENI HILL
OLD LANDFILL
MZINTLAVA RIVER
THE AVENUE
NEW CONNECTION FROM R617 INTO SHAYAMOYAThe plan proposes a new road connection from the R617 into Shayamoya, to form a new link that runs right through the neighbourhood and connects to town and to Bhongweni via Murray Road and July Road. This creates an alternative entrance to the town that includes the townships in the public face of town, and improves accessibility and permeability for both private and public transport and freight.
NEW CONNECTION ACROSS RIVER DIVIDING SHAYAMOYAThe plan proposes a road connection (including bridge) across the stream that separates a small satellite of Shayamoya from the broader neighbourhood. Currently this fragment is only accessible via the R617, despite being only a couple of dozen meters from the rest of Shayamoya. This will serve to integrate this little fragment of the community into the whole.
NEIGHBOURHOOD ACTIVITY NODESThe plan locates and defines a series of new neighbourhood activity nodes throughout all sections of town, with the intention that no household should live more than 400m from a neighbourhood activity centre. Different activity centres will have different characters, but all will have components relating to commercial activity, social amenities, transport stops, and parks or playgrounds.
NEW CONNECTIONS BETWEEN SHAYAMOYA AND BHONGWENIThe plan proposes a new connection between Bhongweni and Shayamoya, that moves along the contour and thus is more friendly to pedestrians and cyclists. This route is located within proposed new housing development.
DOCUMENT PREPARED BY THE CITY THINK SPACE TEAM
STRATEGY DEVELOPMENT PLAN IMPLEMENTATION PLANAG
RIC
ULT
UR
EN
ATU
RAL
R
ESO
UR
CES
INFR
ASTR
UC
TUR
ETO
WN
CR
OSS
RO
ADS
ENAB
LIN
GIN
STIT
UTI
ON
S68 DEVELOPMENT PLAN
TOW
N
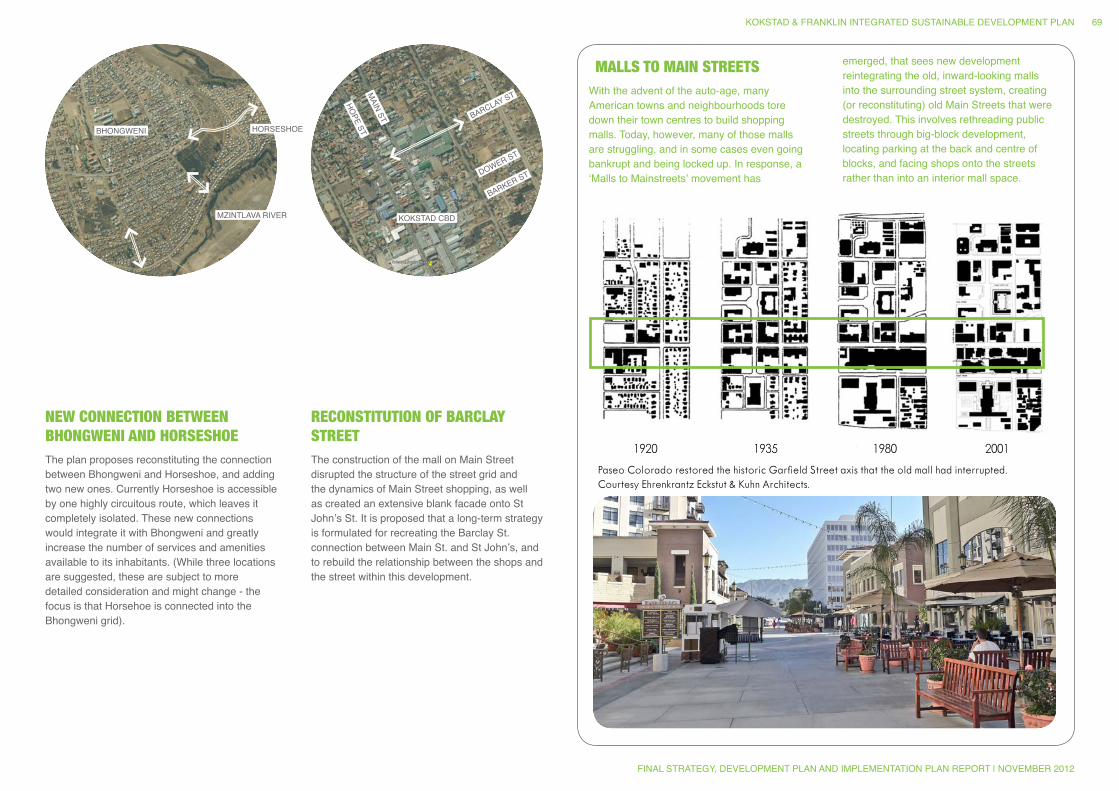
MZINTLAVA RIVER KOKSTAD CBD
MAIN ST
HOPE ST
DOWER ST
BARCLAY ST
BARKER ST
BHONGWENI HORSESHOE
serve the new mixed-use development. Belmar is served by three local and two express
bus lines, and is slated for shuttle bus service from the future Wadsworth Light Rail Sta-
tion, one mile away. Four bus lines serve Paseo Colorado. The Pasadena Arts Bus also
stops at Paseo Colorado in shuttling visitors to locations around the city. Downtown
Park Forest has bus service throughout that links the site to a Metra commuter rail sta-
tion, which connects the community to Chicago. CityPlace is two blocks from the Long
Beach Transit Mall, which is served by almost 30 bus lines and a light rail system that
connects downtown Long Beach to downtown Los Angeles.
The new mixed-use districts may serve as anchors for multi-modal transit centers,
-
en the complementary peak hours of parking demand between park-and-ride transit
users and shoppers, there are opportunities for transit agencies and retail center owners
to share parking supply and costs. Depending on where the transit lines go, the mixed-
-
tion.
The street patterns surrounding the sites are typical of the
eras during which the communities were originally built. Three
of the case study communities – Lakewood, Park Forest, and
Boca Raton – were built after World War II, primarily in the
1950s, when the automobile dominated urban transportation.
Belmar lies within a typical western grid, with large blocks and
“planned communities” in the country, was designed with cur-
vilinear streets and wide setbacks. Wide commercial boulevards
and residential streets surround Mizner Park.
Paseo Colorado, CityPlace, and Winter Park Village are
MALLS TO MAIN STREETSWith the advent of the auto-age, many American towns and neighbourhoods tore down their town centres to build shopping malls. Today, however, many of those malls are struggling, and in some cases even going bankrupt and being locked up. In response, a ‘Malls to Mainstreets’ movement has
emerged, that sees new development reintegrating the old, inward-looking malls into the surrounding street system, creating (or reconstituting) old Main Streets that were destroyed. This involves rethreading public streets through big-block development, locating parking at the back and centre of blocks, and facing shops onto the streets rather than into an interior mall space.
NEW CONNECTION BETWEEN BHONGWENI AND HORSESHOEThe plan proposes reconstituting the connection between Bhongweni and Horseshoe, and adding two new ones. Currently Horseshoe is accessible by one highly circuitous route, which leaves it completely isolated. These new connections would integrate it with Bhongweni and greatly increase the number of services and amenities available to its inhabitants. (While three locations are suggested, these are subject to more detailed consideration and might change - the focus is that Horsehoe is connected into the Bhongweni grid).
RECONSTITUTION OF BARCLAY STREETThe construction of the mall on Main Street disrupted the structure of the street grid and the dynamics of Main Street shopping, as well as created an extensive blank facade onto St John’s St. It is proposed that a long-term strategy is formulated for recreating the Barclay St. connection between Main St. and St John’s, and to rebuild the relationship between the shops and the street within this development.
KOKSTAD & FRANKLIN INTEGRATED SUSTAINABLE DEVELOPMENT PLAN
FINAL STRATEGY, DEVELOPMENT PLAN AND IMPLEMENTATION PLAN REPORT | NOVEMBER 2012
69
DEVELOPMENT & URBAN DESIGN GUIDELINESThe following development, design and land use management guidelines should be followed to ensure that the intentions of the Town Structure proposals are achieved:
REDUCE FRAGMENTATION
G New infrastructure projects, developments and urban renewal projects should be structured to increase integration between parts of town
G New developments and projects should not create barriers to access between neighbourhoods
G No dead end street networks or gated communities should be permitted
ESTABLISH AN INTEGRATED ACCESS NETWORK
G Ensure that existing areas are linked by a safe, clear/ legible system of streets and that road infrastructure planning and implementation takes into account these spatial requirements
G Structure new development with permeable access networks and limit block sizes to a maximum length of 150m for vehicles and 75m length for pedestrians.
G Dead end developments, that do not provide connecting routes into adjacent areas, should not be permitted
G Prevent the obstruction of important linking routes by large institutions or gated developments
DEVELOP AND REINFORCE THE IDENTIFIED ACTIVITY NODES
G Locate activity nodes at approximately 800m intervals and at the high access points identified in the plan
G Locate public facilities within walking distance of public transport routes and stops.
G Ensure that new social facilities are located at activity nodes
G Refer to the guidelines for land use and activity to determine the appropriate location of different types of facility
G Appropriate new commercial development should be encouraged at the identified neighbourhood activity nodes
G Refer to the guidelines for land use and activity to determine the appropriate location of different types of non-residential uses
ESTABLISH CLEAR, EFFICIENT AND SAFE PUBLIC TRANSPORT AND NON-MOTORISED TRANSPORT SYSTEMS
G Locate public transport routes and interchanges to support indentified routes and nodes
G Ensure that land use and infrastructure planning and development decisions support a range of sustainable modes of transport to support regional and local accessibility
DOCUMENT PREPARED BY THE CITY THINK SPACE TEAM
STRATEGY DEVELOPMENT PLAN IMPLEMENTATION PLANAG
RIC
ULT
UR
EN
ATU
RAL
R
ESO
UR
CES
INFR
ASTR
UC
TUR
ETO
WN
CR
OSS
RO
ADS
ENAB
LIN
GIN
STIT
UTI
ON
S70 DEVELOPMENT PLAN
TOW
N

KOKSTAD & FRANKLIN INTEGRATED SUSTAINABLE DEVELOPMENT PLAN
FINAL STRATEGY, DEVELOPMENT PLAN AND IMPLEMENTATION PLAN REPORT | NOVEMBER 2012
71
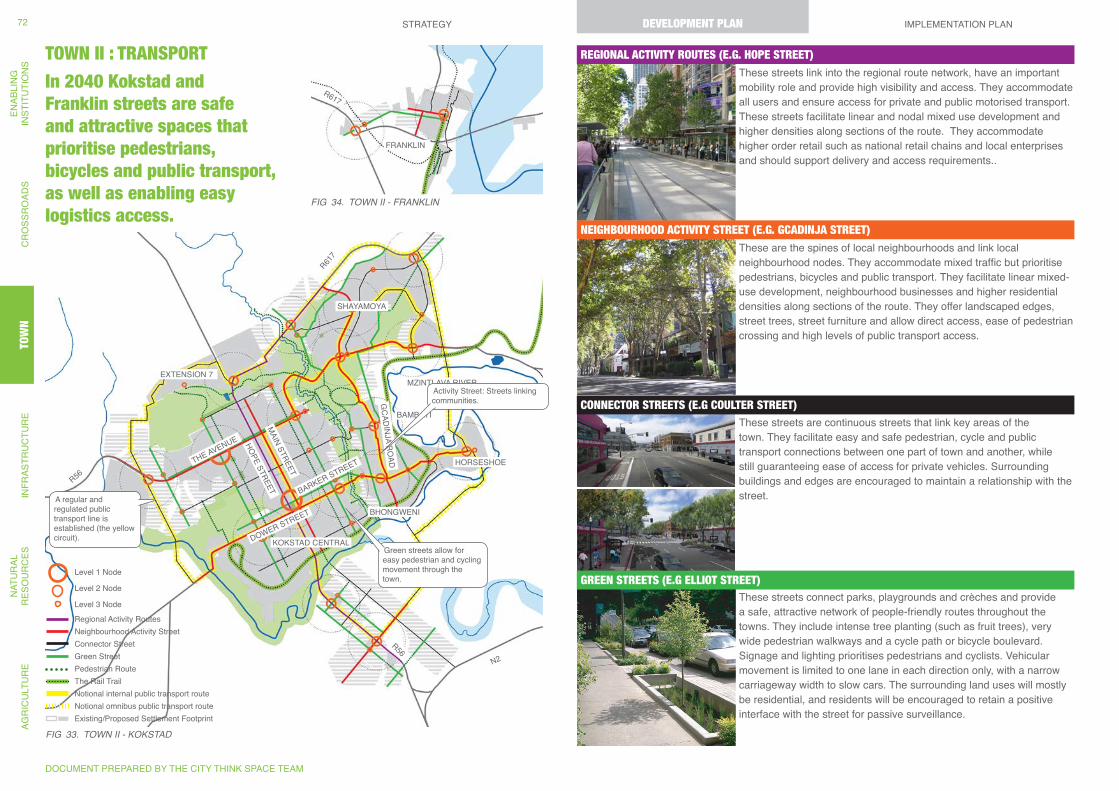
KOKSTAD CENTRAL
THE AVENUE
MAIN STREET
GCADINJA RO
AD
BARKER STREET
HOPE STREET
DOWER STREET
SHAYAMOYA
EXTENSION 7
BAMBAYI
HORSESHOE
BHONGWENI
R56
R617
R617
R56N2
MZINTLAVA RIVER
FRANKLIN
Activity Street: Streets linking communities.
Green streets allow for easy pedestrian and cycling movement through the town.
A regular and regulated public transport line is established (the yellow circuit).
The Rail Trail
Existing/Proposed Settlement Footprint
Level 2 Node
Level 1 Node
Level 3 Node
Pedestrian Route
Neighbourhood Activity StreetRegional Activity Routes
Connector Street
Notional internal public transport route
Green Street
Notional omnibus public transport route
TOWN II : TRANSPORT
In 2040 Kokstad and Franklin streets are safe and attractive spaces that prioritise pedestrians, bicycles and public transport, as well as enabling easy logistics access.
This photo-simulation illustrates how the Better Streets Plan guidelines could be applied to a typical mixed-use San Francisco street to improve the pedestrian environment
Photosimulations are for visualization purposes only, and are not intended to show specific details and dimensions
These streets link into the regional route network, have an important mobility role and provide high visibility and access. They accommodate all users and ensure access for private and public motorised transport. These streets facilitate linear and nodal mixed use development and higher densities along sections of the route. They accommodate higher order retail such as national retail chains and local enterprises and should support delivery and access requirements..
These are the spines of local neighbourhoods and link local neighbourhood nodes. They accommodate mixed traffic but prioritise pedestrians, bicycles and public transport. They facilitate linear mixed-use development, neighbourhood businesses and higher residential densities along sections of the route. They offer landscaped edges, street trees, street furniture and allow direct access, ease of pedestrian crossing and high levels of public transport access.
These streets are continuous streets that link key areas of the town. They facilitate easy and safe pedestrian, cycle and public transport connections between one part of town and another, while still guaranteeing ease of access for private vehicles. Surrounding buildings and edges are encouraged to maintain a relationship with the street.
These streets connect parks, playgrounds and crèches and provide a safe, attractive network of people-friendly routes throughout the towns. They include intense tree planting (such as fruit trees), very wide pedestrian walkways and a cycle path or bicycle boulevard. Signage and lighting prioritises pedestrians and cyclists. Vehicular movement is limited to one lane in each direction only, with a narrow carriageway width to slow cars. The surrounding land uses will mostly be residential, and residents will be encouraged to retain a positive interface with the street for passive surveillance.
GREEN STREETS (E.G ELLIOT STREET)
CONNECTOR STREETS (E.G COULTER STREET)
NEIGHBOURHOOD ACTIVITY STREET (E.G. GCADINJA STREET)
REGIONAL ACTIVITY ROUTES (E.G. HOPE STREET)
Fig 33. TOWN ii - KOKSTAD
Fig 34. TOWN ii - FRANKLiN
DOCUMENT PREPARED BY THE CITY THINK SPACE TEAM
STRATEGY DEVELOPMENT PLAN IMPLEMENTATION PLANAG
RIC
ULT
UR
EN
ATU
RAL
R
ESO
UR
CES
INFR
ASTR
UC
TUR
ETO
WN
CR
OSS
RO
ADS
ENAB
LIN
GIN
STIT
UTI
ON
S72 DEVELOPMENT PLAN
TOW
N
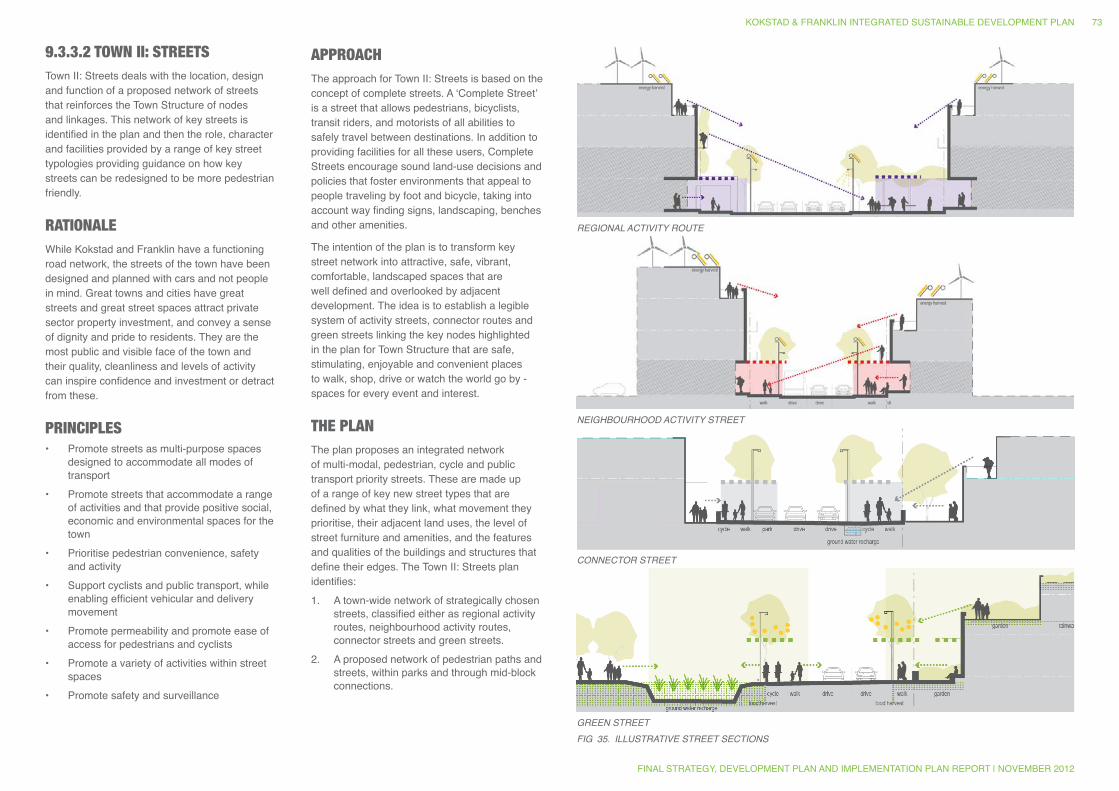
REgiONAL ACTiViTY ROUTE
NEigHBOURHOOD ACTiViTY STREET
CONNECTOR STREET
gREEN STREETFig 35. iLLUSTRATiVE STREET SECTiONS
9.3.3.2 TOWN II: STREETSTown II: Streets deals with the location, design and function of a proposed network of streets that reinforces the Town Structure of nodes and linkages. This network of key streets is identified in the plan and then the role, character and facilities provided by a range of key street typologies providing guidance on how key streets can be redesigned to be more pedestrian friendly.
RATIONALEWhile Kokstad and Franklin have a functioning road network, the streets of the town have been designed and planned with cars and not people in mind. Great towns and cities have great streets and great street spaces attract private sector property investment, and convey a sense of dignity and pride to residents. They are the most public and visible face of the town and their quality, cleanliness and levels of activity can inspire confidence and investment or detract from these.
PRINCIPLES • Promote streets as multi-purpose spaces
designed to accommodate all modes of transport
• Promote streets that accommodate a range of activities and that provide positive social, economic and environmental spaces for the town
• Prioritise pedestrian convenience, safety and activity
• Support cyclists and public transport, while enabling efficient vehicular and delivery movement
• Promote permeability and promote ease of access for pedestrians and cyclists
• Promote a variety of activities within street spaces
• Promote safety and surveillance
APPROACHThe approach for Town II: Streets is based on the concept of complete streets. A ‘Complete Street’ is a street that allows pedestrians, bicyclists, transit riders, and motorists of all abilities to safely travel between destinations. In addition to providing facilities for all these users, Complete Streets encourage sound land-use decisions and policies that foster environments that appeal to people traveling by foot and bicycle, taking into account way finding signs, landscaping, benches and other amenities.
The intention of the plan is to transform key street network into attractive, safe, vibrant, comfortable, landscaped spaces that are well defined and overlooked by adjacent development. The idea is to establish a legible system of activity streets, connector routes and green streets linking the key nodes highlighted in the plan for Town Structure that are safe, stimulating, enjoyable and convenient places to walk, shop, drive or watch the world go by - spaces for every event and interest.
THE PLAN The plan proposes an integrated network of multi-modal, pedestrian, cycle and public transport priority streets. These are made up of a range of key new street types that are defined by what they link, what movement they prioritise, their adjacent land uses, the level of street furniture and amenities, and the features and qualities of the buildings and structures that define their edges. The Town II: Streets plan identifies:1. A town-wide network of strategically chosen
streets, classified either as regional activity routes, neighbourhood activity routes, connector streets and green streets.
2. A proposed network of pedestrian paths and streets, within parks and through mid-block connections.
KOKSTAD & FRANKLIN INTEGRATED SUSTAINABLE DEVELOPMENT PLAN
FINAL STRATEGY, DEVELOPMENT PLAN AND IMPLEMENTATION PLAN REPORT | NOVEMBER 2012
73
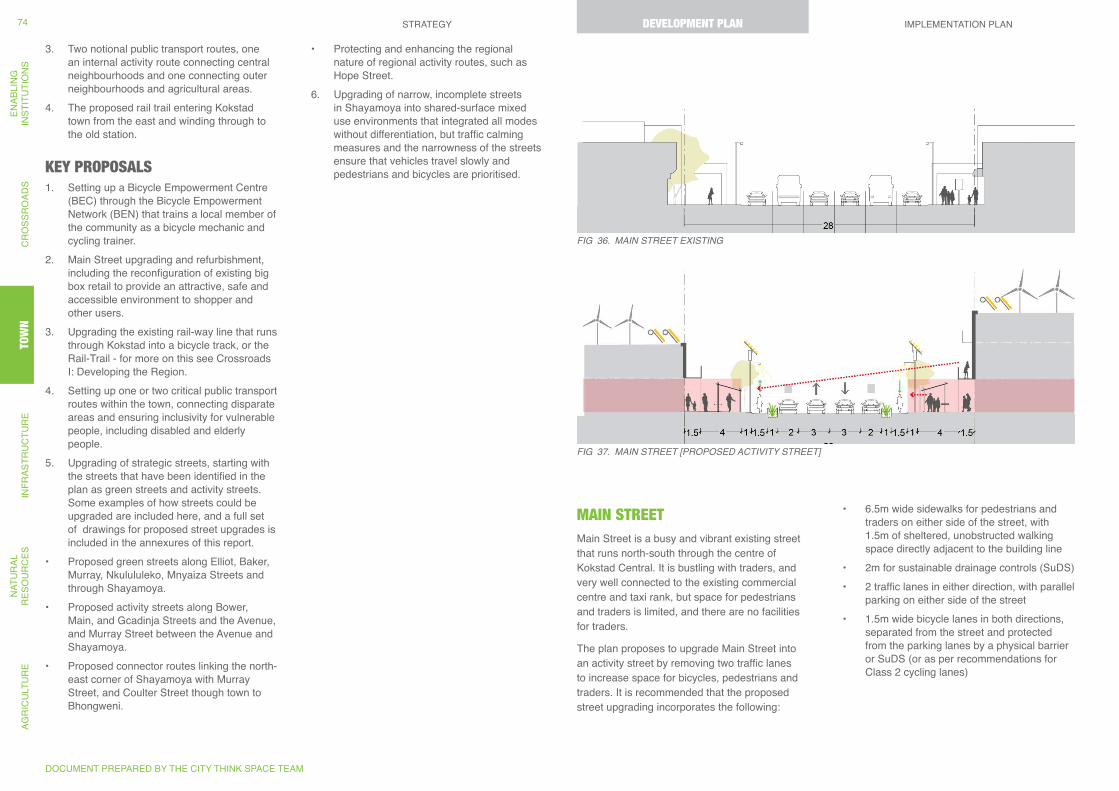
MAIN STREETMain Street is a busy and vibrant existing street that runs north-south through the centre of Kokstad Central. It is bustling with traders, and very well connected to the existing commercial centre and taxi rank, but space for pedestrians and traders is limited, and there are no facilities for traders.
The plan proposes to upgrade Main Street into an activity street by removing two traffic lanes to increase space for bicycles, pedestrians and traders. It is recommended that the proposed street upgrading incorporates the following:
• 6.5m wide sidewalks for pedestrians and traders on either side of the street, with 1.5m of sheltered, unobstructed walking space directly adjacent to the building line
• 2m for sustainable drainage controls (SuDS)• 2 traffic lanes in either direction, with parallel
parking on either side of the street• 1.5m wide bicycle lanes in both directions,
separated from the street and protected from the parking lanes by a physical barrier or SuDS (or as per recommendations for Class 2 cycling lanes)
Fig 36. MAiN STREET EXiSTiNg
Fig 37. MAiN STREET [PROPOSED ACTiViTY STREET]
3. Two notional public transport routes, one an internal activity route connecting central neighbourhoods and one connecting outer neighbourhoods and agricultural areas.
4. The proposed rail trail entering Kokstad town from the east and winding through to the old station.
KEY PROPOSALS1. Setting up a Bicycle Empowerment Centre
(BEC) through the Bicycle Empowerment Network (BEN) that trains a local member of the community as a bicycle mechanic and cycling trainer.
2. Main Street upgrading and refurbishment, including the reconfiguration of existing big box retail to provide an attractive, safe and accessible environment to shopper and other users.
3. Upgrading the existing rail-way line that runs through Kokstad into a bicycle track, or the Rail-Trail - for more on this see Crossroads I: Developing the Region.
4. Setting up one or two critical public transport routes within the town, connecting disparate areas and ensuring inclusivity for vulnerable people, including disabled and elderly people.
5. Upgrading of strategic streets, starting with the streets that have been identified in the plan as green streets and activity streets. Some examples of how streets could be upgraded are included here, and a full set of drawings for proposed street upgrades is included in the annexures of this report.
• Proposed green streets along Elliot, Baker, Murray, Nkulululeko, Mnyaiza Streets and through Shayamoya.
• Proposed activity streets along Bower, Main, and Gcadinja Streets and the Avenue, and Murray Street between the Avenue and Shayamoya.
• Proposed connector routes linking the north-east corner of Shayamoya with Murray Street, and Coulter Street though town to Bhongweni.
• Protecting and enhancing the regional nature of regional activity routes, such as Hope Street.
6. Upgrading of narrow, incomplete streets in Shayamoya into shared-surface mixed use environments that integrated all modes without differentiation, but traffic calming measures and the narrowness of the streets ensure that vehicles travel slowly and pedestrians and bicycles are prioritised.
DOCUMENT PREPARED BY THE CITY THINK SPACE TEAM
STRATEGY DEVELOPMENT PLAN IMPLEMENTATION PLANAG
RIC
ULT
UR
EN
ATU
RAL
R
ESO
UR
CES
INFR
ASTR
UC
TUR
ETO
WN
CR
OSS
RO
ADS
ENAB
LIN
GIN
STIT
UTI
ON
S74 DEVELOPMENT PLAN
TOW
N
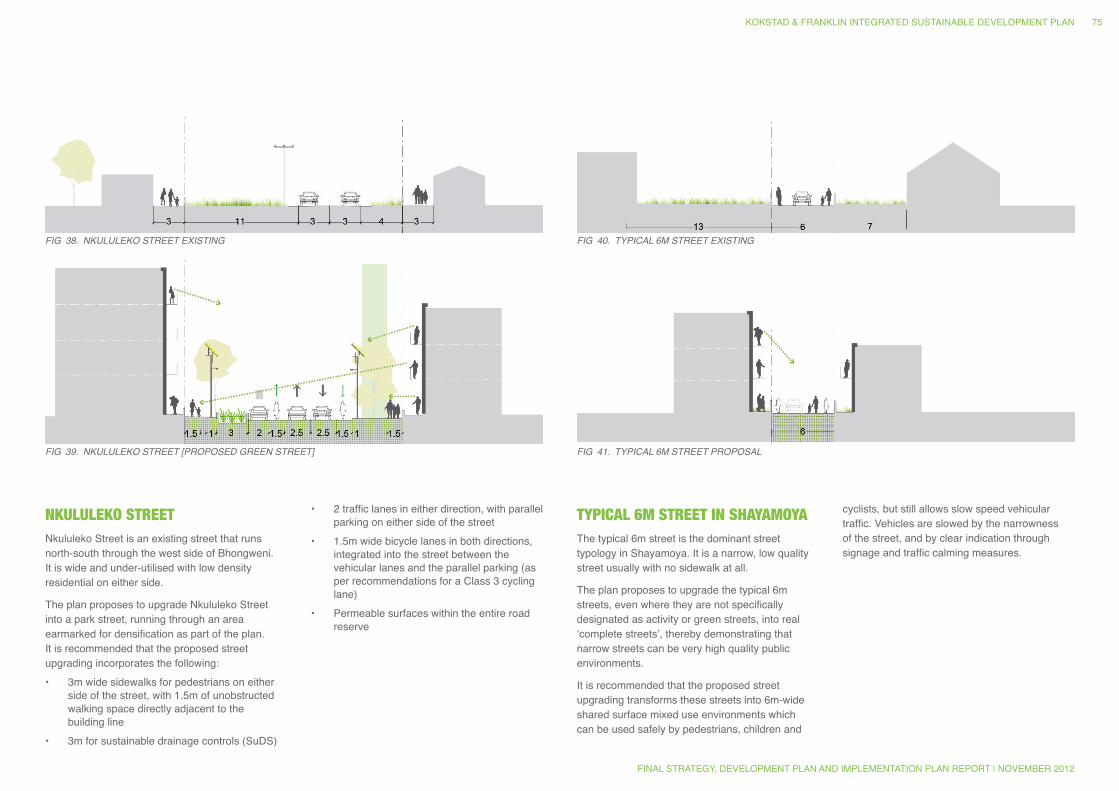
Fig 40. TYPiCAL 6M STREET EXiSTiNg
Fig 41. TYPiCAL 6M STREET PROPOSAL
Fig 38. NKULULEKO STREET EXiSTiNg
Fig 39. NKULULEKO STREET [PROPOSED gREEN STREET]
NKULULEKO STREETNkululeko Street is an existing street that runs north-south through the west side of Bhongweni. It is wide and under-utilised with low density residential on either side.
The plan proposes to upgrade Nkululeko Street into a park street, running through an area earmarked for densification as part of the plan. It is recommended that the proposed street upgrading incorporates the following:• 3m wide sidewalks for pedestrians on either
side of the street, with 1.5m of unobstructed walking space directly adjacent to the building line
• 3m for sustainable drainage controls (SuDS)
• 2 traffic lanes in either direction, with parallel parking on either side of the street
• 1.5m wide bicycle lanes in both directions, integrated into the street between the vehicular lanes and the parallel parking (as per recommendations for a Class 3 cycling lane)
• Permeable surfaces within the entire road reserve
TYPICAL 6M STREET IN SHAYAMOYAThe typical 6m street is the dominant street typology in Shayamoya. It is a narrow, low quality street usually with no sidewalk at all.
The plan proposes to upgrade the typical 6m streets, even where they are not specifically designated as activity or green streets, into real ‘complete streets’, thereby demonstrating that narrow streets can be very high quality public environments.
It is recommended that the proposed street upgrading transforms these streets into 6m-wide shared surface mixed use environments which can be used safely by pedestrians, children and
cyclists, but still allows slow speed vehicular traffic. Vehicles are slowed by the narrowness of the street, and by clear indication through signage and traffic calming measures.
KOKSTAD & FRANKLIN INTEGRATED SUSTAINABLE DEVELOPMENT PLAN
FINAL STRATEGY, DEVELOPMENT PLAN AND IMPLEMENTATION PLAN REPORT | NOVEMBER 2012
75
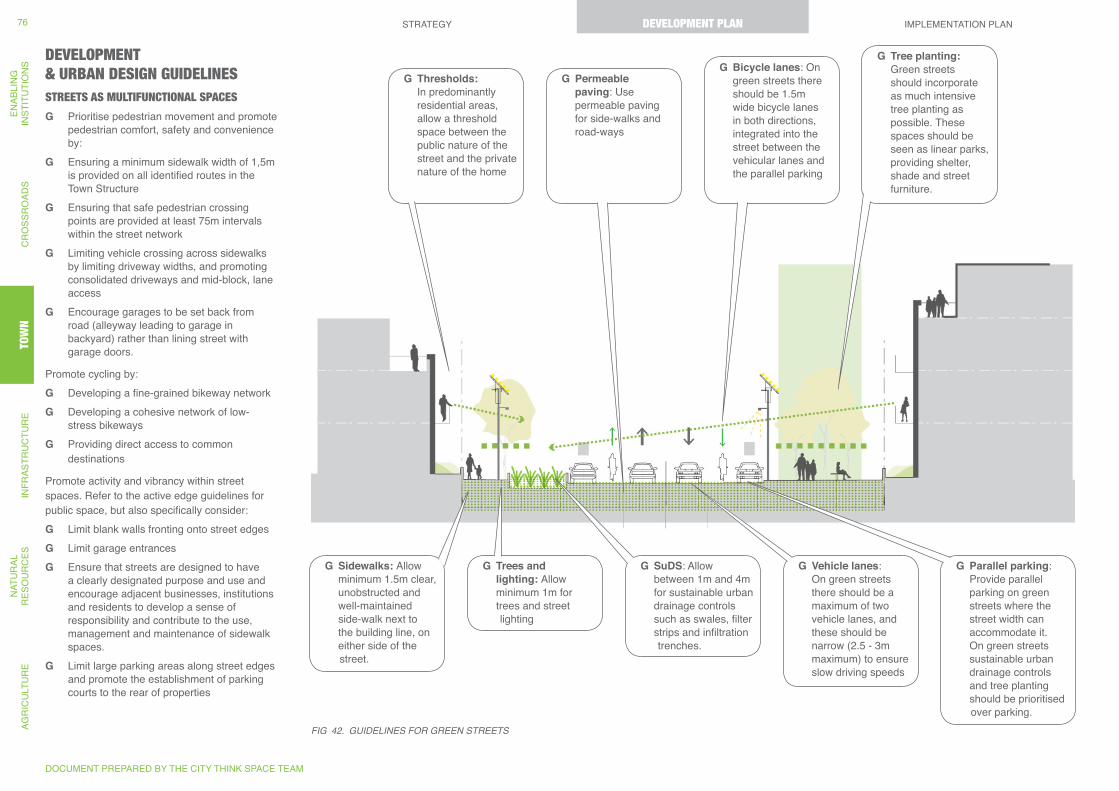
G Permeable paving: Use permeable paving for side-walks and road-ways
G Thresholds: In predominantly residential areas, allow a threshold space between the public nature of the street and the private nature of the home
G Trees and lighting: Allow minimum 1m for trees and street lighting
G Sidewalks: Allow minimum 1.5m clear, unobstructed and well-maintained side-walk next to the building line, on either side of the street.
G Parallel parking: Provide parallel parking on green streets where the street width can accommodate it. On green streets sustainable urban drainage controls and tree planting should be prioritised over parking.
G Vehicle lanes: On green streets there should be a maximum of two vehicle lanes, and these should be narrow (2.5 - 3m maximum) to ensure slow driving speeds
G SuDS: Allow between 1m and 4m for sustainable urban drainage controls such as swales, filter strips and infiltration trenches.
G Bicycle lanes: On green streets there should be 1.5m wide bicycle lanes in both directions, integrated into the street between the vehicular lanes and the parallel parking
G Tree planting: Green streets should incorporate as much intensive tree planting as possible. These spaces should be seen as linear parks, providing shelter, shade and street furniture.
DEVELOPMENT & URBAN DESIGN GUIDELINESSTREETS AS MULTIFUNCTIONAL SPACES
G Prioritise pedestrian movement and promote pedestrian comfort, safety and convenience by:
G Ensuring a minimum sidewalk width of 1,5m is provided on all identified routes in the Town Structure
G Ensuring that safe pedestrian crossing points are provided at least 75m intervals within the street network
G Limiting vehicle crossing across sidewalks by limiting driveway widths, and promoting consolidated driveways and mid-block, lane access
G Encourage garages to be set back from road (alleyway leading to garage in backyard) rather than lining street with garage doors.
Promote cycling by: G Developing a fine-grained bikeway network G Developing a cohesive network of low-
stress bikeways G Providing direct access to common
destinations
Promote activity and vibrancy within street spaces. Refer to the active edge guidelines for public space, but also specifically consider:
G Limit blank walls fronting onto street edges G Limit garage entrances G Ensure that streets are designed to have
a clearly designated purpose and use and encourage adjacent businesses, institutions and residents to develop a sense of responsibility and contribute to the use, management and maintenance of sidewalk spaces.
G Limit large parking areas along street edges and promote the establishment of parking courts to the rear of properties
Fig 42. gUiDELiNES FOR gREEN STREETS
DOCUMENT PREPARED BY THE CITY THINK SPACE TEAM
STRATEGY DEVELOPMENT PLAN IMPLEMENTATION PLANAG
RIC
ULT
UR
EN
ATU
RAL
R
ESO
UR
CES
INFR
ASTR
UC
TUR
ETO
WN
CR
OSS
RO
ADS
ENAB
LIN
GIN
STIT
UTI
ON
S76
TOW
NDEVELOPMENT PLAN
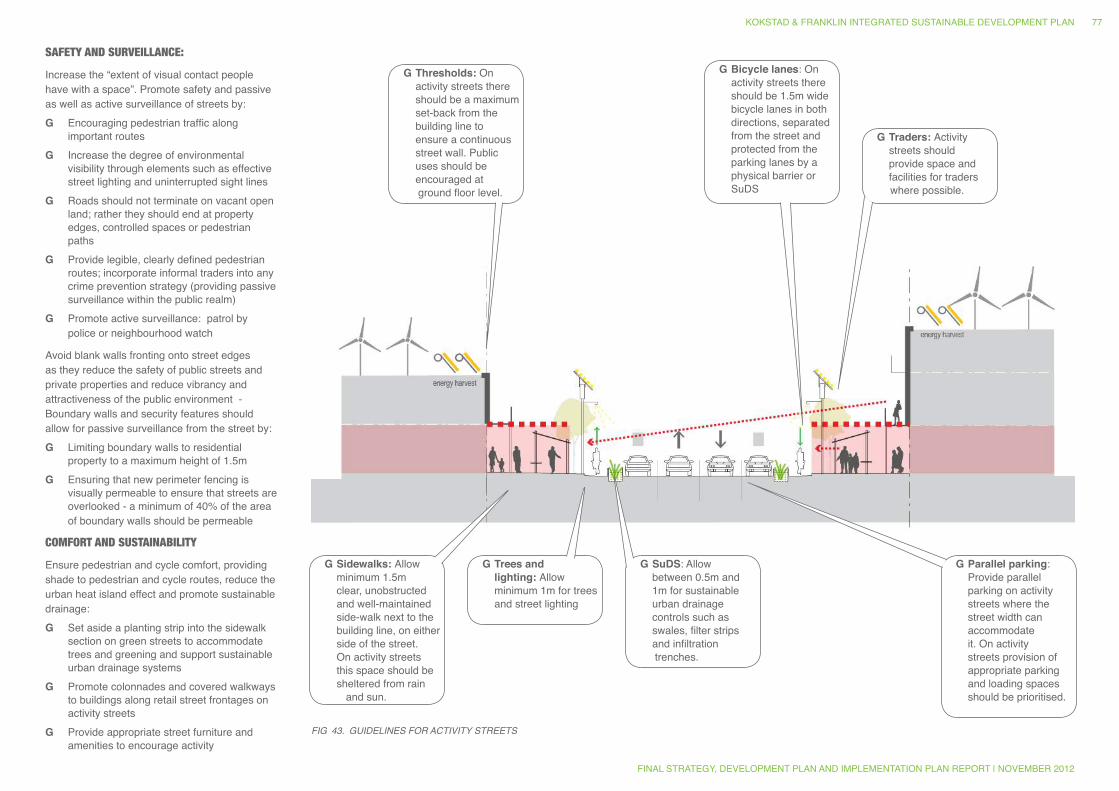
G Thresholds: On activity streets there should be a maximum set-back from the building line to ensure a continuous street wall. Public uses should be encouraged at ground floor level.
G Trees and lighting: Allow minimum 1m for trees and street lighting
G Sidewalks: Allow minimum 1.5m clear, unobstructed and well-maintained side-walk next to the building line, on either side of the street. On activity streets this space should be sheltered from rain
and sun.
G Parallel parking: Provide parallel parking on activity streets where the street width can accommodate it. On activity streets provision of appropriate parking and loading spaces should be prioritised.
G SuDS: Allow between 0.5m and 1m for sustainable urban drainage controls such as swales, filter strips and infiltration trenches.
G Bicycle lanes: On activity streets there should be 1.5m wide bicycle lanes in both directions, separated from the street and protected from the parking lanes by a physical barrier or SuDS
G Traders: Activity streets should provide space and facilities for traders where possible.
SAFETY AND SURVEILLANCE:
Increase the “extent of visual contact people have with a space”. Promote safety and passive as well as active surveillance of streets by:
G Encouraging pedestrian traffic along important routes
G Increase the degree of environmental visibility through elements such as effective street lighting and uninterrupted sight lines
G Roads should not terminate on vacant open land; rather they should end at property edges, controlled spaces or pedestrian paths
G Provide legible, clearly defined pedestrian routes; incorporate informal traders into any crime prevention strategy (providing passive surveillance within the public realm)
G Promote active surveillance: patrol by police or neighbourhood watch
Avoid blank walls fronting onto street edges as they reduce the safety of public streets and private properties and reduce vibrancy and attractiveness of the public environment - Boundary walls and security features should allow for passive surveillance from the street by:
G Limiting boundary walls to residential property to a maximum height of 1.5m
G Ensuring that new perimeter fencing is visually permeable to ensure that streets are overlooked - a minimum of 40% of the area of boundary walls should be permeable
COMFORT AND SUSTAINABILITY
Ensure pedestrian and cycle comfort, providing shade to pedestrian and cycle routes, reduce the urban heat island effect and promote sustainable drainage:
G Set aside a planting strip into the sidewalk section on green streets to accommodate trees and greening and support sustainable urban drainage systems
G Promote colonnades and covered walkways to buildings along retail street frontages on activity streets
G Provide appropriate street furniture and amenities to encourage activity
Fig 43. gUiDELiNES FOR ACTiViTY STREETS
KOKSTAD & FRANKLIN INTEGRATED SUSTAINABLE DEVELOPMENT PLAN
FINAL STRATEGY, DEVELOPMENT PLAN AND IMPLEMENTATION PLAN REPORT | NOVEMBER 2012
77
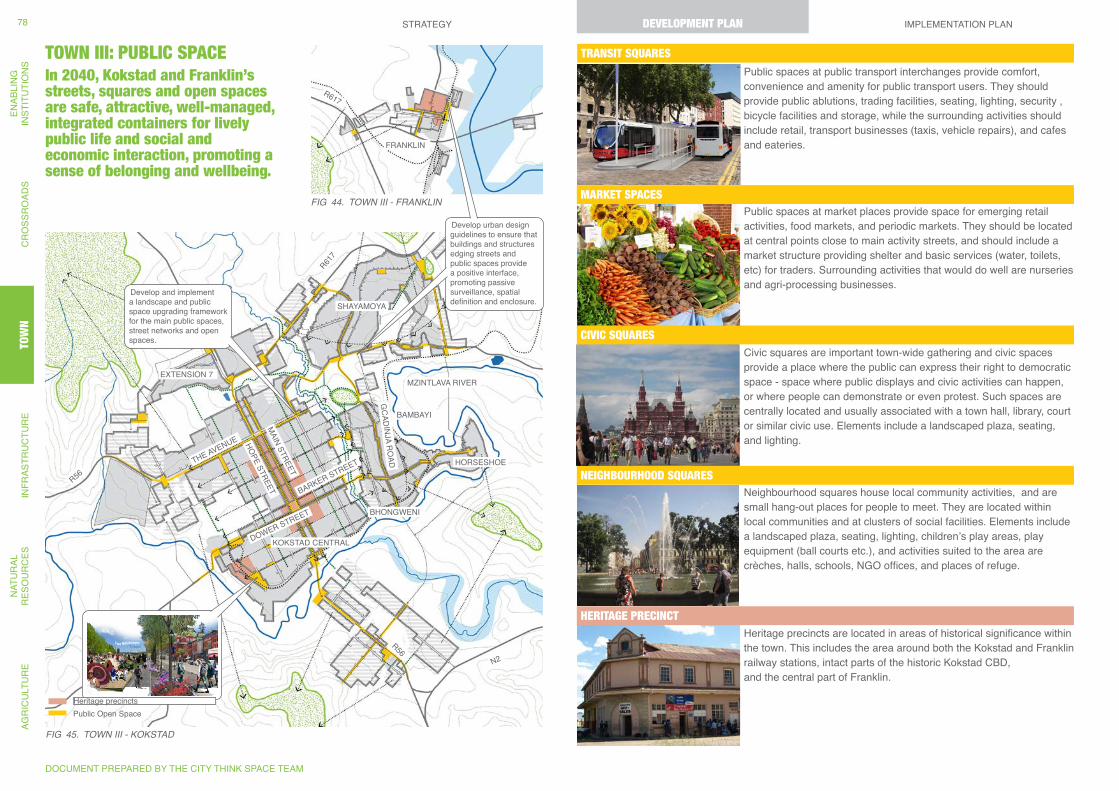
Fig 44. TOWN iii - FRANKLiN
Fig 45. TOWN iii - KOKSTAD
KOKSTAD CENTRAL
THE AVENUE
MAIN STREET
GCADINJA RO
AD
BARKER STREET
HOPE STREET
DOWER STREET
SHAYAMOYA
EXTENSION 7
BAMBAYI
HORSESHOE
BHONGWENI
R56
R617
R617
R56N2
MZINTLAVA RIVER
FRANKLIN
Develop urban design guidelines to ensure that buildings and structures edging streets and public spaces provide a positive interface, promoting passive surveillance, spatial definition and enclosure.
Develop and implement a landscape and public space upgrading framework for the main public spaces, street networks and open spaces.
Public Open SpaceHeritage precincts
TOWN III: PUBLIC SPACEIn 2040, Kokstad and Franklin’s streets, squares and open spaces are safe, attractive, well-managed, integrated containers for lively public life and social and economic interaction, promoting a sense of belonging and wellbeing.
Public spaces at public transport interchanges provide comfort, convenience and amenity for public transport users. They should provide public ablutions, trading facilities, seating, lighting, security , bicycle facilities and storage, while the surrounding activities should include retail, transport businesses (taxis, vehicle repairs), and cafes and eateries.
Public spaces at market places provide space for emerging retail activities, food markets, and periodic markets. They should be located at central points close to main activity streets, and should include a market structure providing shelter and basic services (water, toilets, etc) for traders. Surrounding activities that would do well are nurseries and agri-processing businesses.
Civic squares are important town-wide gathering and civic spaces provide a place where the public can express their right to democratic space - space where public displays and civic activities can happen, or where people can demonstrate or even protest. Such spaces are centrally located and usually associated with a town hall, library, court or similar civic use. Elements include a landscaped plaza, seating, and lighting.
Heritage precincts are located in areas of historical significance within the town. This includes the area around both the Kokstad and Franklin railway stations, intact parts of the historic Kokstad CBD, and the central part of Franklin.
Neighbourhood squares house local community activities, and are small hang-out places for people to meet. They are located within local communities and at clusters of social facilities. Elements include a landscaped plaza, seating, lighting, children’s play areas, play equipment (ball courts etc.), and activities suited to the area are crèches, halls, schools, NGO offices, and places of refuge.
TRANSIT SQUARES
MARKET SPACES
CIVIC SQUARES
NEIGHBOURHOOD SQUARES
HERITAGE PRECINCT
DOCUMENT PREPARED BY THE CITY THINK SPACE TEAM
STRATEGY DEVELOPMENT PLAN IMPLEMENTATION PLANAG
RIC
ULT
UR
EN
ATU
RAL
R
ESO
UR
CES
INFR
ASTR
UC
TUR
ETO
WN
CR
OSS
RO
ADS
ENAB
LIN
GIN
STIT
UTI
ON
S78
TOW
NDEVELOPMENT PLAN
9.3.3.3 TOWN III: PUBLIC SPACEThe “public realm” is the shared environment within cities and towns such as sidewalks, streets, squares, open spaces, parks plazas, and so on. Town Public Space deals with the location and design principles for urban public spaces that are surfaced spaces including landscaping, seating and lighting. These spaces include civic, market and community squares and spaces.
RATIONALEKokstad & Franklin suffer from a lack of investment in their public spaces and streets. Streets lack sidewalks and the towns as a whole have no dignified civic spaces to enable social interaction, a key ingredient to breaking down the socio-economic and racial barriers of the communities of Kokstad and Franklin. To build a strong sense of place and identity for all, it is important that the unique qualities and characteristics of Kokstad, including its streets and spaces, heritage buildings and precincts, unique cultural history, attractive views and vistas and leafy streets are enhanced.
Public space is the container for public life and the foundation for healthy social, economic and civic interaction and communication. A well-designed public realm encourages and enables human interaction. Public spaces offer places where people can connect, celebrate, exchange ideas and goods – they are essential to the collective identity and social vitality of towns. Good quality, welcoming public spaces also provide relief from overcrowding and small homes and enable all citizens, wealthy or not, to live in dignified circumstances. All neighbourhoods require appropriate and authentic public places that are accessible to all.
In general terms, the public environment is important because it:• Binds together social and physical
circumstances within a city or town;
• Provides the potential for a comprehensive integrated view of public management responsibilities and initiatives;
• Accommodates the broadest cross-section of society. As such, it is a genuine meeting ground, where people from all walks of life can interact;
• Complements the private domains of the city. Public space provides a medium for personal encounters. For this reason, a healthy public domain is essential for private interests as well as the public good;
• Helps define character. The city is experienced as an array of streets, squares, parks, gardens, laneways and alleys. These public spaces give structure and coherence to what would otherwise appear to be a chaotic collection of unrelated incidents; and
• Performs an important symbolic role. It helps to record the origins and aspirations of a community, and it provides the primary venue for civic occasions.
A good public environment doesn’t happen by chance. It requires care, skill and attention in its creation and management. It can always be improved.
PRINCIPLES The central development principles that guide Town 3: Public Space are:• Ensuring the clear spatial definition and
delineation of public space.• Promoting a legible system of public spaces
that assists people to find their way around, guides appropriate land use, investment and activities.
• Promoting safe and active public spaces.• Promote a sense of place and identity in the
public environment through the design of public space that celebrates and enhances local character, culture, heritage and events.
• Developing a diverse range of different public space types that have a clear role and character.
• Promote and enable the multi-functional use of urban public spaces.
APPROACHThe approach proposed is to develop the public realm as people-friendly, high-quality, attractive, safe and well-landscaped public spaces that add to the attraction of Kokstad and Franklin. Over time, the intention is to establish a town-wide system of urban public spaces and streets that are comfortable, climate-sensitive, safe, attractive and active. The Public Space plan is intended to guide the realisation of these spaces over time informing public, community and corporate investment in the construction of the spaces themselves. The plan should also be a guide to land management, ensuring that changes to land uses, buildings and structures defining these planned public spaces are appropriate. The supporting guidelines are intended to assist with this.
Great public spaces have the following characteristics and features: They• Promote human contact and social
activities;• Are safe, welcoming, and accommodating
for all users;• Have design and architectural features that
are visually interesting;• Promote community involvement;• Reflect the local culture or history;• Relate well to bordering uses;• Are well-maintained;
• Have a unique or special character.
THE PLAN The plan proposed a system of high quality, well-defined system of urban public spaces located at the activity nodes identified in the Town Structure map. These establish a hierarchy of landscaped public spaces, including major new civic spaces and market squares as well as small, localised neighbourhood spaces. These spaces are seen as urban public spaces that can accommodate a range of activities and events depending on their context and surrounding land uses.
The aim is to increase the amount of space within or immediately adjacent to the town that is made up of managed and maintained quality public places and to ensure that no person needs to walk more than 400 meters to find a public space.
This is an ambitious target, given that Kokstad and Franklin currently have no meaningful, quality urban public spaces so achieving the plan would require the establishment of an entirely new system of public spaces.
KEY PROPOSALSWhile an overall upgrading of public spaces are proposed, there are some key spaces that should be prioritised:• Gateway spaces that reinforce and bring
activity to the edges of the proposed Green Heart Park .
• Heritage spaces supporting the proposed Station Heritage Precincts.
• A market square at the current entrance to Kokstad town from the N2.
• Neighbourhood squares at existing or proposed community facilities such as schools, libraries, NGOs, etc.
• Transit squares at public transport interchanges.
Depending on the local context, the upgrade can take the form a fully-fledged public plaza, or simply be a pedestrian-friendly section of street, complete with wide sidewalks, street furniture, and appropriate amenities.
KOKSTAD & FRANKLIN INTEGRATED SUSTAINABLE DEVELOPMENT PLAN
FINAL STRATEGY, DEVELOPMENT PLAN AND IMPLEMENTATION PLAN REPORT | NOVEMBER 2012
79
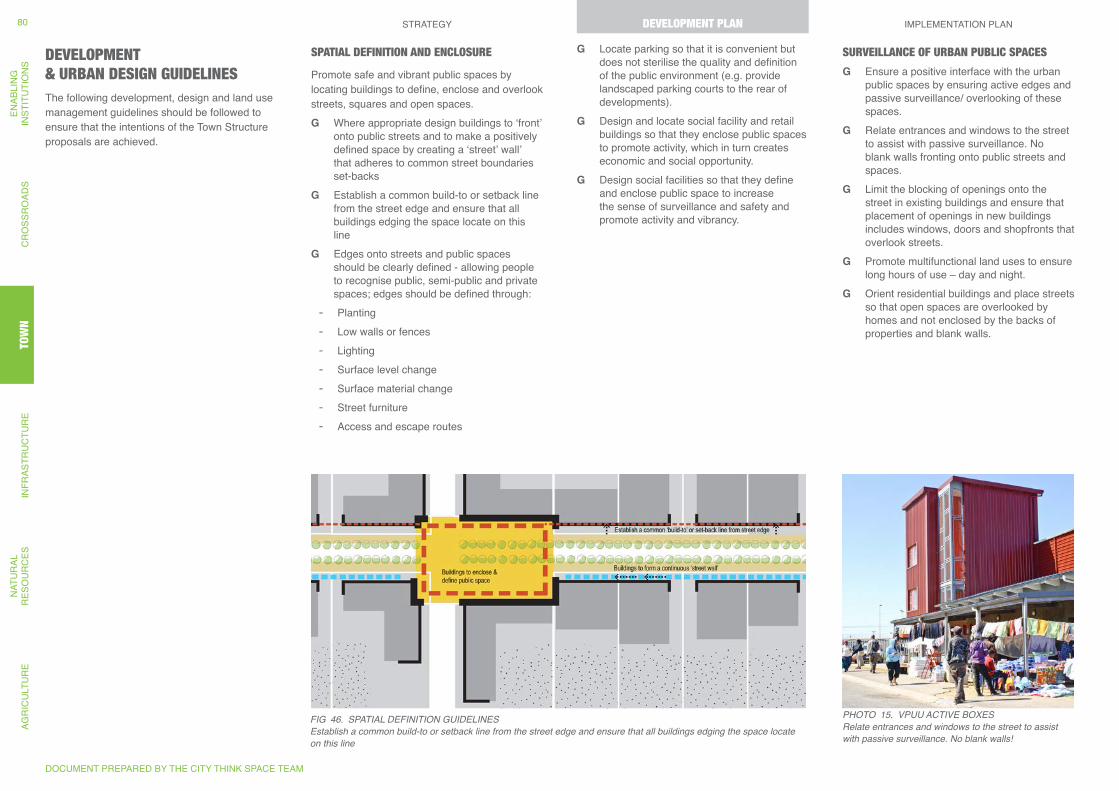
PHOTO 15. VPUU ACTiVE BOXESRelate entrances and windows to the street to assist with passive surveillance. No blank walls!
Fig 46. SPATiAL DEFiNiTiON gUiDELiNESEstablish a common build-to or setback line from the street edge and ensure that all buildings edging the space locate on this line
DEVELOPMENT & URBAN DESIGN GUIDELINESThe following development, design and land use management guidelines should be followed to ensure that the intentions of the Town Structure proposals are achieved.
SPATIAL DEFINITION AND ENCLOSURE
Promote safe and vibrant public spaces by locating buildings to define, enclose and overlook streets, squares and open spaces.
G Where appropriate design buildings to ‘front’ onto public streets and to make a positively defined space by creating a ‘street’ wall’ that adheres to common street boundaries set-backs
G Establish a common build-to or setback line from the street edge and ensure that all buildings edging the space locate on this line
G Edges onto streets and public spaces should be clearly defined - allowing people to recognise public, semi-public and private spaces; edges should be defined through:
- Planting - Low walls or fences - Lighting - Surface level change - Surface material change - Street furniture - Access and escape routes
SURVEILLANCE OF URBAN PUBLIC SPACES
G Ensure a positive interface with the urban public spaces by ensuring active edges and passive surveillance/ overlooking of these spaces.
G Relate entrances and windows to the street to assist with passive surveillance. No blank walls fronting onto public streets and spaces.
G Limit the blocking of openings onto the street in existing buildings and ensure that placement of openings in new buildings includes windows, doors and shopfronts that overlook streets.
G Promote multifunctional land uses to ensure long hours of use – day and night.
G Orient residential buildings and place streets so that open spaces are overlooked by homes and not enclosed by the backs of properties and blank walls.
G Locate parking so that it is convenient but does not sterilise the quality and definition of the public environment (e.g. provide landscaped parking courts to the rear of developments).
G Design and locate social facility and retail buildings so that they enclose public spaces to promote activity, which in turn creates economic and social opportunity.
G Design social facilities so that they define and enclose public space to increase the sense of surveillance and safety and promote activity and vibrancy.
DOCUMENT PREPARED BY THE CITY THINK SPACE TEAM
STRATEGY DEVELOPMENT PLAN IMPLEMENTATION PLANAG
RIC
ULT
UR
EN
ATU
RAL
R
ESO
UR
CES
INFR
ASTR
UC
TUR
ETO
WN
CR
OSS
RO
ADS
ENAB
LIN
GIN
STIT
UTI
ON
S80
TOW
NDEVELOPMENT PLAN
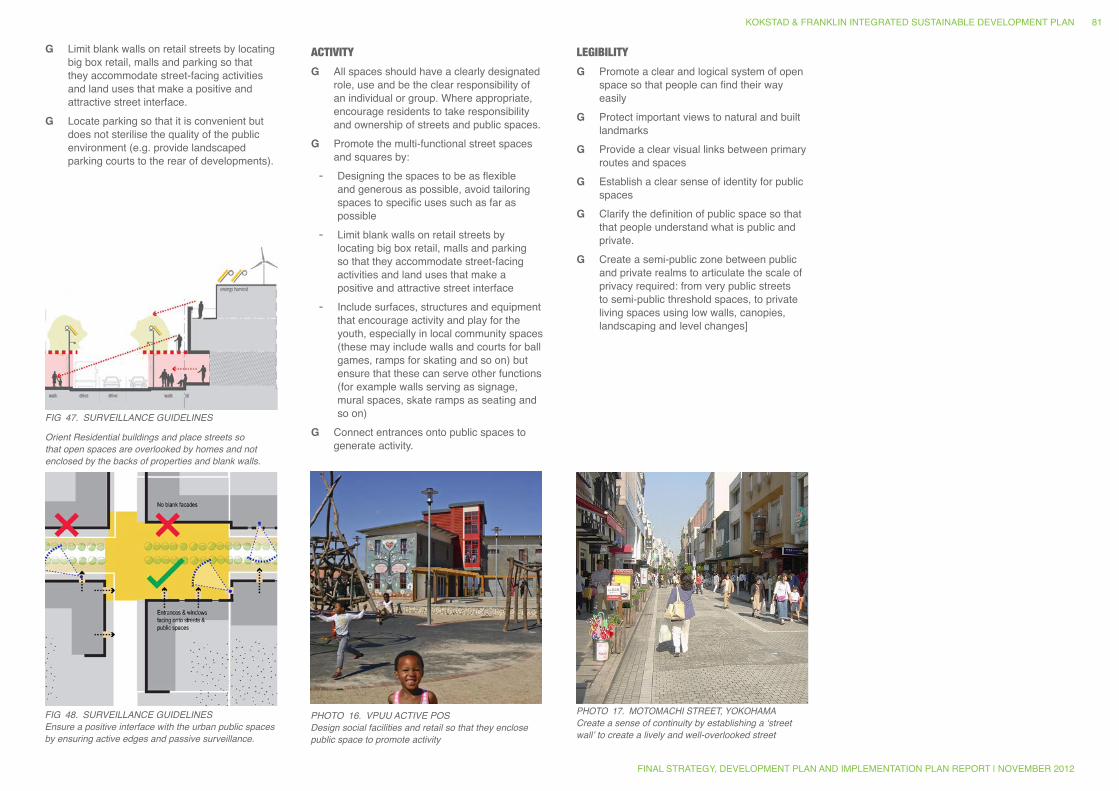
Fig 47. SURVEiLLANCE gUiDELiNES
Orient Residential buildings and place streets so that open spaces are overlooked by homes and not enclosed by the backs of properties and blank walls.
Fig 48. SURVEiLLANCE gUiDELiNESEnsure a positive interface with the urban public spaces by ensuring active edges and passive surveillance.
PHOTO 16. VPUU ACTiVE POSDesign social facilities and retail so that they enclose public space to promote activity
PHOTO 17. MOTOMACHi STREET, YOKOHAMACreate a sense of continuity by establishing a ‘street wall’ to create a lively and well-overlooked street
ACTIVITY
G All spaces should have a clearly designated role, use and be the clear responsibility of an individual or group. Where appropriate, encourage residents to take responsibility and ownership of streets and public spaces.
G Promote the multi-functional street spaces and squares by:
- Designing the spaces to be as flexible and generous as possible, avoid tailoring spaces to specific uses such as far as possible
- Limit blank walls on retail streets by locating big box retail, malls and parking so that they accommodate street-facing activities and land uses that make a positive and attractive street interface
- Include surfaces, structures and equipment that encourage activity and play for the youth, especially in local community spaces (these may include walls and courts for ball games, ramps for skating and so on) but ensure that these can serve other functions (for example walls serving as signage, mural spaces, skate ramps as seating and so on)
G Connect entrances onto public spaces to generate activity.
LEGIBILITY
G Promote a clear and logical system of open space so that people can find their way easily
G Protect important views to natural and built landmarks
G Provide a clear visual links between primary routes and spaces
G Establish a clear sense of identity for public spaces
G Clarify the definition of public space so that that people understand what is public and private.
G Create a semi-public zone between public and private realms to articulate the scale of privacy required: from very public streets to semi-public threshold spaces, to private living spaces using low walls, canopies, landscaping and level changes]
G Limit blank walls on retail streets by locating big box retail, malls and parking so that they accommodate street-facing activities and land uses that make a positive and attractive street interface.
G Locate parking so that it is convenient but does not sterilise the quality of the public environment (e.g. provide landscaped parking courts to the rear of developments).
KOKSTAD & FRANKLIN INTEGRATED SUSTAINABLE DEVELOPMENT PLAN
FINAL STRATEGY, DEVELOPMENT PLAN AND IMPLEMENTATION PLAN REPORT | NOVEMBER 2012
81
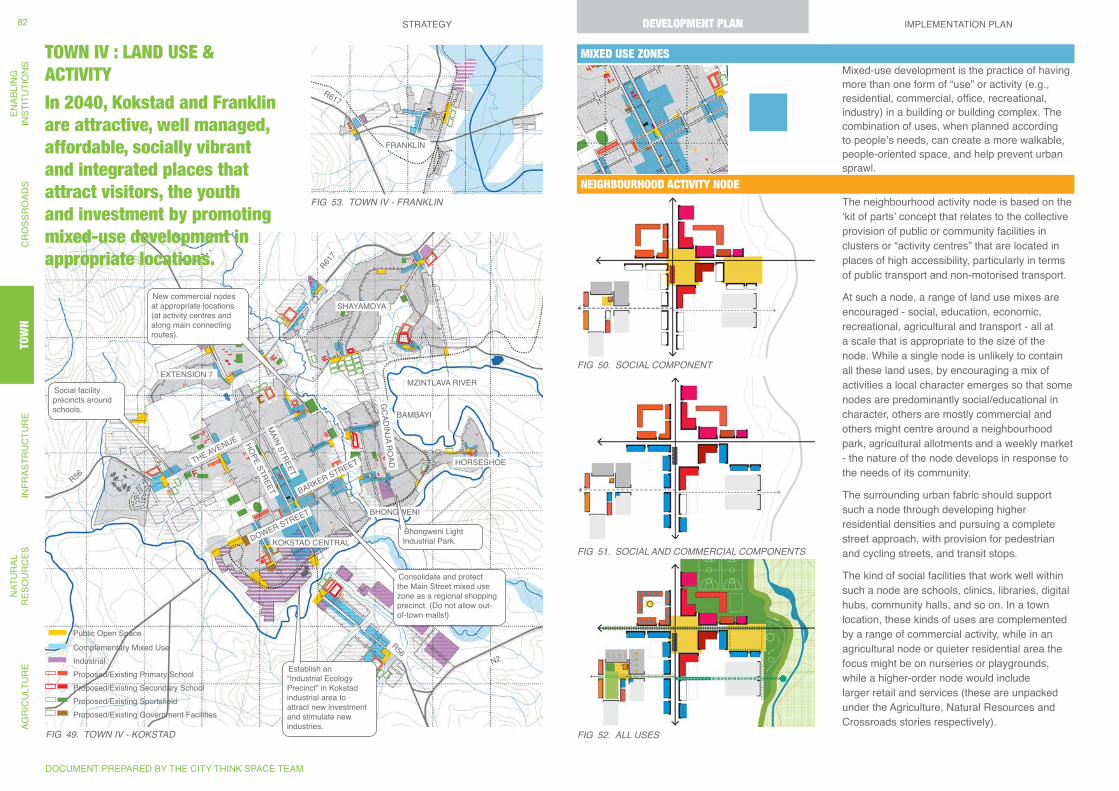
KOKSTAD CENTRAL
THE AVENUE
MAIN STREET
GCADINJA RO
AD
BARKER STREET
HOPE STREET
DOWER STREET
SHAYAMOYA
EXTENSION 7
BAMBAYI
HORSESHOE
BHONGWENI
R56
R617
R617
R56N2
MZINTLAVA RIVER
FRANKLIN
Establish an “Industrial Ecology Precinct” in Kokstad industrial area to attract new investment and stimulate new industries.
Consolidate and protect the Main Street mixed use zone as a regional shopping precinct. (Do not allow out-of-town malls!)
Social facility precincts around schools.
New commercial nodes at appropriate locations (at activity centres and along main connecting routes).
Bhongweni Light Industrial Park.
Proposed/Existing Primary SchoolProposed/Existing Secondary SchoolProposed/Existing SportsfieldProposed/Existing Government Facilities
Complementary Mixed UseIndustrial
Public Open Space
TOWN IV : LAND USE & ACTIVITY
In 2040, Kokstad and Franklin are attractive, well managed, affordable, socially vibrant and integrated places that attract visitors, the youth and investment by promoting mixed-use development in appropriate locations.
Mixed-use development is the practice of having more than one form of “use” or activity (e.g., residential, commercial, office, recreational, industry) in a building or building complex. The combination of uses, when planned according to people’s needs, can create a more walkable, people-oriented space, and help prevent urban sprawl.
The neighbourhood activity node is based on the ‘kit of parts’ concept that relates to the collective provision of public or community facilities in clusters or “activity centres” that are located in places of high accessibility, particularly in terms of public transport and non-motorised transport.
At such a node, a range of land use mixes are encouraged - social, education, economic, recreational, agricultural and transport - all at a scale that is appropriate to the size of the node. While a single node is unlikely to contain all these land uses, by encouraging a mix of activities a local character emerges so that some nodes are predominantly social/educational in character, others are mostly commercial and others might centre around a neighbourhood park, agricultural allotments and a weekly market - the nature of the node develops in response to the needs of its community.
The surrounding urban fabric should support such a node through developing higher residential densities and pursuing a complete street approach, with provision for pedestrian and cycling streets, and transit stops.
The kind of social facilities that work well within such a node are schools, clinics, libraries, digital hubs, community halls, and so on. In a town location, these kinds of uses are complemented by a range of commercial activity, while in an agricultural node or quieter residential area the focus might be on nurseries or playgrounds, while a higher-order node would include larger retail and services (these are unpacked under the Agriculture, Natural Resources and Crossroads stories respectively).
MIXED USE ZONES
NEIGHBOURHOOD ACTIVITY NODE
Fig 49. TOWN iV - KOKSTAD
Fig 50. SOCiAL COMPONENT
Fig 51. SOCiAL AND COMMERCiAL COMPONENTS
Fig 52. ALL USES
Fig 53. TOWN iV - FRANKLiN
DOCUMENT PREPARED BY THE CITY THINK SPACE TEAM
STRATEGY DEVELOPMENT PLAN IMPLEMENTATION PLANAG
RIC
ULT
UR
EN
ATU
RAL
R
ESO
UR
CES
INFR
ASTR
UC
TUR
ETO
WN
CR
OSS
RO
ADS
ENAB
LIN
GIN
STIT
UTI
ON
S82
TOW
NDEVELOPMENT PLAN
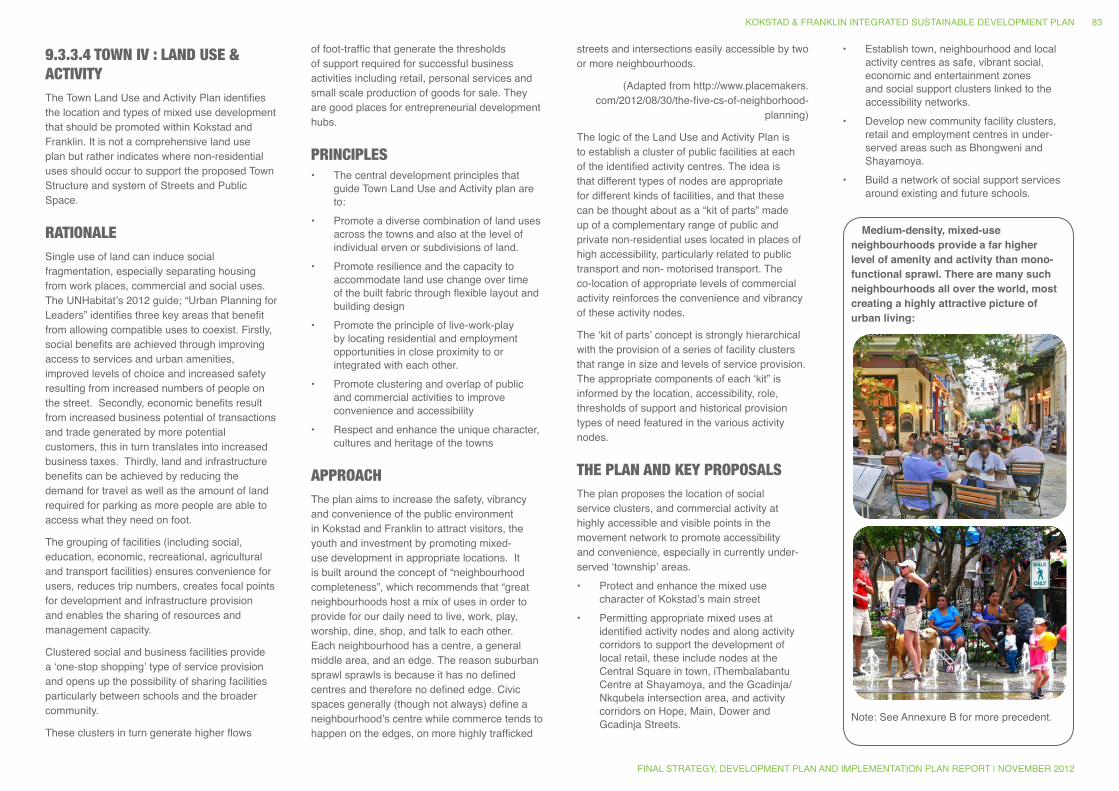
Medium-density, mixed-use neighbourhoods provide a far higher level of amenity and activity than mono-functional sprawl. There are many such neighbourhoods all over the world, most creating a highly attractive picture of urban living:
Note: See Annexure B for more precedent.
9.3.3.4 TOWN IV : LAND USE & ACTIVITYThe Town Land Use and Activity Plan identifies the location and types of mixed use development that should be promoted within Kokstad and Franklin. It is not a comprehensive land use plan but rather indicates where non-residential uses should occur to support the proposed Town Structure and system of Streets and Public Space.
RATIONALESingle use of land can induce social fragmentation, especially separating housing from work places, commercial and social uses. The UNHabitat’s 2012 guide; “Urban Planning for Leaders” identifies three key areas that benefit from allowing compatible uses to coexist. Firstly, social benefits are achieved through improving access to services and urban amenities, improved levels of choice and increased safety resulting from increased numbers of people on the street. Secondly, economic benefits result from increased business potential of transactions and trade generated by more potential customers, this in turn translates into increased business taxes. Thirdly, land and infrastructure benefits can be achieved by reducing the demand for travel as well as the amount of land required for parking as more people are able to access what they need on foot.
The grouping of facilities (including social, education, economic, recreational, agricultural and transport facilities) ensures convenience for users, reduces trip numbers, creates focal points for development and infrastructure provision and enables the sharing of resources and management capacity.
Clustered social and business facilities provide a ‘one-stop shopping’ type of service provision and opens up the possibility of sharing facilities particularly between schools and the broader community.
These clusters in turn generate higher flows
of foot-traffic that generate the thresholds of support required for successful business activities including retail, personal services and small scale production of goods for sale. They are good places for entrepreneurial development hubs.
PRINCIPLES • The central development principles that
guide Town Land Use and Activity plan are to:
• Promote a diverse combination of land uses across the towns and also at the level of individual erven or subdivisions of land.
• Promote resilience and the capacity to accommodate land use change over time of the built fabric through flexible layout and building design
• Promote the principle of live-work-play by locating residential and employment opportunities in close proximity to or integrated with each other.
• Promote clustering and overlap of public and commercial activities to improve convenience and accessibility
• Respect and enhance the unique character, cultures and heritage of the towns
APPROACHThe plan aims to increase the safety, vibrancy and convenience of the public environment in Kokstad and Franklin to attract visitors, the youth and investment by promoting mixed-use development in appropriate locations. It is built around the concept of “neighbourhood completeness”, which recommends that “great neighbourhoods host a mix of uses in order to provide for our daily need to live, work, play, worship, dine, shop, and talk to each other. Each neighbourhood has a centre, a general middle area, and an edge. The reason suburban sprawl sprawls is because it has no defined centres and therefore no defined edge. Civic spaces generally (though not always) define a neighbourhood’s centre while commerce tends to happen on the edges, on more highly trafficked
streets and intersections easily accessible by two or more neighbourhoods.
(Adapted from http://www.placemakers.com/2012/08/30/the-five-cs-of-neighborhood-
planning)
The logic of the Land Use and Activity Plan is to establish a cluster of public facilities at each of the identified activity centres. The idea is that different types of nodes are appropriate for different kinds of facilities, and that these can be thought about as a “kit of parts” made up of a complementary range of public and private non-residential uses located in places of high accessibility, particularly related to public transport and non- motorised transport. The co-location of appropriate levels of commercial activity reinforces the convenience and vibrancy of these activity nodes.
The ‘kit of parts’ concept is strongly hierarchical with the provision of a series of facility clusters that range in size and levels of service provision. The appropriate components of each ‘kit” is informed by the location, accessibility, role, thresholds of support and historical provision types of need featured in the various activity nodes.
THE PLAN AND KEY PROPOSALSThe plan proposes the location of social service clusters, and commercial activity at highly accessible and visible points in the movement network to promote accessibility and convenience, especially in currently under-served ‘township’ areas.• Protect and enhance the mixed use
character of Kokstad’s main street • Permitting appropriate mixed uses at
identified activity nodes and along activity corridors to support the development of local retail, these include nodes at the Central Square in town, iThembalabantu Centre at Shayamoya, and the Gcadinja/Nkqubela intersection area, and activity corridors on Hope, Main, Dower and Gcadinja Streets.
• Establish town, neighbourhood and local activity centres as safe, vibrant social, economic and entertainment zones and social support clusters linked to the accessibility networks.
• Develop new community facility clusters, retail and employment centres in under-served areas such as Bhongweni and Shayamoya.
• Build a network of social support services around existing and future schools.
KOKSTAD & FRANKLIN INTEGRATED SUSTAINABLE DEVELOPMENT PLAN
FINAL STRATEGY, DEVELOPMENT PLAN AND IMPLEMENTATION PLAN REPORT | NOVEMBER 2012
83
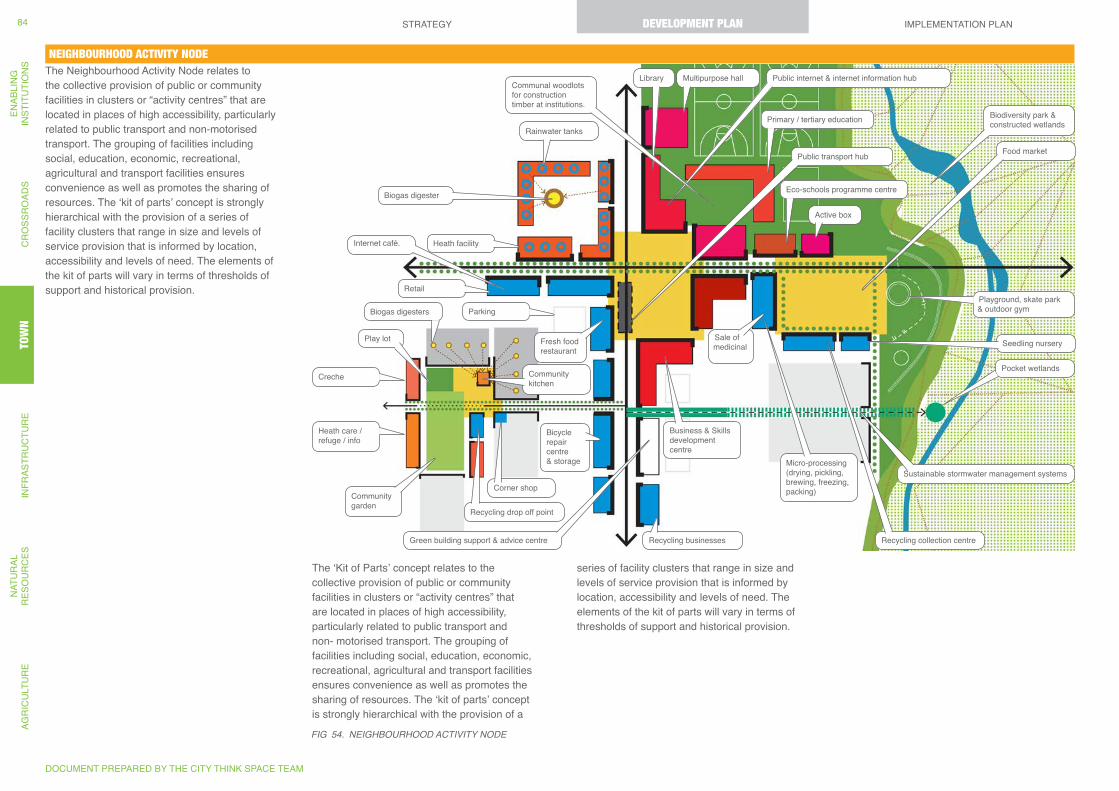
Rainwater tanks
Biogas digesters
Pocket wetlands
Parking
Retail
Heath facility
Creche
Heath care / refuge / info
Multipurpose hallLibrary
Eco-schools programme centre
Active box
Primary / tertiary education
Biogas digester
Play lot
Community garden
Sale of medicinal
Corner shop
Bicycle repair centre & storage
Fresh food restaurant
Micro-processing (drying, pickling, brewing, freezing, packing)
Business & Skills development centre
Green building support & advice centre Recycling collection centre
Recycling drop off point
Recycling businesses
Food market
Sustainable stormwater management systems
Biodiversity park & constructed wetlands
Public transport hub
Public internet & internet information hub
Internet café.
Playground, skate park & outdoor gym
Seedling nursery
Community kitchen
Communal woodlots for construction timber at institutions.
NEIGHBOURHOOD ACTIVITY NODEThe Neighbourhood Activity Node relates to the collective provision of public or community facilities in clusters or “activity centres” that are located in places of high accessibility, particularly related to public transport and non-motorised transport. The grouping of facilities including social, education, economic, recreational, agricultural and transport facilities ensures convenience as well as promotes the sharing of resources. The ‘kit of parts’ concept is strongly hierarchical with the provision of a series of facility clusters that range in size and levels of service provision that is informed by location, accessibility and levels of need. The elements of the kit of parts will vary in terms of thresholds of support and historical provision.
Fig 54. NEigHBOURHOOD ACTiViTY NODE
The ‘Kit of Parts’ concept relates to the collective provision of public or community facilities in clusters or “activity centres” that are located in places of high accessibility, particularly related to public transport and non- motorised transport. The grouping of facilities including social, education, economic, recreational, agricultural and transport facilities ensures convenience as well as promotes the sharing of resources. The ‘kit of parts’ concept is strongly hierarchical with the provision of a
series of facility clusters that range in size and levels of service provision that is informed by location, accessibility and levels of need. The elements of the kit of parts will vary in terms of thresholds of support and historical provision.
DOCUMENT PREPARED BY THE CITY THINK SPACE TEAM
STRATEGY DEVELOPMENT PLAN IMPLEMENTATION PLANAG
RIC
ULT
UR
EN
ATU
RAL
R
ESO
UR
CES
INFR
ASTR
UC
TUR
ETO
WN
CR
OSS
RO
ADS
ENAB
LIN
GIN
STIT
UTI
ON
S84
TOW
NDEVELOPMENT PLAN
DEVELOPMENT & URBAN DESIGN GUIDELINESENSURE THAT LAND USES AND ACTIVITY WITHIN DEVELOPMENTS CONTRIBUTES POSITIVELY TO THE PUBLIC ENVIRONMENT
G Manage changes to the built form of private development so that buildings, structures and landscaping reinforce the safety, definition and quality of the public spaces and streets of the towns.
G Preserve existing streetscape character on town grid by infilling with complementary built form, but allow more flexibility in land use along connectors and activity routes.
G Promote diverse (but coherent?) street interfaces by building flexibility into the range of land uses, building sizes that can be accommodated (in terms of plot size, width of frontage, height and land use).
G Ensure that development articulates the transition between public and private on its edges to create appropriate spaces for interaction that are safe, stimulating, enjoyable and convenient
G Design buildings and public spaces that can be effectively maintained so as to ensure continued public use of spaces and prevent places from becoming locations for criminal activity; ensure visibility of public ablution facilities
PROMOTE MIXED USE
G Promote appropriate non-residential uses including social facilities, retail, commerce and light manufacturing:
- at identified activity nodes and along identified activity route
- at gateway sites and activity nodes - within multi-level residential developments - at the ground floor of the street edges of
multi-level developments as appropriate for the location.
G Limit mono-functional developments G Protect and enhance the CBD mixed-use
zone currently located along Hope and Main Streets by:
- Not approving out of town, mono-functional malls (ref malls to mainstreets) that will draw large retailers out of the town centre
- Promote intensification and reinforcement of existing and proposed activity nodes and streets rather than allowing new development to dissipate activity
CLUSTER SOCIAL FACILITIES
G Ensure that new social facilities are located within activity nodes
G Cluster social facilities so that they support spatial and social integration, efficiency of management, shared resources and security (including government services, NGOs and other support organisations) and establish activity centres of safe, vibrant and convenient public amenity:
- Major civic buildings such as municipal offices, libraries, hospitals should be located near transit interchanges and at other high-traffic, easily accessible places.
- Promote local neighbourhood retail and small enterprise development at neighbourhood activity nodes.
- Locate public facilities around public spaces to optimize co-location (shared management, security) and convenience for users.
G Reinforce existing community facility nodes and schools.
G Ensure integration of the social, economic, institutional and physical aspects of land development by considering the management, operational and community dimensions in decisions on the location of public buildings
PROMOTE FLEXIBILITY
G Promote flexibility in land subdivision, site layout, plot configuration and building design and placement to enable changes in use over time:
- Promote a flexible grid layout over highly varied/ complex road configurations as these enable more flexible and varied uses
- Promote long narrow plots as these offer the potential to incorporate multiple uses in an efficient and flexible way
- Limit purpose built and inflexible layouts that are completely tailored to single uses and therefore limit adaptation to other uses
KOKSTAD & FRANKLIN INTEGRATED SUSTAINABLE DEVELOPMENT PLAN
FINAL STRATEGY, DEVELOPMENT PLAN AND IMPLEMENTATION PLAN REPORT | NOVEMBER 2012
85
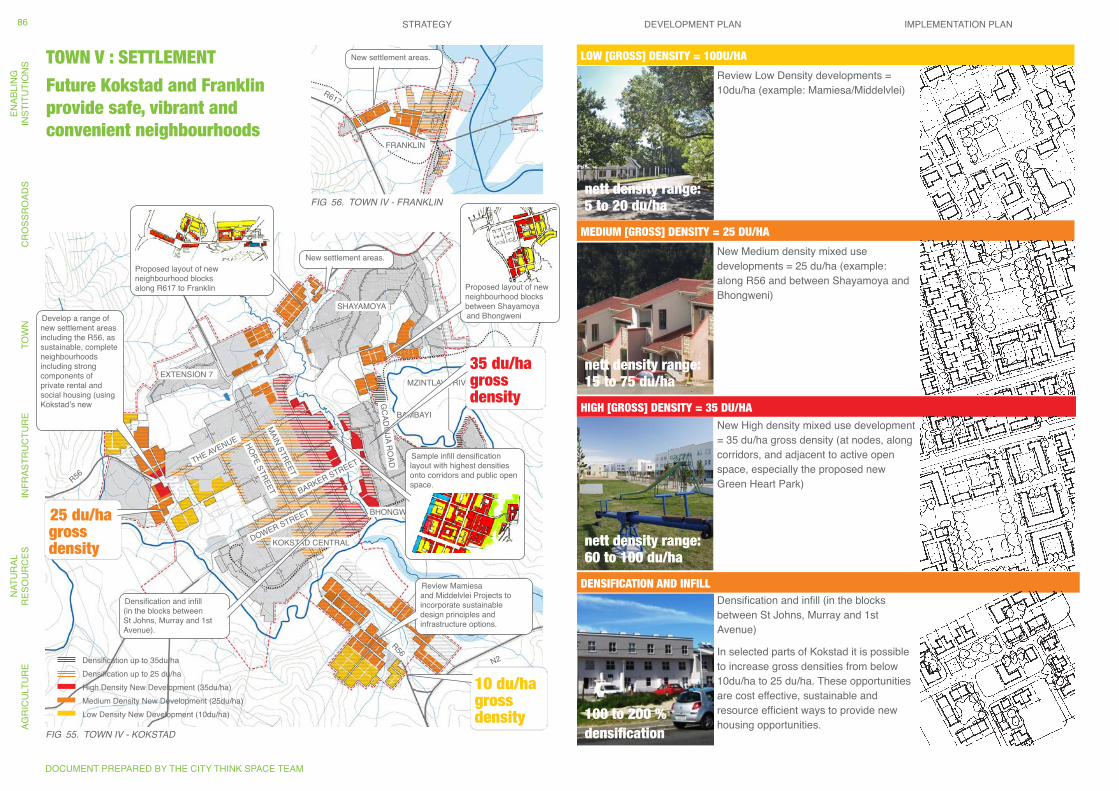
KOKSTAD CENTRAL
THE AVENUE
MAIN STREET
GCADINJA RO
AD
BARKER STREET
HOPE STREET
DOWER STREET
SHAYAMOYA
EXTENSION 7
BAMBAYI
HORSESHOE
BHONGWENI
R56
R617
R617
R56N2
MZINTLAVA RIVER
FRANKLIN
New settlement areas.
Sample infill densification layout with highest densities onto corridors and public open space.
New settlement areas.
Develop a range of new settlement areas including the R56, as sustainable, complete neighbourhoods including strong components of private rental and social housing (using Kokstad’s new
Densification and infill (in the blocks between St Johns, Murray and 1st Avenue).
Review Mamiesa and Middelvlei Projects to incorporate sustainable design principles and infrastructure options.
Proposed layout of new neighbourhood blocks along R617 to Franklin Proposed layout of new
neighbourhood blocks between Shayamoya and Bhongweni
10 du/ha gross density
25 du/ha gross density
35 du/ha gross density
High Density New Development (35du/ha)Medium Density New Development (25du/ha)Low Density New Development (10du/ha)
Densification up to 35du/haDensification up to 25 du/ha
TOWN V : SETTLEMENT
Future Kokstad and Franklin provide safe, vibrant and convenient neighbourhoods
Review Low Density developments = 10du/ha (example: Mamiesa/Middelvlei)
Densification and infill (in the blocks between St Johns, Murray and 1st Avenue)
In selected parts of Kokstad it is possible to increase gross densities from below 10du/ha to 25 du/ha. These opportunities are cost effective, sustainable and resource efficient ways to provide new housing opportunities.
New Medium density mixed use developments = 25 du/ha (example: along R56 and between Shayamoya and Bhongweni)
New High density mixed use development = 35 du/ha gross density (at nodes, along corridors, and adjacent to active open space, especially the proposed new Green Heart Park)
nett density range: 5 to 20 du/ha
100 to 200 %densification
nett density range: 60 to 100 du/ha
nett density range: 15 to 75 du/ha
DENSIFICATION AND INFILL
HIGH [GROSS] DENSITY = 35 DU/HA
MEDIUM [GROSS] DENSITY = 25 DU/HA
LOW [GROSS] DENSITY = 10DU/HA
Fig 55. TOWN iV - KOKSTAD
Fig 56. TOWN iV - FRANKLiN
DOCUMENT PREPARED BY THE CITY THINK SPACE TEAM
STRATEGY DEVELOPMENT PLAN IMPLEMENTATION PLANAG
RIC
ULT
UR
EN
ATU
RAL
R
ESO
UR
CES
INFR
ASTR
UC
TUR
ETO
WN
CR
OSS
RO
ADS
ENAB
LIN
GIN
STIT
UTI
ON
S86
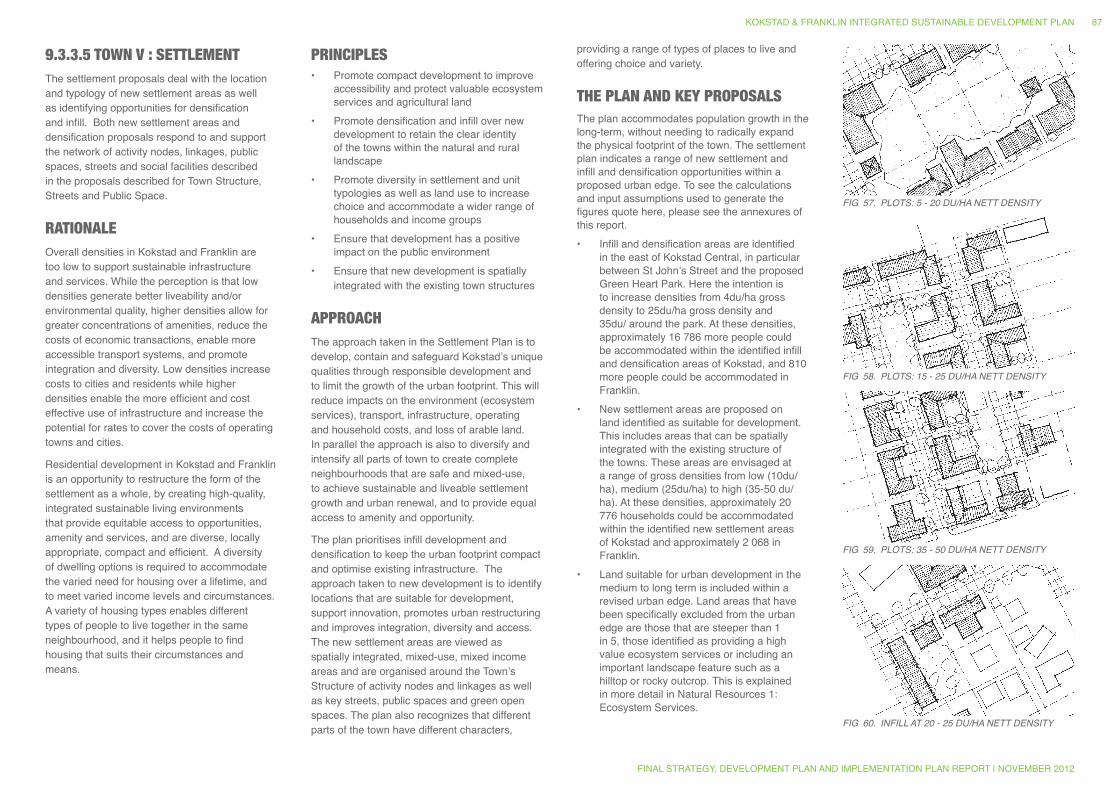
9.3.3.5 TOWN V : SETTLEMENTThe settlement proposals deal with the location and typology of new settlement areas as well as identifying opportunities for densification and infill. Both new settlement areas and densification proposals respond to and support the network of activity nodes, linkages, public spaces, streets and social facilities described in the proposals described for Town Structure, Streets and Public Space.
RATIONALEOverall densities in Kokstad and Franklin are too low to support sustainable infrastructure and services. While the perception is that low densities generate better liveability and/or environmental quality, higher densities allow for greater concentrations of amenities, reduce the costs of economic transactions, enable more accessible transport systems, and promote integration and diversity. Low densities increase costs to cities and residents while higher densities enable the more efficient and cost effective use of infrastructure and increase the potential for rates to cover the costs of operating towns and cities.
Residential development in Kokstad and Franklin is an opportunity to restructure the form of the settlement as a whole, by creating high-quality, integrated sustainable living environments that provide equitable access to opportunities, amenity and services, and are diverse, locally appropriate, compact and efficient. A diversity of dwelling options is required to accommodate the varied need for housing over a lifetime, and to meet varied income levels and circumstances. A variety of housing types enables different types of people to live together in the same neighbourhood, and it helps people to find housing that suits their circumstances and means.
PRINCIPLES • Promote compact development to improve
accessibility and protect valuable ecosystem services and agricultural land
• Promote densification and infill over new development to retain the clear identity of the towns within the natural and rural landscape
• Promote diversity in settlement and unit typologies as well as land use to increase choice and accommodate a wider range of households and income groups
• Ensure that development has a positive impact on the public environment
• Ensure that new development is spatially integrated with the existing town structures
APPROACHThe approach taken in the Settlement Plan is to develop, contain and safeguard Kokstad’s unique qualities through responsible development and to limit the growth of the urban footprint. This will reduce impacts on the environment (ecosystem services), transport, infrastructure, operating and household costs, and loss of arable land. In parallel the approach is also to diversify and intensify all parts of town to create complete neighbourhoods that are safe and mixed-use, to achieve sustainable and liveable settlement growth and urban renewal, and to provide equal access to amenity and opportunity.
The plan prioritises infill development and densification to keep the urban footprint compact and optimise existing infrastructure. The approach taken to new development is to identify locations that are suitable for development, support innovation, promotes urban restructuring and improves integration, diversity and access. The new settlement areas are viewed as spatially integrated, mixed-use, mixed income areas and are organised around the Town’s Structure of activity nodes and linkages as well as key streets, public spaces and green open spaces. The plan also recognizes that different parts of the town have different characters,
providing a range of types of places to live and offering choice and variety.
THE PLAN AND KEY PROPOSALSThe plan accommodates population growth in the long-term, without needing to radically expand the physical footprint of the town. The settlement plan indicates a range of new settlement and infill and densification opportunities within a proposed urban edge. To see the calculations and input assumptions used to generate the figures quote here, please see the annexures of this report. • Infill and densification areas are identified
in the east of Kokstad Central, in particular between St John’s Street and the proposed Green Heart Park. Here the intention is to increase densities from 4du/ha gross density to 25du/ha gross density and 35du/ around the park. At these densities, approximately 16 786 more people could be accommodated within the identified infill and densification areas of Kokstad, and 810 more people could be accommodated in Franklin.
• New settlement areas are proposed on land identified as suitable for development. This includes areas that can be spatially integrated with the existing structure of the towns. These areas are envisaged at a range of gross densities from low (10du/ha), medium (25du/ha) to high (35-50 du/ha). At these densities, approximately 20 776 households could be accommodated within the identified new settlement areas of Kokstad and approximately 2 068 in Franklin.
• Land suitable for urban development in the medium to long term is included within a revised urban edge. Land areas that have been specifically excluded from the urban edge are those that are steeper than 1 in 5, those identified as providing a high value ecosystem services or including an important landscape feature such as a hilltop or rocky outcrop. This is explained in more detail in Natural Resources 1: Ecosystem Services.
Fig 57. PLOTS: 5 - 20 DU/HA NETT DENSiTY
Fig 58. PLOTS: 15 - 25 DU/HA NETT DENSiTY
Fig 59. PLOTS: 35 - 50 DU/HA NETT DENSiTY
Fig 60. iNFiLL AT 20 - 25 DU/HA NETT DENSiTY
KOKSTAD & FRANKLIN INTEGRATED SUSTAINABLE DEVELOPMENT PLAN
FINAL STRATEGY, DEVELOPMENT PLAN AND IMPLEMENTATION PLAN REPORT | NOVEMBER 2012
87
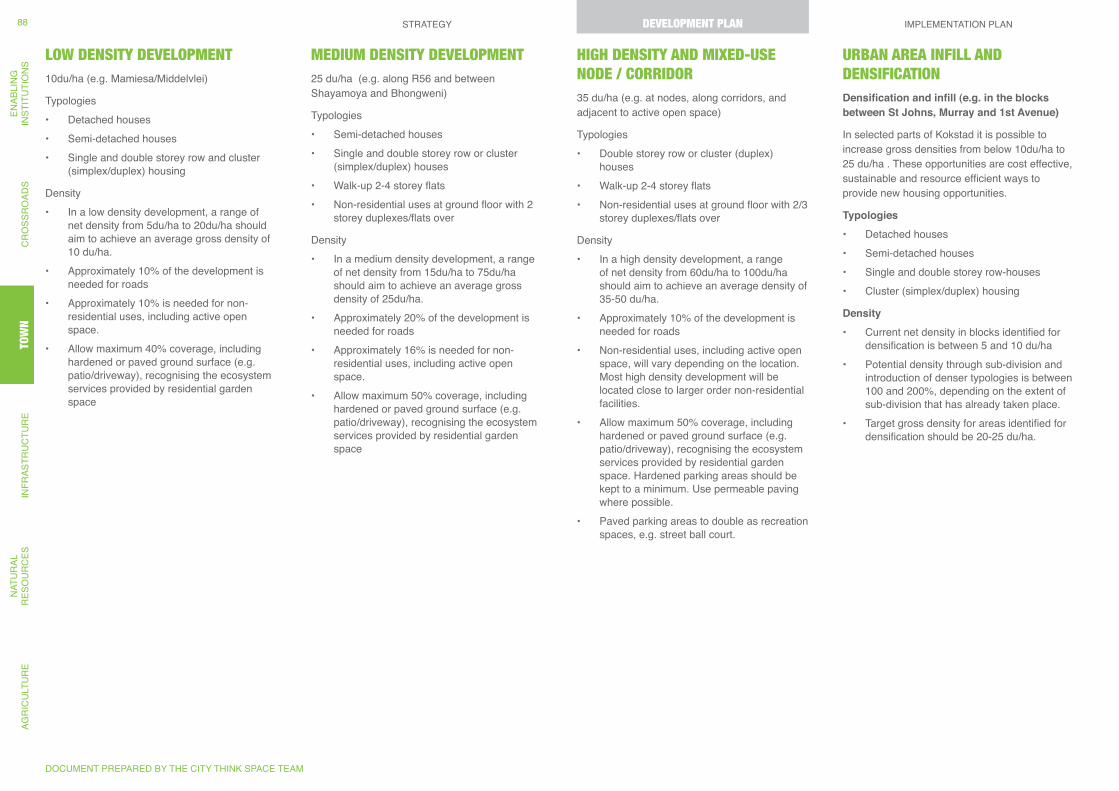
LOW DENSITY DEVELOPMENT10du/ha (e.g. Mamiesa/Middelvlei)
Typologies• Detached houses • Semi-detached houses• Single and double storey row and cluster
(simplex/duplex) housing
Density• In a low density development, a range of
net density from 5du/ha to 20du/ha should aim to achieve an average gross density of 10 du/ha.
• Approximately 10% of the development is needed for roads
• Approximately 10% is needed for non-residential uses, including active open space.
• Allow maximum 40% coverage, including hardened or paved ground surface (e.g. patio/driveway), recognising the ecosystem services provided by residential garden space
MEDIUM DENSITY DEVELOPMENT25 du/ha (e.g. along R56 and between Shayamoya and Bhongweni)
Typologies• Semi-detached houses• Single and double storey row or cluster
(simplex/duplex) houses• Walk-up 2-4 storey flats• Non-residential uses at ground floor with 2
storey duplexes/flats over
Density• In a medium density development, a range
of net density from 15du/ha to 75du/ha should aim to achieve an average gross density of 25du/ha.
• Approximately 20% of the development is needed for roads
• Approximately 16% is needed for non-residential uses, including active open space.
• Allow maximum 50% coverage, including hardened or paved ground surface (e.g. patio/driveway), recognising the ecosystem services provided by residential garden space
HIGH DENSITY AND MIXED-USE NODE / CORRIDOR35 du/ha (e.g. at nodes, along corridors, and adjacent to active open space)
Typologies• Double storey row or cluster (duplex)
houses• Walk-up 2-4 storey flats• Non-residential uses at ground floor with 2/3
storey duplexes/flats over
Density• In a high density development, a range
of net density from 60du/ha to 100du/ha should aim to achieve an average density of 35-50 du/ha.
• Approximately 10% of the development is needed for roads
• Non-residential uses, including active open space, will vary depending on the location. Most high density development will be located close to larger order non-residential facilities.
• Allow maximum 50% coverage, including hardened or paved ground surface (e.g. patio/driveway), recognising the ecosystem services provided by residential garden space. Hardened parking areas should be kept to a minimum. Use permeable paving where possible.
• Paved parking areas to double as recreation spaces, e.g. street ball court.
URBAN AREA INFILL AND DENSIFICATIONDensification and infill (e.g. in the blocks between St Johns, Murray and 1st Avenue)
In selected parts of Kokstad it is possible to increase gross densities from below 10du/ha to 25 du/ha . These opportunities are cost effective, sustainable and resource efficient ways to provide new housing opportunities.
Typologies• Detached houses• Semi-detached houses• Single and double storey row-houses• Cluster (simplex/duplex) housing
Density• Current net density in blocks identified for
densification is between 5 and 10 du/ha• Potential density through sub-division and
introduction of denser typologies is between 100 and 200%, depending on the extent of sub-division that has already taken place.
• Target gross density for areas identified for densification should be 20-25 du/ha.
DOCUMENT PREPARED BY THE CITY THINK SPACE TEAM
STRATEGY DEVELOPMENT PLAN IMPLEMENTATION PLANAG
RIC
ULT
UR
EN
ATU
RAL
R
ESO
UR
CES
INFR
ASTR
UC
TUR
ETO
WN
CR
OSS
RO
ADS
ENAB
LIN
GIN
STIT
UTI
ON
S88
TOW
NDEVELOPMENT PLAN
TOW
NDEVELOPMENT PLAN
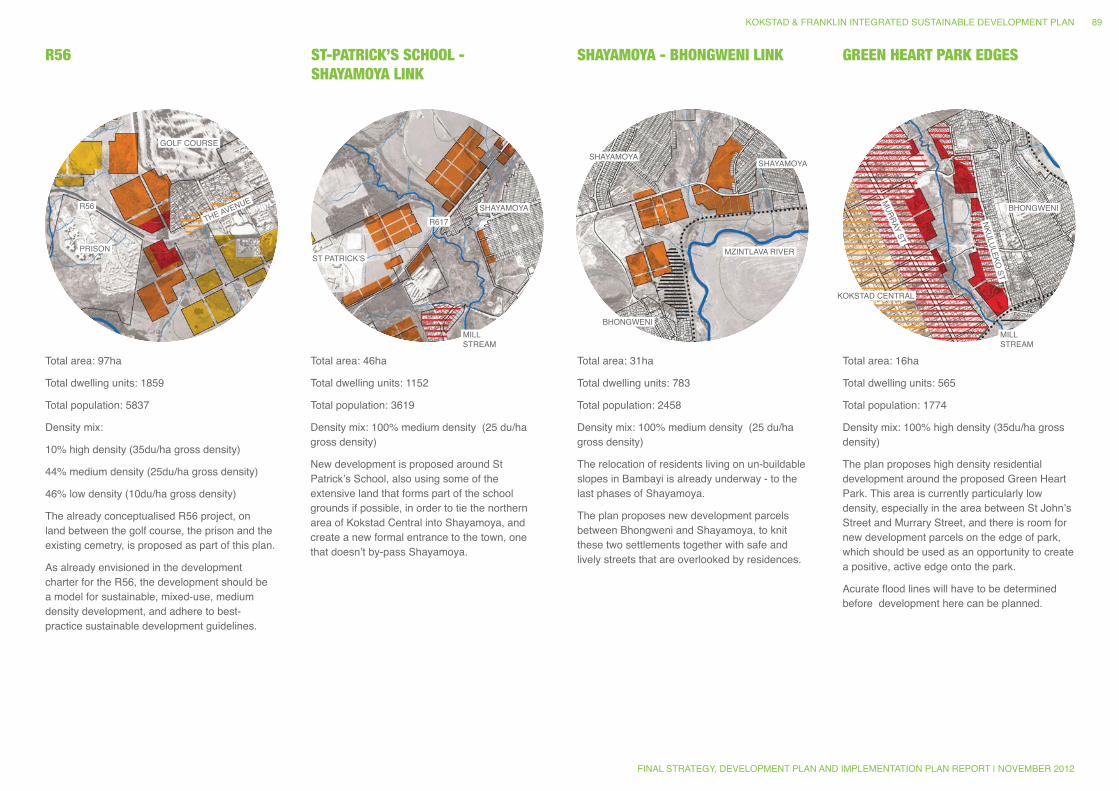
PRISON
GOLF COURSE
ST PATRICK’S
SHAYAMOYA
SHAYAMOYASHAYAMOYA
BHONGWENI
BHONGWENI
KOKSTAD CENTRAL
MURRAY ST
NKULULEKO ST
R617
R56THE AVENUE
MILL STREAM
MILL STREAM
MZINTLAVA RIVER
Total area: 97ha
Total dwelling units: 1859
Total population: 5837
Density mix:
10% high density (35du/ha gross density)
44% medium density (25du/ha gross density)
46% low density (10du/ha gross density)
The already conceptualised R56 project, on land between the golf course, the prison and the existing cemetry, is proposed as part of this plan.
As already envisioned in the development charter for the R56, the development should be a model for sustainable, mixed-use, medium density development, and adhere to best-practice sustainable development guidelines.
R56 ST-PATRICK’S SCHOOL - SHAYAMOYA LINK
SHAYAMOYA - BHONGWENI LINK GREEN HEART PARK EDGES
Total area: 46ha
Total dwelling units: 1152
Total population: 3619
Density mix: 100% medium density (25 du/ha gross density)
New development is proposed around St Patrick’s School, also using some of the extensive land that forms part of the school grounds if possible, in order to tie the northern area of Kokstad Central into Shayamoya, and create a new formal entrance to the town, one that doesn’t by-pass Shayamoya.
Total area: 31ha
Total dwelling units: 783
Total population: 2458
Density mix: 100% medium density (25 du/ha gross density)
The relocation of residents living on un-buildable slopes in Bambayi is already underway - to the last phases of Shayamoya.
The plan proposes new development parcels between Bhongweni and Shayamoya, to knit these two settlements together with safe and lively streets that are overlooked by residences.
Total area: 16ha
Total dwelling units: 565
Total population: 1774
Density mix: 100% high density (35du/ha gross density)
The plan proposes high density residential development around the proposed Green Heart Park. This area is currently particularly low density, especially in the area between St John’s Street and Murrary Street, and there is room for new development parcels on the edge of park, which should be used as an opportunity to create a positive, active edge onto the park.
Acurate flood lines will have to be determined before development here can be planned.
KOKSTAD & FRANKLIN INTEGRATED SUSTAINABLE DEVELOPMENT PLAN
FINAL STRATEGY, DEVELOPMENT PLAN AND IMPLEMENTATION PLAN REPORT | NOVEMBER 2012
89
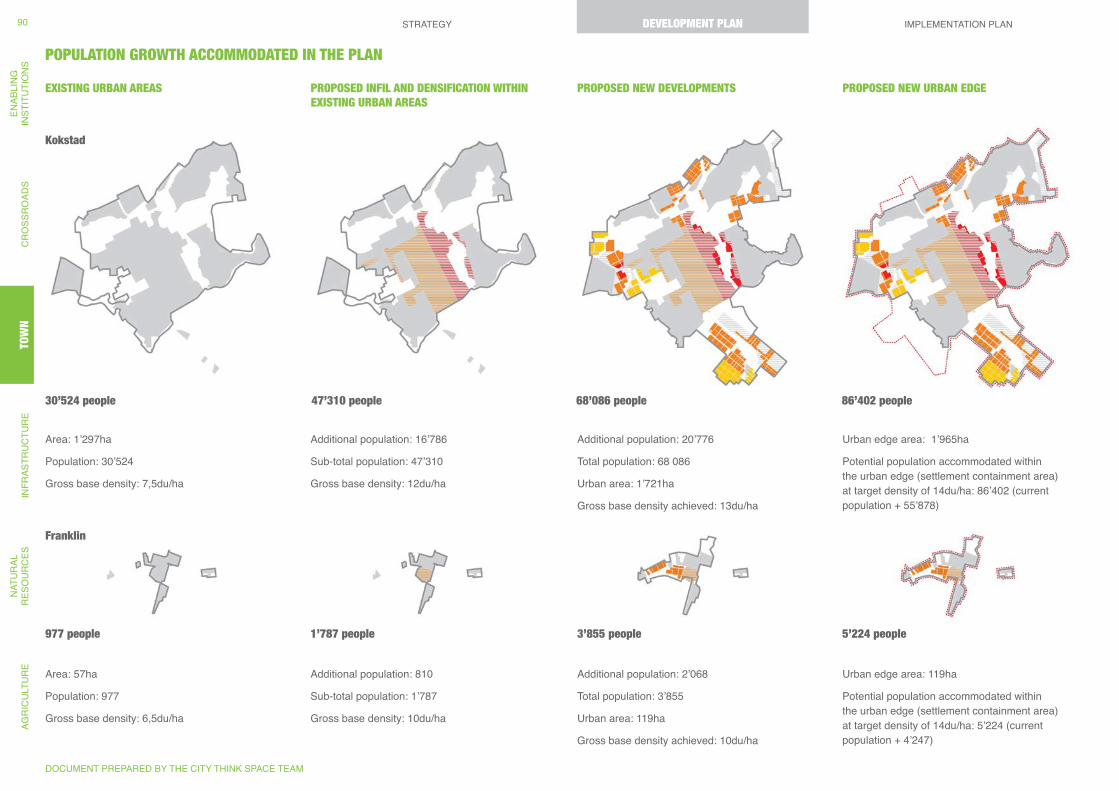
EXISTING URBAN AREAS
POPULATION GROWTH ACCOMMODATED IN THE PLAN
Kokstad
977 people 1’787 people 3’855 people 5’224 people
Franklin
PROPOSED INFIL AND DENSIFICATION WITHIN EXISTING URBAN AREAS
PROPOSED NEW DEVELOPMENTS PROPOSED NEW URBAN EDGE
Area: 57ha
Population: 977
Gross base density: 6,5du/ha
Additional population: 810
Sub-total population: 1’787
Gross base density: 10du/ha
Area: 1’297ha
Population: 30’524
Gross base density: 7,5du/ha
30’524 people 47’310 people 68’086 people 86’402 people
Additional population: 16’786
Sub-total population: 47’310
Gross base density: 12du/ha
Additional population: 20’776
Total population: 68 086
Urban area: 1’721ha
Gross base density achieved: 13du/ha
Urban edge area: 1’965ha
Potential population accommodated within the urban edge (settlement containment area) at target density of 14du/ha: 86’402 (current population + 55’878)
Additional population: 2’068
Total population: 3’855
Urban area: 119ha
Gross base density achieved: 10du/ha
Urban edge area: 119ha
Potential population accommodated within the urban edge (settlement containment area) at target density of 14du/ha: 5’224 (current population + 4’247)
DOCUMENT PREPARED BY THE CITY THINK SPACE TEAM
STRATEGY DEVELOPMENT PLAN IMPLEMENTATION PLANAG
RIC
ULT
UR
EN
ATU
RAL
R
ESO
UR
CES
INFR
ASTR
UC
TUR
ETO
WN
CR
OSS
RO
ADS
ENAB
LIN
GIN
STIT
UTI
ON
S90
TOW
NDEVELOPMENT PLAN
DEVELOPMENT & URBAN DESIGN GUIDELINESApply all guidelines for structure, street, public space and land use to densification initiative and new development areas.
INCREASE OVERALL DENSITIES OVER TIME
G Increase overall densities over time to an average gross density of 15 du/ ha.
G Set a minimum average density of xx du/ ha for new development areas
G Promote infill and densification and infill in identified densification zones, especially in areas close to open space and amenities
G Encourage double (or multi-)storey development in higher density areas and allow at least one second dwelling (more in low-density areas) on each residential lot as a primary right within the zoning scheme.
PROMOTE INTEGRATION
G New development areas must be organised around the proposed structure of activity nodes and linkages, streets, public spaces, land uses and open spaces identified in the Town and Natural Resources Plan
PROMOTE DIVERSITY
G Include a range of site sizes, housing typologies and net densities, and concentrate higher densities at nodes, along corridors, and facing onto primary public open spaces such as parks and squares.
G Locate medium densities throughout the town and lower densities in areas where the historic and green character of the town should be preserved.
G Allow for a mix of institutional and financing models as well as a mix of typologies in all development projects.
G Balance between distinct character areas and diversity of plots sizes, housing typologies and mix of uses within a given area.
SUSTAINABILITY
G New development areas must not be located on areas identified as providing high value ecosystem services
G Develop all new settlement areas in terms of green building guidelines, using sustainable service technologies wherever possible and supported by a sustainable infrastructure development programme.
G New development areas should be located to support the efficient use of existing infrastructure as well as proposed new infrastructure
KOKSTAD & FRANKLIN INTEGRATED SUSTAINABLE DEVELOPMENT PLAN
FINAL STRATEGY, DEVELOPMENT PLAN AND IMPLEMENTATION PLAN REPORT | NOVEMBER 2012
91
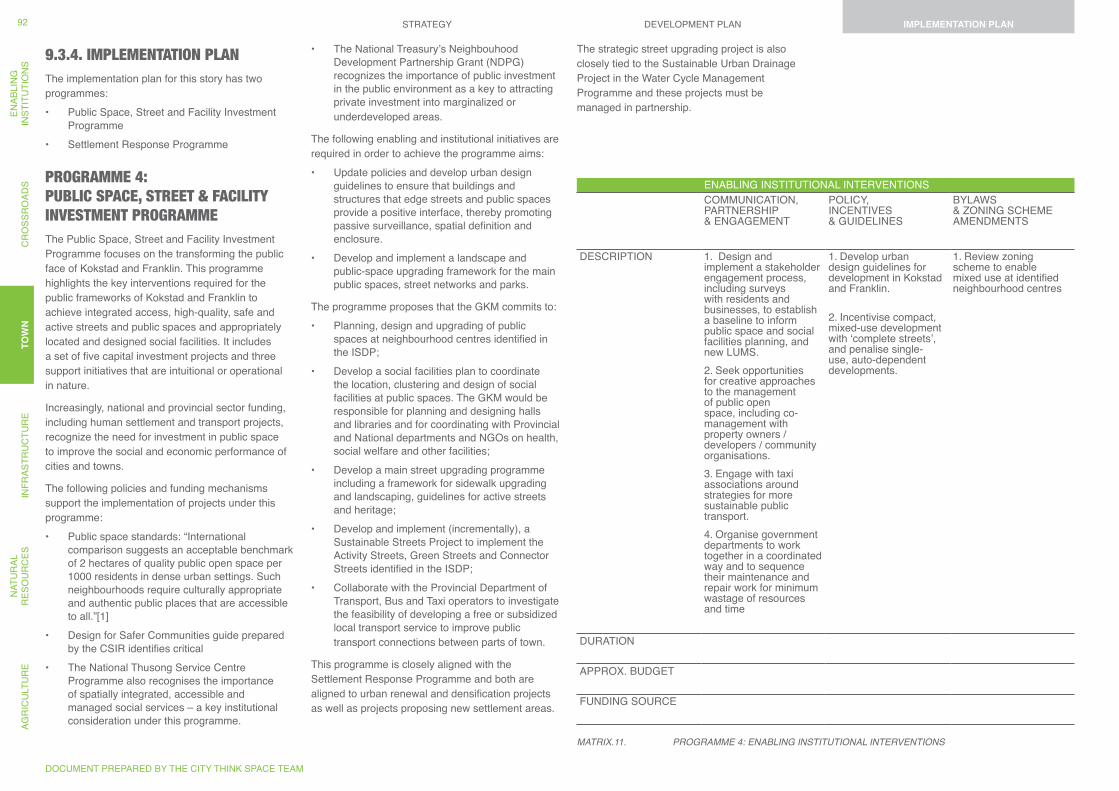
9.3.4. IMPLEMENTATION PLANThe implementation plan for this story has two programmes:• Public Space, Street and Facility Investment
Programme• Settlement Response Programme
PROGRAMME 4: PUBLIC SPACE, STREET & FACILITY INVESTMENT PROGRAMMEThe Public Space, Street and Facility Investment Programme focuses on the transforming the public face of Kokstad and Franklin. This programme highlights the key interventions required for the public frameworks of Kokstad and Franklin to achieve integrated access, high-quality, safe and active streets and public spaces and appropriately located and designed social facilities. It includes a set of five capital investment projects and three support initiatives that are intuitional or operational in nature.
Increasingly, national and provincial sector funding, including human settlement and transport projects, recognize the need for investment in public space to improve the social and economic performance of cities and towns.
The following policies and funding mechanisms support the implementation of projects under this programme:• Public space standards: “International
comparison suggests an acceptable benchmark of 2 hectares of quality public open space per 1000 residents in dense urban settings. Such neighbourhoods require culturally appropriate and authentic public places that are accessible to all.”[1]
• Design for Safer Communities guide prepared by the CSIR identifies critical
• The National Thusong Service Centre Programme also recognises the importance of spatially integrated, accessible and managed social services – a key institutional consideration under this programme.
• The National Treasury’s Neighbouhood Development Partnership Grant (NDPG) recognizes the importance of public investment in the public environment as a key to attracting private investment into marginalized or underdeveloped areas.
The following enabling and institutional initiatives are required in order to achieve the programme aims:• Update policies and develop urban design
guidelines to ensure that buildings and structures that edge streets and public spaces provide a positive interface, thereby promoting passive surveillance, spatial definition and enclosure.
• Develop and implement a landscape and public-space upgrading framework for the main public spaces, street networks and parks.
The programme proposes that the GKM commits to:• Planning, design and upgrading of public
spaces at neighbourhood centres identified in the ISDP;
• Develop a social facilities plan to coordinate the location, clustering and design of social facilities at public spaces. The GKM would be responsible for planning and designing halls and libraries and for coordinating with Provincial and National departments and NGOs on health, social welfare and other facilities;
• Develop a main street upgrading programme including a framework for sidewalk upgrading and landscaping, guidelines for active streets and heritage;
• Develop and implement (incrementally), a Sustainable Streets Project to implement the Activity Streets, Green Streets and Connector Streets identified in the ISDP;
• Collaborate with the Provincial Department of Transport, Bus and Taxi operators to investigate the feasibility of developing a free or subsidized local transport service to improve public transport connections between parts of town.
This programme is closely aligned with the Settlement Response Programme and both are aligned to urban renewal and densification projects as well as projects proposing new settlement areas.
MATRiX.11. PROgRAMME 4: ENABLiNg iNSTiTUTiONAL iNTERVENTiONS
ENABLING INSTITUTIONAL INTERVENTIONSCOMMUNICATION, PARTNERSHIP & ENGAGEMENT
POLICY, INCENTIVES & GUIDELINES
BYLAWS & ZONING SCHEME AMENDMENTS
DESCRIPTION 1. Design and implement a stakeholder engagement process, including surveys with residents and businesses, to establish a baseline to inform public space and social facilities planning, and new LUMS.2. Seek opportunities for creative approaches to the management of public open space, including co-management with property owners / developers / community organisations.3. Engage with taxi associations around strategies for more sustainable public transport. 4. Organise government departments to work together in a coordinated way and to sequence their maintenance and repair work for minimum wastage of resources and time
1. Develop urban design guidelines for development in Kokstad and Franklin.
2. Incentivise compact, mixed-use development with ‘complete streets’, and penalise single-use, auto-dependent developments.
1. Review zoning scheme to enable mixed use at identified neighbourhood centres
DURATION
APPROX. BUDGET
FUNDING SOURCE
The strategic street upgrading project is also closely tied to the Sustainable Urban Drainage Project in the Water Cycle Management Programme and these projects must be managed in partnership.
DOCUMENT PREPARED BY THE CITY THINK SPACE TEAM
STRATEGY DEVELOPMENT PLAN IMPLEMENTATION PLANAG
RIC
ULT
UR
EN
ATU
RAL
R
ESO
UR
CES
INFR
ASTR
UC
TUR
ETO
WN
CR
OSS
RO
ADS
ENAB
LIN
GIN
STIT
UTI
ON
S92
TOW
NIMPLEMENTATION PLAN
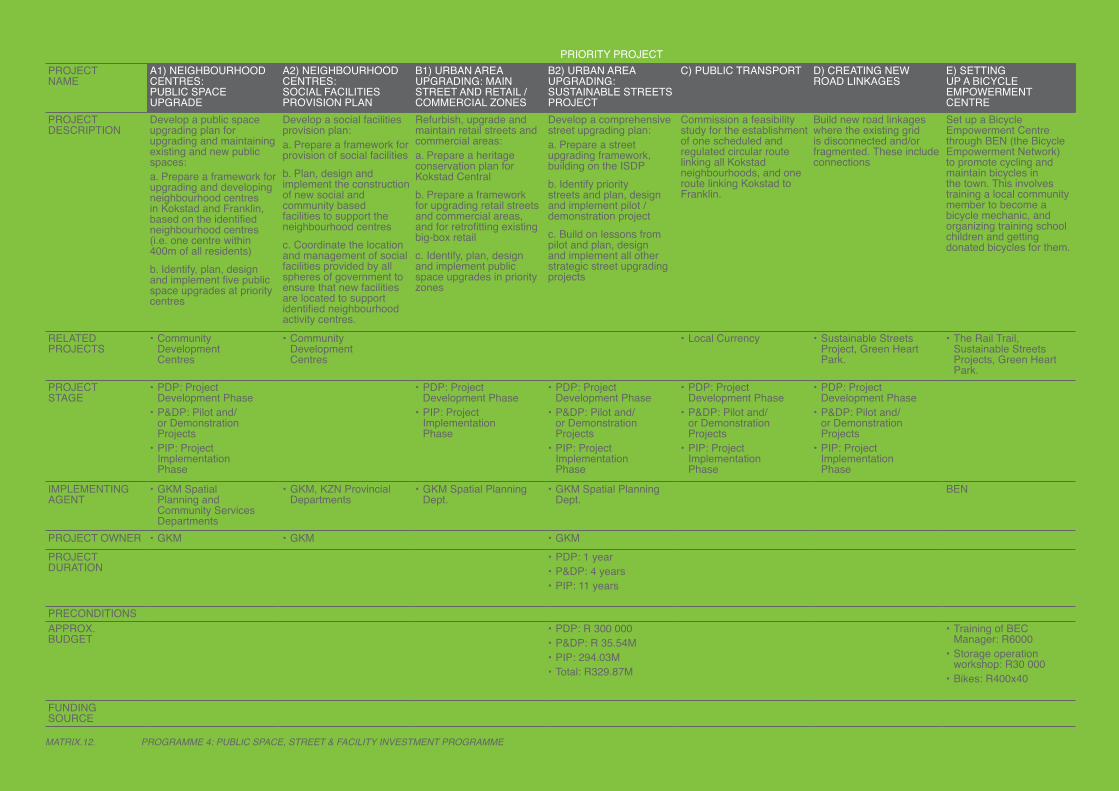
MATRiX.12. PROgRAMME 4: PUBLiC SPACE, STREET & FACiLiTY iNVESTMENT PROgRAMME
PRIORITY PROJECTPROJECT NAME
A1) NEIGHBOURHOOD CENTRES: PUBLIC SPACE UPGRADE
A2) NEIGHBOURHOOD CENTRES: SOCIAL FACILITIES PROVISION PLAN
B1) URBAN AREA UPGRADING: MAIN STREET AND RETAIL / COMMERCIAL ZONES
B2) URBAN AREA UPGRADING: SUSTAINABLE STREETS PROJECT
C) PUBLIC TRANSPORT D) CREATING NEW ROAD LINKAGES
E) SETTING UP A BICYCLE EMPOWERMENT CENTRE
PROJECT DESCRIPTION
Develop a public space upgrading plan for upgrading and maintaining existing and new public spaces:a. Prepare a framework for upgrading and developing neighbourhood centres in Kokstad and Franklin, based on the identified neighbourhood centres (i.e. one centre within 400m of all residents)b. Identify, plan, design and implement five public space upgrades at priority centres
Develop a social facilities provision plan:a. Prepare a framework for provision of social facilitiesb. Plan, design and implement the construction of new social and community based facilities to support the neighbourhood centres c. Coordinate the location and management of social facilities provided by all spheres of government to ensure that new facilities are located to support identified neighbourhood activity centres.
Refurbish, upgrade and maintain retail streets and commercial areas:a. Prepare a heritage conservation plan for Kokstad Central b. Prepare a framework for upgrading retail streets and commercial areas, and for retrofitting existing big-box retailc. Identify, plan, design and implement public space upgrades in priority zones
Develop a comprehensive street upgrading plan:a. Prepare a street upgrading framework, building on the ISDPb. Identify priority streets and plan, design and implement pilot / demonstration projectc. Build on lessons from pilot and plan, design and implement all other strategic street upgrading projects
Commission a feasibility study for the establishment of one scheduled and regulated circular route linking all Kokstad neighbourhoods, and one route linking Kokstad to Franklin.
Build new road linkages where the existing grid is disconnected and/or fragmented. These include connections
Set up a Bicycle Empowerment Centre through BEN (the Bicycle Empowerment Network) to promote cycling and maintain bicycles in the town. This involves training a local community member to become a bicycle mechanic, and organizing training school children and getting donated bicycles for them.
RELATED PROJECTS
• Community Development Centres
• Community Development Centres
• Local Currency • Sustainable Streets Project, Green Heart Park.
• The Rail Trail, Sustainable Streets Projects, Green Heart Park.
PROJECT STAGE
• PDP: Project Development Phase
• P&DP: Pilot and/or Demonstration Projects
• PIP: Project Implementation Phase
• PDP: Project Development Phase
• PIP: Project Implementation Phase
• PDP: Project Development Phase
• P&DP: Pilot and/or Demonstration Projects
• PIP: Project Implementation Phase
• PDP: Project Development Phase
• P&DP: Pilot and/or Demonstration Projects
• PIP: Project Implementation Phase
• PDP: Project Development Phase
• P&DP: Pilot and/or Demonstration Projects
• PIP: Project Implementation Phase
IMPLEMENTING AGENT
• GKM Spatial Planning and Community Services Departments
• GKM, KZN Provincial Departments
• GKM Spatial Planning Dept.
• GKM Spatial Planning Dept.
BEN
PROJECT OWNER • GKM • GKM • GKMPROJECT DURATION
• PDP: 1 year• P&DP: 4 years• PIP: 11 years
PRECONDITIONSAPPROX. BUDGET
• PDP: R 300 000• P&DP: R 35.54M• PIP: 294.03M• Total: R329.87M
• Training of BEC Manager: R6000
• Storage operation workshop: R30 000
• Bikes: R400x40
FUNDING SOURCE
KOKSTAD & FRANKLIN INTEGRATED SUSTAINABLE DEVELOPMENT PLAN
FINAL STRATEGY, DEVELOPMENT PLAN AND IMPLEMENTATION PLAN REPORT | NOVEMBER 2012
93
PROGRAMME 5: SETTLEMENT RESPONSE PROGRAMMEThe desired outcome is sustainable settlement growth. Residential development in Kokstad and Franklin is an opportunity to restructure the form of the settlements as a whole, through the creation of high quality sustainable living environments that are integrated; provide equitable access to opportunities and amenity; are diverse and locally appropriate; and are compact and efficient, optimizing natural, financial, infrastructure and human resources at all scales.
The current need for new residential provision and improved access to a diverse range of accommodation, in terms of form, tenure and affordability, parallel with the imperative of containing the development footprint, gives rise to a response that is essentially about intensification.
The key interventions identified for this programme are grouped as 3 sub-programmes that include seven capital investment projects and three support initiatives that are institutional or operational in nature.
The opportunity for re-structuring the spatial form of post-apartheid SA (including in Kokstad), has so far, largely been missed, however the RDP mechanism has been replaced by the Integrated Residential Development Programme (IRDP) mechanism. This provides for the development of sites within a project for income groups that fall outside of the subsidy affordability bands, as well as non-residential sites.
The current KZN strategy indicates a policy shift from delivery of numbers and ownership, to sustainability, with emphasis on rental as a strategy for achieving this. Kokstad does not currently qualify for social housing funding as it does not have the required Urban Re-structuring Zone (URZ) however application can be made to have URZ’s designated.
The programme proposes that the GKM commits to three sub-programmes and projects:• New integrated neighbourhoods
- Pursue the R56 Integrated Sustainable Settlement Project as a pilot, and include a mix of uses, typologies, tenure, and delivery agents.
- Plan new IDRP Project(s) within the existing urban footprint. Use the R56 concept as a reference. Package these parcels as one phased IRDP project even though the parcels are not contiguous.
- Review current planned/approved projects in order to improve their sustainability as well as the sustainability of the town. Explore the feasibility of PPP arrangement that allows the GKM to apply for IRDP funding. (developer puts in the raw land and gets a portion of serviced land out)
• Rental Housing - Facilitate new Private Rental
development within IRPD projects, including the R56 project. Make parcels of land available on condition the housing remains rental for a reasonable period.
- Apply for urban re-structuring zones to enable Social Housing and engage with potential SHI’s to co-develop feasibility studies
- Re-develop existing CRU sites• Urban Densification and Intensification
- Do detailed planning for densification of existing town, including changes to the Town Planning Zoning Scheme to enable private sector densification development.
This programme is closely aligned with all of the infrastructure programmes, and the Green Building Programme. New settlement projects must take cognizance of these. It is also aligned with the Public Space, Street and Facility Investment Programme, as well as the Localised Economy Programme, which aim to improve the long term sustainability of the whole town.
The GKM’s Kokstad Integrated Sustainable Settlements (KISS) Programme and the R56 project are aligned with the intentions of this ISDP.
For an expanded introduction to this programme, please see the annexures of this report.
ENABLING INSTITUTIONAL INTERVENTIONSCOMMUNICATION, PARTNERSHIP & ENGAGEMENT
POLICY, INCENTIVES & GUIDELINES
BYLAWS & ZONING SCHEME AMENDMENTS
DESCRIPTION 1. Raise public awareness and co-operations.
2. Demand survey.
3. Facilitate involvement of Social Housing Institution(s) in Kokstad, and co-develop pre-feasibility studies>
1. Promote and enable infill development in recommended areas2. Establish green building guidelines and policies3. Housing Sector Plan
Scheme amendments to align with ISDP intents:• Second dwelling as
a primary right• Recommended
densities and coverage
• Multi-storey walk-up and cluster residential development on vacant or under developed sites along main roads.
• Completely prohibit new residential developments outside existing urban footprint.
DURATION
APPROX. BUDGET
FUNDING SOURCE GKM
MATRiX.13. PROgRAMME 5: ENABLiNg iNSTiTUTiONAL iNTERVENTiONS
DOCUMENT PREPARED BY THE CITY THINK SPACE TEAM
STRATEGY DEVELOPMENT PLAN IMPLEMENTATION PLANAG
RIC
ULT
UR
EN
ATU
RAL
R
ESO
UR
CES
INFR
ASTR
UC
TUR
ETO
WN
CR
OSS
RO
ADS
ENAB
LIN
GIN
STIT
UTI
ON
S94
TOW
NIMPLEMENTATION PLAN
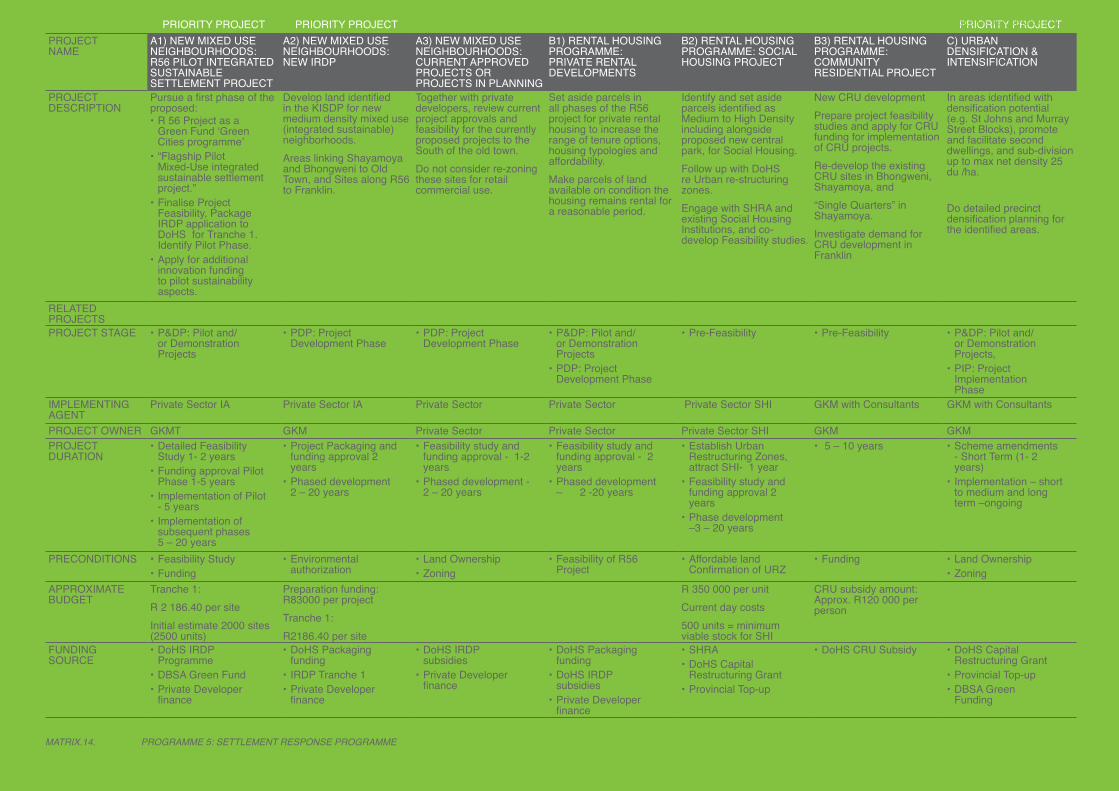
MATRiX.14. PROgRAMME 5: SETTLEMENT RESPONSE PROgRAMME
PRIORITY PROJECT PRIORITY PROJECT PRIORITY PROJECTPROJECT NAME
A1) NEW MIXED USE NEIGHBOURHOODS: R56 PILOT INTEGRATED SUSTAINABLE SETTLEMENT PROJECT
A2) NEW MIXED USE NEIGHBOURHOODS: NEW IRDP
A3) NEW MIXED USE NEIGHBOURHOODS: CURRENT APPROVED PROJECTS OR PROJECTS IN PLANNING
B1) RENTAL HOUSING PROGRAMME: PRIVATE RENTAL DEVELOPMENTS
B2) RENTAL HOUSING PROGRAMME: SOCIAL HOUSING PROJECT
B3) RENTAL HOUSING PROGRAMME: COMMUNITY RESIDENTIAL PROJECT
C) URBAN DENSIFICATION & INTENSIFICATION
PROJECT DESCRIPTION
Pursue a first phase of the proposed:• R 56 Project as a
Green Fund ‘Green Cities programme’
• “Flagship Pilot Mixed-Use integrated sustainable settlement project.”
• Finalise Project Feasibility, Package IRDP application to DoHS for Tranche 1. Identify Pilot Phase.
• Apply for additional innovation funding to pilot sustainability aspects.
Develop land identified in the KISDP for new medium density mixed use (integrated sustainable) neighborhoods.Areas linking Shayamoya and Bhongweni to Old Town, and Sites along R56 to Franklin.
Together with private developers, review current project approvals and feasibility for the currently proposed projects to the South of the old town.Do not consider re-zoning these sites for retail commercial use.
Set aside parcels in all phases of the R56 project for private rental housing to increase the range of tenure options, housing typologies and affordability. Make parcels of land available on condition the housing remains rental for a reasonable period.
Identify and set aside parcels identified as Medium to High Density including alongside proposed new central park, for Social Housing.Follow up with DoHS re Urban re-structuring zones.Engage with SHRA and existing Social Housing Institutions, and co-develop Feasibility studies.
New CRU developmentPrepare project feasibility studies and apply for CRU funding for implementation of CRU projects.Re-develop the existing CRU sites in Bhongweni, Shayamoya, and “Single Quarters” in Shayamoya.Investigate demand for CRU development in Franklin
In areas identified with densification potential (e.g. St Johns and Murray Street Blocks), promote and facilitate second dwellings, and sub-division up to max net density 25 du /ha.
Do detailed precinct densification planning for the identified areas.
RELATED PROJECTSPROJECT STAGE • P&DP: Pilot and/
or Demonstration Projects
• PDP: Project Development Phase
• PDP: Project Development Phase
• P&DP: Pilot and/or Demonstration Projects
• PDP: Project Development Phase
• Pre-Feasibility • Pre-Feasibility • P&DP: Pilot and/or Demonstration Projects,
• PIP: Project Implementation Phase
IMPLEMENTING AGENT
Private Sector IA Private Sector IA Private Sector Private Sector Private Sector SHI GKM with Consultants GKM with Consultants
PROJECT OWNER GKMT GKM Private Sector Private Sector Private Sector SHI GKM GKM PROJECT DURATION
• Detailed Feasibility Study 1- 2 years
• Funding approval Pilot Phase 1-5 years
• Implementation of Pilot - 5 years
• Implementation of subsequent phases 5 – 20 years
• Project Packaging and funding approval 2 years
• Phased development 2 – 20 years
• Feasibility study and funding approval - 1-2 years
• Phased development - 2 – 20 years
• Feasibility study and funding approval - 2 years
• Phased development – 2 -20 years
• Establish Urban Restructuring Zones, attract SHI- 1 year
• Feasibility study and funding approval 2 years
• Phase development –3 – 20 years
• 5 – 10 years • Scheme amendments - Short Term (1- 2 years)
• Implementation – short to medium and long term –ongoing
PRECONDITIONS • Feasibility Study• Funding
• Environmental authorization
• Land Ownership• Zoning
• Feasibility of R56 Project
• Affordable land Confirmation of URZ
• Funding • Land Ownership• Zoning
APPROXIMATE BUDGET
Tranche 1: R 2 186.40 per siteInitial estimate 2000 sites (2500 units)
Preparation funding: R83000 per projectTranche 1: R2186.40 per site
R 350 000 per unitCurrent day costs500 units = minimum viable stock for SHI
CRU subsidy amount: Approx. R120 000 per person
FUNDING SOURCE
• DoHS IRDP Programme
• DBSA Green Fund • Private Developer
finance
• DoHS Packaging funding
• IRDP Tranche 1• Private Developer
finance
• DoHS IRDP subsidies
• Private Developer finance
• DoHS Packaging funding
• DoHS IRDP subsidies
• Private Developer finance
• SHRA • DoHS Capital
Restructuring Grant• Provincial Top-up
• DoHS CRU Subsidy • DoHS Capital Restructuring Grant
• Provincial Top-up• DBSA Green
Funding
KOKSTAD & FRANKLIN INTEGRATED SUSTAINABLE DEVELOPMENT PLAN
FINAL STRATEGY, DEVELOPMENT PLAN AND IMPLEMENTATION PLAN REPORT | NOVEMBER 2012
95
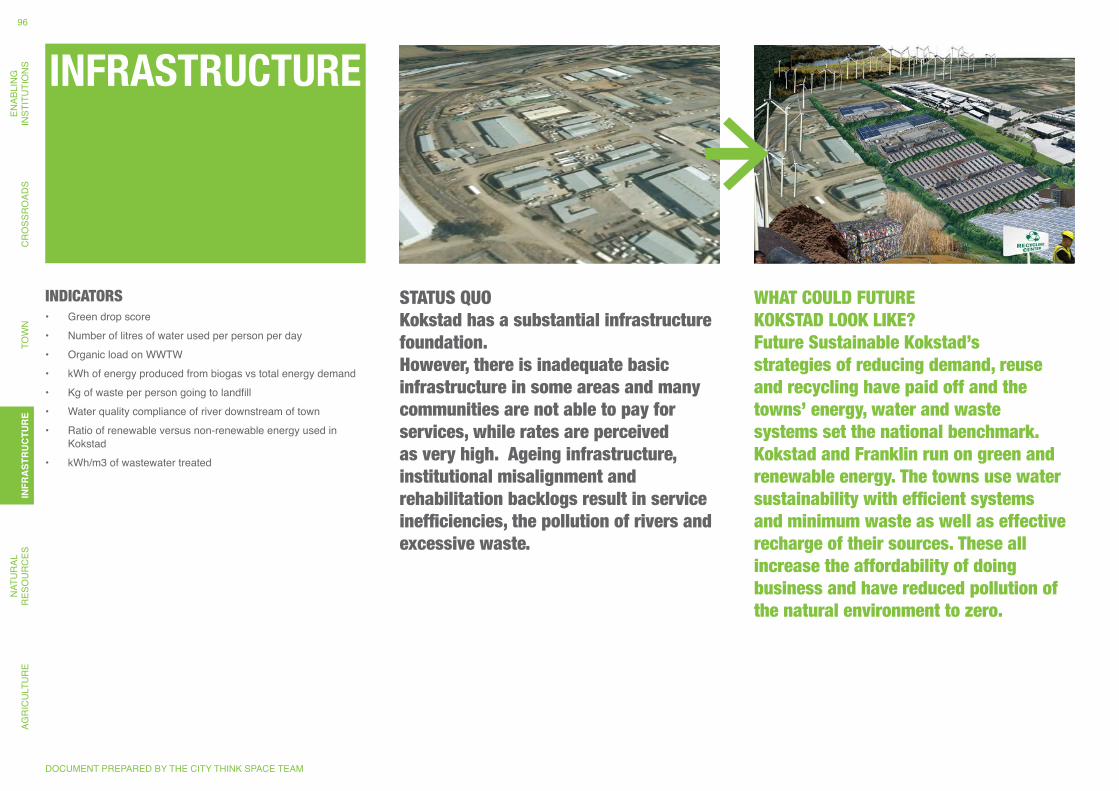
INFRASTRUCTURE
STATUS QUO Kokstad has a substantial infrastructure foundation.However, there is inadequate basic infrastructure in some areas and many communities are not able to pay for services, while rates are perceived as very high. Ageing infrastructure, institutional misalignment and rehabilitation backlogs result in service inefficiencies, the pollution of rivers and excessive waste.
WHAT COULD FUTURE KOKSTAD LOOK LIKE? Future Sustainable Kokstad’s strategies of reducing demand, reuse and recycling have paid off and the towns’ energy, water and waste systems set the national benchmark. Kokstad and Franklin run on green and renewable energy. The towns use water sustainability with efficient systems and minimum waste as well as effective recharge of their sources. These all increase the affordability of doing business and have reduced pollution of the natural environment to zero.
INDICATORS • Green drop score• Number of litres of water used per person per day• Organic load on WWTW• kWh of energy produced from biogas vs total energy demand• Kg of waste per person going to landfill• Water quality compliance of river downstream of town• Ratio of renewable versus non-renewable energy used in
Kokstad• kWh/m3 of wastewater treated
DOCUMENT PREPARED BY THE CITY THINK SPACE TEAM
AGR
ICU
LTU
RE
NAT
UR
AL
RES
OU
RC
ESIN
FRAS
TRU
CTU
RE
TOW
NC
RO
SSR
OAD
SEN
ABLI
NG
INST
ITU
TIO
NS
96IN
FRA
STR
UC
TUR
E
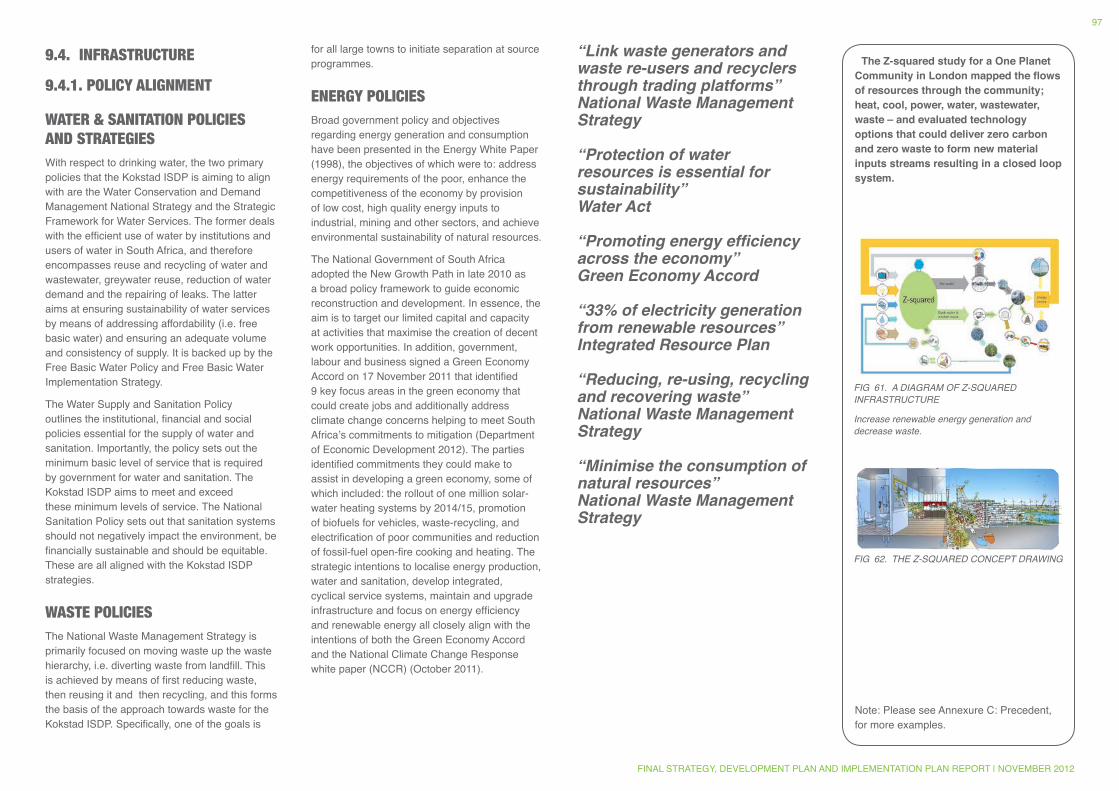
The Z-squared study for a One Planet Community in London mapped the flows of resources through the community; heat, cool, power, water, wastewater, waste – and evaluated technology options that could deliver zero carbon and zero waste to form new material inputs streams resulting in a closed loop system.
Note: Please see Annexure C: Precedent, for more examples.
Fig 61. A DiAgRAM OF Z-SQUARED iNFRASTRUCTURE
increase renewable energy generation and decrease waste.
Fig 62. THE Z-SQUARED CONCEPT DRAWiNg
“Link waste generators and waste re-users and recyclers through trading platforms”National Waste Management Strategy
“Protection of water resources is essential for sustainability”Water Act
“Promoting energy efficiency across the economy”Green Economy Accord
“33% of electricity generation from renewable resources”Integrated Resource Plan
“Reducing, re-using, recycling and recovering waste”National Waste Management Strategy
“Minimise the consumption of natural resources”National Waste Management Strategy
9.4. INFRASTRUCTURE
9.4.1. POLICY ALIGNMENT
WATER & SANITATION POLICIES AND STRATEGIESWith respect to drinking water, the two primary policies that the Kokstad ISDP is aiming to align with are the Water Conservation and Demand Management National Strategy and the Strategic Framework for Water Services. The former deals with the efficient use of water by institutions and users of water in South Africa, and therefore encompasses reuse and recycling of water and wastewater, greywater reuse, reduction of water demand and the repairing of leaks. The latter aims at ensuring sustainability of water services by means of addressing affordability (i.e. free basic water) and ensuring an adequate volume and consistency of supply. It is backed up by the Free Basic Water Policy and Free Basic Water Implementation Strategy.
The Water Supply and Sanitation Policy outlines the institutional, financial and social policies essential for the supply of water and sanitation. Importantly, the policy sets out the minimum basic level of service that is required by government for water and sanitation. The Kokstad ISDP aims to meet and exceed these minimum levels of service. The National Sanitation Policy sets out that sanitation systems should not negatively impact the environment, be financially sustainable and should be equitable. These are all aligned with the Kokstad ISDP strategies.
WASTE POLICIESThe National Waste Management Strategy is primarily focused on moving waste up the waste hierarchy, i.e. diverting waste from landfill. This is achieved by means of first reducing waste, then reusing it and then recycling, and this forms the basis of the approach towards waste for the Kokstad ISDP. Specifically, one of the goals is
for all large towns to initiate separation at source programmes.
ENERGY POLICIESBroad government policy and objectives regarding energy generation and consumption have been presented in the Energy White Paper (1998), the objectives of which were to: address energy requirements of the poor, enhance the competitiveness of the economy by provision of low cost, high quality energy inputs to industrial, mining and other sectors, and achieve environmental sustainability of natural resources.
The National Government of South Africa adopted the New Growth Path in late 2010 as a broad policy framework to guide economic reconstruction and development. In essence, the aim is to target our limited capital and capacity at activities that maximise the creation of decent work opportunities. In addition, government, labour and business signed a Green Economy Accord on 17 November 2011 that identified 9 key focus areas in the green economy that could create jobs and additionally address climate change concerns helping to meet South Africa’s commitments to mitigation (Department of Economic Development 2012). The parties identified commitments they could make to assist in developing a green economy, some of which included: the rollout of one million solar-water heating systems by 2014/15, promotion of biofuels for vehicles, waste-recycling, and electrification of poor communities and reduction of fossil-fuel open-fire cooking and heating. The strategic intentions to localise energy production, water and sanitation, develop integrated, cyclical service systems, maintain and upgrade infrastructure and focus on energy efficiency and renewable energy all closely align with the intentions of both the Green Economy Accord and the National Climate Change Response white paper (NCCR) (October 2011).
FINAL STRATEGY, DEVELOPMENT PLAN AND IMPLEMENTATION PLAN REPORT | NOVEMBER 2012
97
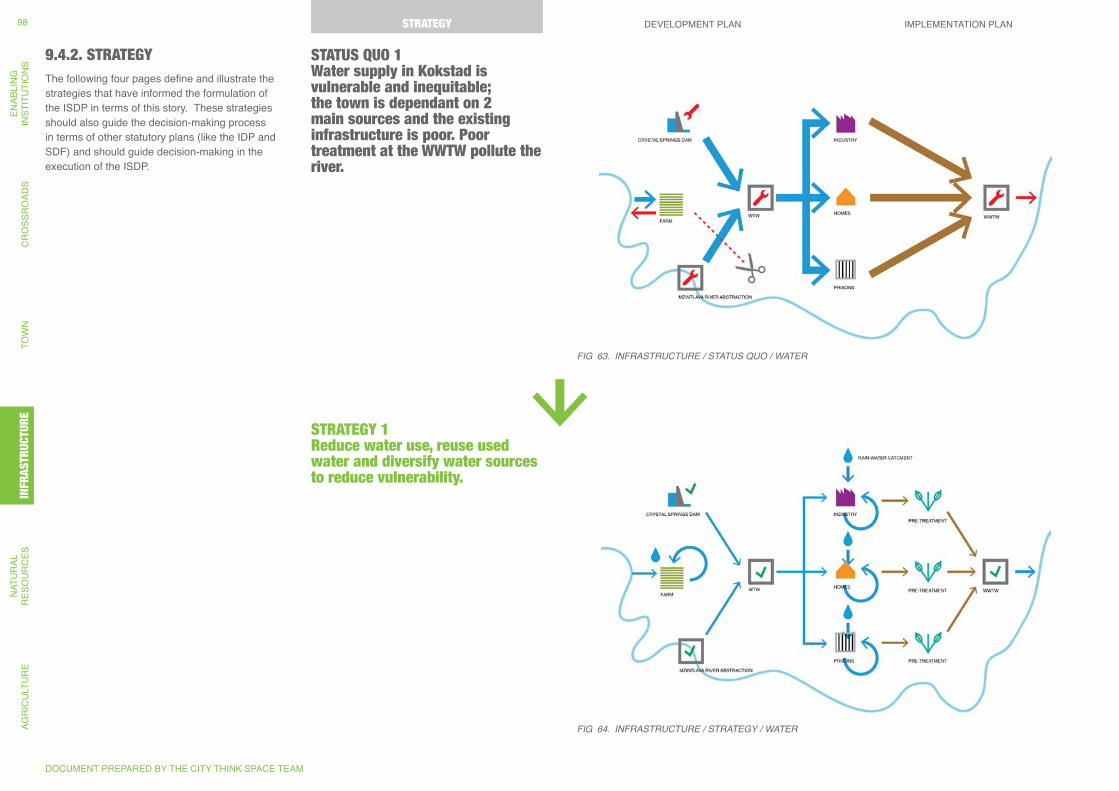
STATUS QUO 1 Water supply in Kokstad is vulnerable and inequitable; the town is dependant on 2 main sources and the existing infrastructure is poor. Poor treatment at the WWTW pollute the river.
Fig 63. iNFRASTRUCTURE / STATUS QUO / WATER
9.4.2. STRATEGYThe following four pages define and illustrate the strategies that have informed the formulation of the ISDP in terms of this story. These strategies should also guide the decision-making process in terms of other statutory plans (like the IDP and SDF) and should guide decision-making in the execution of the ISDP.
STRATEGY 1 Reduce water use, reuse used water and diversify water sources to reduce vulnerability.
Fig 64. iNFRASTRUCTURE / STRATEgY / WATER
DOCUMENT PREPARED BY THE CITY THINK SPACE TEAM
STRATEGY DEVELOPMENT PLAN IMPLEMENTATION PLANAG
RIC
ULT
UR
EN
ATU
RAL
R
ESO
UR
CES
INFR
ASTR
UC
TUR
ETO
WN
CR
OSS
RO
ADS
ENAB
LIN
GIN
STIT
UTI
ON
S98 STRATEGY
INFR
ASTR
UCTU
RE
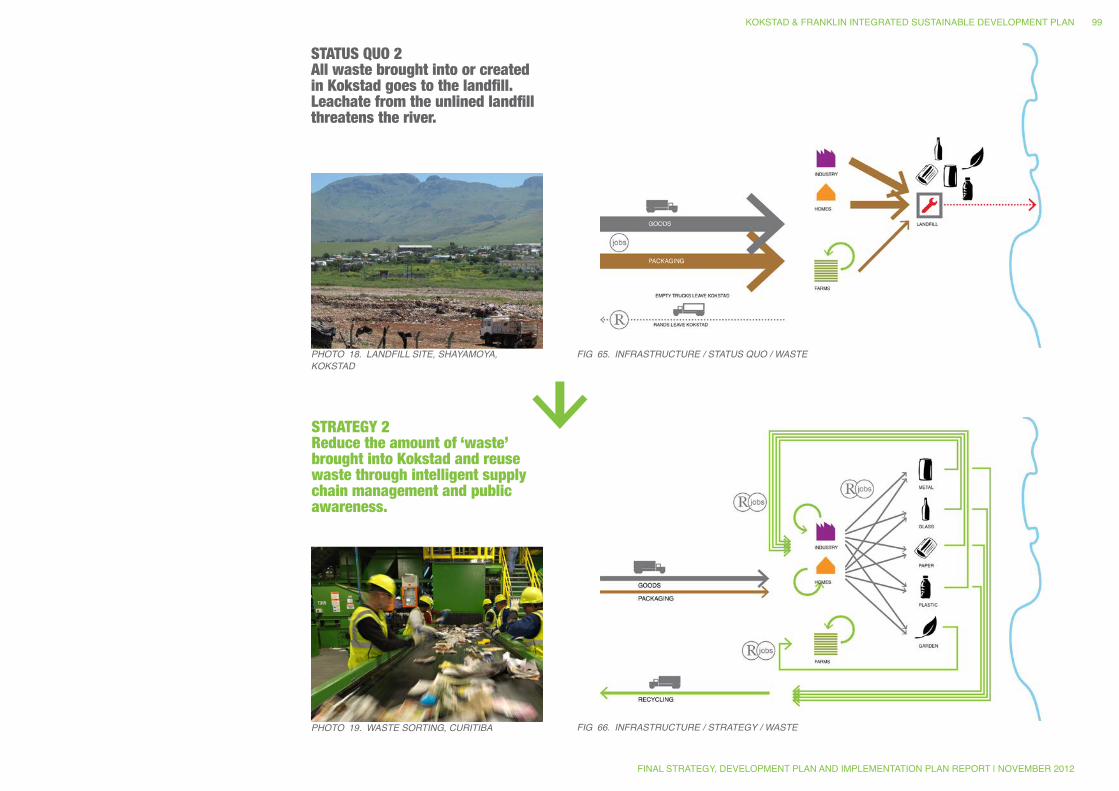
STATUS QUO 2 All waste brought into or created in Kokstad goes to the landfill. Leachate from the unlined landfill threatens the river.
PHOTO 18. LANDFiLL SiTE, SHAYAMOYA, KOKSTAD
Fig 65. iNFRASTRUCTURE / STATUS QUO / WASTE
STRATEGY 2 Reduce the amount of ‘waste’ brought into Kokstad and reuse waste through intelligent supply chain management and public awareness.
PHOTO 19. WASTE SORTiNg, CURiTiBA Fig 66. iNFRASTRUCTURE / STRATEgY / WASTE
KOKSTAD & FRANKLIN INTEGRATED SUSTAINABLE DEVELOPMENT PLAN
FINAL STRATEGY, DEVELOPMENT PLAN AND IMPLEMENTATION PLAN REPORT | NOVEMBER 2012
99
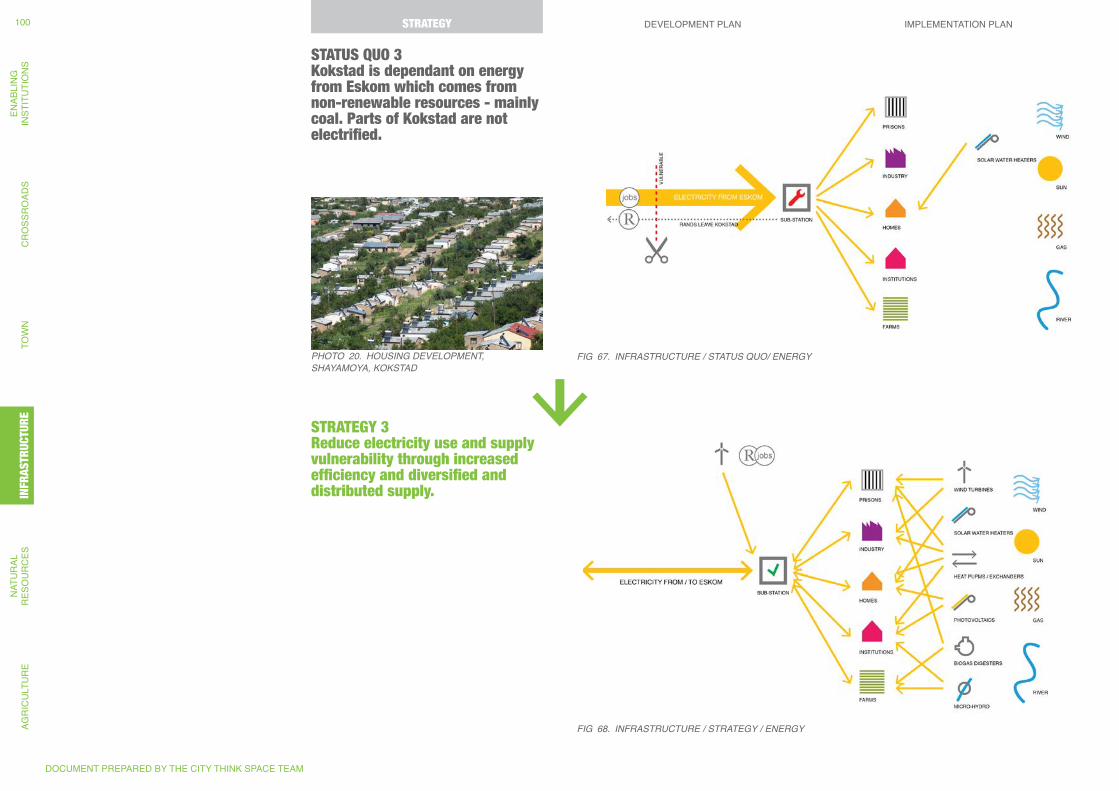
STATUS QUO 3 Kokstad is dependant on energy from Eskom which comes from non-renewable resources - mainly coal. Parts of Kokstad are not electrified.
PHOTO 20. HOUSiNg DEVELOPMENT, SHAYAMOYA, KOKSTAD
Fig 67. iNFRASTRUCTURE / STATUS QUO/ ENERgY
STRATEGY 3 Reduce electricity use and supply vulnerability through increased efficiency and diversified and distributed supply.
Fig 68. iNFRASTRUCTURE / STRATEgY / ENERgY
DOCUMENT PREPARED BY THE CITY THINK SPACE TEAM
STRATEGY DEVELOPMENT PLAN IMPLEMENTATION PLANAG
RIC
ULT
UR
EN
ATU
RAL
R
ESO
UR
CES
INFR
ASTR
UC
TUR
ETO
WN
CR
OSS
RO
ADS
ENAB
LIN
GIN
STIT
UTI
ON
S100 STRATEGY
INFR
ASTR
UCTU
RE
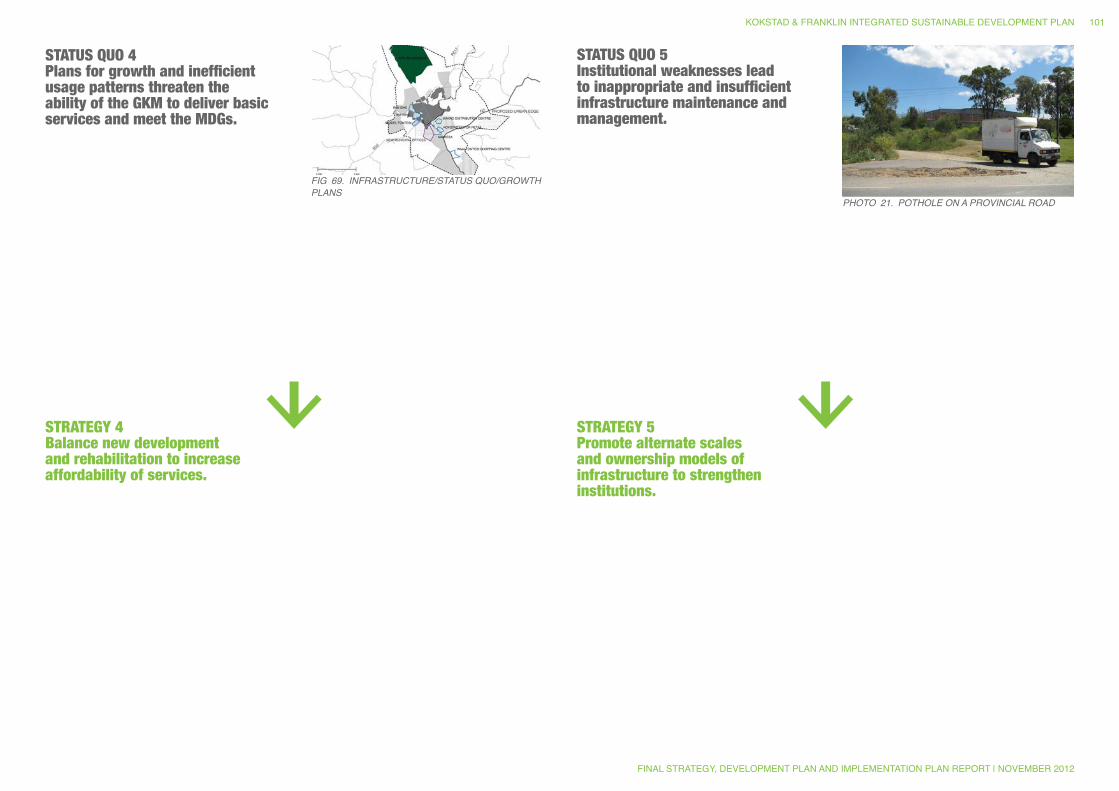
STATUS QUO 4 Plans for growth and inefficient usage patterns threaten the ability of the GKM to deliver basic services and meet the MDGs.
STATUS QUO 5 Institutional weaknesses lead to inappropriate and insufficient infrastructure maintenance and management.
PHOTO 21. POTHOLE ON A PROViNCiAL ROAD
Fig 69. iNFRASTRUCTURE/STATUS QUO/gROWTH PLANS
STRATEGY 4 Balance new development and rehabilitation to increase affordability of services.
STRATEGY 5 Promote alternate scales and ownership models of infrastructure to strengthen institutions.
KOKSTAD & FRANKLIN INTEGRATED SUSTAINABLE DEVELOPMENT PLAN
FINAL STRATEGY, DEVELOPMENT PLAN AND IMPLEMENTATION PLAN REPORT | NOVEMBER 2012
101
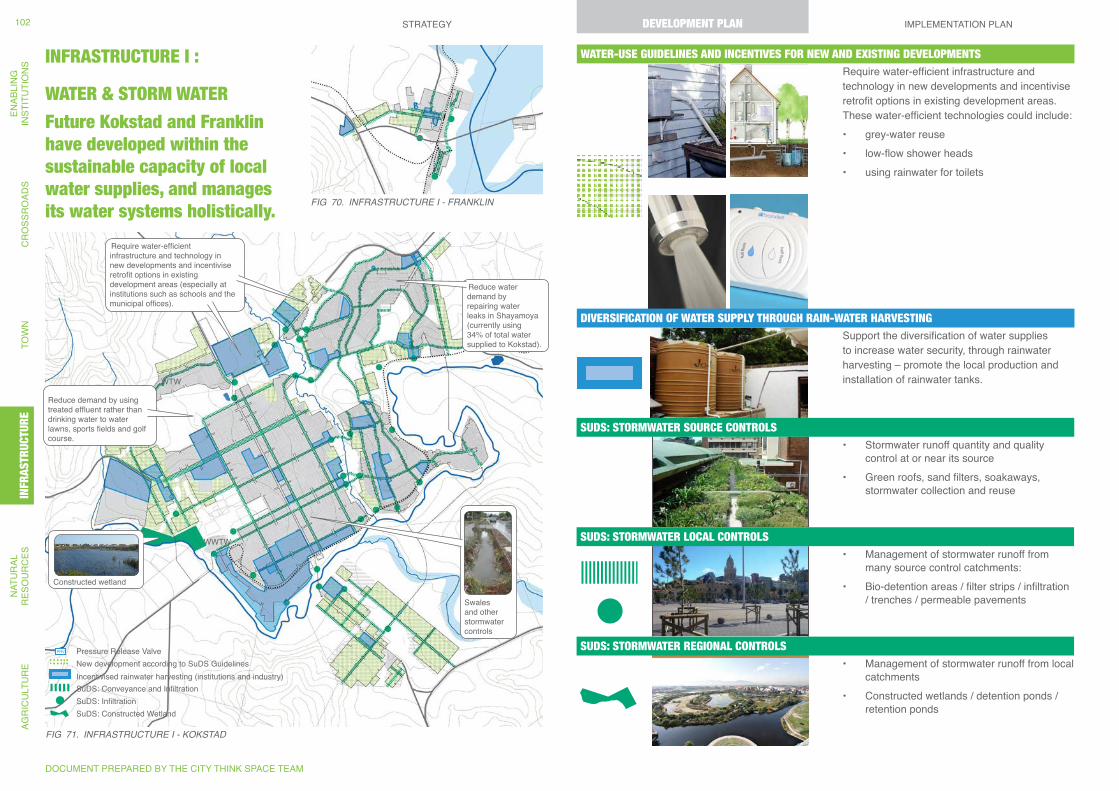
Fig 70. iNFRASTRUCTURE i - FRANKLiN
Fig 71. iNFRASTRUCTURE i - KOKSTAD
Reduce demand by using treated effluent rather than drinking water to water lawns, sports fields and golf course.
WWTW
WTW
Swales and other stormwater controls
Reduce water demand by repairing water leaks in Shayamoya (currently using 34% of total water supplied to Kokstad).
Require water-efficient infrastructure and technology in new developments and incentivise retrofit options in existing development areas (especially at institutions such as schools and the municipal offices).
Constructed wetland
SuDS: Conveyance and InfiltrationSuDS: InfiltrationSuDS: Constructed Wetland
New development according to SuDS GuidelinesIncentivised rainwater harvesting (institutions and industry)
Pressure Release ValvePRV
INFRASTRUCTURE I :
WATER & STORM WATER
Future Kokstad and Franklin have developed within the sustainable capacity of local water supplies, and manages its water systems holistically.
Require water-efficient infrastructure and technology in new developments and incentivise retrofit options in existing development areas. These water-efficient technologies could include:• grey-water reuse• low-flow shower heads • using rainwater for toilets
Support the diversification of water supplies to increase water security, through rainwater harvesting – promote the local production and installation of rainwater tanks.
WATER-USE GUIDELINES AND INCENTIVES FOR NEW AND EXISTING DEVELOPMENTS
DIVERSIFICATION OF WATER SUPPLY THROUGH RAIN-WATER HARVESTING
• Stormwater runoff quantity and quality control at or near its source
• Green roofs, sand filters, soakaways, stormwater collection and reuse
• Management of stormwater runoff from many source control catchments:
• Bio-detention areas / filter strips / infiltration / trenches / permeable pavements
• Management of stormwater runoff from local catchments
• Constructed wetlands / detention ponds / retention ponds
SUDS: STORMWATER REGIONAL CONTROLS
SUDS: STORMWATER SOURCE CONTROLS
SUDS: STORMWATER LOCAL CONTROLS
DOCUMENT PREPARED BY THE CITY THINK SPACE TEAM
STRATEGY DEVELOPMENT PLAN IMPLEMENTATION PLANAG
RIC
ULT
UR
EN
ATU
RAL
R
ESO
UR
CES
INFR
ASTR
UC
TUR
ETO
WN
CR
OSS
RO
ADS
ENAB
LIN
GIN
STIT
UTI
ON
S102 DEVELOPMENT PLAN
INFR
ASTR
UCTU
RE
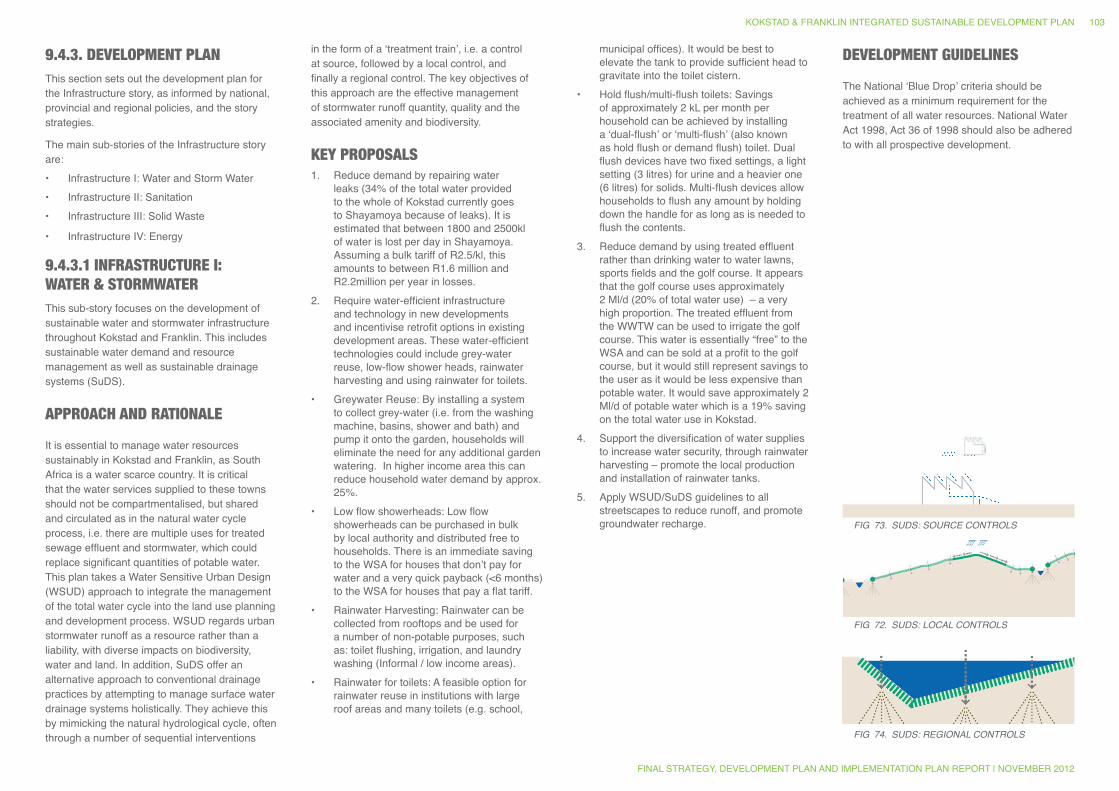
9.4.3. DEVELOPMENT PLANThis section sets out the development plan for the Infrastructure story, as informed by national, provincial and regional policies, and the story strategies.
The main sub-stories of the Infrastructure story are:• Infrastructure I: Water and Storm Water• Infrastructure II: Sanitation• Infrastructure III: Solid Waste
• Infrastructure IV: Energy
9.4.3.1 INFRASTRUCTURE I: WATER & STORMWATERThis sub-story focuses on the development of sustainable water and stormwater infrastructure throughout Kokstad and Franklin. This includes sustainable water demand and resource management as well as sustainable drainage systems (SuDS).
APPROACH AND RATIONALE
It is essential to manage water resources sustainably in Kokstad and Franklin, as South Africa is a water scarce country. It is critical that the water services supplied to these towns should not be compartmentalised, but shared and circulated as in the natural water cycle process, i.e. there are multiple uses for treated sewage effluent and stormwater, which could replace significant quantities of potable water. This plan takes a Water Sensitive Urban Design (WSUD) approach to integrate the management of the total water cycle into the land use planning and development process. WSUD regards urban stormwater runoff as a resource rather than a liability, with diverse impacts on biodiversity, water and land. In addition, SuDS offer an alternative approach to conventional drainage practices by attempting to manage surface water drainage systems holistically. They achieve this by mimicking the natural hydrological cycle, often through a number of sequential interventions
in the form of a ‘treatment train’, i.e. a control at source, followed by a local control, and finally a regional control. The key objectives of this approach are the effective management of stormwater runoff quantity, quality and the associated amenity and biodiversity.
KEY PROPOSALS1. Reduce demand by repairing water
leaks (34% of the total water provided to the whole of Kokstad currently goes to Shayamoya because of leaks). It is estimated that between 1800 and 2500kl of water is lost per day in Shayamoya. Assuming a bulk tariff of R2.5/kl, this amounts to between R1.6 million and R2.2million per year in losses.
2. Require water-efficient infrastructure and technology in new developments and incentivise retrofit options in existing development areas. These water-efficient technologies could include grey-water reuse, low-flow shower heads, rainwater harvesting and using rainwater for toilets.
• Greywater Reuse: By installing a system to collect grey-water (i.e. from the washing machine, basins, shower and bath) and pump it onto the garden, households will eliminate the need for any additional garden watering. In higher income area this can reduce household water demand by approx. 25%.
• Low flow showerheads: Low flow showerheads can be purchased in bulk by local authority and distributed free to households. There is an immediate saving to the WSA for houses that don’t pay for water and a very quick payback (<6 months) to the WSA for houses that pay a flat tariff.
• Rainwater Harvesting: Rainwater can be collected from rooftops and be used for a number of non-potable purposes, such as: toilet flushing, irrigation, and laundry washing (Informal / low income areas).
• Rainwater for toilets: A feasible option for rainwater reuse in institutions with large roof areas and many toilets (e.g. school,
municipal offices). It would be best to elevate the tank to provide sufficient head to gravitate into the toilet cistern.
• Hold flush/multi-flush toilets: Savings of approximately 2 kL per month per household can be achieved by installing a ‘dual-flush’ or ‘multi-flush’ (also known as hold flush or demand flush) toilet. Dual flush devices have two fixed settings, a light setting (3 litres) for urine and a heavier one (6 litres) for solids. Multi-flush devices allow households to flush any amount by holding down the handle for as long as is needed to flush the contents.
3. Reduce demand by using treated effluent rather than drinking water to water lawns, sports fields and the golf course. It appears that the golf course uses approximately 2 Ml/d (20% of total water use) – a very high proportion. The treated effluent from the WWTW can be used to irrigate the golf course. This water is essentially “free” to the WSA and can be sold at a profit to the golf course, but it would still represent savings to the user as it would be less expensive than potable water. It would save approximately 2 Ml/d of potable water which is a 19% saving on the total water use in Kokstad.
4. Support the diversification of water supplies to increase water security, through rainwater harvesting – promote the local production and installation of rainwater tanks.
5. Apply WSUD/SuDS guidelines to all streetscapes to reduce runoff, and promote groundwater recharge.
Fig 72. SUDS: LOCAL CONTROLS
Fig 74. SUDS: REgiONAL CONTROLS
Fig 73. SUDS: SOURCE CONTROLS
DEVELOPMENT GUIDELINES
The National ‘Blue Drop’ criteria should be achieved as a minimum requirement for the treatment of all water resources. National Water Act 1998, Act 36 of 1998 should also be adhered to with all prospective development.
KOKSTAD & FRANKLIN INTEGRATED SUSTAINABLE DEVELOPMENT PLAN
FINAL STRATEGY, DEVELOPMENT PLAN AND IMPLEMENTATION PLAN REPORT | NOVEMBER 2012
103
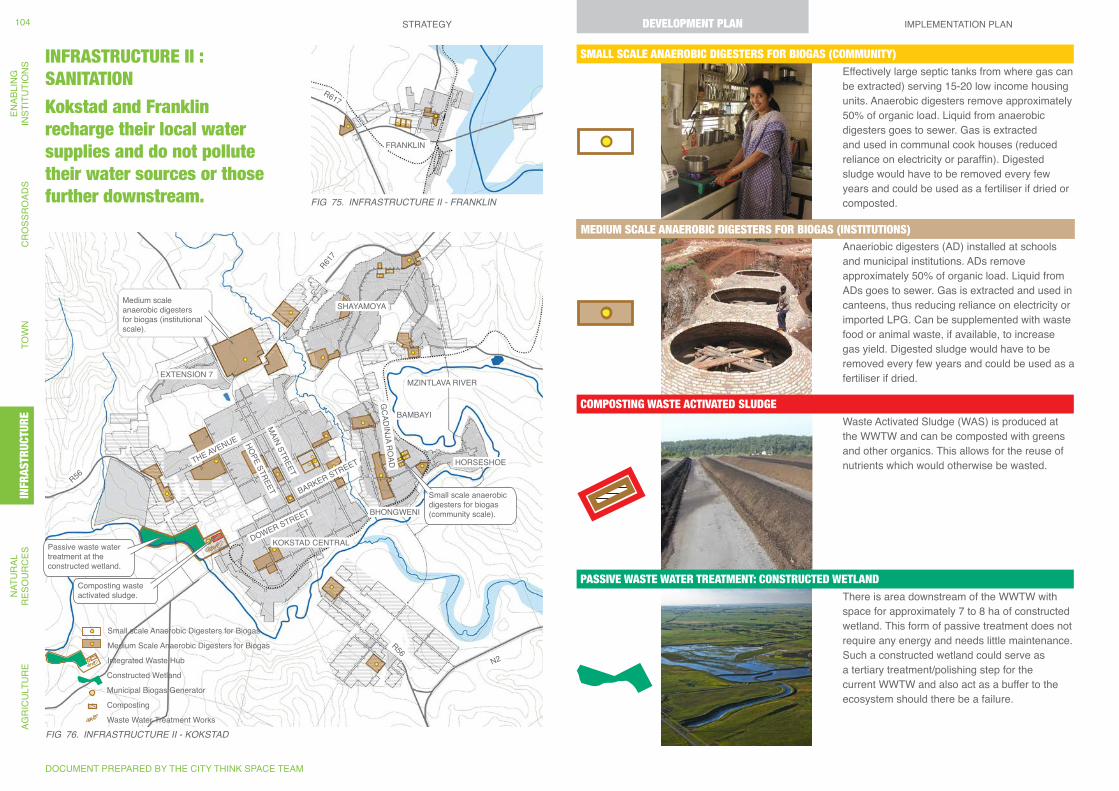
KOKSTAD CENTRAL
THE AVENUE
MAIN STREET
GCADINJA RO
AD
BARKER STREET
HOPE STREET
DOWER STREET
SHAYAMOYA
EXTENSION 7
BAMBAYI
HORSESHOE
BHONGWENI
R56
R617
R617
R56N2
MZINTLAVA RIVER
FRANKLIN
Integrated Waste Hub
Constructed Wetland
Municipal Biogas Generator
Composting
Waste Water Treatment Works
Small scale Anaerobic Digesters for Biogas
Medium Scale Anaerobic Digesters for Biogas
Small scale anaerobic digesters for biogas (community scale).
Composting waste activated sludge.
Passive waste water treatment at the constructed wetland.
Medium scale anaerobic digesters for biogas (institutional scale).
INFRASTRUCTURE II : SANITATION
Kokstad and Franklin recharge their local water supplies and do not pollute their water sources or those further downstream.
Effectively large septic tanks from where gas can be extracted) serving 15-20 low income housing units. Anaerobic digesters remove approximately 50% of organic load. Liquid from anaerobic digesters goes to sewer. Gas is extracted and used in communal cook houses (reduced reliance on electricity or paraffin). Digested sludge would have to be removed every few years and could be used as a fertiliser if dried or composted.
Anaeriobic digesters (AD) installed at schools and municipal institutions. ADs remove approximately 50% of organic load. Liquid from ADs goes to sewer. Gas is extracted and used in canteens, thus reducing reliance on electricity or imported LPG. Can be supplemented with waste food or animal waste, if available, to increase gas yield. Digested sludge would have to be removed every few years and could be used as a fertiliser if dried.
There is area downstream of the WWTW with space for approximately 7 to 8 ha of constructed wetland. This form of passive treatment does not require any energy and needs little maintenance. Such a constructed wetland could serve as a tertiary treatment/polishing step for the current WWTW and also act as a buffer to the ecosystem should there be a failure.
Waste Activated Sludge (WAS) is produced at the WWTW and can be composted with greens and other organics. This allows for the reuse of nutrients which would otherwise be wasted.
Fig 75. iNFRASTRUCTURE ii - FRANKLiN
Fig 76. iNFRASTRUCTURE ii - KOKSTAD
PASSIVE WASTE WATER TREATMENT: CONSTRUCTED WETLAND
COMPOSTING WASTE ACTIVATED SLUDGE
MEDIUM SCALE ANAEROBIC DIGESTERS FOR BIOGAS (INSTITUTIONS)
SMALL SCALE ANAEROBIC DIGESTERS FOR BIOGAS (COMMUNITY)
DOCUMENT PREPARED BY THE CITY THINK SPACE TEAM
STRATEGY DEVELOPMENT PLAN IMPLEMENTATION PLANAG
RIC
ULT
UR
EN
ATU
RAL
R
ESO
UR
CES
INFR
ASTR
UC
TUR
ETO
WN
CR
OSS
RO
ADS
ENAB
LIN
GIN
STIT
UTI
ON
S104 DEVELOPMENT PLAN
INFR
ASTR
UCTU
RE
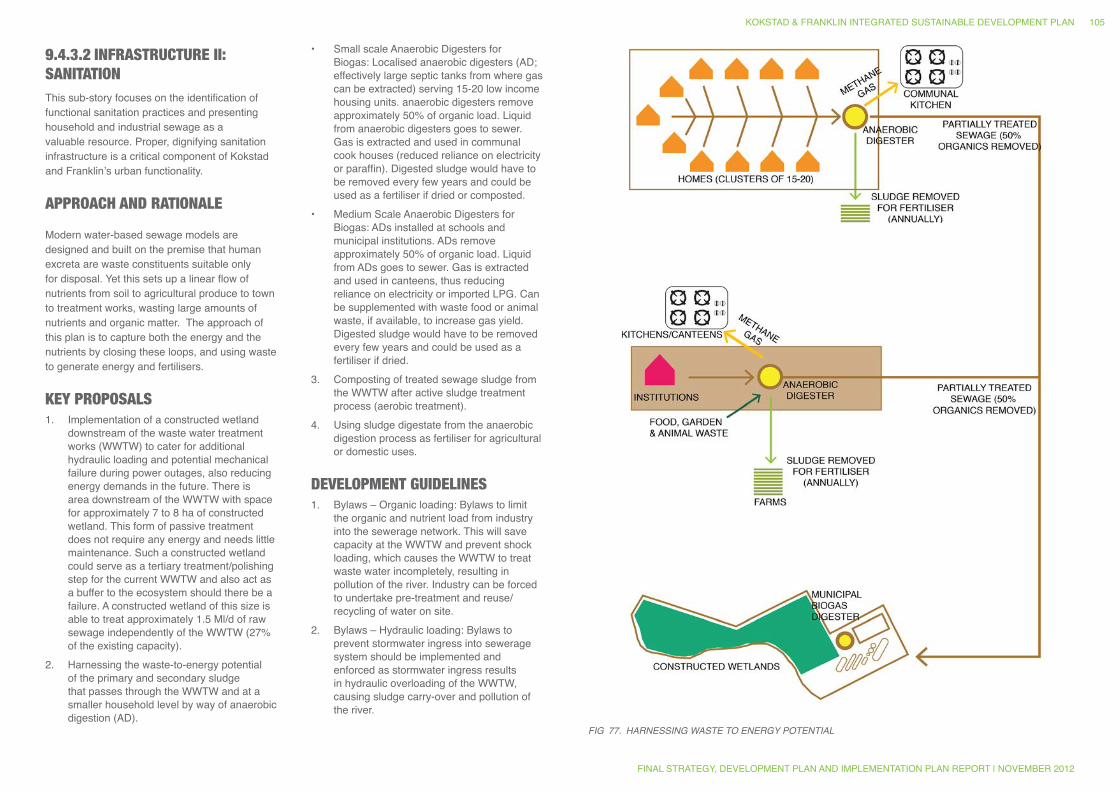
9.4.3.2 INFRASTRUCTURE II: SANITATIONThis sub-story focuses on the identification of functional sanitation practices and presenting household and industrial sewage as a valuable resource. Proper, dignifying sanitation infrastructure is a critical component of Kokstad and Franklin’s urban functionality.
APPROACH AND RATIONALE
Modern water-based sewage models are designed and built on the premise that human excreta are waste constituents suitable only for disposal. Yet this sets up a linear flow of nutrients from soil to agricultural produce to town to treatment works, wasting large amounts of nutrients and organic matter. The approach of this plan is to capture both the energy and the nutrients by closing these loops, and using waste to generate energy and fertilisers.
KEY PROPOSALS1. Implementation of a constructed wetland
downstream of the waste water treatment works (WWTW) to cater for additional hydraulic loading and potential mechanical failure during power outages, also reducing energy demands in the future. There is area downstream of the WWTW with space for approximately 7 to 8 ha of constructed wetland. This form of passive treatment does not require any energy and needs little maintenance. Such a constructed wetland could serve as a tertiary treatment/polishing step for the current WWTW and also act as a buffer to the ecosystem should there be a failure. A constructed wetland of this size is able to treat approximately 1.5 Ml/d of raw sewage independently of the WWTW (27% of the existing capacity).
2. Harnessing the waste-to-energy potential of the primary and secondary sludge that passes through the WWTW and at a smaller household level by way of anaerobic digestion (AD).
• Small scale Anaerobic Digesters for Biogas: Localised anaerobic digesters (AD; effectively large septic tanks from where gas can be extracted) serving 15-20 low income housing units. anaerobic digesters remove approximately 50% of organic load. Liquid from anaerobic digesters goes to sewer. Gas is extracted and used in communal cook houses (reduced reliance on electricity or paraffin). Digested sludge would have to be removed every few years and could be used as a fertiliser if dried or composted.
• Medium Scale Anaerobic Digesters for Biogas: ADs installed at schools and municipal institutions. ADs remove approximately 50% of organic load. Liquid from ADs goes to sewer. Gas is extracted and used in canteens, thus reducing reliance on electricity or imported LPG. Can be supplemented with waste food or animal waste, if available, to increase gas yield. Digested sludge would have to be removed every few years and could be used as a fertiliser if dried.
3. Composting of treated sewage sludge from the WWTW after active sludge treatment process (aerobic treatment).
4. Using sludge digestate from the anaerobic digestion process as fertiliser for agricultural or domestic uses.
DEVELOPMENT GUIDELINES1. Bylaws – Organic loading: Bylaws to limit
the organic and nutrient load from industry into the sewerage network. This will save capacity at the WWTW and prevent shock loading, which causes the WWTW to treat waste water incompletely, resulting in pollution of the river. Industry can be forced to undertake pre-treatment and reuse/recycling of water on site.
2. Bylaws – Hydraulic loading: Bylaws to prevent stormwater ingress into sewerage system should be implemented and enforced as stormwater ingress results in hydraulic overloading of the WWTW, causing sludge carry-over and pollution of the river.
Fig 77. HARNESSiNg WASTE TO ENERgY POTENTiAL
KOKSTAD & FRANKLIN INTEGRATED SUSTAINABLE DEVELOPMENT PLAN
FINAL STRATEGY, DEVELOPMENT PLAN AND IMPLEMENTATION PLAN REPORT | NOVEMBER 2012
105
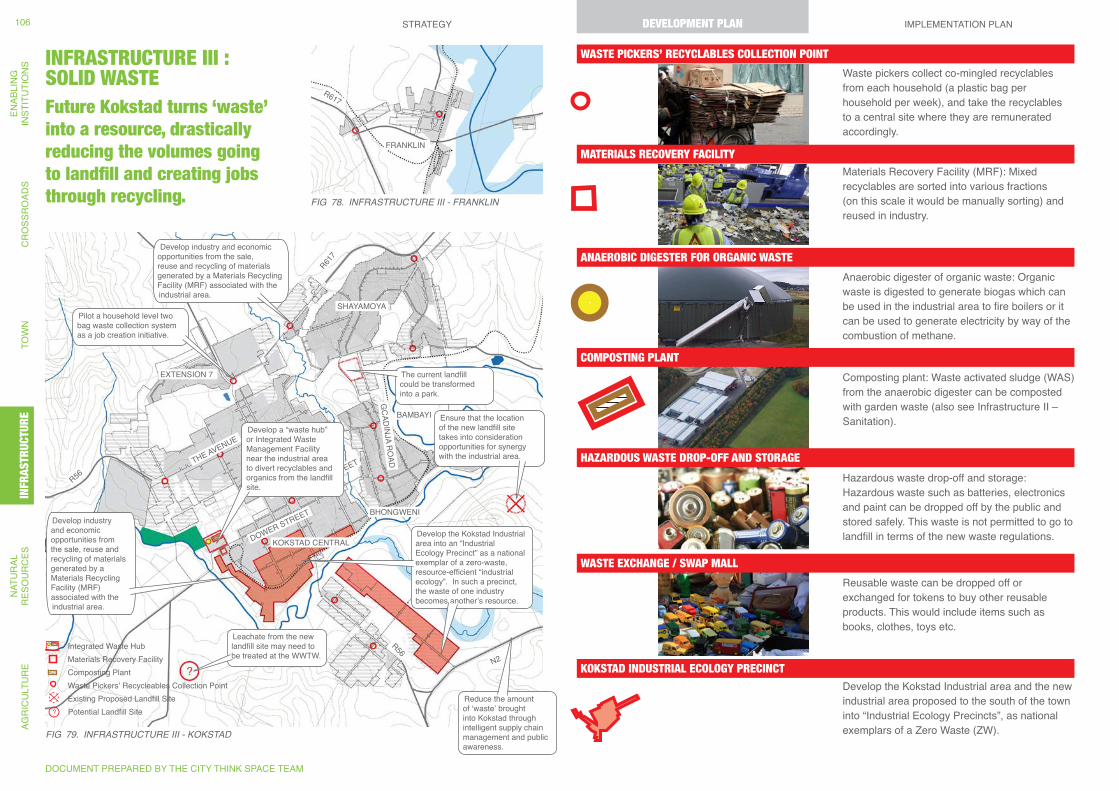
KOKSTAD INDUSTRIAL ECOLOGY PRECINCT
HAZARDOUS WASTE DROP-OFF AND STORAGE
ANAEROBIC DIGESTER FOR ORGANIC WASTE
WASTE EXCHANGE / SWAP MALL
MATERIALS RECOVERY FACILITY
WASTE PICKERS’ RECYCLABLES COLLECTION POINT
COMPOSTING PLANT
KOKSTAD CENTRAL
THE AVENUE
MAIN STREET
GCADINJA RO
AD
BARKER STREET
HOPE STREET
DOWER STREET
SHAYAMOYA
EXTENSION 7
BAMBAYI
HORSESHOE
BHONGWENI
R56
R617
R617
R56N2
MZINTLAVA RIVER
FRANKLIN
?
Composting PlantWaste Pickers’ Recycleables Collection PointExisting Proposed Landfill SitePotential Landfill Site
Integrated Waste HubMaterials Recovery Facility
Develop a “waste hub” or Integrated Waste Management Facility near the industrial area to divert recyclables and organics from the landfill site.
Leachate from the new landfill site may need to be treated at the WWTW.
Ensure that the location of the new landfill site takes into consideration opportunities for synergy with the industrial area.
The current landfill could be transformed into a park.
Reduce the amount of ‘waste’ brought into Kokstad through intelligent supply chain management and public awareness.
Develop the Kokstad Industrial area into an “Industrial Ecology Precinct” as a national exemplar of a zero-waste, resource-efficient “industrial ecology”. In such a precinct, the waste of one industry becomes another’s resource.
Pilot a household level two bag waste collection system as a job creation initiative.
Develop industry and economic opportunities from the sale, reuse and recycling of materials generated by a Materials Recycling Facility (MRF) associated with the industrial area.
Develop industry and economic opportunities from the sale, reuse and recycling of materials generated by a Materials Recycling Facility (MRF) associated with the industrial area.
INFRASTRUCTURE III : SOLID WASTEFuture Kokstad turns ‘waste’ into a resource, drastically reducing the volumes going to landfill and creating jobs through recycling.
Anaerobic digester of organic waste: Organic waste is digested to generate biogas which can be used in the industrial area to fire boilers or it can be used to generate electricity by way of the combustion of methane.
Reusable waste can be dropped off or exchanged for tokens to buy other reusable products. This would include items such as books, clothes, toys etc.
Develop the Kokstad Industrial area and the new industrial area proposed to the south of the town into “Industrial Ecology Precincts”, as national exemplars of a Zero Waste (ZW).
Materials Recovery Facility (MRF): Mixed recyclables are sorted into various fractions (on this scale it would be manually sorting) and reused in industry.
Waste pickers collect co-mingled recyclables from each household (a plastic bag per household per week), and take the recyclables to a central site where they are remunerated accordingly.
Composting plant: Waste activated sludge (WAS) from the anaerobic digester can be composted with garden waste (also see Infrastructure II – Sanitation).
Hazardous waste drop-off and storage: Hazardous waste such as batteries, electronics and paint can be dropped off by the public and stored safely. This waste is not permitted to go to landfill in terms of the new waste regulations.
Fig 78. iNFRASTRUCTURE iii - FRANKLiN
Fig 79. iNFRASTRUCTURE iii - KOKSTAD
DOCUMENT PREPARED BY THE CITY THINK SPACE TEAM
STRATEGY DEVELOPMENT PLAN IMPLEMENTATION PLANAG
RIC
ULT
UR
EN
ATU
RAL
R
ESO
UR
CES
INFR
ASTR
UC
TUR
ETO
WN
CR
OSS
RO
ADS
ENAB
LIN
GIN
STIT
UTI
ON
S106 DEVELOPMENT PLAN
INFR
ASTR
UCTU
RE
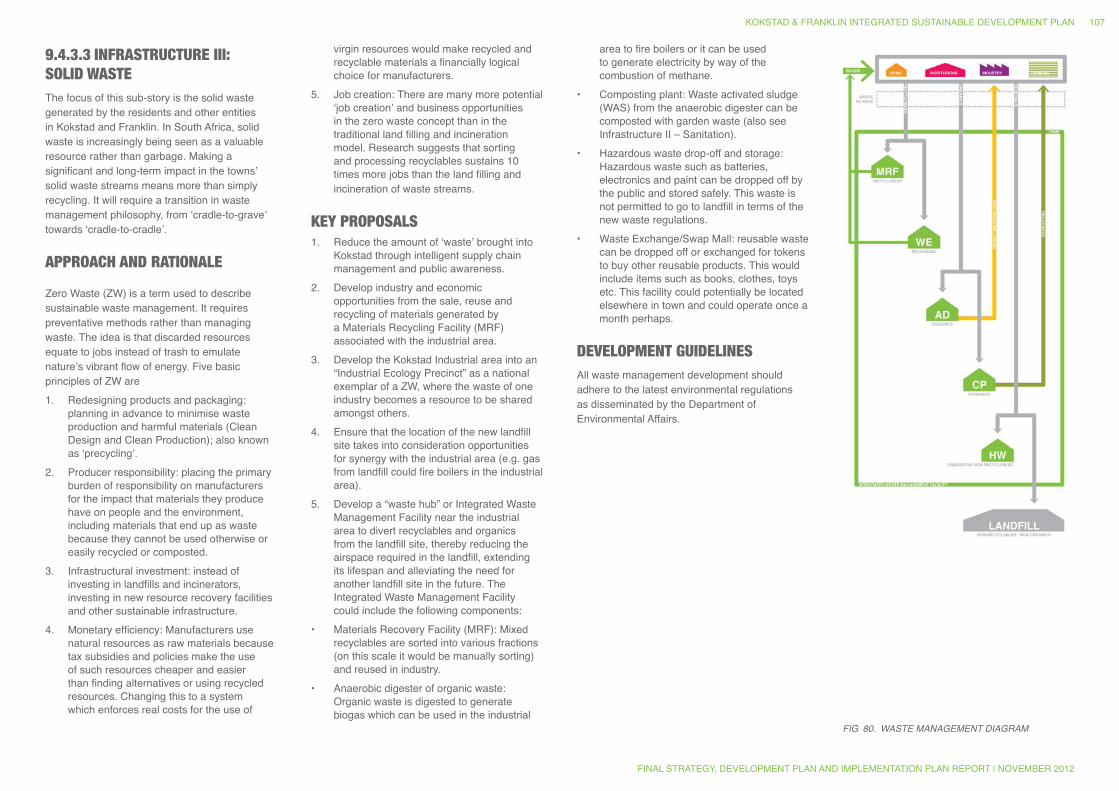
9.4.3.3 INFRASTRUCTURE III: SOLID WASTEThe focus of this sub-story is the solid waste generated by the residents and other entities in Kokstad and Franklin. In South Africa, solid waste is increasingly being seen as a valuable resource rather than garbage. Making a significant and long-term impact in the towns’ solid waste streams means more than simply recycling. It will require a transition in waste management philosophy, from ‘cradle-to-grave’ towards ‘cradle-to-cradle’.
APPROACH AND RATIONALE
Zero Waste (ZW) is a term used to describe sustainable waste management. It requires preventative methods rather than managing waste. The idea is that discarded resources equate to jobs instead of trash to emulate nature’s vibrant flow of energy. Five basic principles of ZW are1. Redesigning products and packaging:
planning in advance to minimise waste production and harmful materials (Clean Design and Clean Production); also known as ‘precycling’.
2. Producer responsibility: placing the primary burden of responsibility on manufacturers for the impact that materials they produce have on people and the environment, including materials that end up as waste because they cannot be used otherwise or easily recycled or composted.
3. Infrastructural investment: instead of investing in landfills and incinerators, investing in new resource recovery facilities and other sustainable infrastructure.
4. Monetary efficiency: Manufacturers use natural resources as raw materials because tax subsidies and policies make the use of such resources cheaper and easier than finding alternatives or using recycled resources. Changing this to a system which enforces real costs for the use of
virgin resources would make recycled and recyclable materials a financially logical choice for manufacturers.
5. Job creation: There are many more potential ‘job creation’ and business opportunities in the zero waste concept than in the traditional land filling and incineration model. Research suggests that sorting and processing recyclables sustains 10 times more jobs than the land filling and incineration of waste streams.
KEY PROPOSALS1. Reduce the amount of ‘waste’ brought into
Kokstad through intelligent supply chain management and public awareness.
2. Develop industry and economic opportunities from the sale, reuse and recycling of materials generated by a Materials Recycling Facility (MRF) associated with the industrial area.
3. Develop the Kokstad Industrial area into an “Industrial Ecology Precinct” as a national exemplar of a ZW, where the waste of one industry becomes a resource to be shared amongst others.
4. Ensure that the location of the new landfill site takes into consideration opportunities for synergy with the industrial area (e.g. gas from landfill could fire boilers in the industrial area).
5. Develop a “waste hub” or Integrated Waste Management Facility near the industrial area to divert recyclables and organics from the landfill site, thereby reducing the airspace required in the landfill, extending its lifespan and alleviating the need for another landfill site in the future. The Integrated Waste Management Facility could include the following components:
• Materials Recovery Facility (MRF): Mixed recyclables are sorted into various fractions (on this scale it would be manually sorting) and reused in industry.
• Anaerobic digester of organic waste: Organic waste is digested to generate biogas which can be used in the industrial
area to fire boilers or it can be used to generate electricity by way of the combustion of methane.
• Composting plant: Waste activated sludge (WAS) from the anaerobic digester can be composted with garden waste (also see Infrastructure II – Sanitation).
• Hazardous waste drop-off and storage: Hazardous waste such as batteries, electronics and paint can be dropped off by the public and stored safely. This waste is not permitted to go to landfill in terms of the new waste regulations.
• Waste Exchange/Swap Mall: reusable waste can be dropped off or exchanged for tokens to buy other reusable products. This would include items such as books, clothes, toys etc. This facility could potentially be located elsewhere in town and could operate once a month perhaps.
DEVELOPMENT GUIDELINESAll waste management development should adhere to the latest environmental regulations as disseminated by the Department of Environmental Affairs.
Fig 80. WASTE MANAgEMENT DiAgRAM
KOKSTAD & FRANKLIN INTEGRATED SUSTAINABLE DEVELOPMENT PLAN
FINAL STRATEGY, DEVELOPMENT PLAN AND IMPLEMENTATION PLAN REPORT | NOVEMBER 2012
107
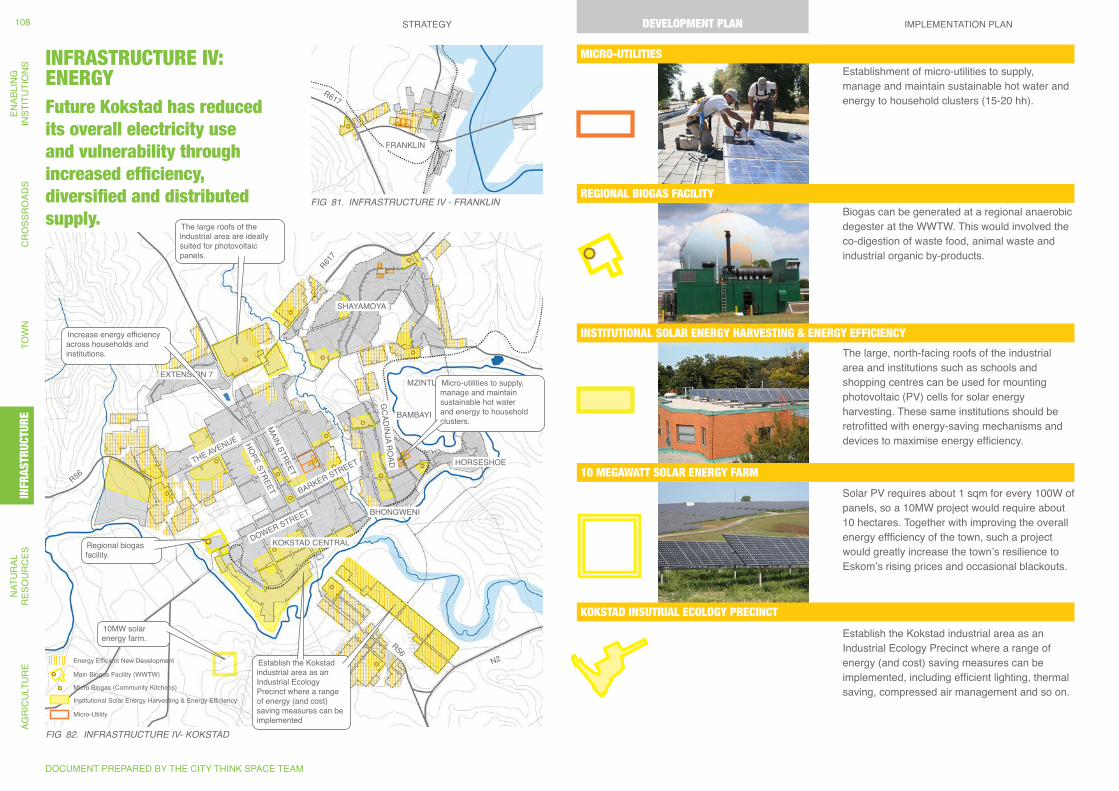
10 MEGAWATT SOLAR ENERGY FARM
KOKSTAD INSUTRIAL ECOLOGY PRECINCT
MICRO-UTILITIES
REGIONAL BIOGAS FACILITY
INSTITUTIONAL SOLAR ENERGY HARVESTING & ENERGY EFFICIENCY
Establish the Kokstad industrial area as an Industrial Ecology Precinct where a range of energy (and cost) saving measures can be implemented, including efficient lighting, thermal saving, compressed air management and so on.
KOKSTAD CENTRAL
THE AVENUE
MAIN STREET
GCADINJA RO
AD
BARKER STREET
HOPE STREET
DOWER STREET
SHAYAMOYA
EXTENSION 7
BAMBAYI
HORSESHOE
BHONGWENI
R56
R617
R617
R56N2
MZINTLAVA RIVER
FRANKLIN
10MW solar energy farm.
The large roofs of the industrial area are ideally suited for photovoltaic panels.
Micro-utilities to supply, manage and maintain sustainable hot water and energy to household clusters.
Increase energy efficiency across households and institutions.
Establish the Kokstad industrial area as an Industrial Ecology Precinct where a range of energy (and cost) saving measures can be implemented
Regional biogas facility.
Micro Biogas (Community Kitchens)
Institutional Solar Energy Harvesting & Energy Efficiency
Micro-Utility
Energy Efficient New Development
Main Biogas Facility (WWTW)
Establishment of micro-utilities to supply, manage and maintain sustainable hot water and energy to household clusters (15-20 hh).
Biogas can be generated at a regional anaerobic degester at the WWTW. This would involved the co-digestion of waste food, animal waste and industrial organic by-products.
The large, north-facing roofs of the industrial area and institutions such as schools and shopping centres can be used for mounting photovoltaic (PV) cells for solar energy harvesting. These same institutions should be retrofitted with energy-saving mechanisms and devices to maximise energy efficiency.
Solar PV requires about 1 sqm for every 100W of panels, so a 10MW project would require about 10 hectares. Together with improving the overall energy effficiency of the town, such a project would greatly increase the town’s resilience to Eskom’s rising prices and occasional blackouts.
INFRASTRUCTURE IV: ENERGYFuture Kokstad has reduced its overall electricity use and vulnerability through increased efficiency, diversified and distributed supply.
Fig 81. iNFRASTRUCTURE iV - FRANKLiN
Fig 82. iNFRASTRUCTURE iV- KOKSTAD
DOCUMENT PREPARED BY THE CITY THINK SPACE TEAM
STRATEGY DEVELOPMENT PLAN IMPLEMENTATION PLANAG
RIC
ULT
UR
EN
ATU
RAL
R
ESO
UR
CES
INFR
ASTR
UC
TUR
ETO
WN
CR
OSS
RO
ADS
ENAB
LIN
GIN
STIT
UTI
ON
S108 DEVELOPMENT PLAN
INFR
ASTR
UCTU
RE
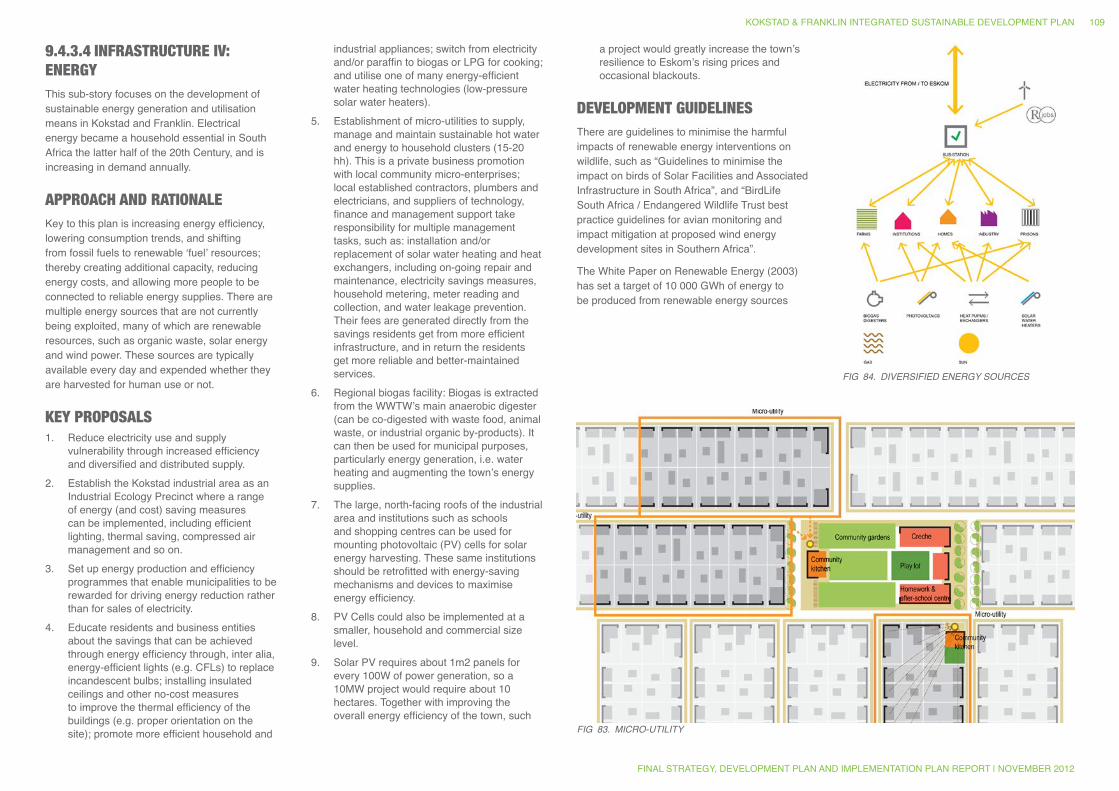
Fig 83. MiCRO-UTiLiTY
Fig 84. DiVERSiFiED ENERgY SOURCES
9.4.3.4 INFRASTRUCTURE IV: ENERGYThis sub-story focuses on the development of sustainable energy generation and utilisation means in Kokstad and Franklin. Electrical energy became a household essential in South Africa the latter half of the 20th Century, and is increasing in demand annually.
APPROACH AND RATIONALE Key to this plan is increasing energy efficiency, lowering consumption trends, and shifting from fossil fuels to renewable ‘fuel’ resources; thereby creating additional capacity, reducing energy costs, and allowing more people to be connected to reliable energy supplies. There are multiple energy sources that are not currently being exploited, many of which are renewable resources, such as organic waste, solar energy and wind power. These sources are typically available every day and expended whether they are harvested for human use or not.
KEY PROPOSALS1. Reduce electricity use and supply
vulnerability through increased efficiency and diversified and distributed supply.
2. Establish the Kokstad industrial area as an Industrial Ecology Precinct where a range of energy (and cost) saving measures can be implemented, including efficient lighting, thermal saving, compressed air management and so on.
3. Set up energy production and efficiency programmes that enable municipalities to be rewarded for driving energy reduction rather than for sales of electricity.
4. Educate residents and business entities about the savings that can be achieved through energy efficiency through, inter alia, energy-efficient lights (e.g. CFLs) to replace incandescent bulbs; installing insulated ceilings and other no-cost measures to improve the thermal efficiency of the buildings (e.g. proper orientation on the site); promote more efficient household and
industrial appliances; switch from electricity and/or paraffin to biogas or LPG for cooking; and utilise one of many energy-efficient water heating technologies (low-pressure solar water heaters).
5. Establishment of micro-utilities to supply, manage and maintain sustainable hot water and energy to household clusters (15-20 hh). This is a private business promotion with local community micro-enterprises; local established contractors, plumbers and electricians, and suppliers of technology, finance and management support take responsibility for multiple management tasks, such as: installation and/or replacement of solar water heating and heat exchangers, including on-going repair and maintenance, electricity savings measures, household metering, meter reading and collection, and water leakage prevention. Their fees are generated directly from the savings residents get from more efficient infrastructure, and in return the residents get more reliable and better-maintained services.
6. Regional biogas facility: Biogas is extracted from the WWTW’s main anaerobic digester (can be co-digested with waste food, animal waste, or industrial organic by-products). It can then be used for municipal purposes, particularly energy generation, i.e. water heating and augmenting the town’s energy supplies.
7. The large, north-facing roofs of the industrial area and institutions such as schools and shopping centres can be used for mounting photovoltaic (PV) cells for solar energy harvesting. These same institutions should be retrofitted with energy-saving mechanisms and devices to maximise energy efficiency.
8. PV Cells could also be implemented at a smaller, household and commercial size level.
9. Solar PV requires about 1m2 panels for every 100W of power generation, so a 10MW project would require about 10 hectares. Together with improving the overall energy efficiency of the town, such
a project would greatly increase the town’s resilience to Eskom’s rising prices and occasional blackouts.
DEVELOPMENT GUIDELINESThere are guidelines to minimise the harmful impacts of renewable energy interventions on wildlife, such as “Guidelines to minimise the impact on birds of Solar Facilities and Associated Infrastructure in South Africa”, and “BirdLife South Africa / Endangered Wildlife Trust best practice guidelines for avian monitoring and impact mitigation at proposed wind energy development sites in Southern Africa”.
The White Paper on Renewable Energy (2003) has set a target of 10 000 GWh of energy to be produced from renewable energy sources
KOKSTAD & FRANKLIN INTEGRATED SUSTAINABLE DEVELOPMENT PLAN
FINAL STRATEGY, DEVELOPMENT PLAN AND IMPLEMENTATION PLAN REPORT | NOVEMBER 2012
109
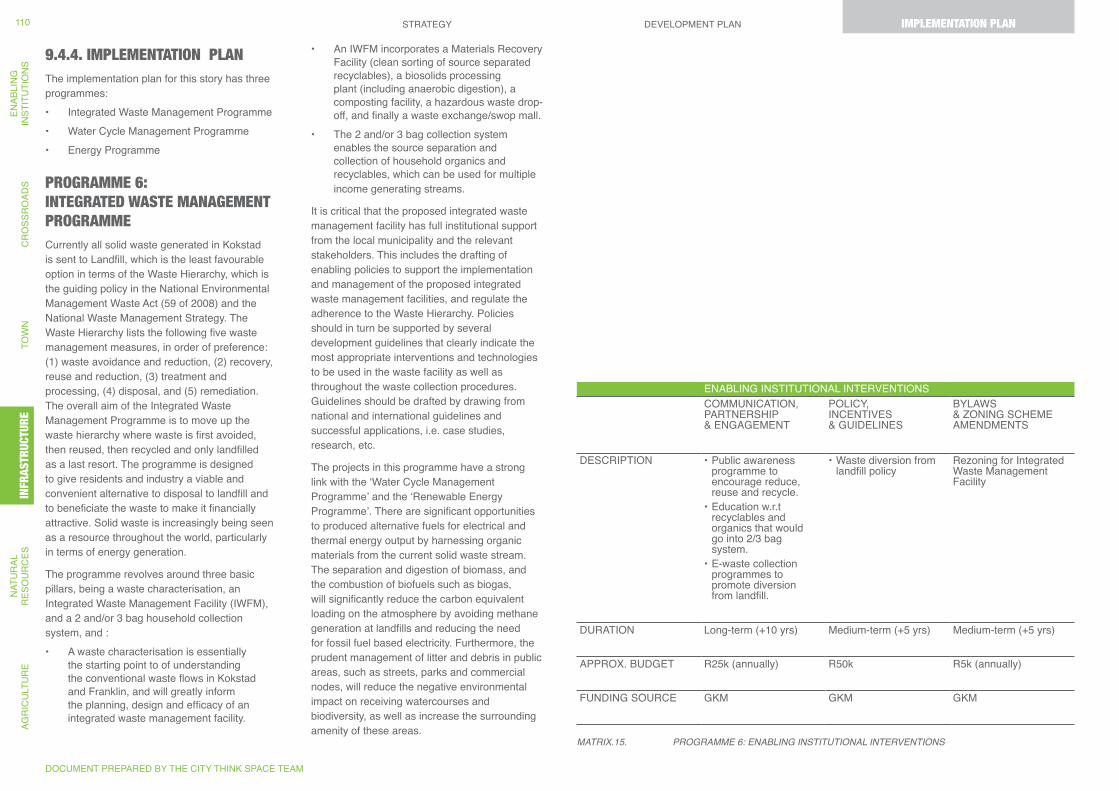
9.4.4. IMPLEMENTATION PLANThe implementation plan for this story has three programmes:• Integrated Waste Management Programme• Water Cycle Management Programme• Energy Programme
PROGRAMME 6: INTEGRATED WASTE MANAGEMENT PROGRAMMECurrently all solid waste generated in Kokstad is sent to Landfill, which is the least favourable option in terms of the Waste Hierarchy, which is the guiding policy in the National Environmental Management Waste Act (59 of 2008) and the National Waste Management Strategy. The Waste Hierarchy lists the following five waste management measures, in order of preference: (1) waste avoidance and reduction, (2) recovery, reuse and reduction, (3) treatment and processing, (4) disposal, and (5) remediation. The overall aim of the Integrated Waste Management Programme is to move up the waste hierarchy where waste is first avoided, then reused, then recycled and only landfilled as a last resort. The programme is designed to give residents and industry a viable and convenient alternative to disposal to landfill and to beneficiate the waste to make it financially attractive. Solid waste is increasingly being seen as a resource throughout the world, particularly in terms of energy generation.
The programme revolves around three basic pillars, being a waste characterisation, an Integrated Waste Management Facility (IWFM), and a 2 and/or 3 bag household collection system, and :• A waste characterisation is essentially
the starting point to of understanding the conventional waste flows in Kokstad and Franklin, and will greatly inform the planning, design and efficacy of an integrated waste management facility.
• An IWFM incorporates a Materials Recovery Facility (clean sorting of source separated recyclables), a biosolids processing plant (including anaerobic digestion), a composting facility, a hazardous waste drop-off, and finally a waste exchange/swop mall.
• The 2 and/or 3 bag collection system enables the source separation and collection of household organics and recyclables, which can be used for multiple income generating streams.
It is critical that the proposed integrated waste management facility has full institutional support from the local municipality and the relevant stakeholders. This includes the drafting of enabling policies to support the implementation and management of the proposed integrated waste management facilities, and regulate the adherence to the Waste Hierarchy. Policies should in turn be supported by several development guidelines that clearly indicate the most appropriate interventions and technologies to be used in the waste facility as well as throughout the waste collection procedures. Guidelines should be drafted by drawing from national and international guidelines and successful applications, i.e. case studies, research, etc.
The projects in this programme have a strong link with the ‘Water Cycle Management Programme’ and the ‘Renewable Energy Programme’. There are significant opportunities to produced alternative fuels for electrical and thermal energy output by harnessing organic materials from the current solid waste stream. The separation and digestion of biomass, and the combustion of biofuels such as biogas, will significantly reduce the carbon equivalent loading on the atmosphere by avoiding methane generation at landfills and reducing the need for fossil fuel based electricity. Furthermore, the prudent management of litter and debris in public areas, such as streets, parks and commercial nodes, will reduce the negative environmental impact on receiving watercourses and biodiversity, as well as increase the surrounding amenity of these areas.
MATRiX.15. PROgRAMME 6: ENABLiNg iNSTiTUTiONAL iNTERVENTiONS
ENABLING INSTITUTIONAL INTERVENTIONSCOMMUNICATION, PARTNERSHIP & ENGAGEMENT
POLICY, INCENTIVES & GUIDELINES
BYLAWS & ZONING SCHEME AMENDMENTS
DESCRIPTION • Public awareness programme to encourage reduce, reuse and recycle.
• Education w.r.t recyclables and organics that would go into 2/3 bag system.
• E-waste collection programmes to promote diversion from landfill.
• Waste diversion from landfill policy
Rezoning for Integrated Waste Management Facility
DURATION Long-term (+10 yrs) Medium-term (+5 yrs) Medium-term (+5 yrs)
APPROX. BUDGET R25k (annually) R50k R5k (annually)
FUNDING SOURCE GKM GKM GKM
DOCUMENT PREPARED BY THE CITY THINK SPACE TEAM
STRATEGY DEVELOPMENT PLAN IMPLEMENTATION PLANAG
RIC
ULT
UR
EN
ATU
RAL
R
ESO
UR
CES
INFR
ASTR
UC
TUR
ETO
WN
CR
OSS
RO
ADS
ENAB
LIN
GIN
STIT
UTI
ON
S110
INFR
ASTR
UCTU
REIMPLEMENTATION PLAN
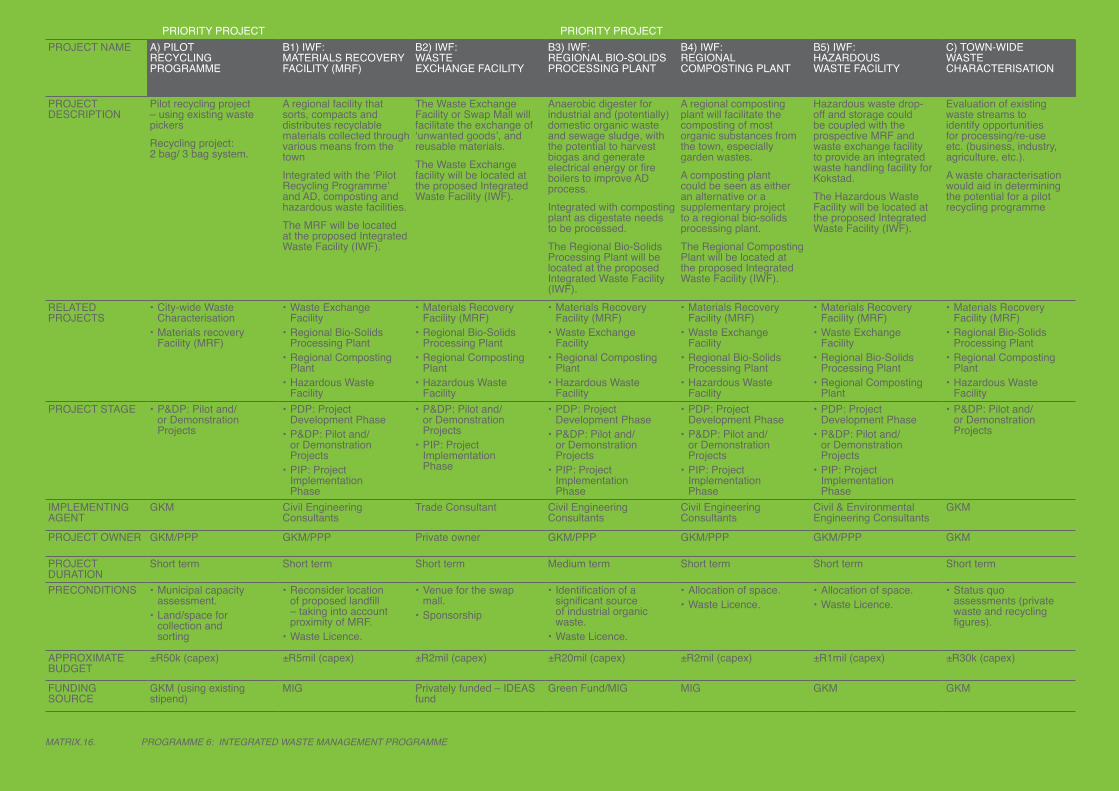
MATRiX.16. PROgRAMME 6: iNTEgRATED WASTE MANAgEMENT PROgRAMME
PRIORITY PROJECT PRIORITY PROJECTPROJECT NAME A) PILOT
RECYCLING PROGRAMME
B1) IWF: MATERIALS RECOVERY FACILITY (MRF)
B2) IWF: WASTE EXCHANGE FACILITY
B3) IWF: REGIONAL BIO-SOLIDS PROCESSING PLANT
B4) IWF: REGIONAL COMPOSTING PLANT
B5) IWF: HAZARDOUS WASTE FACILITY
C) TOWN-WIDE WASTE CHARACTERISATION
PROJECT DESCRIPTION
Pilot recycling project – using existing waste pickers Recycling project: 2 bag/ 3 bag system.
A regional facility that sorts, compacts and distributes recyclable materials collected through various means from the townIntegrated with the ‘Pilot Recycling Programme’ and AD, composting and hazardous waste facilities.The MRF will be located at the proposed Integrated Waste Facility (IWF).
The Waste Exchange Facility or Swap Mall will facilitate the exchange of ‘unwanted goods’, and reusable materials.The Waste Exchange facility will be located at the proposed Integrated Waste Facility (IWF).
Anaerobic digester for industrial and (potentially) domestic organic waste and sewage sludge, with the potential to harvest biogas and generate electrical energy or fire boilers to improve AD process.Integrated with composting plant as digestate needs to be processed.The Regional Bio-Solids Processing Plant will be located at the proposed Integrated Waste Facility (IWF).
A regional composting plant will facilitate the composting of most organic substances from the town, especially garden wastes.A composting plant could be seen as either an alternative or a supplementary project to a regional bio-solids processing plant. The Regional Composting Plant will be located at the proposed Integrated Waste Facility (IWF).
Hazardous waste drop-off and storage could be coupled with the prospective MRF and waste exchange facility to provide an integrated waste handling facility for Kokstad.The Hazardous Waste Facility will be located at the proposed Integrated Waste Facility (IWF).
Evaluation of existing waste streams to identify opportunities for processing/re-use etc. (business, industry, agriculture, etc.).A waste characterisation would aid in determining the potential for a pilot recycling programme
RELATED PROJECTS
• City-wide Waste Characterisation
• Materials recovery Facility (MRF)
• Waste Exchange Facility
• Regional Bio-Solids Processing Plant
• Regional Composting Plant
• Hazardous Waste Facility
• Materials Recovery Facility (MRF)
• Regional Bio-Solids Processing Plant
• Regional Composting Plant
• Hazardous Waste Facility
• Materials Recovery Facility (MRF)
• Waste Exchange Facility
• Regional Composting Plant
• Hazardous Waste Facility
• Materials Recovery Facility (MRF)
• Waste Exchange Facility
• Regional Bio-Solids Processing Plant
• Hazardous Waste Facility
• Materials Recovery Facility (MRF)
• Waste Exchange Facility
• Regional Bio-Solids Processing Plant
• Regional Composting Plant
• Materials Recovery Facility (MRF)
• Regional Bio-Solids Processing Plant
• Regional Composting Plant
• Hazardous Waste Facility
PROJECT STAGE • P&DP: Pilot and/or Demonstration Projects
• PDP: Project Development Phase
• P&DP: Pilot and/or Demonstration Projects
• PIP: Project Implementation Phase
• P&DP: Pilot and/or Demonstration Projects
• PIP: Project Implementation Phase
• PDP: Project Development Phase
• P&DP: Pilot and/or Demonstration Projects
• PIP: Project Implementation Phase
• PDP: Project Development Phase
• P&DP: Pilot and/or Demonstration Projects
• PIP: Project Implementation Phase
• PDP: Project Development Phase
• P&DP: Pilot and/or Demonstration Projects
• PIP: Project Implementation Phase
• P&DP: Pilot and/or Demonstration Projects
IMPLEMENTING AGENT
GKM Civil Engineering Consultants
Trade Consultant Civil Engineering Consultants
Civil Engineering Consultants
Civil & Environmental Engineering Consultants
GKM
PROJECT OWNER GKM/PPP GKM/PPP Private owner GKM/PPP GKM/PPP GKM/PPP GKM
PROJECT DURATION
Short term Short term Short term Medium term Short term Short term Short term
PRECONDITIONS • Municipal capacity assessment.
• Land/space for collection and sorting
• Reconsider location of proposed landfill – taking into account proximity of MRF.
• Waste Licence.
• Venue for the swap mall.
• Sponsorship
• Identification of a significant source of industrial organic waste.
• Waste Licence.
• Allocation of space.• Waste Licence.
• Allocation of space.• Waste Licence.
• Status quo assessments (private waste and recycling figures).
APPROXIMATE BUDGET
±R50k (capex) ±R5mil (capex) ±R2mil (capex) ±R20mil (capex) ±R2mil (capex) ±R1mil (capex) ±R30k (capex)
FUNDING SOURCE
GKM (using existing stipend)
MIG Privately funded – IDEAS fund
Green Fund/MIG MIG GKM GKM
KOKSTAD & FRANKLIN INTEGRATED SUSTAINABLE DEVELOPMENT PLAN
FINAL STRATEGY, DEVELOPMENT PLAN AND IMPLEMENTATION PLAN REPORT | NOVEMBER 2012
111
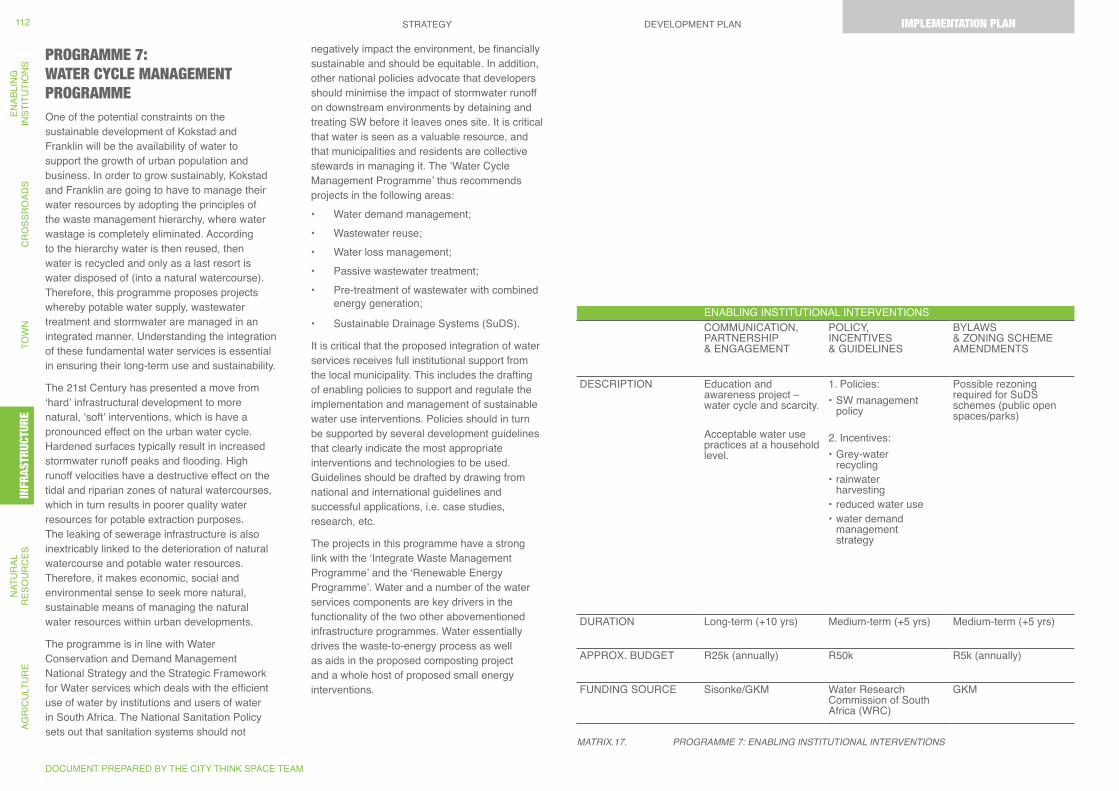
PROGRAMME 7: WATER CYCLE MANAGEMENT PROGRAMMEOne of the potential constraints on the sustainable development of Kokstad and Franklin will be the availability of water to support the growth of urban population and business. In order to grow sustainably, Kokstad and Franklin are going to have to manage their water resources by adopting the principles of the waste management hierarchy, where water wastage is completely eliminated. According to the hierarchy water is then reused, then water is recycled and only as a last resort is water disposed of (into a natural watercourse). Therefore, this programme proposes projects whereby potable water supply, wastewater treatment and stormwater are managed in an integrated manner. Understanding the integration of these fundamental water services is essential in ensuring their long-term use and sustainability.
The 21st Century has presented a move from ‘hard’ infrastructural development to more natural, ‘soft’ interventions, which is have a pronounced effect on the urban water cycle. Hardened surfaces typically result in increased stormwater runoff peaks and flooding. High runoff velocities have a destructive effect on the tidal and riparian zones of natural watercourses, which in turn results in poorer quality water resources for potable extraction purposes. The leaking of sewerage infrastructure is also inextricably linked to the deterioration of natural watercourse and potable water resources. Therefore, it makes economic, social and environmental sense to seek more natural, sustainable means of managing the natural water resources within urban developments.
The programme is in line with Water Conservation and Demand Management National Strategy and the Strategic Framework for Water services which deals with the efficient use of water by institutions and users of water in South Africa. The National Sanitation Policy sets out that sanitation systems should not
negatively impact the environment, be financially sustainable and should be equitable. In addition, other national policies advocate that developers should minimise the impact of stormwater runoff on downstream environments by detaining and treating SW before it leaves ones site. It is critical that water is seen as a valuable resource, and that municipalities and residents are collective stewards in managing it. The ‘Water Cycle Management Programme’ thus recommends projects in the following areas:• Water demand management;• Wastewater reuse;• Water loss management;• Passive wastewater treatment;• Pre-treatment of wastewater with combined
energy generation;
• Sustainable Drainage Systems (SuDS).
It is critical that the proposed integration of water services receives full institutional support from the local municipality. This includes the drafting of enabling policies to support and regulate the implementation and management of sustainable water use interventions. Policies should in turn be supported by several development guidelines that clearly indicate the most appropriate interventions and technologies to be used. Guidelines should be drafted by drawing from national and international guidelines and successful applications, i.e. case studies, research, etc.
The projects in this programme have a strong link with the ‘Integrate Waste Management Programme’ and the ‘Renewable Energy Programme’. Water and a number of the water services components are key drivers in the functionality of the two other abovementioned infrastructure programmes. Water essentially drives the waste-to-energy process as well as aids in the proposed composting project and a whole host of proposed small energy interventions.
ENABLING INSTITUTIONAL INTERVENTIONSCOMMUNICATION, PARTNERSHIP & ENGAGEMENT
POLICY, INCENTIVES & GUIDELINES
BYLAWS & ZONING SCHEME AMENDMENTS
DESCRIPTION Education and awareness project – water cycle and scarcity.
Acceptable water use practices at a household level.
1. Policies:• SW management
policy
2. Incentives: • Grey-water
recycling• rainwater
harvesting• reduced water use• water demand
management strategy
Possible rezoning required for SuDS schemes (public open spaces/parks)
DURATION Long-term (+10 yrs) Medium-term (+5 yrs) Medium-term (+5 yrs)
APPROX. BUDGET R25k (annually) R50k R5k (annually)
FUNDING SOURCE Sisonke/GKM Water Research Commission of South Africa (WRC)
GKM
MATRiX.17. PROgRAMME 7: ENABLiNg iNSTiTUTiONAL iNTERVENTiONS
DOCUMENT PREPARED BY THE CITY THINK SPACE TEAM
STRATEGY DEVELOPMENT PLAN IMPLEMENTATION PLANAG
RIC
ULT
UR
EN
ATU
RAL
R
ESO
UR
CES
INFR
ASTR
UC
TUR
ETO
WN
CR
OSS
RO
ADS
ENAB
LIN
GIN
STIT
UTI
ON
S112
INFR
ASTR
UCTU
REIMPLEMENTATION PLAN
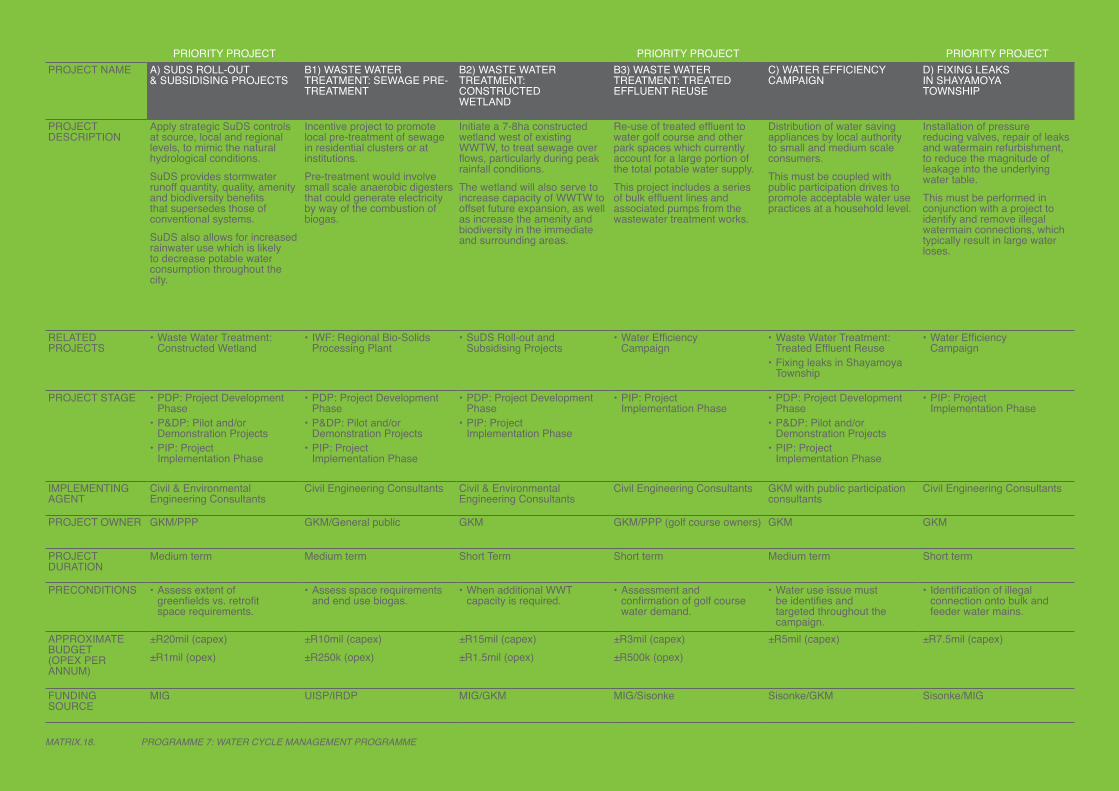
MATRiX.18. PROgRAMME 7: WATER CYCLE MANAgEMENT PROgRAMME
PRIORITY PROJECT PRIORITY PROJECT PRIORITY PROJECTPROJECT NAME A) SUDS ROLL-OUT
& SUBSIDISING PROJECTSB1) WASTE WATER TREATMENT: SEWAGE PRE-TREATMENT
B2) WASTE WATER TREATMENT: CONSTRUCTED WETLAND
B3) WASTE WATER TREATMENT: TREATED EFFLUENT REUSE
C) WATER EFFICIENCY CAMPAIGN
D) FIXING LEAKS IN SHAYAMOYA TOWNSHIP
PROJECT DESCRIPTION
Apply strategic SuDS controls at source, local and regional levels, to mimic the natural hydrological conditions.SuDS provides stormwater runoff quantity, quality, amenity and biodiversity benefits that supersedes those of conventional systems.SuDS also allows for increased rainwater use which is likely to decrease potable water consumption throughout the city.
Incentive project to promote local pre-treatment of sewage in residential clusters or at institutions. Pre-treatment would involve small scale anaerobic digesters that could generate electricity by way of the combustion of biogas.
Initiate a 7-8ha constructed wetland west of existing WWTW, to treat sewage over flows, particularly during peak rainfall conditions.The wetland will also serve to increase capacity of WWTW to offset future expansion, as well as increase the amenity and biodiversity in the immediate and surrounding areas.
Re-use of treated effluent to water golf course and other park spaces which currently account for a large portion of the total potable water supply.This project includes a series of bulk effluent lines and associated pumps from the wastewater treatment works.
Distribution of water saving appliances by local authority to small and medium scale consumers.This must be coupled with public participation drives to promote acceptable water use practices at a household level.
Installation of pressure reducing valves, repair of leaks and watermain refurbishment, to reduce the magnitude of leakage into the underlying water table.This must be performed in conjunction with a project to identify and remove illegal watermain connections, which typically result in large water loses.
RELATED PROJECTS
• Waste Water Treatment: Constructed Wetland
• IWF: Regional Bio-Solids Processing Plant
• SuDS Roll-out and Subsidising Projects
• Water Efficiency Campaign
• Waste Water Treatment: Treated Effluent Reuse
• Fixing leaks in Shayamoya Township
• Water Efficiency Campaign
PROJECT STAGE • PDP: Project Development Phase
• P&DP: Pilot and/or Demonstration Projects
• PIP: Project Implementation Phase
• PDP: Project Development Phase
• P&DP: Pilot and/or Demonstration Projects
• PIP: Project Implementation Phase
• PDP: Project Development Phase
• PIP: Project Implementation Phase
• PIP: Project Implementation Phase
• PDP: Project Development Phase
• P&DP: Pilot and/or Demonstration Projects
• PIP: Project Implementation Phase
• PIP: Project Implementation Phase
IMPLEMENTING AGENT
Civil & Environmental Engineering Consultants
Civil Engineering Consultants Civil & Environmental Engineering Consultants
Civil Engineering Consultants GKM with public participation consultants
Civil Engineering Consultants
PROJECT OWNER GKM/PPP GKM/General public GKM GKM/PPP (golf course owners) GKM GKM
PROJECT DURATION
Medium term Medium term Short Term Short term Medium term Short term
PRECONDITIONS • Assess extent of greenfields vs. retrofit space requirements.
• Assess space requirements and end use biogas.
• When additional WWT capacity is required.
• Assessment and confirmation of golf course water demand.
• Water use issue must be identifies and targeted throughout the campaign.
• Identification of illegal connection onto bulk and feeder water mains.
APPROXIMATE BUDGET (OPEX PER ANNUM)
±R20mil (capex)±R1mil (opex)
±R10mil (capex)±R250k (opex)
±R15mil (capex)±R1.5mil (opex)
±R3mil (capex)±R500k (opex)
±R5mil (capex) ±R7.5mil (capex)
FUNDING SOURCE
MIG UISP/IRDP MIG/GKM MIG/Sisonke Sisonke/GKM Sisonke/MIG
KOKSTAD & FRANKLIN INTEGRATED SUSTAINABLE DEVELOPMENT PLAN
FINAL STRATEGY, DEVELOPMENT PLAN AND IMPLEMENTATION PLAN REPORT | NOVEMBER 2012
113
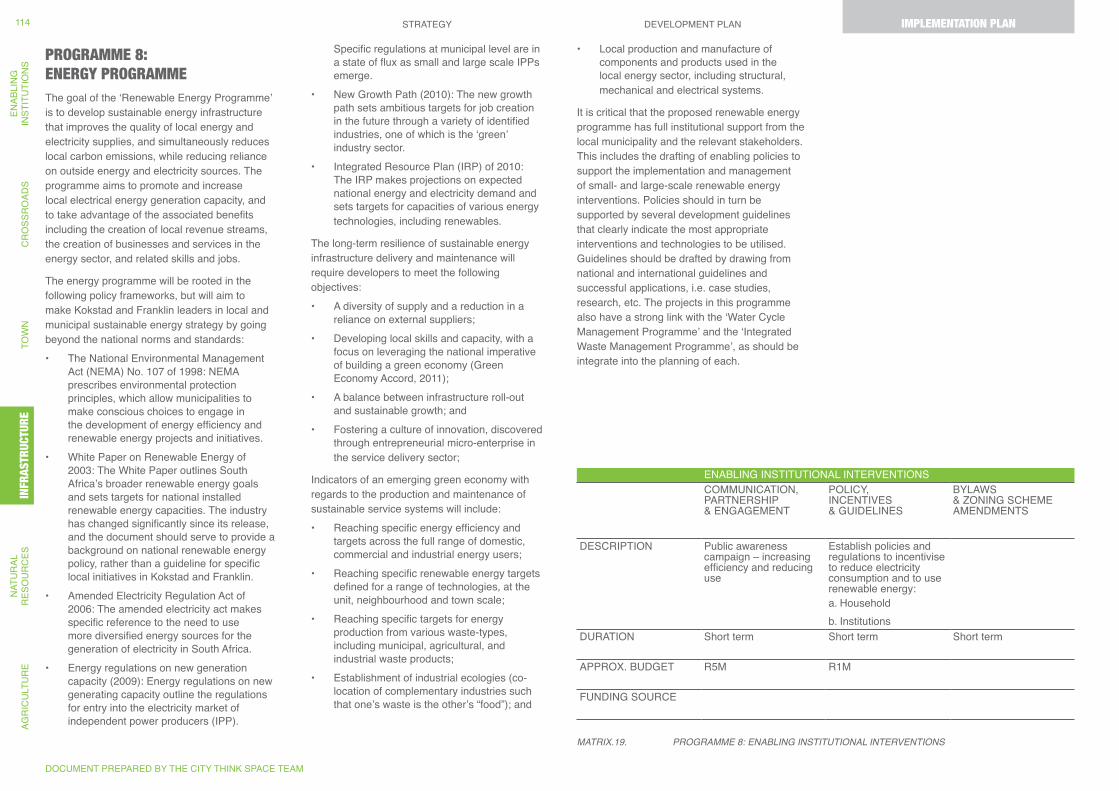
PROGRAMME 8: ENERGY PROGRAMMEThe goal of the ‘Renewable Energy Programme’ is to develop sustainable energy infrastructure that improves the quality of local energy and electricity supplies, and simultaneously reduces local carbon emissions, while reducing reliance on outside energy and electricity sources. The programme aims to promote and increase local electrical energy generation capacity, and to take advantage of the associated benefits including the creation of local revenue streams, the creation of businesses and services in the energy sector, and related skills and jobs.
The energy programme will be rooted in the following policy frameworks, but will aim to make Kokstad and Franklin leaders in local and municipal sustainable energy strategy by going beyond the national norms and standards: • The National Environmental Management
Act (NEMA) No. 107 of 1998: NEMA prescribes environmental protection principles, which allow municipalities to make conscious choices to engage in the development of energy efficiency and renewable energy projects and initiatives.
• White Paper on Renewable Energy of 2003: The White Paper outlines South Africa’s broader renewable energy goals and sets targets for national installed renewable energy capacities. The industry has changed significantly since its release, and the document should serve to provide a background on national renewable energy policy, rather than a guideline for specific local initiatives in Kokstad and Franklin.
• Amended Electricity Regulation Act of 2006: The amended electricity act makes specific reference to the need to use more diversified energy sources for the generation of electricity in South Africa.
• Energy regulations on new generation capacity (2009): Energy regulations on new generating capacity outline the regulations for entry into the electricity market of independent power producers (IPP).
Specific regulations at municipal level are in a state of flux as small and large scale IPPs emerge.
• New Growth Path (2010): The new growth path sets ambitious targets for job creation in the future through a variety of identified industries, one of which is the ‘green’ industry sector.
• Integrated Resource Plan (IRP) of 2010: The IRP makes projections on expected national energy and electricity demand and sets targets for capacities of various energy technologies, including renewables.
The long-term resilience of sustainable energy infrastructure delivery and maintenance will require developers to meet the following objectives: • A diversity of supply and a reduction in a
reliance on external suppliers;• Developing local skills and capacity, with a
focus on leveraging the national imperative of building a green economy (Green Economy Accord, 2011);
• A balance between infrastructure roll-out and sustainable growth; and
• Fostering a culture of innovation, discovered through entrepreneurial micro-enterprise in the service delivery sector;
Indicators of an emerging green economy with regards to the production and maintenance of sustainable service systems will include: • Reaching specific energy efficiency and
targets across the full range of domestic, commercial and industrial energy users;
• Reaching specific renewable energy targets defined for a range of technologies, at the unit, neighbourhood and town scale;
• Reaching specific targets for energy production from various waste-types, including municipal, agricultural, and industrial waste products;
• Establishment of industrial ecologies (co-location of complementary industries such that one’s waste is the other’s “food”); and
• Local production and manufacture of components and products used in the local energy sector, including structural, mechanical and electrical systems.
It is critical that the proposed renewable energy programme has full institutional support from the local municipality and the relevant stakeholders. This includes the drafting of enabling policies to support the implementation and management of small- and large-scale renewable energy interventions. Policies should in turn be supported by several development guidelines that clearly indicate the most appropriate interventions and technologies to be utilised. Guidelines should be drafted by drawing from national and international guidelines and successful applications, i.e. case studies, research, etc. The projects in this programme also have a strong link with the ‘Water Cycle Management Programme’ and the ‘Integrated Waste Management Programme’, as should be integrate into the planning of each.
ENABLING INSTITUTIONAL INTERVENTIONSCOMMUNICATION, PARTNERSHIP & ENGAGEMENT
POLICY, INCENTIVES & GUIDELINES
BYLAWS & ZONING SCHEME AMENDMENTS
DESCRIPTION Public awareness campaign – increasing efficiency and reducing use
Establish policies and regulations to incentivise to reduce electricity consumption and to use renewable energy: a. Householdb. Institutions
DURATION Short term Short term Short term
APPROX. BUDGET R5M R1M
FUNDING SOURCE
MATRiX.19. PROgRAMME 8: ENABLiNg iNSTiTUTiONAL iNTERVENTiONS
DOCUMENT PREPARED BY THE CITY THINK SPACE TEAM
STRATEGY DEVELOPMENT PLAN IMPLEMENTATION PLANAG
RIC
ULT
UR
EN
ATU
RAL
R
ESO
UR
CES
INFR
ASTR
UC
TUR
ETO
WN
CR
OSS
RO
ADS
ENAB
LIN
GIN
STIT
UTI
ON
S114 IMPLEMENTATION PLAN
INFR
ASTR
UCTU
RE
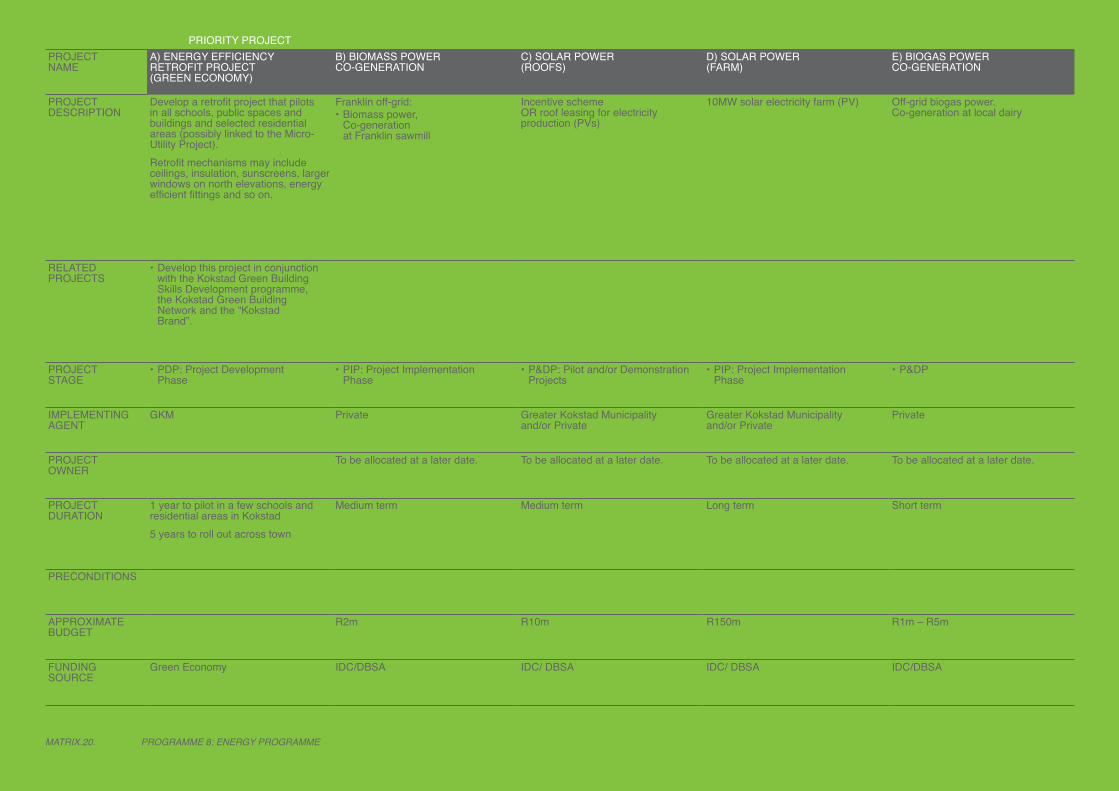
PRIORITY PROJECTPROJECT NAME
A) ENERGY EFFICIENCY RETROFIT PROJECT (GREEN ECONOMY)
B) BIOMASS POWER CO-GENERATION
C) SOLAR POWER (ROOFS)
D) SOLAR POWER (FARM)
E) BIOGAS POWER CO-GENERATION
PROJECT DESCRIPTION
Develop a retrofit project that pilots in all schools, public spaces and buildings and selected residential areas (possibly linked to the Micro-Utility Project). Retrofit mechanisms may include ceilings, insulation, sunscreens, larger windows on north elevations, energy efficient fittings and so on.
Franklin off-grid:• Biomass power,
Co-generation at Franklin sawmill
Incentive scheme OR roof leasing for electricity production (PVs)
10MW solar electricity farm (PV) Off-grid biogas power. Co-generation at local dairy
RELATED PROJECTS
• Develop this project in conjunction with the Kokstad Green Building Skills Development programme, the Kokstad Green Building Network and the “Kokstad Brand”.
PROJECT STAGE
• PDP: Project Development Phase
• PIP: Project Implementation Phase
• P&DP: Pilot and/or Demonstration Projects
• PIP: Project Implementation Phase
• P&DP
IMPLEMENTING AGENT
GKM Private Greater Kokstad Municipality and/or Private
Greater Kokstad Municipality and/or Private
Private
PROJECT OWNER
To be allocated at a later date. To be allocated at a later date. To be allocated at a later date. To be allocated at a later date.
PROJECT DURATION
1 year to pilot in a few schools and residential areas in Kokstad5 years to roll out across town
Medium term Medium term Long term Short term
PRECONDITIONS
APPROXIMATE BUDGET
R2m R10m R150m R1m – R5m
FUNDING SOURCE
Green Economy IDC/DBSA IDC/ DBSA IDC/ DBSA IDC/DBSA
MATRiX.20. PROgRAMME 8: ENERgY PROgRAMME
KOKSTAD & FRANKLIN INTEGRATED SUSTAINABLE DEVELOPMENT PLAN
FINAL STRATEGY, DEVELOPMENT PLAN AND IMPLEMENTATION PLAN REPORT | NOVEMBER 2012
115
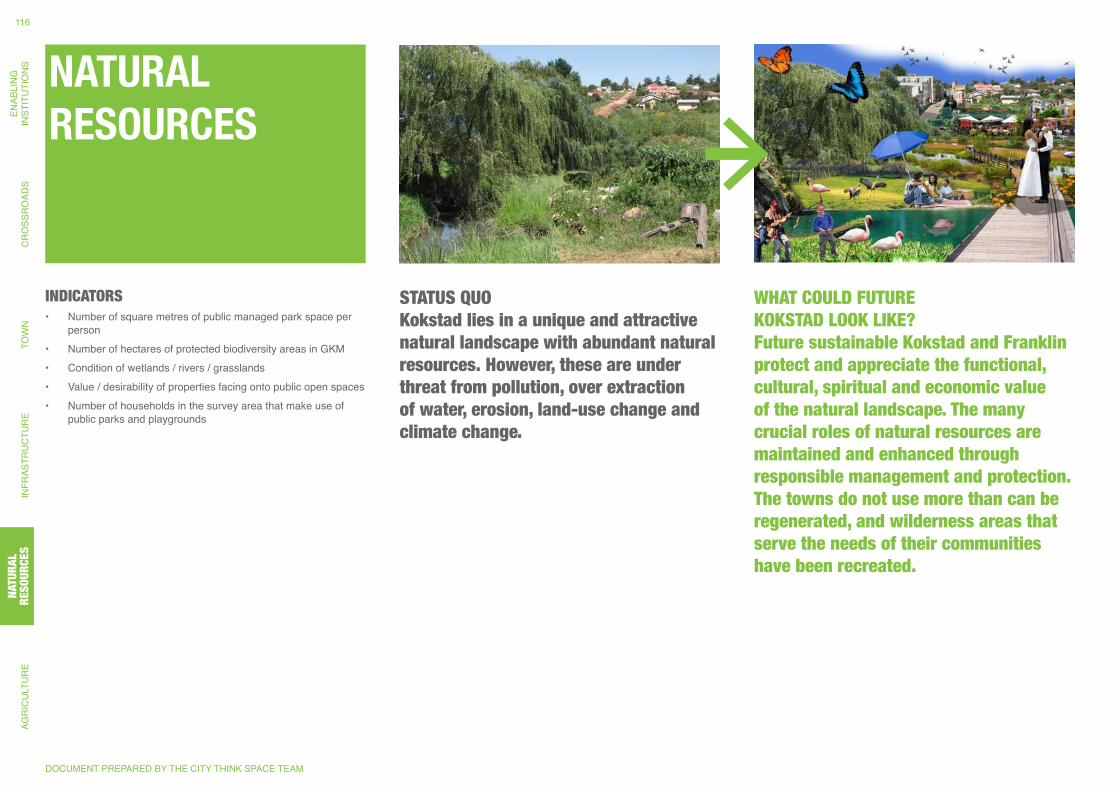
NATURAL RESOURCES
STATUS QUO Kokstad lies in a unique and attractive natural landscape with abundant natural resources. However, these are under threat from pollution, over extraction of water, erosion, land-use change and climate change.
WHAT COULD FUTURE KOKSTAD LOOK LIKE? Future sustainable Kokstad and Franklin protect and appreciate the functional, cultural, spiritual and economic value of the natural landscape. The many crucial roles of natural resources are maintained and enhanced through responsible management and protection. The towns do not use more than can be regenerated, and wilderness areas that serve the needs of their communities have been recreated.
INDICATORS • Number of square metres of public managed park space per
person • Number of hectares of protected biodiversity areas in GKM• Condition of wetlands / rivers / grasslands• Value / desirability of properties facing onto public open spaces• Number of households in the survey area that make use of
public parks and playgrounds
DOCUMENT PREPARED BY THE CITY THINK SPACE TEAM
AGR
ICU
LTU
RE
NAT
UR
AL
RES
OU
RC
ESIN
FRAS
TRU
CTU
RE
TOW
NC
RO
SSR
OAD
SEN
ABLI
NG
INST
ITU
TIO
NS
116NA
TURA
L RE
SOUR
CES
9.5. NATURAL RESOURCES
9.5.1. POLICY ALIGNMENTThe National Environment Management: Biodiversity Act (2004) makes provision for the determination of critical biodiversity areas which need to be maintained in a natural state, firstly to ensure the continued existence and function of particular species and ecosystems and secondly to maintain supply of ecosystem s,ervices. The Act also makes provision for the determination of critical ecological support areas, which are areas that are not essential for meeting conservation targets, but which play an important role in supporting socio-economic development through ecosystem services, such as water provision, flood mitigation or carbon sequestration.
The National Spatial Planning and Land Use Bill (2012) requires that plans:• ensure that special consideration is given
to the protection of prime and unique agricultural land;
• uphold consistency of land use measures in accordance with environmental management instruments;
• promote land development in locations that are sustainable and limit urban sprawl.
The KwaZulu-Natal Department of Human Settlements Strategic Plan (2011/12 to 2015/16) states that it is important to manage development pressures in agricultural areas to ensure conservation of high value agricultural land.
The 2011 KwaZulu-Natal Provincial Growth and Development Strategy (KZN PGDS) focuses on increased use of productive land, alternative energy generation, and the management of pressures on biodiversity and water resources. It recognises the intensifying competition for limited water resources and requires that catchment and river management form part of all land use management schemes, and promotes local water harvesting. In addition, Strategic Objective 5.3 identifies the following indicators for measuring success around biodiversity protection:• % improvement in biodiversity index.• % improvement in Blue Drop status.
“Everyone has the right to a healthy environment”the Constitution
“Value our ecosystem services” MSA
“Development must be socially, environmentally and economically sustainable” NEMA
“Environmental justice must be pursued”NEMA
“Protect critical biodiversity” NEMA
“Everyone has the right to have the environment protected, for the benefit of present and future generations” the Constitution
“Equitable access to environmental resources” NEMA
• % improvement in green drop status.• % increase in volume of solid waste
recycled.• Increased commitment to recycling
supported by appropriate systems
The GKM SDF Review 2011/12 seeks to • Optimise the use of existing resources
including those related to agriculture, land, minerals, bulk infrastructure, roads, transportation and social facilities.
• Discourage the phenomenon of urban sprawl in urban areas and contribute to the development of more compact towns and cities.
• Encourage environmentally sustainable land development practices and processes.
• Promote the sustained protection of the environment; meet the basic needs of all citizens in an affordable way; and ensure the safe utilization of land by taking into consideration environmental constraints.
There are also several pieces of legislation and policies that acknowledge that the supply of ecosystem services is a function of the condition of natural ecosystems. There are therefore acts and policies which seek to minimise the impacts of threatening processes on biodiversity in order to enhance the supply of ecosystem services. This includes for example the National Water Act (1998), Conservation of Agricultural Resources Act (1983), and NEMA (1998). Furthermore, this is one of the five strategic objectives of the National Biodiversity Strategy and Action Plan (2006).
There are also policies which seek to improve the condition of natural ecosystems in order to enhance the supply of ecosystem services. This includes for example the National Framework for Sustainable Development (2008), National Strategy on Sustainable Development and Action Plan (2010), New Growth Path (2010), and Green Accord (2011). These policies support the implementation of labour-intensive programmes, such as Working for Water, Working for Wetlands, and the Landcare Programme, which benefit the environment, while creating much-needed jobs.
“Since the 90s, the parks encouraged tourists to stay longer in Curitiba - before it was just a overnight stop between North and South. After, tourists spent on average three nights instead of just one.” - Angela Bertolini (An Inconvenient Truth).
Curitiba had a problem with low-income and informal housing located in floodplains. Unable to implement expensive engineering solutions, an alternative strategy was attempted - relocating all the homes in flood-prone areas and turning the land into seasonal parks that flood over rainy periods while keeping natural ecosystems intact. This turned flooding from the city’s largest problem to its biggest asset, with per-capita green space shifting from 0.5 m2 to 55 m2; an asset protected and maintained by a combination of municipal agencies and community organizations, and with a multiplier effect throughout all spheres - social, environmental, financial, and even economic. Curitiba’s policy of using floodplains as parks - and their creative solutions for managing parks on light budgets - mean that Curitiba residents have access to some of the most extensive and highest quality urban green space networks in the world - not bad for a small city in a developing country!
PHOTO 22. BARiQUi PARK iN CURiTiBA
FINAL STRATEGY, DEVELOPMENT PLAN AND IMPLEMENTATION PLAN REPORT | NOVEMBER 2012
117
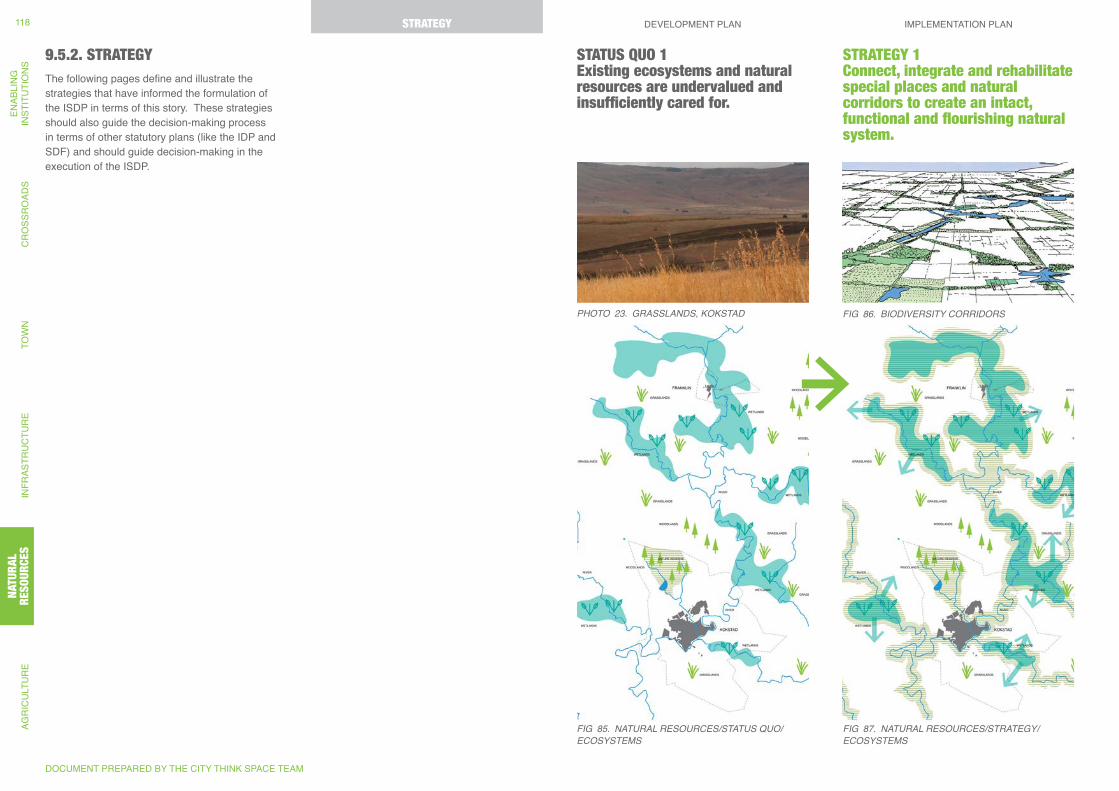
Fig 85. NATURAL RESOURCES/STATUS QUO/ECOSYSTEMS
Fig 87. NATURAL RESOURCES/STRATEgY/ECOSYSTEMS
Fig 86. BiODiVERSiTY CORRiDORS
STATUS QUO 1 Existing ecosystems and natural resources are undervalued and insufficiently cared for.
PHOTO 23. gRASSLANDS, KOKSTAD
9.5.2. STRATEGYThe following pages define and illustrate the strategies that have informed the formulation of the ISDP in terms of this story. These strategies should also guide the decision-making process in terms of other statutory plans (like the IDP and SDF) and should guide decision-making in the execution of the ISDP.
STRATEGY 1 Connect, integrate and rehabilitate special places and natural corridors to create an intact, functional and flourishing natural system.
DOCUMENT PREPARED BY THE CITY THINK SPACE TEAM
STRATEGY DEVELOPMENT PLAN IMPLEMENTATION PLANAG
RIC
ULT
UR
EN
ATU
RAL
R
ESO
UR
CES
INFR
ASTR
UC
TUR
ETO
WN
CR
OSS
RO
ADS
ENAB
LIN
GIN
STIT
UTI
ON
S118 STRATEGY
NATU
RAL
RESO
URCE
S
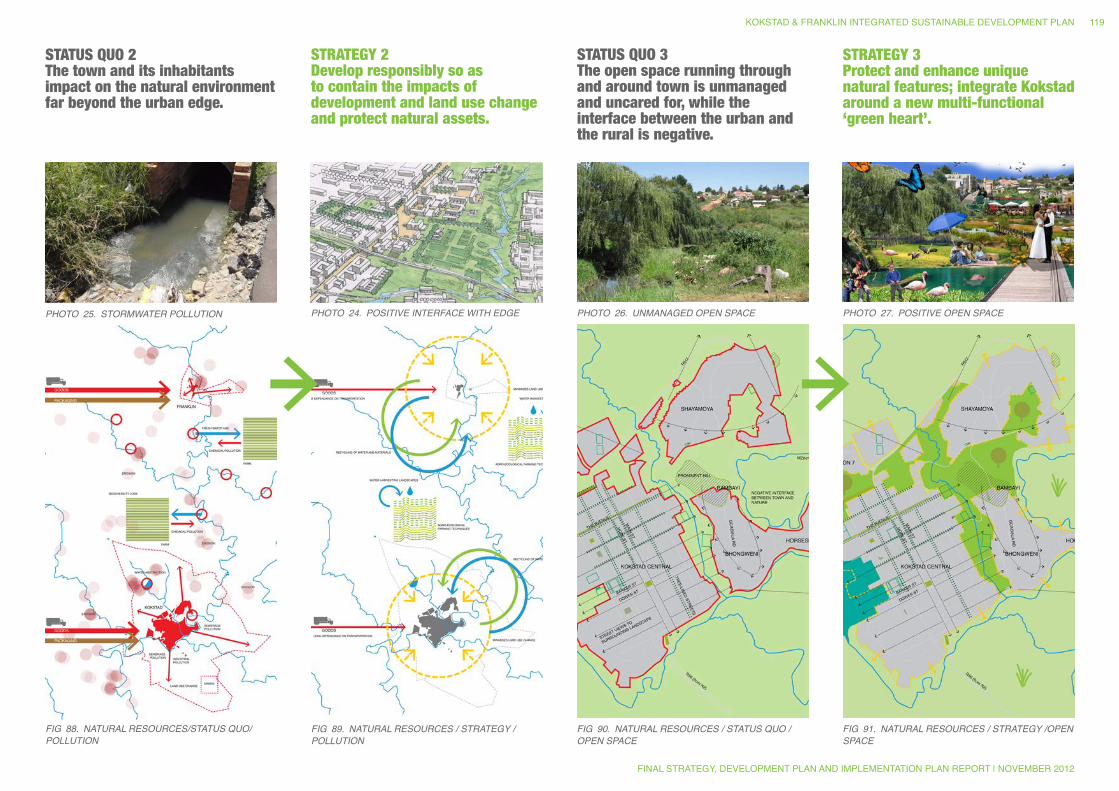
PHOTO 24. POSiTiVE iNTERFACE WiTH EDgE PHOTO 26. UNMANAgED OPEN SPACE PHOTO 27. POSiTiVE OPEN SPACE
Fig 88. NATURAL RESOURCES/STATUS QUO/POLLUTiON
Fig 89. NATURAL RESOURCES / STRATEgY / POLLUTiON
Fig 90. NATURAL RESOURCES / STATUS QUO /OPEN SPACE
Fig 91. NATURAL RESOURCES / STRATEgY /OPEN SPACE
STATUS QUO 2 The town and its inhabitants impact on the natural environment far beyond the urban edge.
PHOTO 25. STORMWATER POLLUTiON
STRATEGY 2 Develop responsibly so as to contain the impacts of development and land use change and protect natural assets.
STATUS QUO 3 The open space running through and around town is unmanaged and uncared for, while the interface between the urban and the rural is negative.
STRATEGY 3 Protect and enhance unique natural features; integrate Kokstad around a new multi-functional ‘green heart’.
KOKSTAD & FRANKLIN INTEGRATED SUSTAINABLE DEVELOPMENT PLAN
FINAL STRATEGY, DEVELOPMENT PLAN AND IMPLEMENTATION PLAN REPORT | NOVEMBER 2012
119
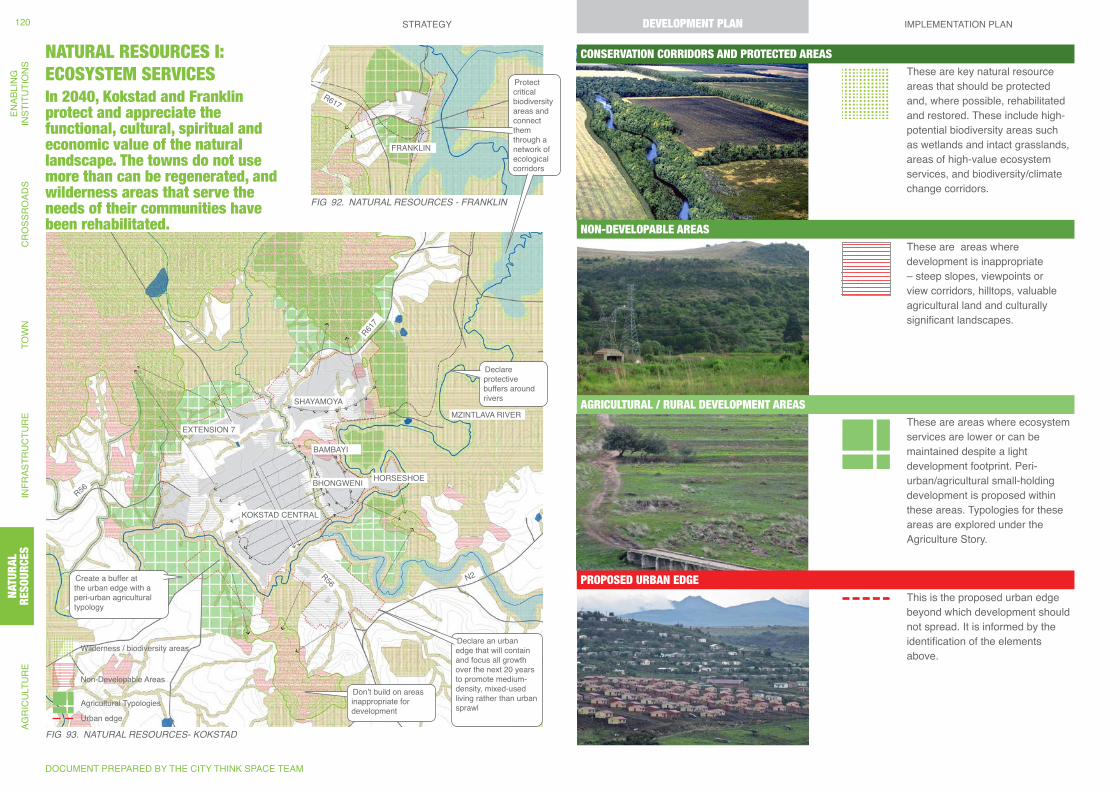
N2
KOKSTAD CENTRAL
SHAYAMOYA
EXTENSION 7
BAMBAYI
HORSESHOEBHONGWENIR56
R617
R617
R56 N2
MZINTLAVA RIVER
FRANKLIN
Protect critical biodiversity areas and connect them through a network of ecological corridors
Declare protective buffers around rivers
Create a buffer at the urban edge with a peri-urban agricultural typology
Don’t build on areas inappropriate for development
Declare an urban edge that will contain and focus all growth over the next 20 years to promote medium-density, mixed-used living rather than urban sprawl
NATURAL RESOURCES I: ECOSYSTEM SERVICESIn 2040, Kokstad and Franklin protect and appreciate the functional, cultural, spiritual and economic value of the natural landscape. The towns do not use more than can be regenerated, and wilderness areas that serve the needs of their communities have been rehabilitated.
CONSERVATION CORRIDORS AND PROTECTED AREASThese are key natural resource areas that should be protected and, where possible, rehabilitated and restored. These include high-potential biodiversity areas such as wetlands and intact grasslands, areas of high-value ecosystem services, and biodiversity/climate change corridors.
These are areas where development is inappropriate – steep slopes, viewpoints or view corridors, hilltops, valuable agricultural land and culturally significant landscapes.
These are areas where ecosystem services are lower or can be maintained despite a light development footprint. Peri-urban/agricultural small-holding development is proposed within these areas. Typologies for these areas are explored under the Agriculture Story.
This is the proposed urban edge beyond which development should not spread. It is informed by the identification of the elements above.
AGRICULTURAL / RURAL DEVELOPMENT AREAS
PROPOSED URBAN EDGE
NON-DEVELOPABLE AREAS
Fig 92. NATURAL RESOURCES - FRANKLiN
Fig 93. NATURAL RESOURCES- KOKSTAD
Wilderness / biodiversity areas
Non-Developable Areas
Agricultural Typologies
Urban edge
DOCUMENT PREPARED BY THE CITY THINK SPACE TEAM
STRATEGY DEVELOPMENT PLAN IMPLEMENTATION PLANAG
RIC
ULT
UR
EN
ATU
RAL
R
ESO
UR
CES
INFR
ASTR
UC
TUR
ETO
WN
CR
OSS
RO
ADS
ENAB
LIN
GIN
STIT
UTI
ON
S120 DEVELOPMENT PLAN
NATU
RAL
RESO
URCE
S
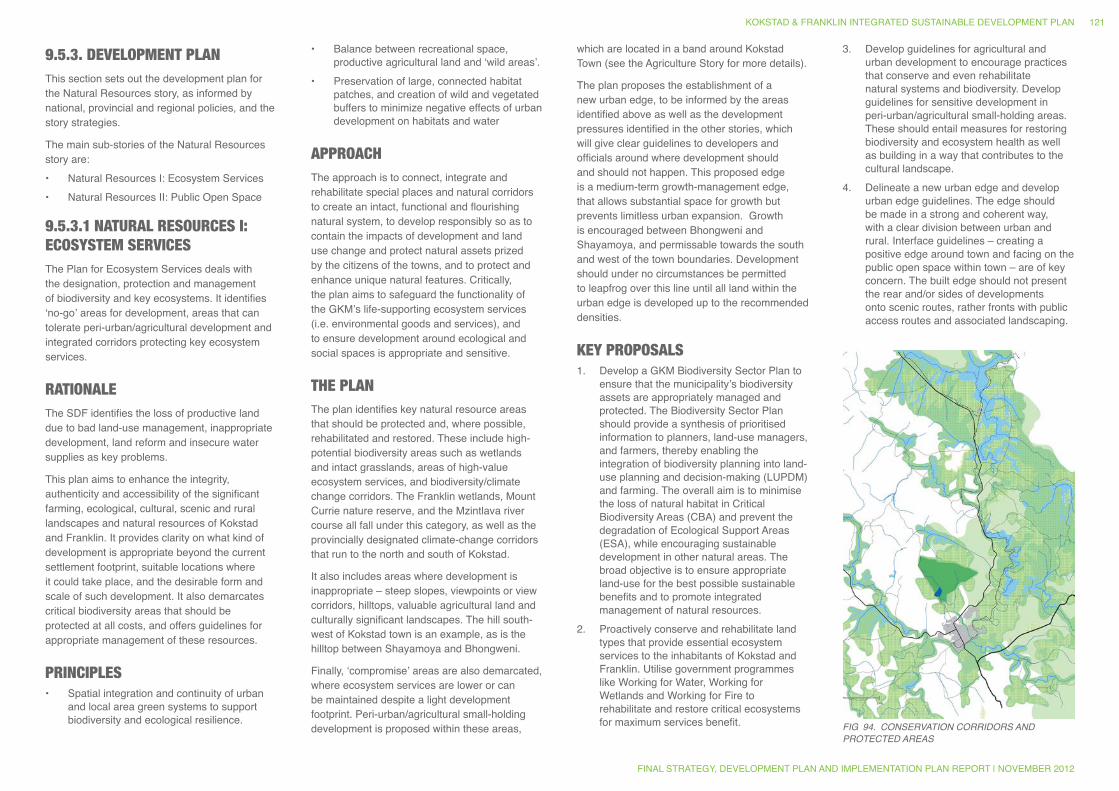
9.5.3. DEVELOPMENT PLANThis section sets out the development plan for the Natural Resources story, as informed by national, provincial and regional policies, and the story strategies.
The main sub-stories of the Natural Resources story are:• Natural Resources I: Ecosystem Services• Natural Resources II: Public Open Space
9.5.3.1 NATURAL RESOURCES I: ECOSYSTEM SERVICESThe Plan for Ecosystem Services deals with the designation, protection and management of biodiversity and key ecosystems. It identifies ‘no-go’ areas for development, areas that can tolerate peri-urban/agricultural development and integrated corridors protecting key ecosystem services.
RATIONALEThe SDF identifies the loss of productive land due to bad land-use management, inappropriate development, land reform and insecure water supplies as key problems.
This plan aims to enhance the integrity, authenticity and accessibility of the significant farming, ecological, cultural, scenic and rural landscapes and natural resources of Kokstad and Franklin. It provides clarity on what kind of development is appropriate beyond the current settlement footprint, suitable locations where it could take place, and the desirable form and scale of such development. It also demarcates critical biodiversity areas that should be protected at all costs, and offers guidelines for appropriate management of these resources.
PRINCIPLES • Spatial integration and continuity of urban
and local area green systems to support biodiversity and ecological resilience.
• Balance between recreational space, productive agricultural land and ‘wild areas’.
• Preservation of large, connected habitat patches, and creation of wild and vegetated buffers to minimize negative effects of urban development on habitats and water
APPROACHThe approach is to connect, integrate and rehabilitate special places and natural corridors to create an intact, functional and flourishing natural system, to develop responsibly so as to contain the impacts of development and land use change and protect natural assets prized by the citizens of the towns, and to protect and enhance unique natural features. Critically, the plan aims to safeguard the functionality of the GKM’s life-supporting ecosystem services (i.e. environmental goods and services), and to ensure development around ecological and social spaces is appropriate and sensitive.
THE PLAN The plan identifies key natural resource areas that should be protected and, where possible, rehabilitated and restored. These include high-potential biodiversity areas such as wetlands and intact grasslands, areas of high-value ecosystem services, and biodiversity/climate change corridors. The Franklin wetlands, Mount Currie nature reserve, and the Mzintlava river course all fall under this category, as well as the provincially designated climate-change corridors that run to the north and south of Kokstad.
It also includes areas where development is inappropriate – steep slopes, viewpoints or view corridors, hilltops, valuable agricultural land and culturally significant landscapes. The hill south-west of Kokstad town is an example, as is the hilltop between Shayamoya and Bhongweni.
Finally, ‘compromise’ areas are also demarcated, where ecosystem services are lower or can be maintained despite a light development footprint. Peri-urban/agricultural small-holding development is proposed within these areas,
which are located in a band around Kokstad Town (see the Agriculture Story for more details).
The plan proposes the establishment of a new urban edge, to be informed by the areas identified above as well as the development pressures identified in the other stories, which will give clear guidelines to developers and officials around where development should and should not happen. This proposed edge is a medium-term growth-management edge, that allows substantial space for growth but prevents limitless urban expansion. Growth is encouraged between Bhongweni and Shayamoya, and permissable towards the south and west of the town boundaries. Development should under no circumstances be permitted to leapfrog over this line until all land within the urban edge is developed up to the recommended densities.
KEY PROPOSALS1. Develop a GKM Biodiversity Sector Plan to
ensure that the municipality’s biodiversity assets are appropriately managed and protected. The Biodiversity Sector Plan should provide a synthesis of prioritised information to planners, land-use managers, and farmers, thereby enabling the integration of biodiversity planning into land-use planning and decision-making (LUPDM) and farming. The overall aim is to minimise the loss of natural habitat in Critical Biodiversity Areas (CBA) and prevent the degradation of Ecological Support Areas (ESA), while encouraging sustainable development in other natural areas. The broad objective is to ensure appropriate land-use for the best possible sustainable benefits and to promote integrated management of natural resources.
2. Proactively conserve and rehabilitate land types that provide essential ecosystem services to the inhabitants of Kokstad and Franklin. Utilise government programmes like Working for Water, Working for Wetlands and Working for Fire to rehabilitate and restore critical ecosystems for maximum services benefit. Fig 94. CONSERVATiON CORRiDORS AND
PROTECTED AREAS
3. Develop guidelines for agricultural and urban development to encourage practices that conserve and even rehabilitate natural systems and biodiversity. Develop guidelines for sensitive development in peri-urban/agricultural small-holding areas. These should entail measures for restoring biodiversity and ecosystem health as well as building in a way that contributes to the cultural landscape.
4. Delineate a new urban edge and develop urban edge guidelines. The edge should be made in a strong and coherent way, with a clear division between urban and rural. Interface guidelines – creating a positive edge around town and facing on the public open space within town – are of key concern. The built edge should not present the rear and/or sides of developments onto scenic routes, rather fronts with public access routes and associated landscaping.
KOKSTAD & FRANKLIN INTEGRATED SUSTAINABLE DEVELOPMENT PLAN
FINAL STRATEGY, DEVELOPMENT PLAN AND IMPLEMENTATION PLAN REPORT | NOVEMBER 2012
121
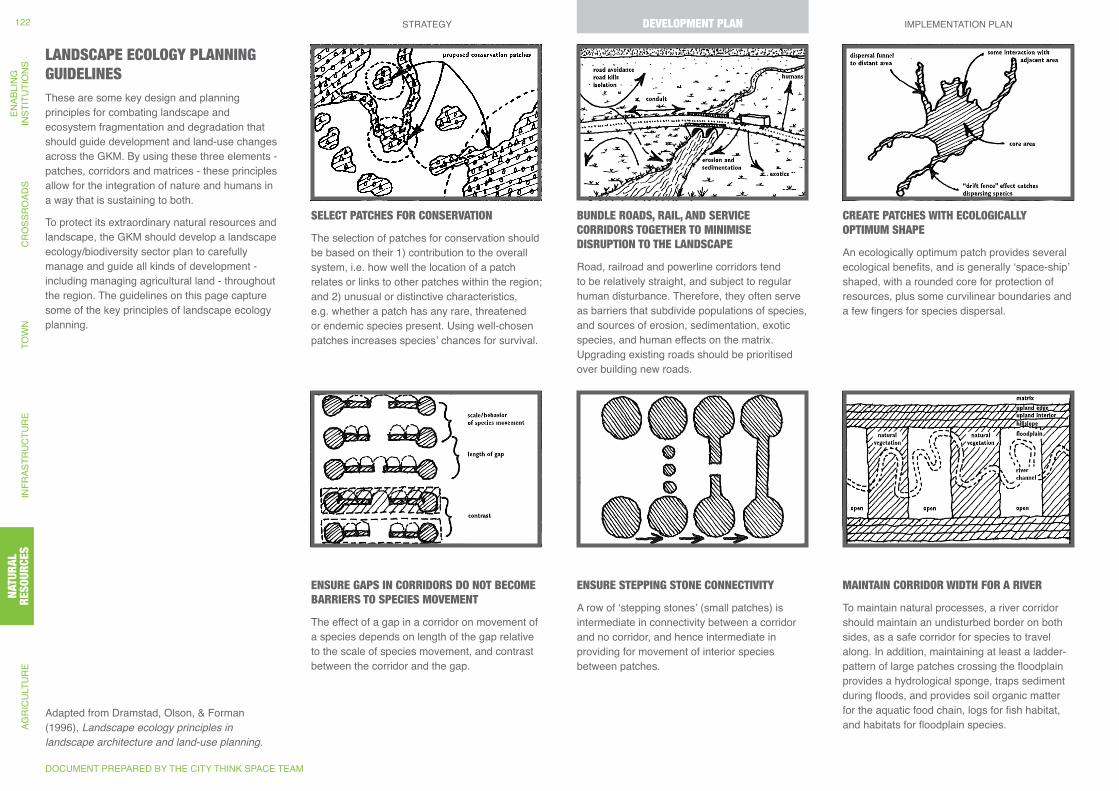
SELECT PATCHES FOR CONSERVATION
The selection of patches for conservation should be based on their 1) contribution to the overall system, i.e. how well the location of a patch relates or links to other patches within the region; and 2) unusual or distinctive characteristics, e.g. whether a patch has any rare, threatened or endemic species present. Using well-chosen patches increases species’ chances for survival.
LANDSCAPE ECOLOGY PLANNING GUIDELINESThese are some key design and planning principles for combating landscape and ecosystem fragmentation and degradation that should guide development and land-use changes across the GKM. By using these three elements - patches, corridors and matrices - these principles allow for the integration of nature and humans in a way that is sustaining to both.
To protect its extraordinary natural resources and landscape, the GKM should develop a landscape ecology/biodiversity sector plan to carefully manage and guide all kinds of development - including managing agricultural land - throughout the region. The guidelines on this page capture some of the key principles of landscape ecology planning.
ENSURE GAPS IN CORRIDORS DO NOT BECOME BARRIERS TO SPECIES MOVEMENT
The effect of a gap in a corridor on movement of a species depends on length of the gap relative to the scale of species movement, and contrast between the corridor and the gap.
ENSURE STEPPING STONE CONNECTIVITY
A row of ‘stepping stones’ (small patches) is intermediate in connectivity between a corridor and no corridor, and hence intermediate in providing for movement of interior species between patches.
MAINTAIN CORRIDOR WIDTH FOR A RIVER
To maintain natural processes, a river corridor should maintain an undisturbed border on both sides, as a safe corridor for species to travel along. In addition, maintaining at least a ladder-pattern of large patches crossing the floodplain provides a hydrological sponge, traps sediment during floods, and provides soil organic matter for the aquatic food chain, logs for fish habitat, and habitats for floodplain species.
BUNDLE ROADS, RAIL, AND SERVICE CORRIDORS TOGETHER TO MINIMISE DISRUPTION TO THE LANDSCAPE
Road, railroad and powerline corridors tend to be relatively straight, and subject to regular human disturbance. Therefore, they often serve as barriers that subdivide populations of species, and sources of erosion, sedimentation, exotic species, and human effects on the matrix. Upgrading existing roads should be prioritised over building new roads.
CREATE PATCHES WITH ECOLOGICALLY OPTIMUM SHAPE
An ecologically optimum patch provides several ecological benefits, and is generally ‘space-ship’ shaped, with a rounded core for protection of resources, plus some curvilinear boundaries and a few fingers for species dispersal.
Adapted from Dramstad, Olson, & Forman (1996), Landscape ecology principles in landscape architecture and land-use planning.
DOCUMENT PREPARED BY THE CITY THINK SPACE TEAM
STRATEGY DEVELOPMENT PLAN IMPLEMENTATION PLANAG
RIC
ULT
UR
EN
ATU
RAL
R
ESO
UR
CES
INFR
ASTR
UC
TUR
ETO
WN
CR
OSS
RO
ADS
ENAB
LIN
GIN
STIT
UTI
ON
S122 DEVELOPMENT PLAN
NATU
RAL
RESO
URCE
S
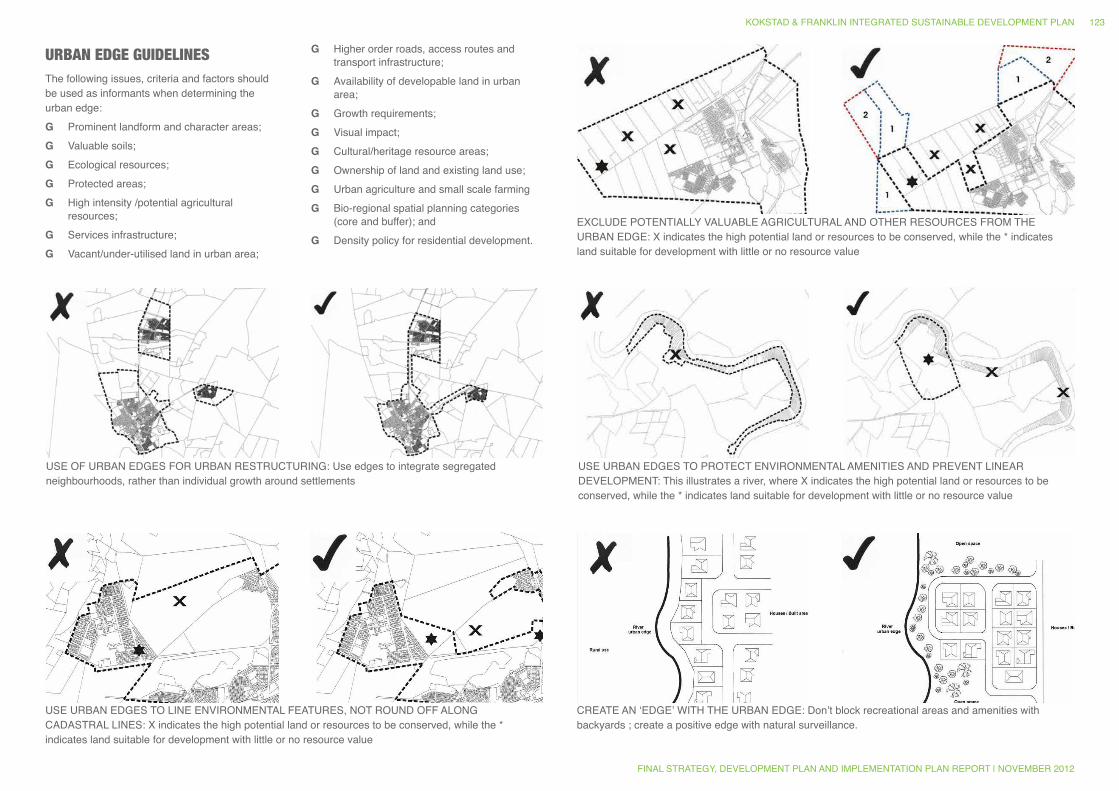
URBAN EDGE GUIDELINESThe following issues, criteria and factors should be used as informants when determining the urban edge:
G Prominent landform and character areas; G Valuable soils; G Ecological resources; G Protected areas; G High intensity /potential agricultural
resources; G Services infrastructure; G Vacant/under-utilised land in urban area;
USE URBAN EDGES TO LINE ENVIRONMENTAL FEATURES, NOT ROUND OFF ALONG CADASTRAL LINES: X indicates the high potential land or resources to be conserved, while the * indicates land suitable for development with little or no resource value
USE OF URBAN EDGES FOR URBAN RESTRUCTURING: Use edges to integrate segregated neighbourhoods, rather than individual growth around settlements
CREATE AN ‘EDGE’ WITH THE URBAN EDGE: Don’t block recreational areas and amenities with backyards ; create a positive edge with natural surveillance.
USE URBAN EDGES TO PROTECT ENVIRONMENTAL AMENITIES AND PREVENT LINEAR DEVELOPMENT: This illustrates a river, where X indicates the high potential land or resources to be conserved, while the * indicates land suitable for development with little or no resource value
EXCLUDE POTENTIALLY VALUABLE AGRICULTURAL AND OTHER RESOURCES FROM THE URBAN EDGE: X indicates the high potential land or resources to be conserved, while the * indicates land suitable for development with little or no resource value
G Higher order roads, access routes and transport infrastructure;
G Availability of developable land in urban area;
G Growth requirements; G Visual impact; G Cultural/heritage resource areas; G Ownership of land and existing land use; G Urban agriculture and small scale farming G Bio-regional spatial planning categories
(core and buffer); and G Density policy for residential development.
KOKSTAD & FRANKLIN INTEGRATED SUSTAINABLE DEVELOPMENT PLAN
FINAL STRATEGY, DEVELOPMENT PLAN AND IMPLEMENTATION PLAN REPORT | NOVEMBER 2012
123
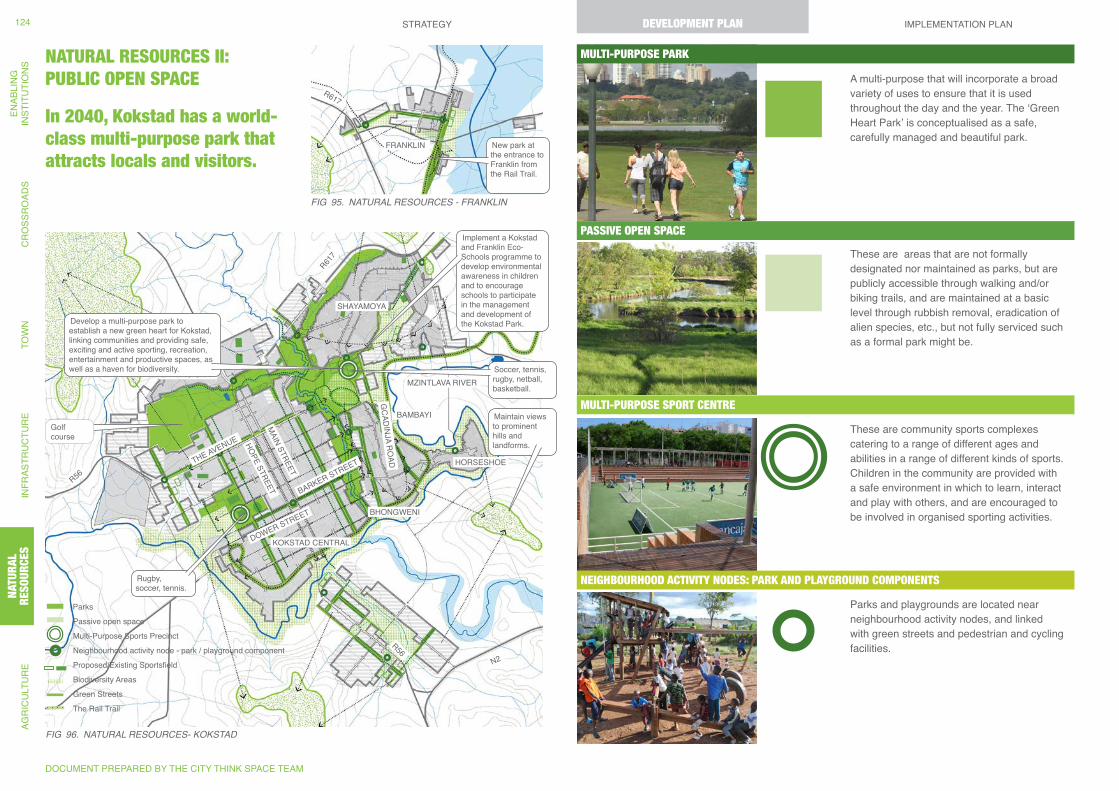
KOKSTAD CENTRAL
THE AVENUE
MAIN STREET
GCADINJA RO
AD
BARKER STREET
HOPE STREET
DOWER STREET
SHAYAMOYA
EXTENSION 7
BAMBAYI
HORSESHOE
BHONGWENI
R56
R617
R617
R56N2
MZINTLAVA RIVER
FRANKLIN
Develop a multi-purpose park to establish a new green heart for Kokstad, linking communities and providing safe, exciting and active sporting, recreation, entertainment and productive spaces, as well as a haven for biodiversity. Soccer, tennis,
rugby, netball, basketball.
Maintain views to prominent hills and landforms.
New park at the entrance to Franklin from the Rail Trail.
Rugby, soccer, tennis.
Implement a Kokstad and Franklin Eco-Schools programme to develop environmental awareness in children and to encourage schools to participate in the management and development of the Kokstad Park.
Golf course
Passive open space
Multi-Purpose Sports Precinct
Neighbourhood activity node - park / playground component
The Rail Trail
Green Streets
Biodiversity Areas
Parks
Proposed/Existing Sportsfield
Fig 95. NATURAL RESOURCES - FRANKLiN
Fig 96. NATURAL RESOURCES- KOKSTAD
NATURAL RESOURCES II: PUBLIC OPEN SPACE
In 2040, Kokstad has a world-class multi-purpose park that attracts locals and visitors.
MULTI-PURPOSE PARK
A multi-purpose that will incorporate a broad variety of uses to ensure that it is used throughout the day and the year. The ‘Green Heart Park’ is conceptualised as a safe, carefully managed and beautiful park.
These are areas that are not formally designated nor maintained as parks, but are publicly accessible through walking and/or biking trails, and are maintained at a basic level through rubbish removal, eradication of alien species, etc., but not fully serviced such as a formal park might be.
These are community sports complexes catering to a range of different ages and abilities in a range of different kinds of sports. Children in the community are provided with a safe environment in which to learn, interact and play with others, and are encouraged to be involved in organised sporting activities.
Parks and playgrounds are located near neighbourhood activity nodes, and linked with green streets and pedestrian and cycling facilities.
MULTI-PURPOSE SPORT CENTRE
NEIGHBOURHOOD ACTIVITY NODES: PARK AND PLAYGROUND COMPONENTS
PASSIVE OPEN SPACE
DOCUMENT PREPARED BY THE CITY THINK SPACE TEAM
STRATEGY DEVELOPMENT PLAN IMPLEMENTATION PLANAG
RIC
ULT
UR
EN
ATU
RAL
R
ESO
UR
CES
INFR
ASTR
UC
TUR
ETO
WN
CR
OSS
RO
ADS
ENAB
LIN
GIN
STIT
UTI
ON
S124 DEVELOPMENT PLAN
NATU
RAL
RESO
URCE
S
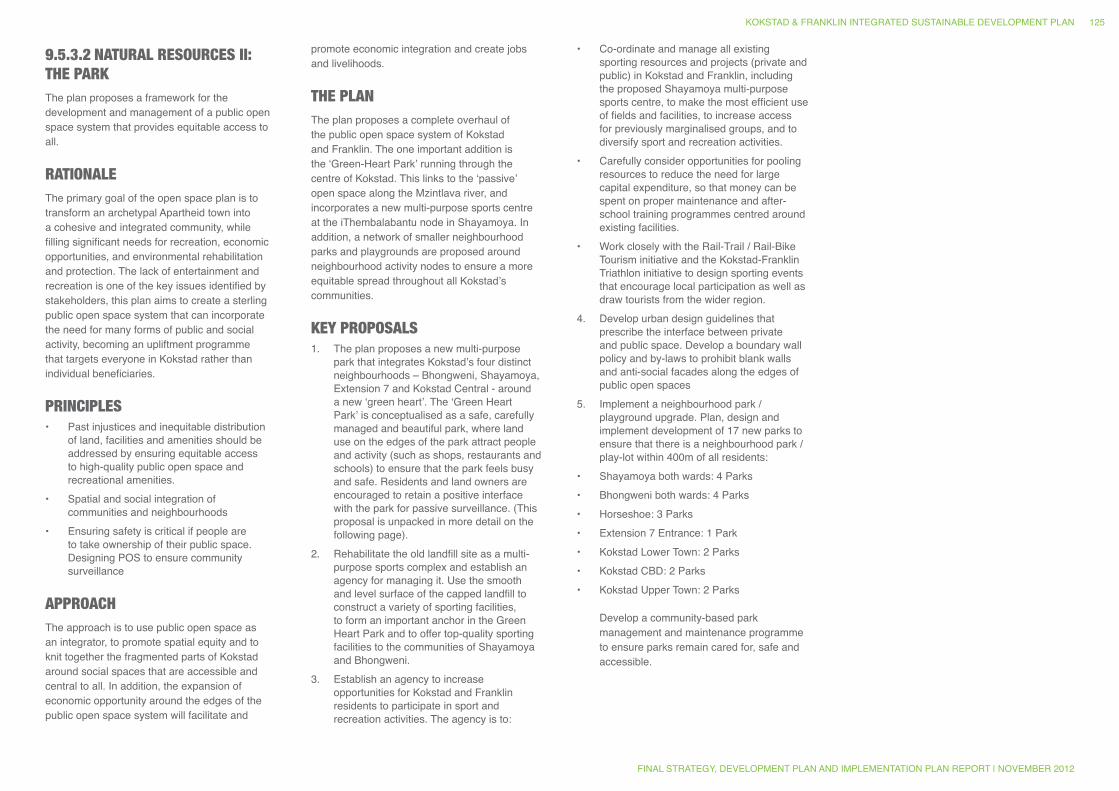
9.5.3.2 NATURAL RESOURCES II: THE PARKThe plan proposes a framework for the development and management of a public open space system that provides equitable access to all.
RATIONALEThe primary goal of the open space plan is to transform an archetypal Apartheid town into a cohesive and integrated community, while filling significant needs for recreation, economic opportunities, and environmental rehabilitation and protection. The lack of entertainment and recreation is one of the key issues identified by stakeholders, this plan aims to create a sterling public open space system that can incorporate the need for many forms of public and social activity, becoming an upliftment programme that targets everyone in Kokstad rather than individual beneficiaries.
PRINCIPLES • Past injustices and inequitable distribution
of land, facilities and amenities should be addressed by ensuring equitable access to high-quality public open space and recreational amenities.
• Spatial and social integration of communities and neighbourhoods
• Ensuring safety is critical if people are to take ownership of their public space. Designing POS to ensure community surveillance
APPROACHThe approach is to use public open space as an integrator, to promote spatial equity and to knit together the fragmented parts of Kokstad around social spaces that are accessible and central to all. In addition, the expansion of economic opportunity around the edges of the public open space system will facilitate and
promote economic integration and create jobs and livelihoods.
THE PLAN The plan proposes a complete overhaul of the public open space system of Kokstad and Franklin. The one important addition is the ‘Green-Heart Park’ running through the centre of Kokstad. This links to the ‘passive’ open space along the Mzintlava river, and incorporates a new multi-purpose sports centre at the iThembalabantu node in Shayamoya. In addition, a network of smaller neighbourhood parks and playgrounds are proposed around neighbourhood activity nodes to ensure a more equitable spread throughout all Kokstad’s communities.
KEY PROPOSALS1. The plan proposes a new multi-purpose
park that integrates Kokstad’s four distinct neighbourhoods – Bhongweni, Shayamoya, Extension 7 and Kokstad Central - around a new ‘green heart’. The ‘Green Heart Park’ is conceptualised as a safe, carefully managed and beautiful park, where land use on the edges of the park attract people and activity (such as shops, restaurants and schools) to ensure that the park feels busy and safe. Residents and land owners are encouraged to retain a positive interface with the park for passive surveillance. (This proposal is unpacked in more detail on the following page).
2. Rehabilitate the old landfill site as a multi-purpose sports complex and establish an agency for managing it. Use the smooth and level surface of the capped landfill to construct a variety of sporting facilities, to form an important anchor in the Green Heart Park and to offer top-quality sporting facilities to the communities of Shayamoya and Bhongweni.
3. Establish an agency to increase opportunities for Kokstad and Franklin residents to participate in sport and recreation activities. The agency is to:
• Co-ordinate and manage all existing sporting resources and projects (private and public) in Kokstad and Franklin, including the proposed Shayamoya multi-purpose sports centre, to make the most efficient use of fields and facilities, to increase access for previously marginalised groups, and to diversify sport and recreation activities.
• Carefully consider opportunities for pooling resources to reduce the need for large capital expenditure, so that money can be spent on proper maintenance and after-school training programmes centred around existing facilities.
• Work closely with the Rail-Trail / Rail-Bike Tourism initiative and the Kokstad-Franklin Triathlon initiative to design sporting events that encourage local participation as well as draw tourists from the wider region.
4. Develop urban design guidelines that prescribe the interface between private and public space. Develop a boundary wall policy and by-laws to prohibit blank walls and anti-social facades along the edges of public open spaces
5. Implement a neighbourhood park / playground upgrade. Plan, design and implement development of 17 new parks to ensure that there is a neighbourhood park / play-lot within 400m of all residents:
• Shayamoya both wards: 4 Parks• Bhongweni both wards: 4 Parks• Horseshoe: 3 Parks• Extension 7 Entrance: 1 Park• Kokstad Lower Town: 2 Parks• Kokstad CBD: 2 Parks• Kokstad Upper Town: 2 Parks
Develop a community-based park management and maintenance programme to ensure parks remain cared for, safe and accessible.
KOKSTAD & FRANKLIN INTEGRATED SUSTAINABLE DEVELOPMENT PLAN
FINAL STRATEGY, DEVELOPMENT PLAN AND IMPLEMENTATION PLAN REPORT | NOVEMBER 2012
125
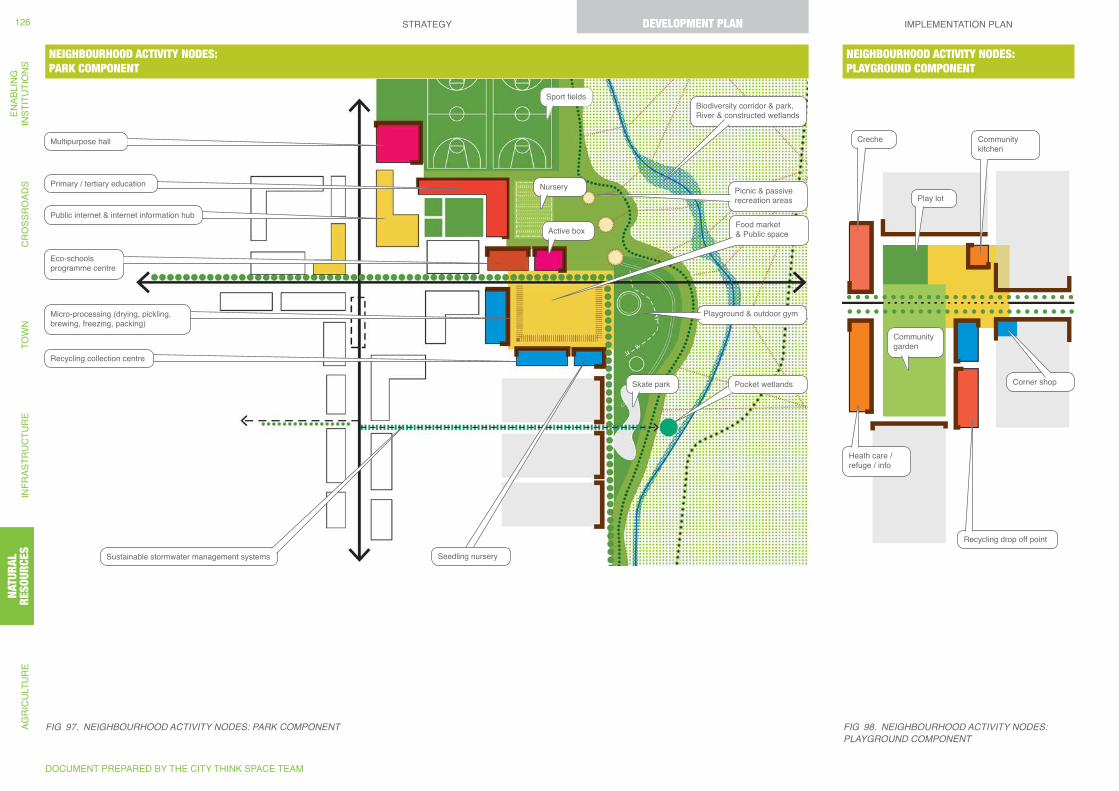
Pocket wetlands
Multipurpose hall
Eco-schools programme centre
Primary / tertiary education
Micro-processing (drying, pickling, brewing, freezing, packing)
Recycling collection centre
Food market & Public space
Sustainable stormwater management systems
Biodiversity corridor & park, River & constructed wetlands
Playground & outdoor gym
Seedling nursery
Picnic & passive recreation areas
Heath care / refuge / info
Play lot
Creche
Corner shop
Recycling drop off point
Community garden
Community kitchen
Public internet & internet information hub
Active box
Skate park
Sport fields
Nursery
NEIGHBOURHOOD ACTIVITY NODES: PARK COMPONENT
NEIGHBOURHOOD ACTIVITY NODES: PLAYGROUND COMPONENT
Fig 97. NEigHBOURHOOD ACTiViTY NODES: PARK COMPONENT Fig 98. NEigHBOURHOOD ACTiViTY NODES: PLAYgROUND COMPONENT
DOCUMENT PREPARED BY THE CITY THINK SPACE TEAM
STRATEGY DEVELOPMENT PLAN IMPLEMENTATION PLANAG
RIC
ULT
UR
EN
ATU
RAL
R
ESO
UR
CES
INFR
ASTR
UC
TUR
ETO
WN
CR
OSS
RO
ADS
ENAB
LIN
GIN
STIT
UTI
ON
S126 DEVELOPMENT PLAN
NATU
RAL
RESO
URCE
S
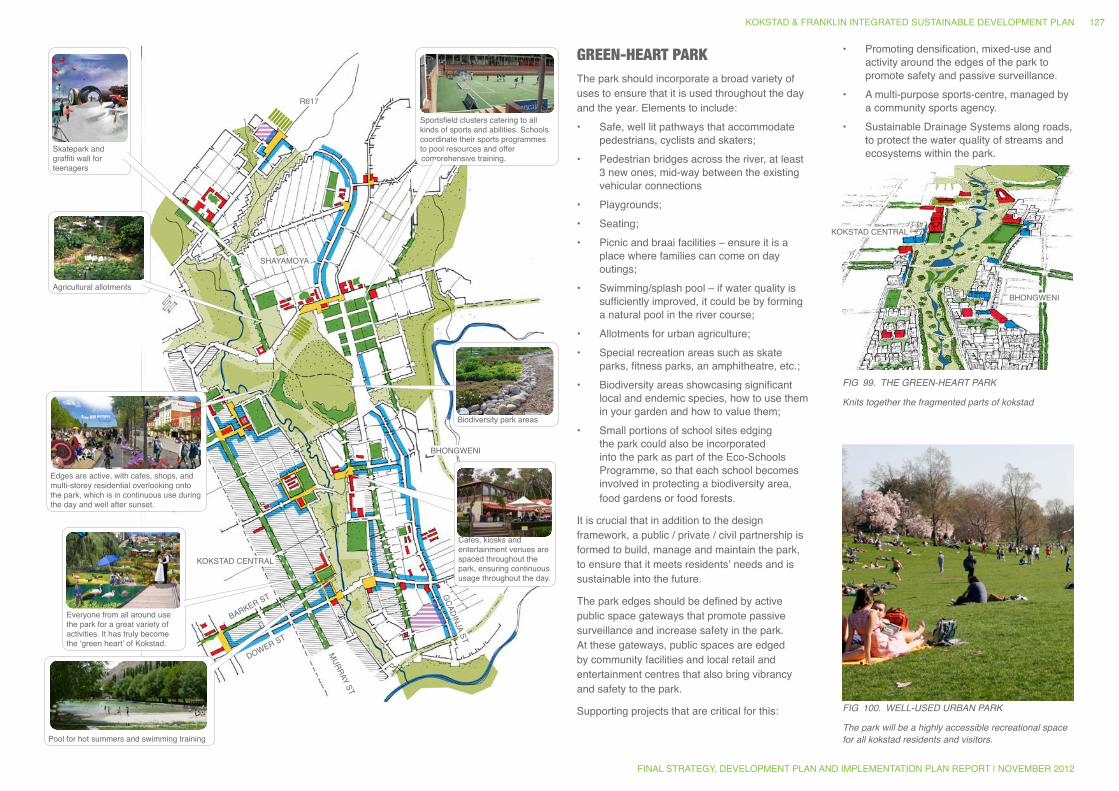
KOKSTAD CENTRAL
R617
BARKER ST
DOWER ST
MURRAY ST
GCADINJA ST
BHONGWENI
SHAYAMOYA
KOKSTAD CENTRAL
BHONGWENI
Edges are active, with cafes, shops, and multi-storey residential overlooking onto the park, which is in continuous use during the day and well after sunset.
Everyone from all around use the park for a great variety of activities. It has truly become the ‘green heart’ of Kokstad.
Sportsfield clusters catering to all kinds of sports and abilities. Schools coordinate their sports programmes to pool resources and offer comprehensive training.
Skatepark and graffiti wall for teenagers
Pool for hot summers and swimming training
Cafes, kiosks and entertainment venues are spaced throughout the park, ensuring continuous usage throughout the day.
Agricultural allotments
Biodiversity park areas
Fig 98. NEigHBOURHOOD ACTiViTY NODES: PLAYgROUND COMPONENT
GREEN-HEART PARKThe park should incorporate a broad variety of uses to ensure that it is used throughout the day and the year. Elements to include:• Safe, well lit pathways that accommodate
pedestrians, cyclists and skaters;• Pedestrian bridges across the river, at least
3 new ones, mid-way between the existing vehicular connections
• Playgrounds;• Seating;• Picnic and braai facilities – ensure it is a
place where families can come on day outings;
• Swimming/splash pool – if water quality is sufficiently improved, it could be by forming a natural pool in the river course;
• Allotments for urban agriculture; • Special recreation areas such as skate
parks, fitness parks, an amphitheatre, etc.;• Biodiversity areas showcasing significant
local and endemic species, how to use them in your garden and how to value them;
• Small portions of school sites edging the park could also be incorporated into the park as part of the Eco-Schools Programme, so that each school becomes involved in protecting a biodiversity area, food gardens or food forests.
It is crucial that in addition to the design framework, a public / private / civil partnership is formed to build, manage and maintain the park, to ensure that it meets residents’ needs and is sustainable into the future.
The park edges should be defined by active public space gateways that promote passive surveillance and increase safety in the park. At these gateways, public spaces are edged by community facilities and local retail and entertainment centres that also bring vibrancy and safety to the park.
Supporting projects that are critical for this:
• Promoting densification, mixed-use and activity around the edges of the park to promote safety and passive surveillance.
• A multi-purpose sports-centre, managed by a community sports agency.
• Sustainable Drainage Systems along roads, to protect the water quality of streams and ecosystems within the park.
Fig 99. THE gREEN-HEART PARK
Knits together the fragmented parts of kokstad
Fig 100. WELL-USED URBAN PARK
The park will be a highly accessible recreational space for all kokstad residents and visitors.
KOKSTAD & FRANKLIN INTEGRATED SUSTAINABLE DEVELOPMENT PLAN
FINAL STRATEGY, DEVELOPMENT PLAN AND IMPLEMENTATION PLAN REPORT | NOVEMBER 2012
127
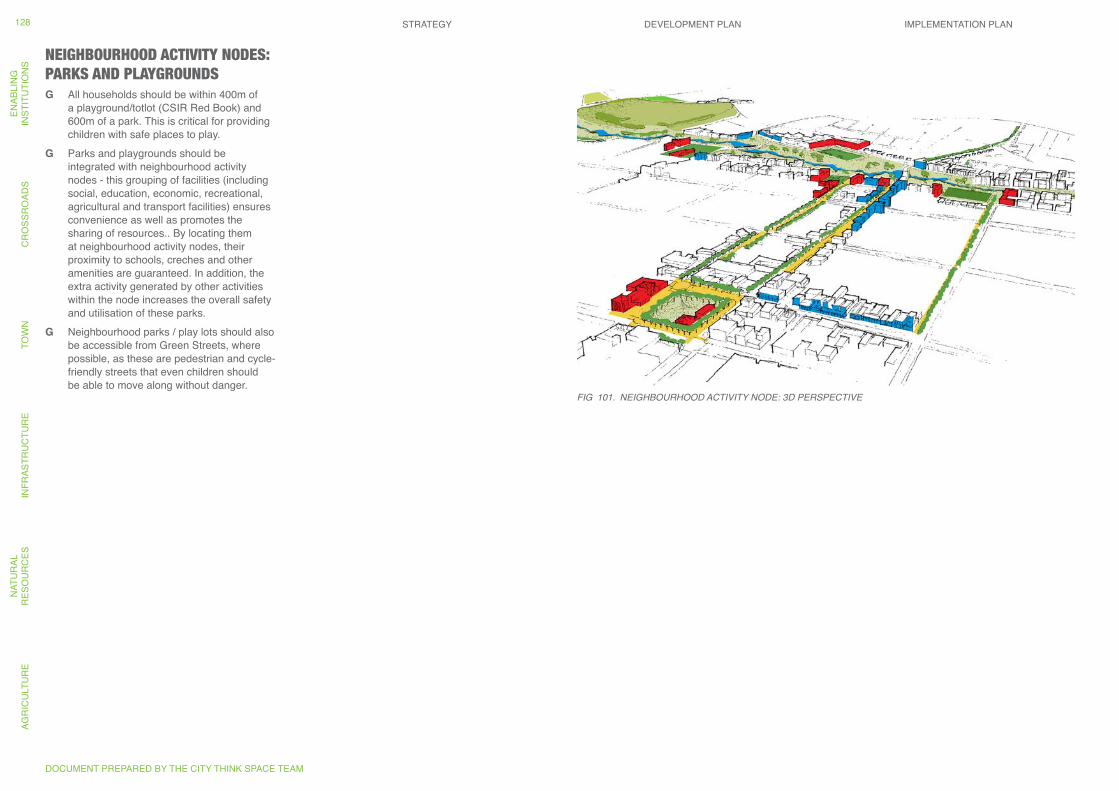
NEIGHBOURHOOD ACTIVITY NODES: PARKS AND PLAYGROUNDS
G All households should be within 400m of a playground/totlot (CSIR Red Book) and 600m of a park. This is critical for providing children with safe places to play.
G Parks and playgrounds should be integrated with neighbourhood activity nodes - this grouping of facilities (including social, education, economic, recreational, agricultural and transport facilities) ensures convenience as well as promotes the sharing of resources.. By locating them at neighbourhood activity nodes, their proximity to schools, creches and other amenities are guaranteed. In addition, the extra activity generated by other activities within the node increases the overall safety and utilisation of these parks.
G Neighbourhood parks / play lots should also be accessible from Green Streets, where possible, as these are pedestrian and cycle-friendly streets that even children should be able to move along without danger.
Fig 101. NEigHBOURHOOD ACTiViTY NODE: 3D PERSPECTiVE
DOCUMENT PREPARED BY THE CITY THINK SPACE TEAM
STRATEGY DEVELOPMENT PLAN IMPLEMENTATION PLANAG
RIC
ULT
UR
EN
ATU
RAL
R
ESO
UR
CES
INFR
ASTR
UC
TUR
ETO
WN
CR
OSS
RO
ADS
ENAB
LIN
GIN
STIT
UTI
ON
S128
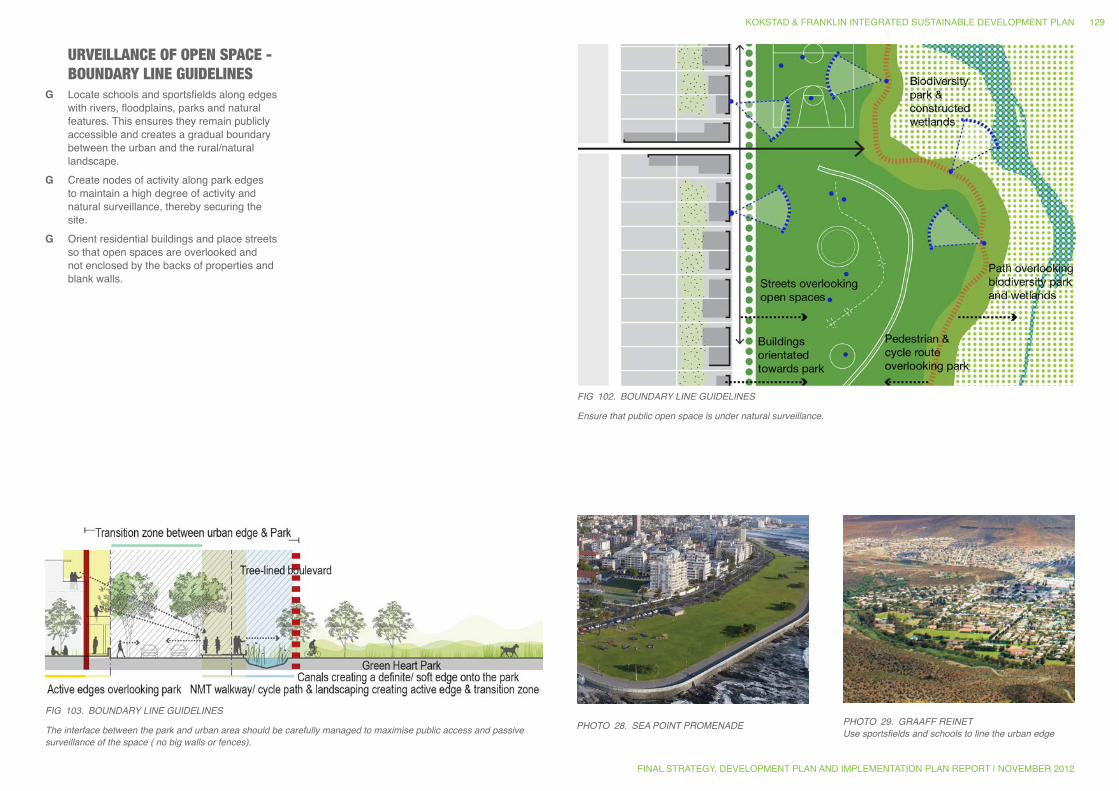
URVEILLANCE OF OPEN SPACE - BOUNDARY LINE GUIDELINES
G Locate schools and sportsfields along edges with rivers, floodplains, parks and natural features. This ensures they remain publicly accessible and creates a gradual boundary between the urban and the rural/natural landscape.
G Create nodes of activity along park edges to maintain a high degree of activity and natural surveillance, thereby securing the site.
G Orient residential buildings and place streets so that open spaces are overlooked and not enclosed by the backs of properties and blank walls.
Fig 102. BOUNDARY LiNE gUiDELiNES
Ensure that public open space is under natural surveillance.
PHOTO 28. SEA POiNT PROMENADE PHOTO 29. gRAAFF REiNETUse sportsfields and schools to line the urban edge
Fig 103. BOUNDARY LiNE gUiDELiNES
The interface between the park and urban area should be carefully managed to maximise public access and passive surveillance of the space ( no big walls or fences).
KOKSTAD & FRANKLIN INTEGRATED SUSTAINABLE DEVELOPMENT PLAN
FINAL STRATEGY, DEVELOPMENT PLAN AND IMPLEMENTATION PLAN REPORT | NOVEMBER 2012
129
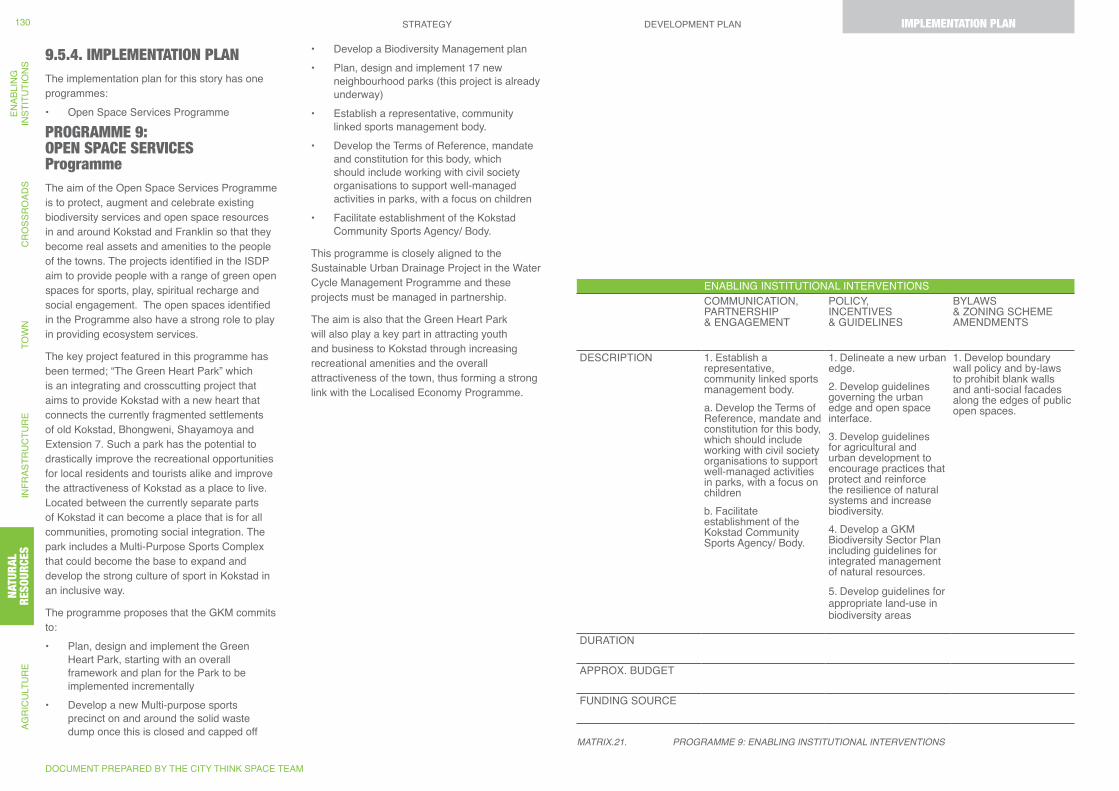
9.5.4. IMPLEMENTATION PLANThe implementation plan for this story has one programmes:• Open Space Services Programme
PROGRAMME 9: OPEN SPACE SERVICES ProgrammeThe aim of the Open Space Services Programme is to protect, augment and celebrate existing biodiversity services and open space resources in and around Kokstad and Franklin so that they become real assets and amenities to the people of the towns. The projects identified in the ISDP aim to provide people with a range of green open spaces for sports, play, spiritual recharge and social engagement. The open spaces identified in the Programme also have a strong role to play in providing ecosystem services.
The key project featured in this programme has been termed; “The Green Heart Park” which is an integrating and crosscutting project that aims to provide Kokstad with a new heart that connects the currently fragmented settlements of old Kokstad, Bhongweni, Shayamoya and Extension 7. Such a park has the potential to drastically improve the recreational opportunities for local residents and tourists alike and improve the attractiveness of Kokstad as a place to live. Located between the currently separate parts of Kokstad it can become a place that is for all communities, promoting social integration. The park includes a Multi-Purpose Sports Complex that could become the base to expand and develop the strong culture of sport in Kokstad in an inclusive way.
The programme proposes that the GKM commits to:• Plan, design and implement the Green
Heart Park, starting with an overall framework and plan for the Park to be implemented incrementally
• Develop a new Multi-purpose sports precinct on and around the solid waste dump once this is closed and capped off
• Develop a Biodiversity Management plan• Plan, design and implement 17 new
neighbourhood parks (this project is already underway)
• Establish a representative, community linked sports management body.
• Develop the Terms of Reference, mandate and constitution for this body, which should include working with civil society organisations to support well-managed activities in parks, with a focus on children
• Facilitate establishment of the Kokstad Community Sports Agency/ Body.
This programme is closely aligned to the Sustainable Urban Drainage Project in the Water Cycle Management Programme and these projects must be managed in partnership.
The aim is also that the Green Heart Park will also play a key part in attracting youth and business to Kokstad through increasing recreational amenities and the overall attractiveness of the town, thus forming a strong link with the Localised Economy Programme.
ENABLING INSTITUTIONAL INTERVENTIONSCOMMUNICATION, PARTNERSHIP & ENGAGEMENT
POLICY, INCENTIVES & GUIDELINES
BYLAWS & ZONING SCHEME AMENDMENTS
DESCRIPTION 1. Establish a representative, community linked sports management body.a. Develop the Terms of Reference, mandate and constitution for this body, which should include working with civil society organisations to support well-managed activities in parks, with a focus on childrenb. Facilitate establishment of the Kokstad Community Sports Agency/ Body.
1. Delineate a new urban edge. 2. Develop guidelines governing the urban edge and open space interface.3. Develop guidelines for agricultural and urban development to encourage practices that protect and reinforce the resilience of natural systems and increase biodiversity.4. Develop a GKM Biodiversity Sector Plan including guidelines for integrated management of natural resources.
5. Develop guidelines for appropriate land-use in biodiversity areas
1. Develop boundary wall policy and by-laws to prohibit blank walls and anti-social facades along the edges of public open spaces.
DURATION
APPROX. BUDGET
FUNDING SOURCE
MATRiX.21. PROgRAMME 9: ENABLiNg iNSTiTUTiONAL iNTERVENTiONS
DOCUMENT PREPARED BY THE CITY THINK SPACE TEAM
STRATEGY DEVELOPMENT PLAN IMPLEMENTATION PLANAG
RIC
ULT
UR
EN
ATU
RAL
R
ESO
UR
CES
INFR
ASTR
UC
TUR
ETO
WN
CR
OSS
RO
ADS
ENAB
LIN
GIN
STIT
UTI
ON
S130 IMPLEMENTATION PLAN
NATU
RAL
RESO
URCE
S
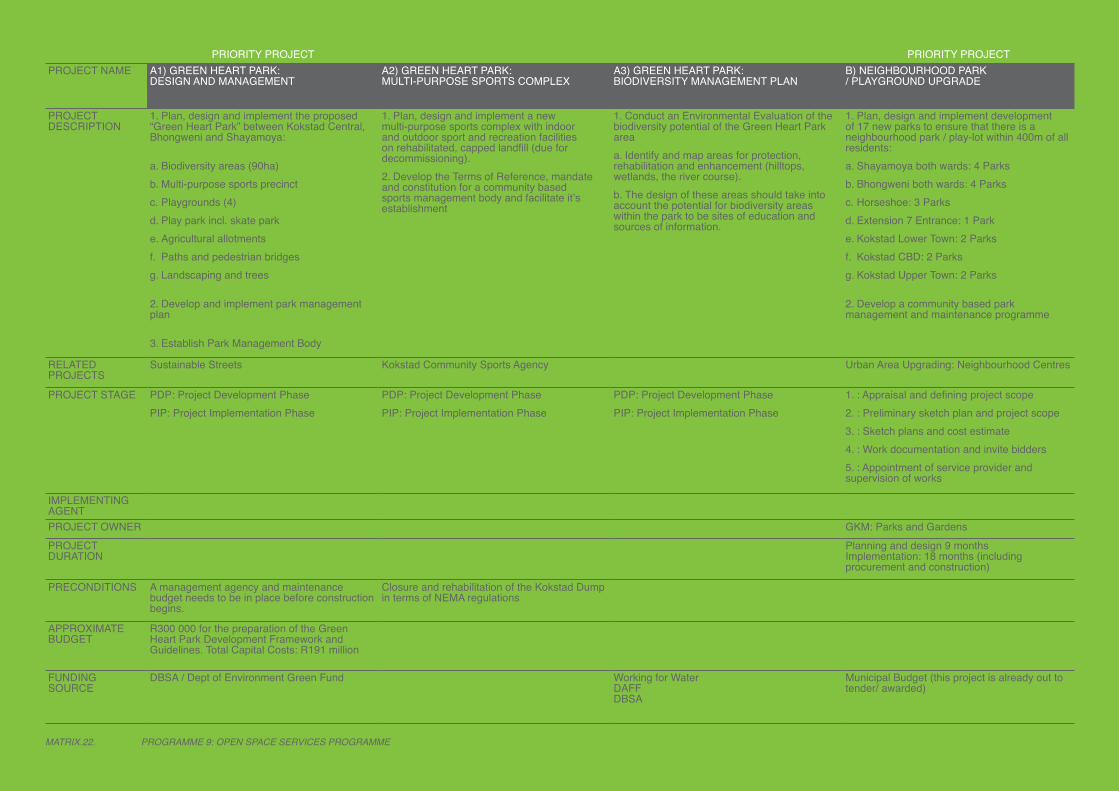
PRIORITY PROJECT PRIORITY PROJECTPROJECT NAME A1) GREEN HEART PARK:
DESIGN AND MANAGEMENT A2) GREEN HEART PARK: MULTI-PURPOSE SPORTS COMPLEX
A3) GREEN HEART PARK: BIODIVERSITY MANAGEMENT PLAN
B) NEIGHBOURHOOD PARK / PLAYGROUND UPGRADE
PROJECT DESCRIPTION
1. Plan, design and implement the proposed “Green Heart Park” between Kokstad Central, Bhongweni and Shayamoya:
a. Biodiversity areas (90ha) b. Multi-purpose sports precinctc. Playgrounds (4)d. Play park incl. skate park e. Agricultural allotments f. Paths and pedestrian bridgesg. Landscaping and trees
2. Develop and implement park management plan
3. Establish Park Management Body
1. Plan, design and implement a new multi-purpose sports complex with indoor and outdoor sport and recreation facilities on rehabilitated, capped landfill (due for decommissioning).2. Develop the Terms of Reference, mandate and constitution for a community based sports management body and facilitate it’s establishment
1. Conduct an Environmental Evaluation of the biodiversity potential of the Green Heart Park areaa. Identify and map areas for protection, rehabilitation and enhancement (hilltops, wetlands, the river course). b. The design of these areas should take into account the potential for biodiversity areas within the park to be sites of education and sources of information.
1. Plan, design and implement development of 17 new parks to ensure that there is a neighbourhood park / play-lot within 400m of all residents:a. Shayamoya both wards: 4 Parksb. Bhongweni both wards: 4 Parksc. Horseshoe: 3 Parksd. Extension 7 Entrance: 1 Parke. Kokstad Lower Town: 2 Parksf. Kokstad CBD: 2 Parksg. Kokstad Upper Town: 2 Parks
2. Develop a community based park management and maintenance programme
RELATED PROJECTS
Sustainable Streets Kokstad Community Sports Agency Urban Area Upgrading: Neighbourhood Centres
PROJECT STAGE PDP: Project Development PhasePIP: Project Implementation Phase
PDP: Project Development PhasePIP: Project Implementation Phase
PDP: Project Development PhasePIP: Project Implementation Phase
1. : Appraisal and defining project scope2. : Preliminary sketch plan and project scope3. : Sketch plans and cost estimate4. : Work documentation and invite bidders5. : Appointment of service provider and supervision of works
IMPLEMENTING AGENTPROJECT OWNER GKM: Parks and GardensPROJECT DURATION
Planning and design 9 months Implementation: 18 months (including procurement and construction)
PRECONDITIONS A management agency and maintenance budget needs to be in place before construction begins.
Closure and rehabilitation of the Kokstad Dump in terms of NEMA regulations
APPROXIMATE BUDGET
R300 000 for the preparation of the Green Heart Park Development Framework and Guidelines. Total Capital Costs: R191 million
FUNDING SOURCE
DBSA / Dept of Environment Green Fund Working for Water DAFF DBSA
Municipal Budget (this project is already out to tender/ awarded)
MATRiX.22. PROgRAMME 9: OPEN SPACE SERViCES PROgRAMME
KOKSTAD & FRANKLIN INTEGRATED SUSTAINABLE DEVELOPMENT PLAN
FINAL STRATEGY, DEVELOPMENT PLAN AND IMPLEMENTATION PLAN REPORT | NOVEMBER 2012
131
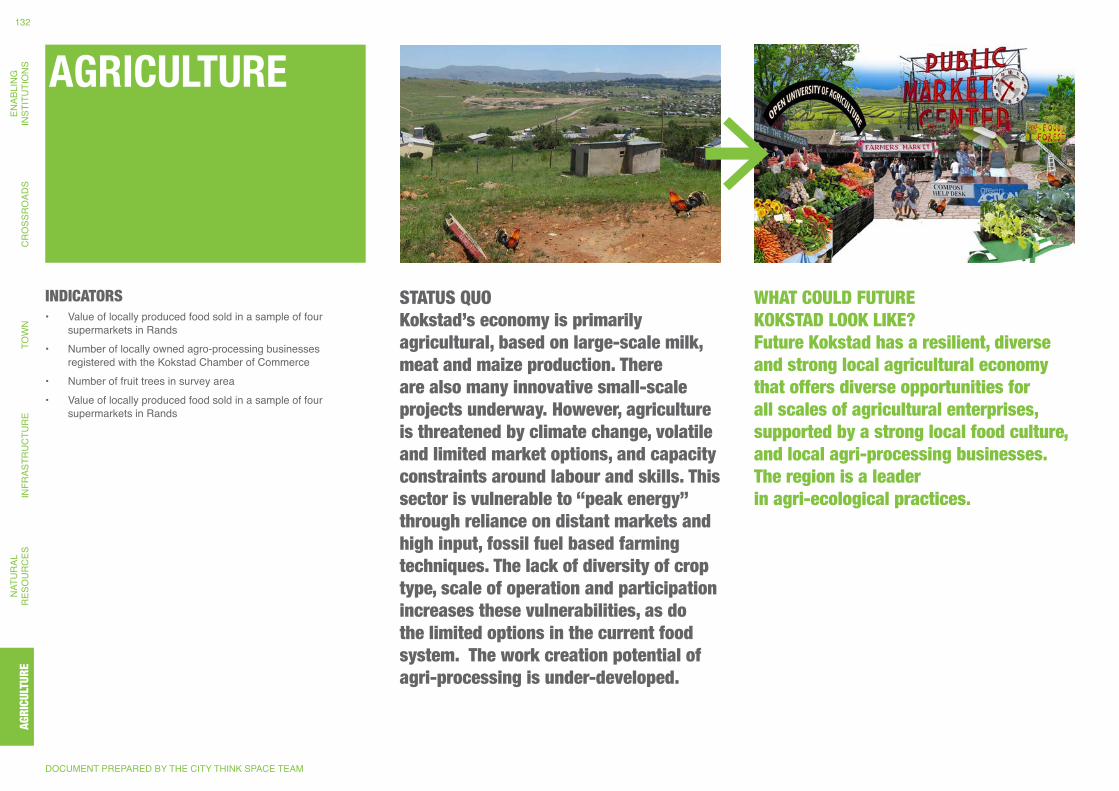
AGRICULTURE
STATUS QUO Kokstad’s economy is primarily agricultural, based on large-scale milk, meat and maize production. There are also many innovative small-scale projects underway. However, agriculture is threatened by climate change, volatile and limited market options, and capacity constraints around labour and skills. This sector is vulnerable to “peak energy” through reliance on distant markets and high input, fossil fuel based farming techniques. The lack of diversity of crop type, scale of operation and participation increases these vulnerabilities, as do the limited options in the current food system. The work creation potential of agri-processing is under-developed.
WHAT COULD FUTURE KOKSTAD LOOK LIKE? Future Kokstad has a resilient, diverse and strong local agricultural economy that offers diverse opportunities for all scales of agricultural enterprises, supported by a strong local food culture, and local agri-processing businesses. The region is a leader in agri-ecological practices.
INDICATORS • Value of locally produced food sold in a sample of four
supermarkets in Rands• Number of locally owned agro-processing businesses
registered with the Kokstad Chamber of Commerce• Number of fruit trees in survey area• Value of locally produced food sold in a sample of four
supermarkets in Rands
DOCUMENT PREPARED BY THE CITY THINK SPACE TEAM
AGR
ICU
LTU
RE
NAT
UR
AL
RES
OU
RC
ESIN
FRAS
TRU
CTU
RE
TOW
NC
RO
SSR
OAD
SEN
ABLI
NG
INST
ITU
TIO
NS
132AG
RICU
LTUR
E
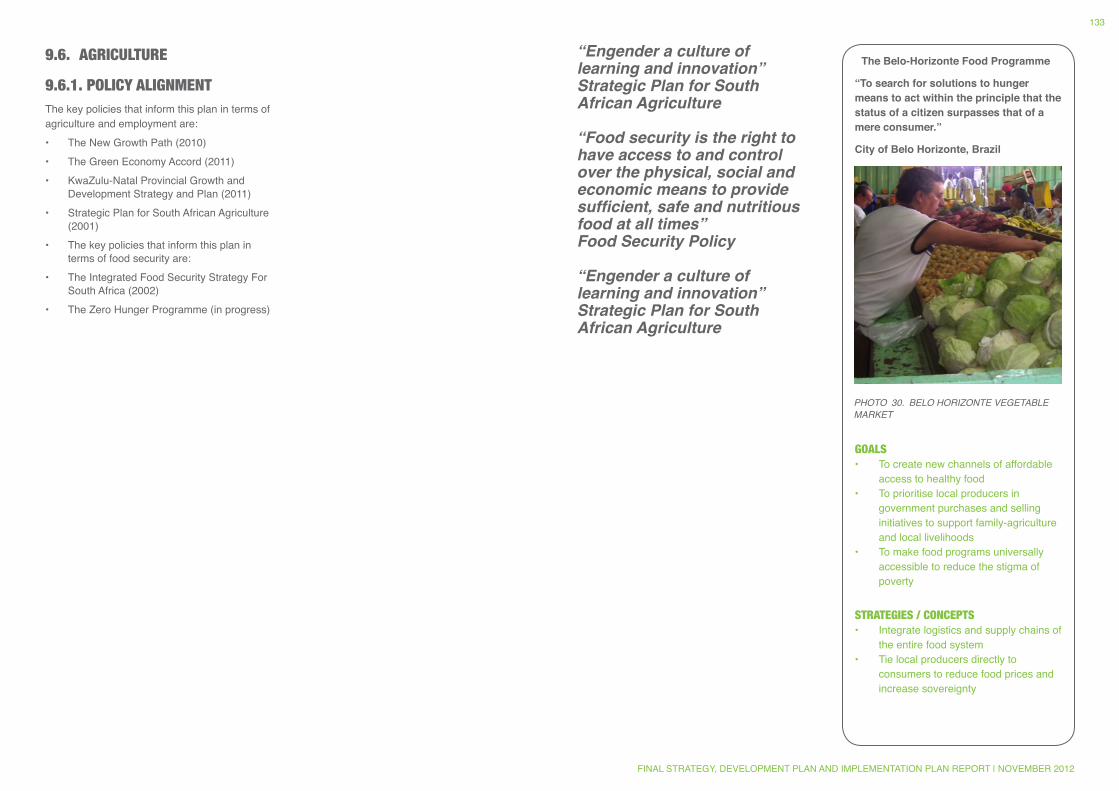
9.6. AGRICULTURE
9.6.1. POLICY ALIGNMENTThe key policies that inform this plan in terms of agriculture and employment are: • The New Growth Path (2010)• The Green Economy Accord (2011)• KwaZulu-Natal Provincial Growth and
Development Strategy and Plan (2011)• Strategic Plan for South African Agriculture
(2001)• The key policies that inform this plan in
terms of food security are: • The Integrated Food Security Strategy For
South Africa (2002) • The Zero Hunger Programme (in progress)
“Engender a culture of learning and innovation”Strategic Plan for South African Agriculture
“Food security is the right to have access to and control over the physical, social and economic means to provide sufficient, safe and nutritious food at all times”Food Security Policy
“Engender a culture of learning and innovation” Strategic Plan for South African Agriculture
The Belo-Horizonte Food Programme
“To search for solutions to hunger means to act within the principle that the status of a citizen surpasses that of a mere consumer.”
City of Belo Horizonte, Brazil
GOALS• To create new channels of affordable
access to healthy food• To prioritise local producers in
government purchases and selling initiatives to support family-agriculture and local livelihoods
• To make food programs universally accessible to reduce the stigma of poverty
STRATEGIES / CONCEPTS• Integrate logistics and supply chains of
the entire food system• Tie local producers directly to
consumers to reduce food prices and increase sovereignty
PHOTO 30. BELO HORiZONTE VEgETABLE MARKET
FINAL STRATEGY, DEVELOPMENT PLAN AND IMPLEMENTATION PLAN REPORT | NOVEMBER 2012
133
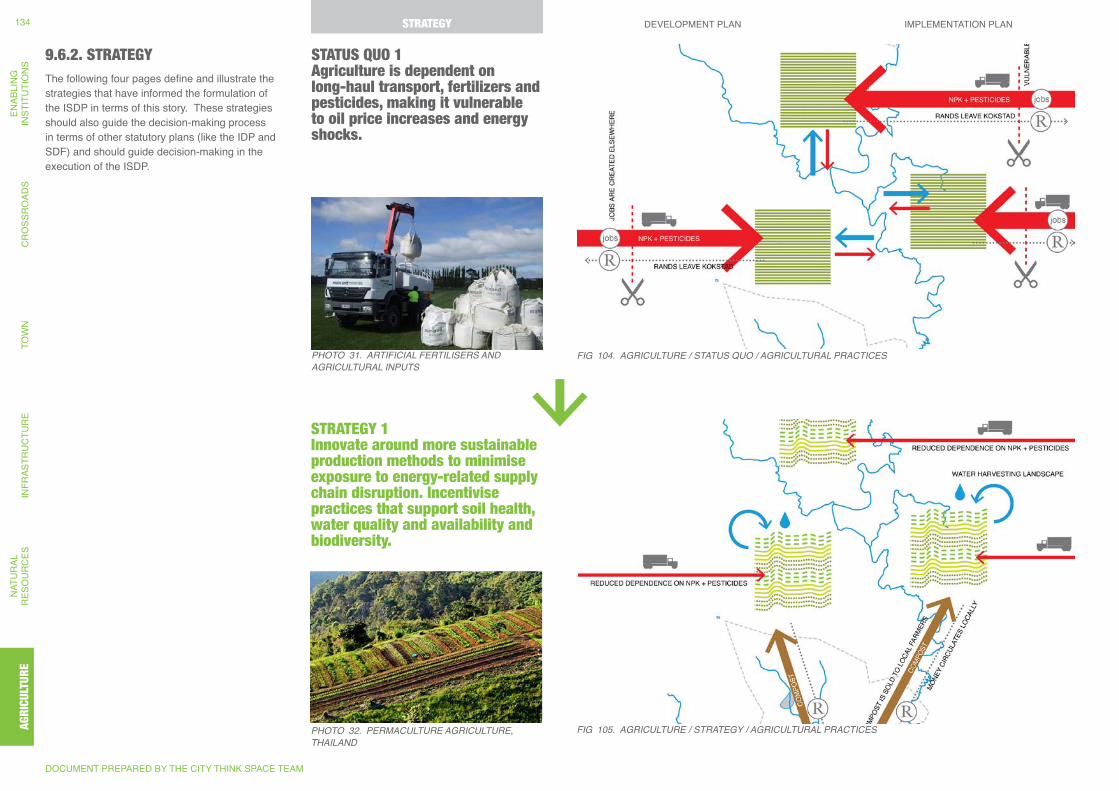
9.6.2. STRATEGYThe following four pages define and illustrate the strategies that have informed the formulation of the ISDP in terms of this story. These strategies should also guide the decision-making process in terms of other statutory plans (like the IDP and SDF) and should guide decision-making in the execution of the ISDP.
STATUS QUO 1 Agriculture is dependent on long-haul transport, fertilizers and pesticides, making it vulnerable to oil price increases and energy shocks.
Fig 104. AgRiCULTURE / STATUS QUO / AgRiCULTURAL PRACTiCESPHOTO 31. ARTiFiCiAL FERTiLiSERS AND AgRiCULTURAL iNPUTS
STRATEGY 1 Innovate around more sustainable production methods to minimise exposure to energy-related supply chain disruption. Incentivise practices that support soil health, water quality and availability and biodiversity.
PHOTO 32. PERMACULTURE AgRiCULTURE, THAiLAND
Fig 105. AgRiCULTURE / STRATEgY / AgRiCULTURAL PRACTiCES
DOCUMENT PREPARED BY THE CITY THINK SPACE TEAM
STRATEGY DEVELOPMENT PLAN IMPLEMENTATION PLANAG
RIC
ULT
UR
EN
ATU
RAL
R
ESO
UR
CES
INFR
ASTR
UC
TUR
ETO
WN
CR
OSS
RO
ADS
ENAB
LIN
GIN
STIT
UTI
ON
S134 STRATEGYSTRATEGY
AGRI
CULT
URE
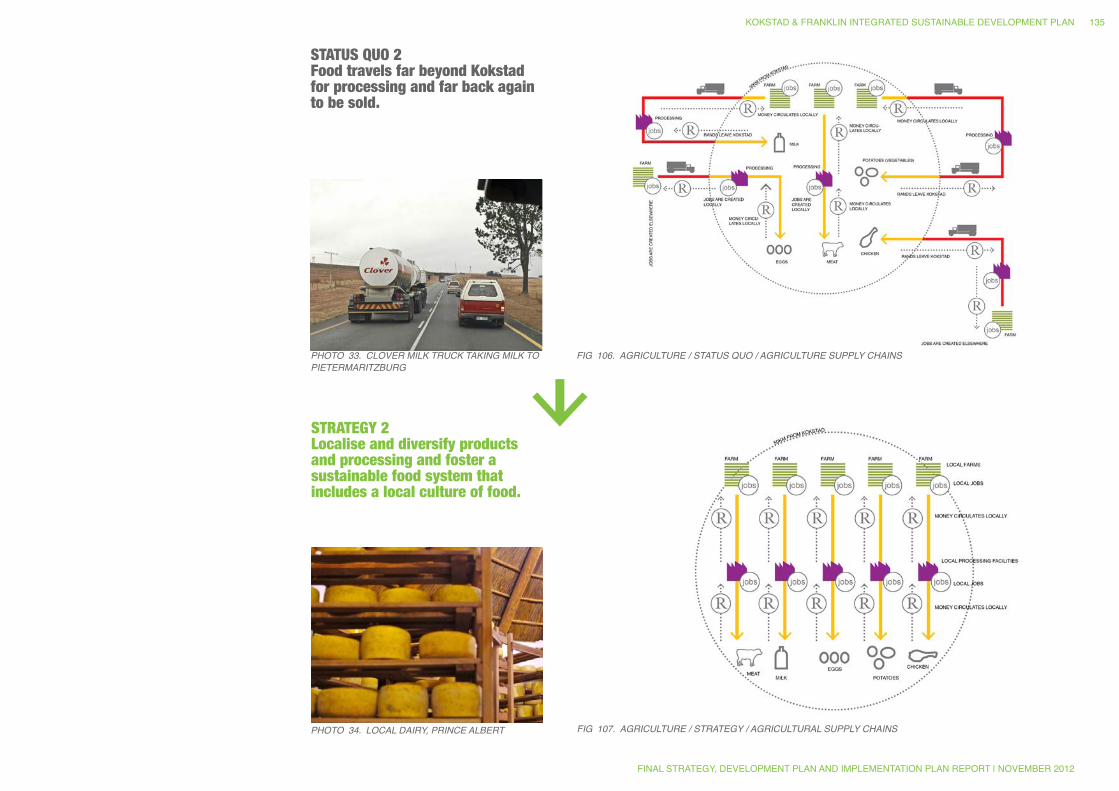
STATUS QUO 2 Food travels far beyond Kokstad for processing and far back again to be sold.
Fig 106. AgRiCULTURE / STATUS QUO / AgRiCULTURE SUPPLY CHAiNSPHOTO 33. CLOVER MiLK TRUCK TAKiNg MiLK TO PiETERMARiTZBURg
STRATEGY 2 Localise and diversify products and processing and foster a sustainable food system that includes a local culture of food.
PHOTO 34. LOCAL DAiRY, PRiNCE ALBERT Fig 107. AgRiCULTURE / STRATEgY / AgRiCULTURAL SUPPLY CHAiNS
KOKSTAD & FRANKLIN INTEGRATED SUSTAINABLE DEVELOPMENT PLAN
FINAL STRATEGY, DEVELOPMENT PLAN AND IMPLEMENTATION PLAN REPORT | NOVEMBER 2012
135
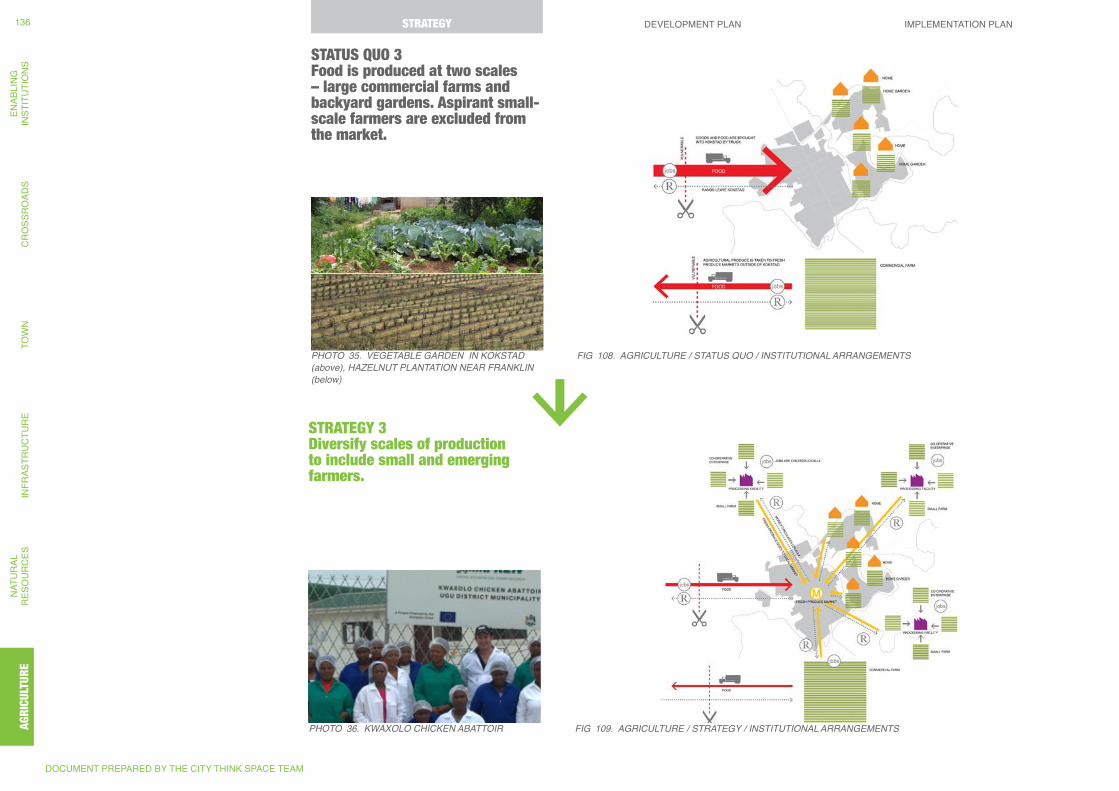
STATUS QUO 3 Food is produced at two scales – large commercial farms and backyard gardens. Aspirant small-scale farmers are excluded from the market.
Fig 108. AgRiCULTURE / STATUS QUO / iNSTiTUTiONAL ARRANgEMENTSPHOTO 35. VEgETABLE gARDEN iN KOKSTAD (above), HAZELNUT PLANTATiON NEAR FRANKLiN (below)
STRATEGY 3 Diversify scales of production to include small and emerging farmers.
PHOTO 36. KWAXOLO CHiCKEN ABATTOiR Fig 109. AgRiCULTURE / STRATEgY / iNSTiTUTiONAL ARRANgEMENTS
DOCUMENT PREPARED BY THE CITY THINK SPACE TEAM
STRATEGY DEVELOPMENT PLAN IMPLEMENTATION PLANAG
RIC
ULT
UR
EN
ATU
RAL
R
ESO
UR
CES
INFR
ASTR
UC
TUR
ETO
WN
CR
OSS
RO
ADS
ENAB
LIN
GIN
STIT
UTI
ON
S136 STRATEGY
AGRI
CULT
URE
STATUS QUO 4 Labourers and aspirant farmers have little to no access to skills development and training, and existing facilities do not teach necessary business skills.
“A lack of education leads our youth to be farm workers at an early stage of 17 - that is not good. This young guy is a farm worker” - green Ambassador Blog
STRATEGY 4 Promote and support Kokstad as a regional centre of excellence and innovation, with a strong focus on youth development.
PHOTO 37. OPPORTUNiTY AND UPWARD MOBiLiTY FOR EMERgiNg FARMERS
FINAL STRATEGY, DEVELOPMENT PLAN AND IMPLEMENTATION PLAN REPORT | NOVEMBER 2012
137
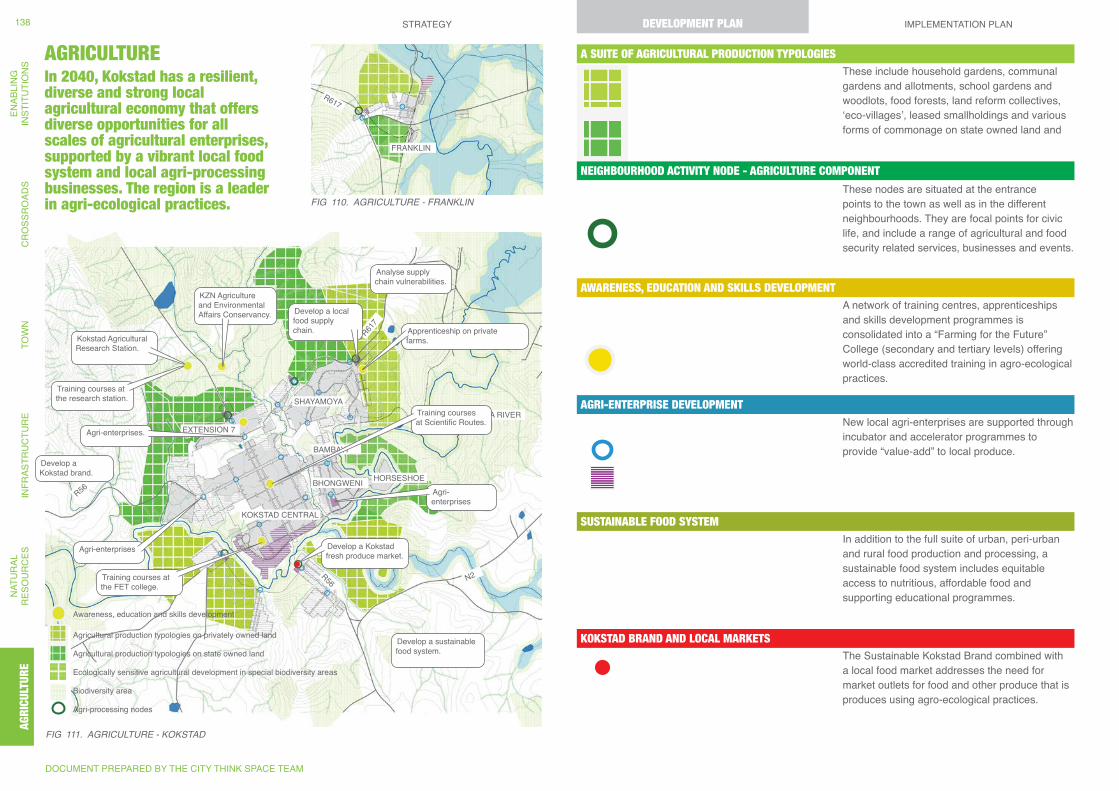
KOKSTAD CENTRAL
SHAYAMOYA
EXTENSION 7
BAMBAYI
HORSESHOEBHONGWENIR56
R617
R617
R56 N2
MZINTLAVA RIVER
FRANKLIN
Training courses at the FET college.
Training courses at the research station.
Agri-enterprises
Agri-enterprises
Agri-enterprises.
Develop a local food supply chain. Apprenticeship on private
farms.Kokstad Agricultural Research Station.
KZN Agriculture and Environmental Affairs Conservancy.
Training courses at Scientific Routes.
Develop a Kokstad fresh produce market.
Develop a Kokstad brand.
Biodiversity area
Agri-processing nodes
Awareness, education and skills development
Agricultural production typologies on state owned land
Agricultural production typologies on privately owned land
Ecologically sensitive agricultural development in special biodiversity areas
Develop a sustainable food system.
Analyse supply chain vulnerabilities.
AGRICULTUREIn 2040, Kokstad has a resilient, diverse and strong local agricultural economy that offers diverse opportunities for all scales of agricultural enterprises, supported by a vibrant local food system and local agri-processing businesses. The region is a leader in agri-ecological practices.
A SUITE OF AGRICULTURAL PRODUCTION TYPOLOGIES
NEIGHBOURHOOD ACTIVITY NODE - AGRICULTURE COMPONENT
AWARENESS, EDUCATION AND SKILLS DEVELOPMENT
AGRI-ENTERPRISE DEVELOPMENT
SUSTAINABLE FOOD SYSTEM
KOKSTAD BRAND AND LOCAL MARKETS
Fig 110. AgRiCULTURE - FRANKLiN
Fig 111. AgRiCULTURE - KOKSTAD
These include household gardens, communal gardens and allotments, school gardens and woodlots, food forests, land reform collectives, ‘eco-villages’, leased smallholdings and various forms of commonage on state owned land and
These nodes are situated at the entrance points to the town as well as in the different neighbourhoods. They are focal points for civic life, and include a range of agricultural and food security related services, businesses and events.
A network of training centres, apprenticeships and skills development programmes is consolidated into a “Farming for the Future” College (secondary and tertiary levels) offering world-class accredited training in agro-ecological practices.
New local agri-enterprises are supported through incubator and accelerator programmes to provide “value-add” to local produce.
In addition to the full suite of urban, peri-urban and rural food production and processing, a sustainable food system includes equitable access to nutritious, affordable food and supporting educational programmes.
The Sustainable Kokstad Brand combined with a local food market addresses the need for market outlets for food and other produce that is produces using agro-ecological practices.
DOCUMENT PREPARED BY THE CITY THINK SPACE TEAM
STRATEGY DEVELOPMENT PLAN IMPLEMENTATION PLANAG
RIC
ULT
UR
EN
ATU
RAL
R
ESO
UR
CES
INFR
ASTR
UC
TUR
ETO
WN
CR
OSS
RO
ADS
ENAB
LIN
GIN
STIT
UTI
ON
S138 DEVELOPMENT PLAN
AGRI
CULT
URE
9.6.3. DEVELOPMENT PLANThis section sets out the development plan for the Agriculture story, as informed by national, provincial and regional policies, and the story strategies.
The main sub-stories of the Agriculture story are:• Agriculture I: Agriculture
9.6.3.1 AGRICULTUREThe development plan focuses on building and deepening capacity in one of Kokstad’s current core capacities – agricultural production. It aims to build resilience in the face of impending resource limits and climate change, creating a vibrant and robust local agricultural economy that is linked to the development of an integrated sustainable food system that mitigates against food insecurity and ensures long term food sovereignty.
RATIONALEThe agricultural dimensions of Kokstad’s economy are primarily based on large scale milk, meat and maize production. These systems are currently under threat, and are not resilient in the long-term. The area as a whole is vulnerable to climate change, limited and constrained by volatile and limited market options, suffers capacity constraints around labour and skills and is exposed to “peak energy” through reliance on distant markets and high input, fossil fuel based farming techniques. The current lack of diversity of crop type, scale of operation and participation, limited access to land by the urban poor as well as current limited options in the food system increase Kokstad’s exposure. Importantly, the potential of developing a competitive agri-processing fuelled local economy remains under exploited.
PRINCIPLES• Promote food security, dignity and an
improved quality of life for each rural household (CRDP)
• Diversify scales and types of production to include small and emerging farmers, including urban agriculture.
• Increase production and the optimal and sustainable use of natural resources including land, grass, trees, water, natural gases, mineral resources, etc. (CRDP).
• Establish and strengthen rural livelihoods for vibrant local economic development (CRDP).
• Localise and diversify products and processing and foster a sustainable food system, founded on a vibrant local culture of food.
• Promote and support Kokstad as a regional centre of excellence and innovation, with a strong focus on youth development.
APPROACHThe Comprehensive Rural Development Programme (CRDP) is the basis for the plan’s approach to agriculture. The agricultural dimension of the development plan not encompass an agriculture sector plan, but rather proposes development of state owned land to promote food security and resilience in the face of climate change and projected disruptions to global food supply chains. The plan suggests supporting the NDP’s call for agrarian reform through the adoption of an agro-ecological approach to the long-term production of food, fuel, fibre and pharmaceuticals. The plan also advocates supporting many forms of agri-enterprise development and growing local capacity in agro-processing, as a key dimension of the local economy. A range of innovative agricultural typologies could be piloted and tested in the areas identified for agrarian reform. Further, the plan promotes awareness raising, education and skills development, with a focus on farm labourers, youth as well as raising awareness on climate change vulnerabilities and fossil fuel dependencies amongst existing, large-scale commercial farmers.
THE PLAN The plan combines a series of physical interventions related to new kinds of agricultural typologies, neighbourhood and gateway nodes and local food markets, with non-physical interventions focusing on skills development, entrepreneurial development, education and awareness raising. It also includes interventions that address the need for access to markets for local produce. Many of the elements of the plan combine to create a long-term, sustainable food system that goes beyond food production, addressing access and nutrition.
There is a strong focus on realising the potential of the extensive GKM landholdings both within and around Kokstad for agrarian reform.
KEY PROPOSALSKey proposals include:1. A suite of agricultural production typologies,
mostly, but not exclusively focused on GKM owned land.
2. Nodes in local neighbourhoods as well as at gateway points to Kokstad and Franklin that are focal points for civic life and include agricultural and food security themed components that are layered in addition to essential social services.
3. A network of training centres, apprenticeships and skills development programmes that are consolidated into a “Farming for the Future” College (secondary and tertiary levels) offering world-class accredited training in agro-ecological practices.
4. New local agri-enterprises that are supported through incubator and accelerator programmes to provide “value-add” to local produce (cheese from milk, cider from apples, preserves from fruit) as well as new businesses focusing on other yields from agro-ecological farming practices like honey, timber, seeds, medicinal herbs and so on.
5. The development of a Sustainable Kokstad Brand and a local food market.
ELEMENTS OF THE PLAN:The elements of the plan are explained in more detail over the next few pages.
KOKSTAD & FRANKLIN INTEGRATED SUSTAINABLE DEVELOPMENT PLAN
FINAL STRATEGY, DEVELOPMENT PLAN AND IMPLEMENTATION PLAN REPORT | NOVEMBER 2012
139
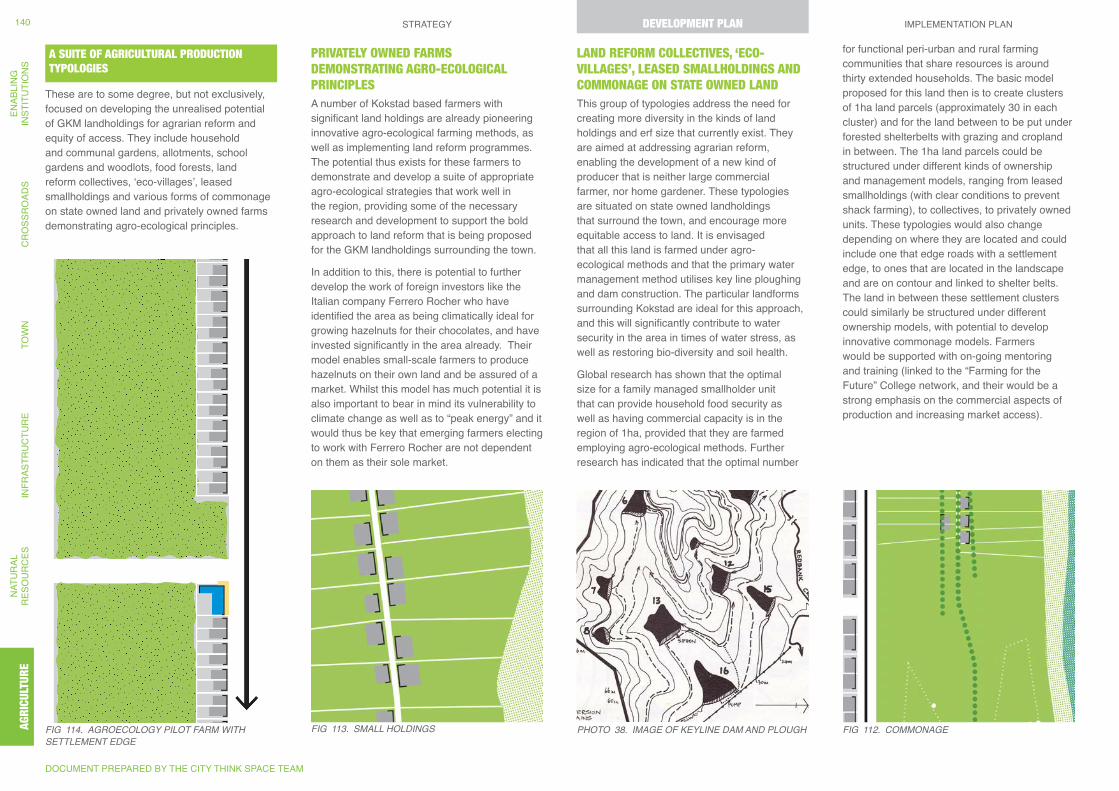
PRIVATELY OWNED FARMS DEMONSTRATING AGRO-ECOLOGICAL PRINCIPLES
LAND REFORM COLLECTIVES, ‘ECO-VILLAGES’, LEASED SMALLHOLDINGS AND COMMONAGE ON STATE OWNED LAND
PHOTO 38. iMAgE OF KEYLiNE DAM AND PLOUgH
A SUITE OF AGRICULTURAL PRODUCTION TYPOLOGIES
These are to some degree, but not exclusively, focused on developing the unrealised potential of GKM landholdings for agrarian reform and equity of access. They include household and communal gardens, allotments, school gardens and woodlots, food forests, land reform collectives, ‘eco-villages’, leased smallholdings and various forms of commonage on state owned land and privately owned farms demonstrating agro-ecological principles.
A number of Kokstad based farmers with significant land holdings are already pioneering innovative agro-ecological farming methods, as well as implementing land reform programmes. The potential thus exists for these farmers to demonstrate and develop a suite of appropriate agro-ecological strategies that work well in the region, providing some of the necessary research and development to support the bold approach to land reform that is being proposed for the GKM landholdings surrounding the town.
In addition to this, there is potential to further develop the work of foreign investors like the Italian company Ferrero Rocher who have identified the area as being climatically ideal for growing hazelnuts for their chocolates, and have invested significantly in the area already. Their model enables small-scale farmers to produce hazelnuts on their own land and be assured of a market. Whilst this model has much potential it is also important to bear in mind its vulnerability to climate change as well as to “peak energy” and it would thus be key that emerging farmers electing to work with Ferrero Rocher are not dependent on them as their sole market.
This group of typologies address the need for creating more diversity in the kinds of land holdings and erf size that currently exist. They are aimed at addressing agrarian reform, enabling the development of a new kind of producer that is neither large commercial farmer, nor home gardener. These typologies are situated on state owned landholdings that surround the town, and encourage more equitable access to land. It is envisaged that all this land is farmed under agro-ecological methods and that the primary water management method utilises key line ploughing and dam construction. The particular landforms surrounding Kokstad are ideal for this approach, and this will significantly contribute to water security in the area in times of water stress, as well as restoring bio-diversity and soil health.
Global research has shown that the optimal size for a family managed smallholder unit that can provide household food security as well as having commercial capacity is in the region of 1ha, provided that they are farmed employing agro-ecological methods. Further research has indicated that the optimal number
for functional peri-urban and rural farming communities that share resources is around thirty extended households. The basic model proposed for this land then is to create clusters of 1ha land parcels (approximately 30 in each cluster) and for the land between to be put under forested shelterbelts with grazing and cropland in between. The 1ha land parcels could be structured under different kinds of ownership and management models, ranging from leased smallholdings (with clear conditions to prevent shack farming), to collectives, to privately owned units. These typologies would also change depending on where they are located and could include one that edge roads with a settlement edge, to ones that are located in the landscape and are on contour and linked to shelter belts. The land in between these settlement clusters could similarly be structured under different ownership models, with potential to develop innovative commonage models. Farmers would be supported with on-going mentoring and training (linked to the “Farming for the Future” College network, and their would be a strong emphasis on the commercial aspects of production and increasing market access).
Fig 112. COMMONAgEFig 113. SMALL HOLDiNgS Fig 114. AgROECOLOgY PiLOT FARM WiTH SETTLEMENT EDgE
DOCUMENT PREPARED BY THE CITY THINK SPACE TEAM
STRATEGY DEVELOPMENT PLAN IMPLEMENTATION PLANAG
RIC
ULT
UR
EN
ATU
RAL
R
ESO
UR
CES
INFR
ASTR
UC
TUR
ETO
WN
CR
OSS
RO
ADS
ENAB
LIN
GIN
STIT
UTI
ON
S140 DEVELOPMENT PLAN
AGRI
CULT
URE
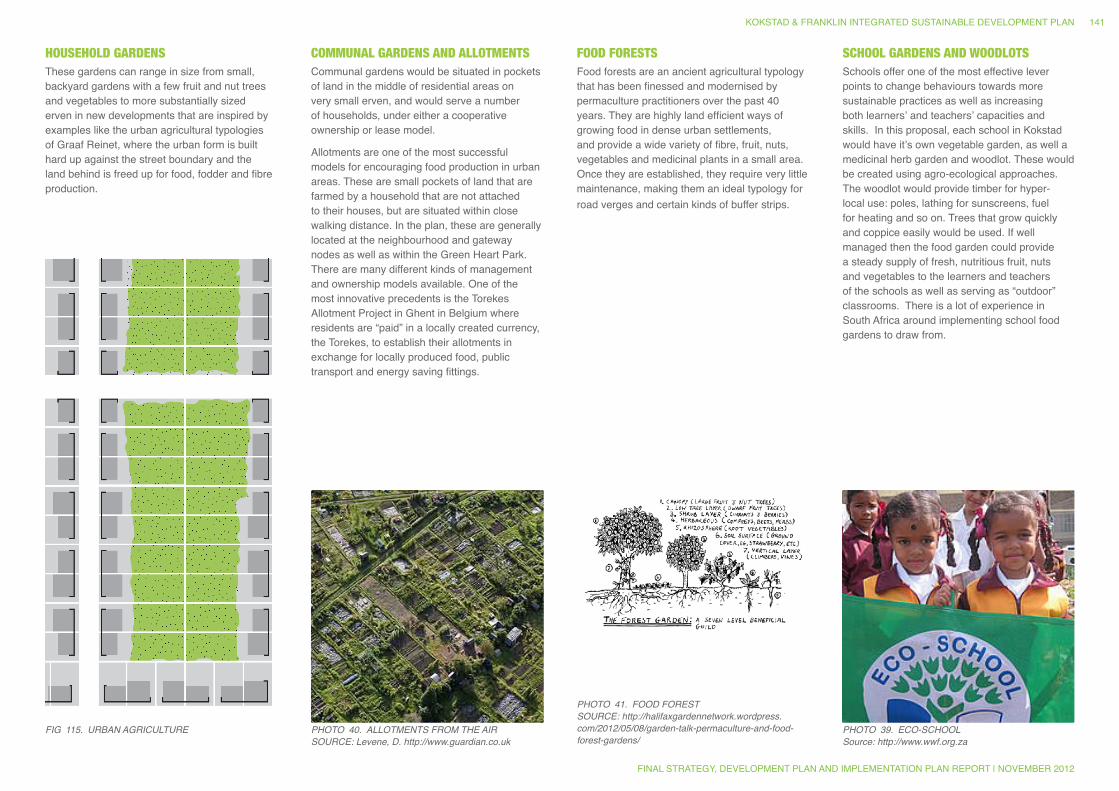
These gardens can range in size from small, backyard gardens with a few fruit and nut trees and vegetables to more substantially sized erven in new developments that are inspired by examples like the urban agricultural typologies of Graaf Reinet, where the urban form is built hard up against the street boundary and the land behind is freed up for food, fodder and fibre production.
HOUSEHOLD GARDENS COMMUNAL GARDENS AND ALLOTMENTS FOOD FORESTS SCHOOL GARDENS AND WOODLOTSCommunal gardens would be situated in pockets of land in the middle of residential areas on very small erven, and would serve a number of households, under either a cooperative ownership or lease model.
Allotments are one of the most successful models for encouraging food production in urban areas. These are small pockets of land that are farmed by a household that are not attached to their houses, but are situated within close walking distance. In the plan, these are generally located at the neighbourhood and gateway nodes as well as within the Green Heart Park. There are many different kinds of management and ownership models available. One of the most innovative precedents is the Torekes Allotment Project in Ghent in Belgium where residents are “paid” in a locally created currency, the Torekes, to establish their allotments in exchange for locally produced food, public transport and energy saving fittings.
Food forests are an ancient agricultural typology that has been finessed and modernised by permaculture practitioners over the past 40 years. They are highly land efficient ways of growing food in dense urban settlements, and provide a wide variety of fibre, fruit, nuts, vegetables and medicinal plants in a small area. Once they are established, they require very little maintenance, making them an ideal typology for road verges and certain kinds of buffer strips.
Schools offer one of the most effective lever points to change behaviours towards more sustainable practices as well as increasing both learners’ and teachers’ capacities and skills. In this proposal, each school in Kokstad would have it’s own vegetable garden, as well a medicinal herb garden and woodlot. These would be created using agro-ecological approaches. The woodlot would provide timber for hyper-local use: poles, lathing for sunscreens, fuel for heating and so on. Trees that grow quickly and coppice easily would be used. If well managed then the food garden could provide a steady supply of fresh, nutritious fruit, nuts and vegetables to the learners and teachers of the schools as well as serving as “outdoor” classrooms. There is a lot of experience in South Africa around implementing school food gardens to draw from.
PHOTO 39. ECO-SCHOOLSource: http://www.wwf.org.za
PHOTO 40. ALLOTMENTS FROM THE AiRSOURCE: Levene, D. http://www.guardian.co.uk
Fig 115. URBAN AgRiCULTURE
PHOTO 41. FOOD FORESTSOURCE: http://halifaxgardennetwork.wordpress.com/2012/05/08/garden-talk-permaculture-and-food-forest-gardens/
KOKSTAD & FRANKLIN INTEGRATED SUSTAINABLE DEVELOPMENT PLAN
FINAL STRATEGY, DEVELOPMENT PLAN AND IMPLEMENTATION PLAN REPORT | NOVEMBER 2012
141
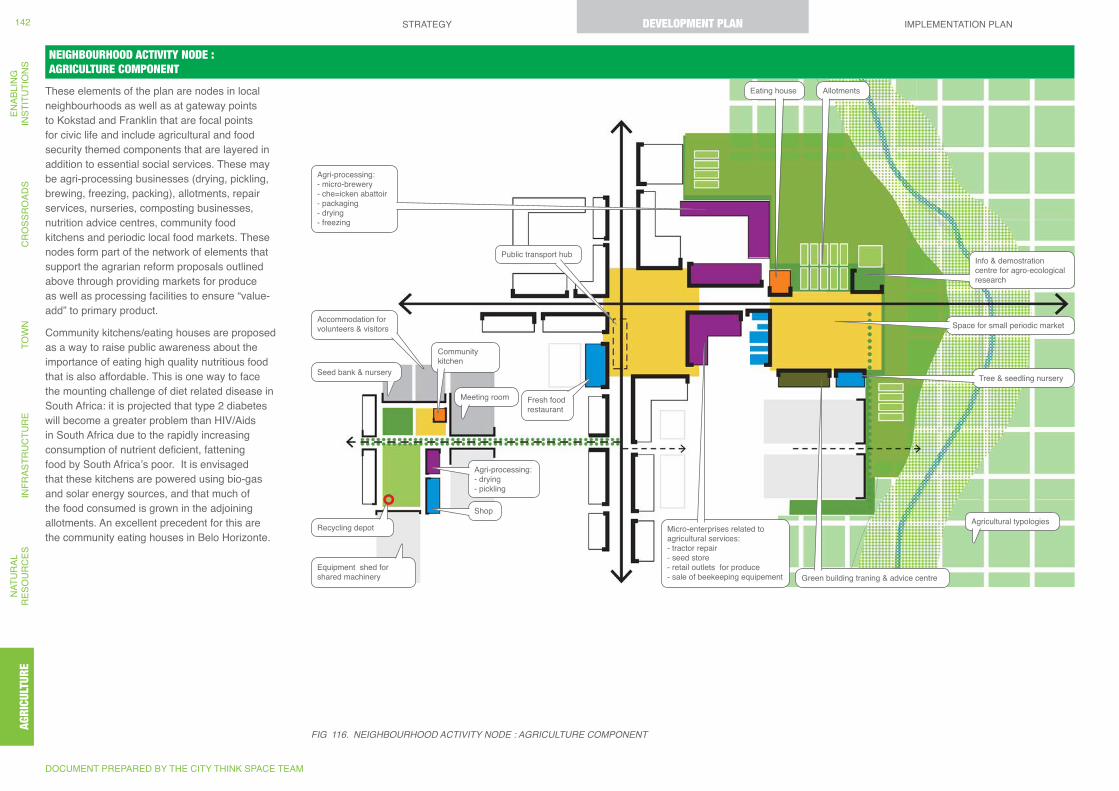
Fresh food restaurant
Space for small periodic market
Tree & seedling nursery
Agricultural typologies
Agri-processing: - drying - pickling
Shop
Meeting room
Info & demostration centre for agro-ecological research
Agri-processing: - micro-brewery - che=icken abattoir - packaging - drying - freezing
Micro-enterprises related to agricultural services: - tractor repair - seed store - retail outlets for produce - sale of beekeeping equipement Green building traning & advice centre
Eating house Allotments
Seed bank & nursery
Recycling depot
Equipment shed for shared machinery
Accommodation for volunteers & visitors
Public transport hub
Community kitchen
These elements of the plan are nodes in local neighbourhoods as well as at gateway points to Kokstad and Franklin that are focal points for civic life and include agricultural and food security themed components that are layered in addition to essential social services. These may be agri-processing businesses (drying, pickling, brewing, freezing, packing), allotments, repair services, nurseries, composting businesses, nutrition advice centres, community food kitchens and periodic local food markets. These nodes form part of the network of elements that support the agrarian reform proposals outlined above through providing markets for produce as well as processing facilities to ensure “value- add” to primary product.
Community kitchens/eating houses are proposed as a way to raise public awareness about the importance of eating high quality nutritious food that is also affordable. This is one way to face the mounting challenge of diet related disease in South Africa: it is projected that type 2 diabetes will become a greater problem than HIV/Aids in South Africa due to the rapidly increasing consumption of nutrient deficient, fattening food by South Africa’s poor. It is envisaged that these kitchens are powered using bio-gas and solar energy sources, and that much of the food consumed is grown in the adjoining allotments. An excellent precedent for this are the community eating houses in Belo Horizonte.
NEIGHBOURHOOD ACTIVITY NODE : AGRICULTURE COMPONENT
Fig 116. NEigHBOURHOOD ACTiViTY NODE : AgRiCULTURE COMPONENT
DOCUMENT PREPARED BY THE CITY THINK SPACE TEAM
STRATEGY DEVELOPMENT PLAN IMPLEMENTATION PLANAG
RIC
ULT
UR
EN
ATU
RAL
R
ESO
UR
CES
INFR
ASTR
UC
TUR
ETO
WN
CR
OSS
RO
ADS
ENAB
LIN
GIN
STIT
UTI
ON
S142 DEVELOPMENT PLAN
AGRI
CULT
URE
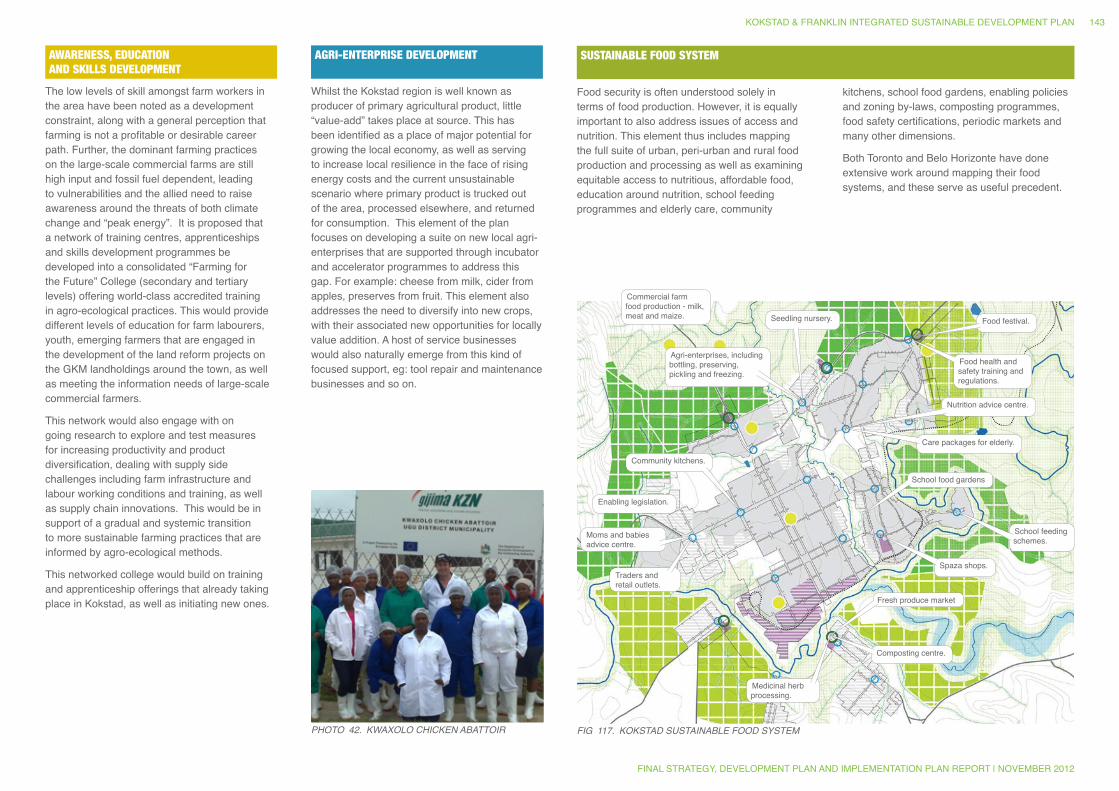
Care packages for elderly.
School food gardens
Fresh produce market
Enabling legislation.
Community kitchens.
Agri-enterprises, including bottling, preserving, pickling and freezing.
Nutrition advice centre.
Moms and babies advice centre.
Food health and safety training and regulations.
Commercial farm food production - milk, meat and maize.
Traders and retail outlets.
Spaza shops.
Food festival.
School feeding schemes.
Composting centre.
Seedling nursery.
Medicinal herb processing.
The low levels of skill amongst farm workers in the area have been noted as a development constraint, along with a general perception that farming is not a profitable or desirable career path. Further, the dominant farming practices on the large-scale commercial farms are still high input and fossil fuel dependent, leading to vulnerabilities and the allied need to raise awareness around the threats of both climate change and “peak energy”. It is proposed that a network of training centres, apprenticeships and skills development programmes be developed into a consolidated “Farming for the Future” College (secondary and tertiary levels) offering world-class accredited training in agro-ecological practices. This would provide different levels of education for farm labourers, youth, emerging farmers that are engaged in the development of the land reform projects on the GKM landholdings around the town, as well as meeting the information needs of large-scale commercial farmers.
This network would also engage with on going research to explore and test measures for increasing productivity and product diversification, dealing with supply side challenges including farm infrastructure and labour working conditions and training, as well as supply chain innovations. This would be in support of a gradual and systemic transition to more sustainable farming practices that are informed by agro-ecological methods.
This networked college would build on training and apprenticeship offerings that already taking place in Kokstad, as well as initiating new ones.
AWARENESS, EDUCATION AND SKILLS DEVELOPMENT
AGRI-ENTERPRISE DEVELOPMENT
Whilst the Kokstad region is well known as producer of primary agricultural product, little “value-add” takes place at source. This has been identified as a place of major potential for growing the local economy, as well as serving to increase local resilience in the face of rising energy costs and the current unsustainable scenario where primary product is trucked out of the area, processed elsewhere, and returned for consumption. This element of the plan focuses on developing a suite on new local agri-enterprises that are supported through incubator and accelerator programmes to address this gap. For example: cheese from milk, cider from apples, preserves from fruit. This element also addresses the need to diversify into new crops, with their associated new opportunities for locally value addition. A host of service businesses would also naturally emerge from this kind of focused support, eg: tool repair and maintenance businesses and so on.
PHOTO 42. KWAXOLO CHiCKEN ABATTOiR
Food security is often understood solely in terms of food production. However, it is equally important to also address issues of access and nutrition. This element thus includes mapping the full suite of urban, peri-urban and rural food production and processing as well as examining equitable access to nutritious, affordable food, education around nutrition, school feeding programmes and elderly care, community
SUSTAINABLE FOOD SYSTEM
kitchens, school food gardens, enabling policies and zoning by-laws, composting programmes, food safety certifications, periodic markets and many other dimensions.
Both Toronto and Belo Horizonte have done extensive work around mapping their food systems, and these serve as useful precedent.
Fig 117. KOKSTAD SUSTAiNABLE FOOD SYSTEM
KOKSTAD & FRANKLIN INTEGRATED SUSTAINABLE DEVELOPMENT PLAN
FINAL STRATEGY, DEVELOPMENT PLAN AND IMPLEMENTATION PLAN REPORT | NOVEMBER 2012
143
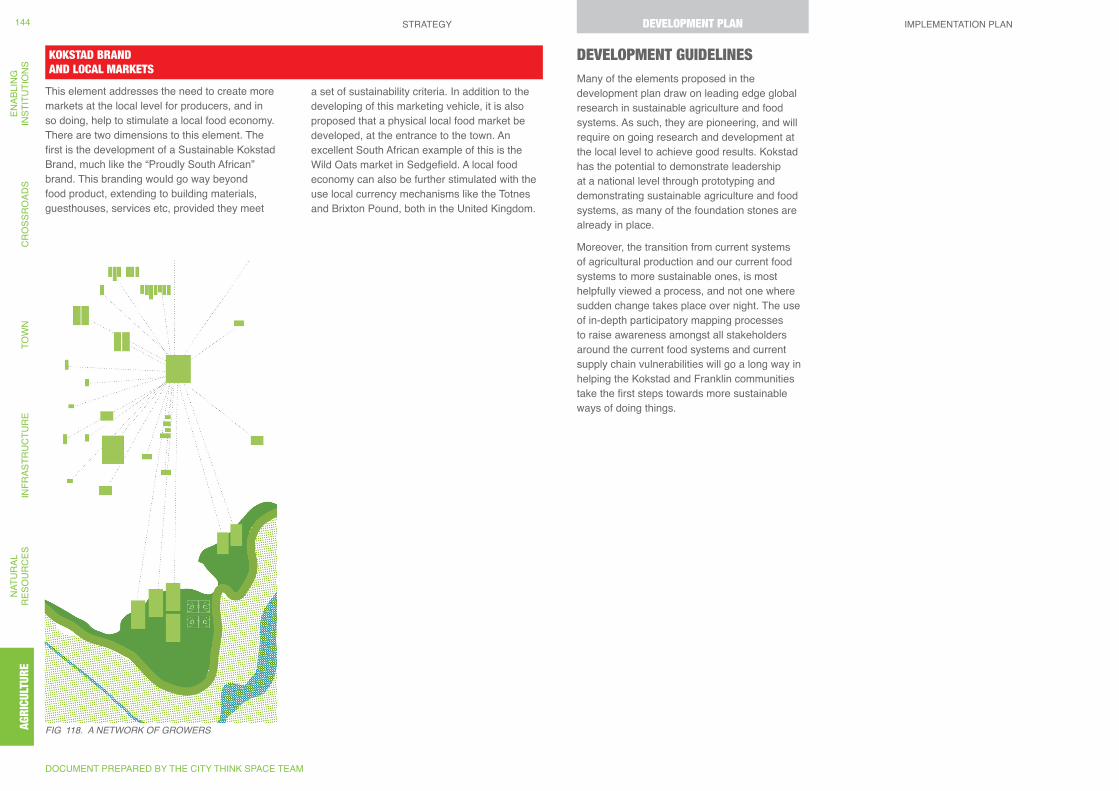
DEVELOPMENT GUIDELINESMany of the elements proposed in the development plan draw on leading edge global research in sustainable agriculture and food systems. As such, they are pioneering, and will require on going research and development at the local level to achieve good results. Kokstad has the potential to demonstrate leadership at a national level through prototyping and demonstrating sustainable agriculture and food systems, as many of the foundation stones are already in place.
Moreover, the transition from current systems of agricultural production and our current food systems to more sustainable ones, is most helpfully viewed a process, and not one where sudden change takes place over night. The use of in-depth participatory mapping processes to raise awareness amongst all stakeholders around the current food systems and current supply chain vulnerabilities will go a long way in helping the Kokstad and Franklin communities take the first steps towards more sustainable ways of doing things.
KOKSTAD BRAND AND LOCAL MARKETS
This element addresses the need to create more markets at the local level for producers, and in so doing, help to stimulate a local food economy. There are two dimensions to this element. The first is the development of a Sustainable Kokstad Brand, much like the “Proudly South African” brand. This branding would go way beyond food product, extending to building materials, guesthouses, services etc, provided they meet
Fig 118. A NETWORK OF gROWERS
a set of sustainability criteria. In addition to the developing of this marketing vehicle, it is also proposed that a physical local food market be developed, at the entrance to the town. An excellent South African example of this is the Wild Oats market in Sedgefield. A local food economy can also be further stimulated with the use local currency mechanisms like the Totnes and Brixton Pound, both in the United Kingdom.
DOCUMENT PREPARED BY THE CITY THINK SPACE TEAM
STRATEGY DEVELOPMENT PLAN IMPLEMENTATION PLANAG
RIC
ULT
UR
EN
ATU
RAL
R
ESO
UR
CES
INFR
ASTR
UC
TUR
ETO
WN
CR
OSS
RO
ADS
ENAB
LIN
GIN
STIT
UTI
ON
S144 DEVELOPMENT PLAN
AGRI
CULT
URE

KOKSTAD & FRANKLIN INTEGRATED SUSTAINABLE DEVELOPMENT PLAN
FINAL STRATEGY, DEVELOPMENT PLAN AND IMPLEMENTATION PLAN REPORT | NOVEMBER 2012
145
9.6.4. IMPLEMENTATION PLANThe implementation plan for this story has one programme:• ‘Farming for the Future’ + Sustainable Food
Systems Programme
PROGRAMME 10: “FARMING FOR THE FUTURE” & SUSTAINABLE FOOD SYSTEM PROGRAMMEOne implementation programme is proposed for the implementation plan: The “Farming For The Future” And Sustainable Food System Programme:
This programme focuses on building and deepening capacity in one of Kokstad’s current core capacities – agricultural production. It aims to build resilience in the face of impending resource limits and climate change, creating a vibrant and robust local agricultural economy that is linked to the development of an integrated sustainable food system that mitigates against food insecurity and ensures long term food sovereignty.
The policy environment in South Africa is still in its infancy with regards to agroecology and food security, however, The Green Economy Accord advocates the development of green jobs linked to some aspects of the agricultural sector, and the Zero Hunger Strategy (currently still in development) encourages the support of small-scale agriculture. A number of municipalities around SA are embarking on the development of local food security strategies.
The programme proposes that the GKM commits to enabling the following components:• Supporting a public participation process
to develop a shared community vision of a resilient food system that includes and goes beyond urban agriculture as the primary response to food security.
• Championing the establishment of a “Farming for the Future” college - a network of existing and new educational and apprenticeship based initiatives that develop skill and knowledge in agro-ecological approaches to agriculture.
• Supporting local economic development through the establishment of an Agri-enterprise incubator that focuses on value-add to existing produce as well as developing new products and services.
• Establishing a local produce market linked to the development of a “Kokstad Brand”
• Prototyping new forms of landownership and development on GKM owned land
• Supporting learners to learn about agro-ecological principles through the School Food Garden and Woodlot Project
• Developing a series of neighbourhood nodes that include key components to support resilience at the local level – community kitchens, composting centres, nutrition advice centres, nurseries and repair services.
• Supporting the establishment of a fully developed demonstration of permaculture methods and other innovations on the Bosman farm.
MATRiX.23. PROgRAMME 10: ENABLiNg iNSTiTUTiONAL iNTERVENTiONS
ENABLING INSTITUTIONAL INTERVENTIONSCOMMUNICATION, PARTNERSHIP & ENGAGEMENT
POLICY, INCENTIVES & GUIDELINES
BYLAWS & ZONING SCHEME AMENDMENTS
DESCRIPTION Kokstad Sustainable Food System project:Develop a community generated vision and plan for a sustainable food system for Kokstad and Franklin that focuses on all aspects of food security (i.e. not just on urban agriculture)
Develop suite of incentives for local business owners.
Local currency issued by the GKM to stimulate local trade (e.g.: the Brixton Pound and the Totnes Pound)
DURATION 1 year a. 1 yearb. 2 years from inception to first prototype
6 months
APPROX. BUDGET R1.5M a. R500 000b. R1M
R500 000
FUNDING SOURCE
DOCUMENT PREPARED BY THE CITY THINK SPACE TEAM
STRATEGY DEVELOPMENT PLAN IMPLEMENTATION PLANAG
RIC
ULT
UR
EN
ATU
RAL
R
ESO
UR
CES
INFR
ASTR
UC
TUR
ETO
WN
CR
OSS
RO
ADS
ENAB
LIN
GIN
STIT
UTI
ON
S146 IMPLEMENTATION PLAN
AGRI
CULT
URE
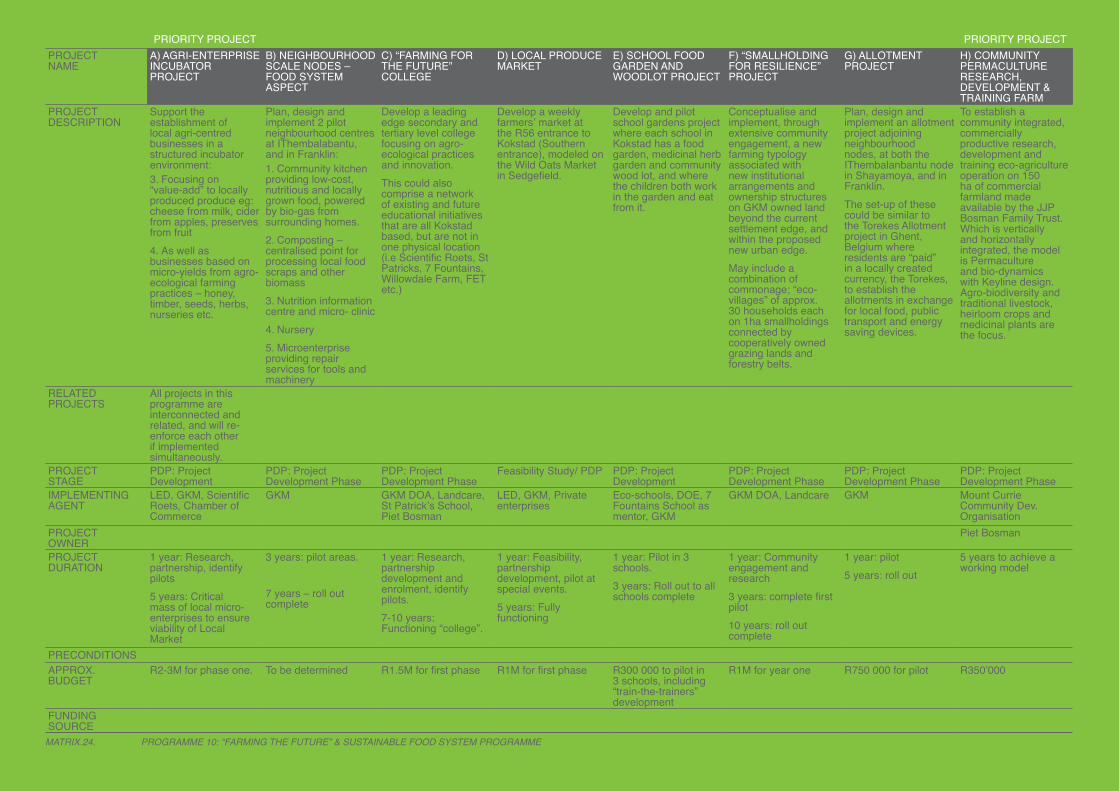
MATRiX.24. PROgRAMME 10: “FARMiNg THE FUTURE” & SUSTAiNABLE FOOD SYSTEM PROgRAMME
PRIORITY PROJECT PRIORITY PROJECTPROJECT NAME
A) AGRI-ENTERPRISE INCUBATOR PROJECT
B) NEIGHBOURHOOD SCALE NODES – FOOD SYSTEM ASPECT
C) “FARMING FOR THE FUTURE” COLLEGE
D) LOCAL PRODUCE MARKET
E) SCHOOL FOOD GARDEN AND WOODLOT PROJECT
F) “SMALLHOLDING FOR RESILIENCE” PROJECT
G) ALLOTMENT PROJECT
H) COMMUNITY PERMACULTURE RESEARCH, DEVELOPMENT & TRAINING FARM
PROJECT DESCRIPTION
Support the establishment of local agri-centred businesses in a structured incubator environment: 3. Focusing on “value-add” to locally produced produce eg: cheese from milk, cider from apples, preserves from fruit 4. As well as businesses based on micro-yields from agro-ecological farming practices – honey, timber, seeds, herbs, nurseries etc.
Plan, design and implement 2 pilot neighbourhood centres at IThembalabantu, and in Franklin: 1. Community kitchen providing low-cost, nutritious and locally grown food, powered by bio-gas from surrounding homes. 2. Composting – centralised point for processing local food scraps and other biomass 3. Nutrition information centre and micro- clinic4. Nursery 5. Microenterprise providing repair services for tools and machinery
Develop a leading edge secondary and tertiary level college focusing on agro-ecological practices and innovation. This could also comprise a network of existing and future educational initiatives that are all Kokstad based, but are not in one physical location (i.e Scientific Roets, St Patricks, 7 Fountains, Willowdale Farm, FET etc.)
Develop a weekly farmers’ market at the R56 entrance to Kokstad (Southern entrance), modeled on the Wild Oats Market in Sedgefield.
Develop and pilot school gardens project where each school in Kokstad has a food garden, medicinal herb garden and community wood lot, and where the children both work in the garden and eat from it.
Conceptualise and implement, through extensive community engagement, a new farming typology associated with new institutional arrangements and ownership structures on GKM owned land beyond the current settlement edge, and within the proposed new urban edge. May include a combination of commonage; “eco-villages” of approx. 30 households each on 1ha smallholdings connected by cooperatively owned grazing lands and forestry belts.
Plan, design and implement an allotment project adjoining neighbourhood nodes, at both the IThembalanbantu node in Shayamoya, and in Franklin.The set-up of these could be similar to the Torekes Allotment project in Ghent, Belgium where residents are “paid” in a locally created currency, the Torekes, to establish the allotments in exchange for local food, public transport and energy saving devices.
To establish a community integrated, commercially productive research, development and training eco-agriculture operation on 150 ha of commercial farmland made available by the JJP Bosman Family Trust. Which is vertically and horizontally integrated, the model is Permaculture and bio-dynamics with Keyline design. Agro-biodiversity and traditional livestock, heirloom crops and medicinal plants are the focus.
RELATED PROJECTS
All projects in this programme are interconnected and related, and will re-enforce each other if implemented simultaneously.
PROJECT STAGE
PDP: Project Development
PDP: Project Development Phase
PDP: Project Development Phase
Feasibility Study/ PDP PDP: Project Development
PDP: Project Development Phase
PDP: Project Development Phase
PDP: Project Development Phase
IMPLEMENTING AGENT
LED, GKM, Scientific Roets, Chamber of Commerce
GKM GKM DOA, Landcare, St Patrick’s School, Piet Bosman
LED, GKM, Private enterprises
Eco-schools, DOE, 7 Fountains School as mentor, GKM
GKM DOA, Landcare GKM Mount Currie Community Dev. Organisation
PROJECT OWNER
Piet Bosman
PROJECT DURATION
1 year: Research, partnership, identify pilots 5 years: Critical mass of local micro-enterprises to ensure viability of Local Market
3 years: pilot areas.
7 years – roll out complete
1 year: Research, partnership development and enrolment, identify pilots. 7-10 years: Functioning “college”.
1 year: Feasibility, partnership development, pilot at special events. 5 years: Fully functioning
1 year: Pilot in 3 schools. 3 years: Roll out to all schools complete
1 year: Community engagement and research3 years: complete first pilot10 years: roll out complete
1 year: pilot5 years: roll out
5 years to achieve a working model
PRECONDITIONSAPPROX. BUDGET
R2-3M for phase one. To be determined R1.5M for first phase R1M for first phase R300 000 to pilot in 3 schools, including “train-the-trainers” development
R1M for year one R750 000 for pilot R350’000
FUNDING SOURCE
KOKSTAD & FRANKLIN INTEGRATED SUSTAINABLE DEVELOPMENT PLAN
FINAL STRATEGY, DEVELOPMENT PLAN AND IMPLEMENTATION PLAN REPORT | NOVEMBER 2012
147
10. IMPLEMENTATION PLAN SYNTHESISThe following pages give an overall spatial representation of the programmes and projects listed under the implementation plans of the stories. It unpacks how the various projects and programmes fit together at a neighbourhood/town level.
0. ENABLING INSTITUTIONAL INTERVENTIONS PROGRAMME
A) ISDP: Programme Management Unit
B) Close The Institutional Loops
C) GKM Capacity Building
D) Municipal Infrastructure Maintenance & Management Initiative
E) Climate Change Mitigation & Adaptation Strategies
F) Green Ambassador Programme
G) Partnerships for Sustainability & Low Carbon Economy Initiative
DOCUMENT PREPARED BY THE CITY THINK SPACE TEAM
KOKSTAD & FRANKLIN INTEGRATED SUSTAINABLE DEVELOPMENT PLAN148 ENABLING INSTITUTIONS
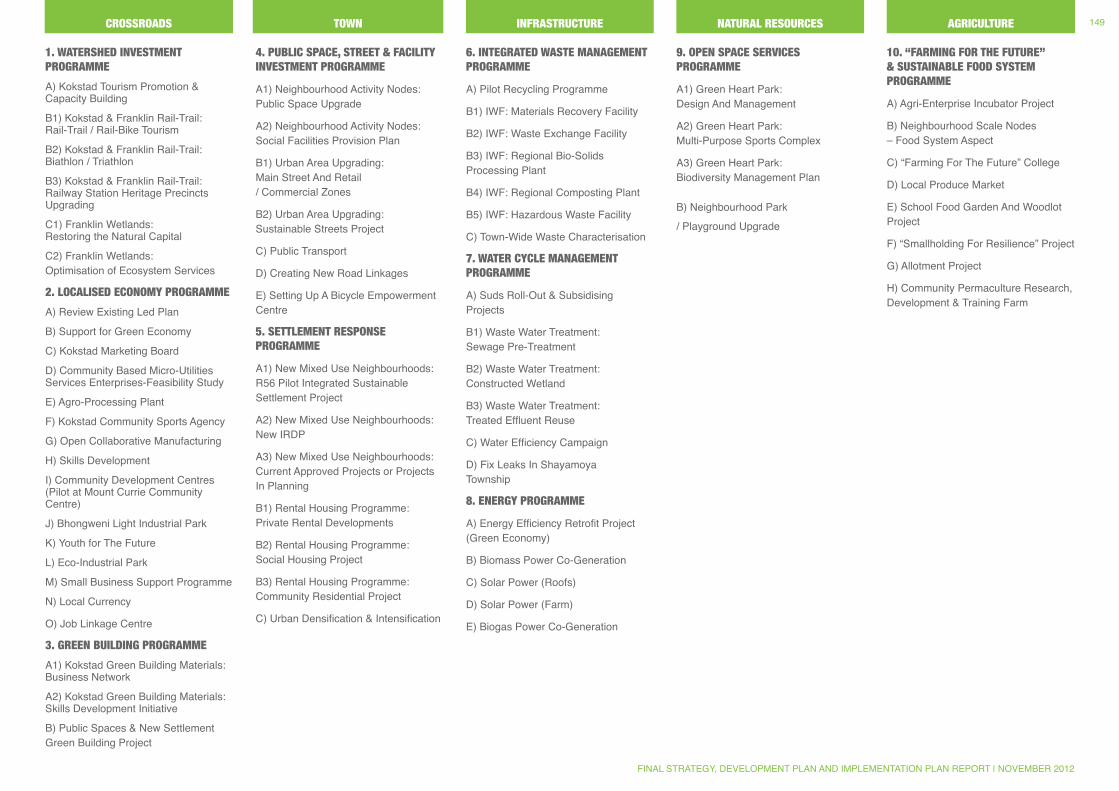
1. WATERSHED INVESTMENT PROGRAMME
A) Kokstad Tourism Promotion & Capacity Building
B1) Kokstad & Franklin Rail-Trail: Rail-Trail / Rail-Bike Tourism
B2) Kokstad & Franklin Rail-Trail: Biathlon / Triathlon
B3) Kokstad & Franklin Rail-Trail: Railway Station Heritage Precincts Upgrading
C1) Franklin Wetlands: Restoring the Natural Capital
C2) Franklin Wetlands: Optimisation of Ecosystem Services
2. LOCALISED ECONOMY PROGRAMME
A) Review Existing Led Plan
B) Support for Green Economy
C) Kokstad Marketing Board
D) Community Based Micro-Utilities Services Enterprises-Feasibility Study
E) Agro-Processing Plant
F) Kokstad Community Sports Agency
G) Open Collaborative Manufacturing
H) Skills Development
I) Community Development Centres (Pilot at Mount Currie Community Centre)
J) Bhongweni Light Industrial Park
K) Youth for The Future
L) Eco-Industrial Park
M) Small Business Support Programme
N) Local Currency
O) Job Linkage Centre
3. GREEN BUILDING PROGRAMME
A1) Kokstad Green Building Materials: Business Network
A2) Kokstad Green Building Materials: Skills Development Initiative
B) Public Spaces & New Settlement Green Building Project
4. PUBLIC SPACE, STREET & FACILITY INVESTMENT PROGRAMME
A1) Neighbourhood Activity Nodes: Public Space Upgrade
A2) Neighbourhood Activity Nodes: Social Facilities Provision Plan
B1) Urban Area Upgrading: Main Street And Retail / Commercial Zones
B2) Urban Area Upgrading: Sustainable Streets Project
C) Public Transport
D) Creating New Road Linkages
E) Setting Up A Bicycle Empowerment Centre
5. SETTLEMENT RESPONSE PROGRAMME
A1) New Mixed Use Neighbourhoods: R56 Pilot Integrated Sustainable Settlement Project
A2) New Mixed Use Neighbourhoods: New IRDP
A3) New Mixed Use Neighbourhoods: Current Approved Projects or Projects In Planning
B1) Rental Housing Programme: Private Rental Developments
B2) Rental Housing Programme: Social Housing Project
B3) Rental Housing Programme: Community Residential Project
C) Urban Densification & Intensification
6. INTEGRATED WASTE MANAGEMENT PROGRAMME
A) Pilot Recycling Programme
B1) IWF: Materials Recovery Facility
B2) IWF: Waste Exchange Facility
B3) IWF: Regional Bio-Solids Processing Plant
B4) IWF: Regional Composting Plant
B5) IWF: Hazardous Waste Facility
C) Town-Wide Waste Characterisation
7. WATER CYCLE MANAGEMENT PROGRAMME
A) Suds Roll-Out & Subsidising Projects
B1) Waste Water Treatment: Sewage Pre-Treatment
B2) Waste Water Treatment: Constructed Wetland
B3) Waste Water Treatment: Treated Effluent Reuse
C) Water Efficiency Campaign
D) Fix Leaks In Shayamoya Township
8. ENERGY PROGRAMME
A) Energy Efficiency Retrofit Project (Green Economy)
B) Biomass Power Co-Generation
C) Solar Power (Roofs)
D) Solar Power (Farm)
E) Biogas Power Co-Generation
9. OPEN SPACE SERVICES PROGRAMME
A1) Green Heart Park: Design And Management
A2) Green Heart Park: Multi-Purpose Sports Complex
A3) Green Heart Park: Biodiversity Management Plan
B) Neighbourhood Park
/ Playground Upgrade
10. “FARMING FOR THE FUTURE” & SUSTAINABLE FOOD SYSTEM PROGRAMME
A) Agri-Enterprise Incubator Project
B) Neighbourhood Scale Nodes – Food System Aspect
C) “Farming For The Future” College
D) Local Produce Market
E) School Food Garden And Woodlot Project
F) “Smallholding For Resilience” Project
G) Allotment Project
H) Community Permaculture Research, Development & Training Farm
FINAL STRATEGY, DEVELOPMENT PLAN AND IMPLEMENTATION PLAN REPORT | NOVEMBER 2012
149CROSSROADS NATURAL RESOURCES AGRICULTUREINFRASTRUCTURETOWN
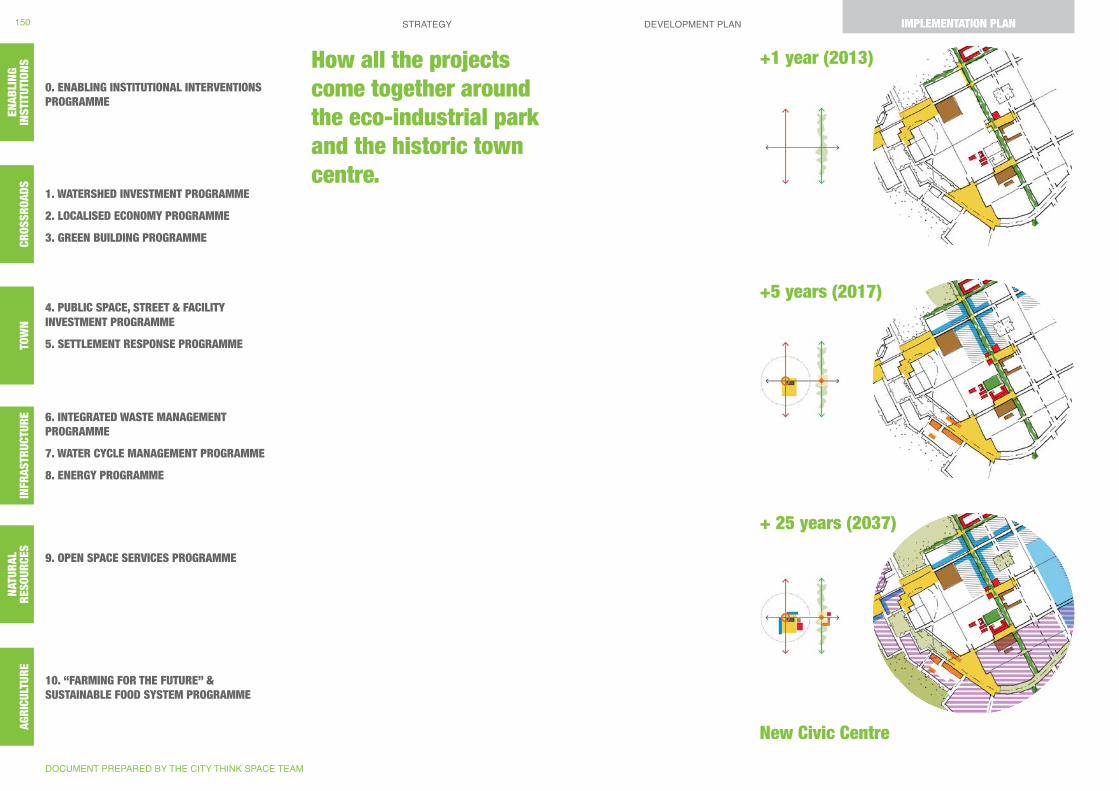
+1 year (2013)
+5 years (2017)
+ 25 years (2037)
New Civic Centre
How all the projects come together around the eco-industrial park and the historic town centre.
0. ENABLING INSTITUTIONAL INTERVENTIONS PROGRAMME
1. WATERSHED INVESTMENT PROGRAMME
2. LOCALISED ECONOMY PROGRAMME
3. GREEN BUILDING PROGRAMME
4. PUBLIC SPACE, STREET & FACILITY INVESTMENT PROGRAMME
5. SETTLEMENT RESPONSE PROGRAMME
6. INTEGRATED WASTE MANAGEMENT PROGRAMME
7. WATER CYCLE MANAGEMENT PROGRAMME
8. ENERGY PROGRAMME
9. OPEN SPACE SERVICES PROGRAMME
10. “FARMING FOR THE FUTURE” & SUSTAINABLE FOOD SYSTEM PROGRAMME
DOCUMENT PREPARED BY THE CITY THINK SPACE TEAM
STRATEGY DEVELOPMENT PLAN IMPLEMENTATION PLANAG
RIC
ULT
UR
EN
ATU
RAL
R
ESO
UR
CES
INFR
ASTR
UC
TUR
ETO
WN
CR
OSS
RO
ADS
ENAB
LIN
GIN
STIT
UTI
ON
S150
AGRI
CULT
URE
NATU
RAL
RESO
URCE
SIN
FRAS
TRUC
TURE
TOW
NCR
OSSR
OADS
ENAB
LING
IN
STIT
UTIO
NSIMPLEMENTATION PLAN
[4] PUBLIC SPACE, STREET & FACILITY INVESTMENT PROGRAMME (C) PUBLIC TRANSPORT PROJECT
[2] LOCALISED ECONOMY PROGRAMME (C) KOKSTAD MARKETING BOARD
[2] LOCALISED ECONOMY PROGRAMME (N) LOCAL CURRENCY
[5] SETTLEMENT RESPONSE PROGRAMME (A3) NEW MIXED USE NEIGHBOURHOODS: CURRENT APPROVED PROJECTS OR PROJECTS IN PLANNING
[4] PUBLIC SPACE, STREET & FACILITY INVESTMENT PROGRAMME B1) URBAN AREA UPGRADING: MAIN STREET AND RETAIL / COMMERCIAL ZONES
[4] PUBLIC SPACE, STREET & FACILITY INVESTMENT PROGRAMME (B2) URBAN AREA UPGRADING: SUSTAINABLE STREETS PROJECT
[7] WATER CYCLE MANAGEMENT PROGRAMME (B3) WASTE WATER TREATMENT: TREATED EFFLUENT RE-USE
[6] INTEGRATED WASTE PROGRAMME (A) PILOT RECYCLING PROJECT
[5] SETTLEMENT RESPONSE PROGRAMME (A1) NEW MIXED USE NEIGHBOURHOODS: R56 PILOT INTEGRATED SUSTAINABLE SETTLEMENT PROJECT
[5] SETTLEMENT RESPONSE PROGRAMME (B1) RENTAL HOUSING PROGRAMME: R56 PILOT INTEGRATED SUSTAINABLE SETTLEMENT PROJECT
[6] INTEGRATED WASTE PROGRAMME (B1) MRF: MATERIALS RECOVERY FACILITY (B2) MRF: WASTE EXCHANGE FACILITY (B5) MRF: HAZARDOUS WASTE FACILITY
[6] INTEGRATED WASTE PROGRAMME (B3) MRF: REGIONAL BIO-SOLIDS PROCESSING PLANT (B4) MRF: REGIONAL COMPOSTING PLANT
[2] ENERGY PROGRAMME (E) BIOGAS POWER CO-GENERATION
[2] WATERSHED INVESTMENT PROGRAMME (E) KOKSTAD TOURISM PROMOTION & CAPACITY BUILDING
[2] LOCALISED ECONOMY (B) SUPPORT FOR GREEN ECONOMY
[6] INTEGRATED WASTE PROGRAMME (C) TOWN-WIDE WASTE CHARACTERISATION
[7] WATER CYCLE MANAGEMENT PROGRAMME (B2) WASTE WATER TREATMENT: CONSTRUCTED WETLAND
[2] LOCALISED ECONOMY PROGRAMME (H) SKILLS DEVELOPMENT
[10] “FARMING FOR THE FUTURE” & SUSTAINABLE FOOD SYSTEM PROGRAMME (D) LOCAL PRODUCE MARKET
[3] GREEN BUILDING PROGRAMME (A1) KOKSTAD GREEN BUILDING MATERIALS: BUSINESS NETWORK
[8] ENERGY PROGRAMME (C) SOLAR POWER (ROOFS)
[2] LOCALISED ECONOMY PROGRAMME (L) ECO-INDUSTRIAL PARK
[8] ENERGY PROGRAMME (D) 10MW SOLAR ELECTRICITY FARM
[3] GREEN BUILDING PROGRAMME (A2) KOKSTAD GREEN BUILDING MATERIALS: SKILLS DEVELOPMENT INITIATIVE
[2] LOCALISED ECONOMY PROGRAMME (A) REVIEW EXISTING LED PLAN
KOKSTAD & FRANKLIN INTEGRATED SUSTAINABLE DEVELOPMENT PLAN
FINAL STRATEGY, DEVELOPMENT PLAN AND IMPLEMENTATION PLAN REPORT | NOVEMBER 2012
151
How all the projects come together around the park.
iThembalabantu neighbourhood activity node
+1 year (2013)
+5 years (2017)
+ 25 years (2037)
0. ENABLING INSTITUTIONAL INTERVENTIONS PROGRAMME
1. WATERSHED INVESTMENT PROGRAMME
2. LOCALISED ECONOMY PROGRAMME
3. GREEN BUILDING PROGRAMME
4. PUBLIC SPACE, STREET & FACILITY INVESTMENT PROGRAMME
5. SETTLEMENT RESPONSE PROGRAMME
6. INTEGRATED WASTE MANAGEMENT PROGRAMME
7. WATER CYCLE MANAGEMENT PROGRAMME
8. ENERGY PROGRAMME
9. OPEN SPACE SERVICES PROGRAMME
10. “FARMING FOR THE FUTURE” & SUSTAINABLE FOOD SYSTEM PROGRAMME
DOCUMENT PREPARED BY THE CITY THINK SPACE TEAM
STRATEGY DEVELOPMENT PLAN IMPLEMENTATION PLANAG
RIC
ULT
UR
EN
ATU
RAL
R
ESO
UR
CES
INFR
ASTR
UC
TUR
ETO
WN
CR
OSS
RO
ADS
ENAB
LIN
GIN
STIT
UTI
ON
S152
AGRI
CULT
URE
NATU
RAL
RESO
URCE
SIN
FRAS
TRUC
TURE
TOW
NCR
OSSR
OADS
ENAB
LING
IN
STIT
UTIO
NSIMPLEMENTATION PLAN
[2] LOCALISED ECONOMY PROGRAMME (K) YOUTH FOR THE FUTURE
[4] PUBLIC SPACE, STREETS & FACILITY INVESTMENT PROGRAMME (E) SETTING UP A BICYCLE EMPOWERMENT CENTRE
[2] LOCALISED ECONOMY PROGRAMME (J) BHONGWENI LIGHT INDUSTRIAL PARK
[2] LOCALISED ECONOMY PROGRAMME (I) COMMUNITY DEVELOPMENT CENTRES (PILOT AT MOUNT CURRIE COMMUNITY DEVELOPMENT CENTRE)
[2] LOCALISED ECONOMY PROGRAMME (E) AGRO-PROCESSING PLANT
[2] LOCALISED ECONOMY PROGRAMME (M) SMALL BUSINESS SUPPORT PROGRAMME
[7] WATER CYCLE MANAGEMENT PROGRAMME (D) FIX LEAKS IN SHAYAMOYA
[7] WATER CYCLE MANAGEMENT PROGRAMME (A) SUDS ROLL OUT AND SUBSIDISING PROJECT
[2] LOCALISED ECONOMY PROGRAMME (D) COMMUNITY BASED MICRO-UTILITIES ENTERPRISES
[10] “FARMING FOR THE FUTURE” & SUSTAINABLE FOOD SYSTEM PROGRAMME (H) COMMUNITY PERMACULTURE RESEARCH, DEVELOPMENT & TRAINING FARM
[10] “FARMING FOR THE FUTURE” & SUSTAINABLE FOOD SYSTEM PROGRAMME (E) SCHOOL FOOD GARDEN & WOODLOT PROJECT
[10] “FARMING FOR THE FUTURE” & SUSTAINABLE FOOD SYSTEM PROGRAMME (C) “FARMING FOR THE FUTURE” COLLEGE
[2] LOCALISED ECONOMY PROGRAMME (G) OPEN COLLABORATIVE MANUFACTURING
[2] LOCALISED ECONOMY PROGRAMME (F) KOKSTAD COMMUNITY SPORTS AGENCY
[9] OPEN SPACE SERVICES PROGRAMME (A2) GREEN HEART PARK: MULTI-PURPOSE SPORTS CENTRE
[9] OPEN SPACE SERVICES PROGRAMME (A1) GREEN HEART PARK: DESIGN & MANAGEMENT
[9] OPEN SPACE SERVICES PROGRAMME (B) NEIGHBOURHOOD PARK / PLAYGROUND UPGRADE
[9] OPEN SPACE SERVICES PROGRAMME (A3) GREEN HEART PARK: BIODIVERSITY MANAGEMENT PLAN
[5] SETTLEMENT RESPONSE PROGRAMME (A2) NEW MIXED USE NEIGHBOURHOODS: NEW IRDP
[5] SETTLEMENT RESPONSE PROGRAMME (B2) RENTAL HOUSING PROGRAMME:
SOCIAL HOUSING PROJECT
[4] PUBLIC SPACE, STREETS & FACILITY INVESTMENT PROGRAMME
(D) CREATING NEW ROAD LINKAGES
[5] SETTLEMENT RESPONSE PROGRAMME (B3) RENTAL HOUSING PROGRAMME: COMMUNITY RESIDENTIAL UNIT
[8] ENERGY PROGRAMME (A) ENERGY EFFICIENCY RETROFIT PROJECT
[3] GREEN BUILDING PROGRAMME (B) PUBLIC SPACES AND NEW SETTLEMENT GREEN BUILDING PROJECT
iThembalabantu neighbourhood activity node
KOKSTAD & FRANKLIN INTEGRATED SUSTAINABLE DEVELOPMENT PLAN
FINAL STRATEGY, DEVELOPMENT PLAN AND IMPLEMENTATION PLAN REPORT | NOVEMBER 2012
153
How all the projects come together around Franklin.
Railway-station heritage centre
+1 year (2013)
+5 years (2017)
+ 25 years (2037)
0. ENABLING INSTITUTIONAL INTERVENTIONS PROGRAMME
1. WATERSHED INVESTMENT PROGRAMME
2. LOCALISED ECONOMY PROGRAMME
3. GREEN BUILDING PROGRAMME
4. PUBLIC SPACE, STREET & FACILITY INVESTMENT PROGRAMME
5. SETTLEMENT RESPONSE PROGRAMME
6. INTEGRATED WASTE MANAGEMENT PROGRAMME
7. WATER CYCLE MANAGEMENT PROGRAMME
8. ENERGY PROGRAMME
9. OPEN SPACE SERVICES PROGRAMME
10. “FARMING FOR THE FUTURE” & SUSTAINABLE FOOD SYSTEM PROGRAMME
DOCUMENT PREPARED BY THE CITY THINK SPACE TEAM
STRATEGY DEVELOPMENT PLAN IMPLEMENTATION PLANAG
RIC
ULT
UR
EN
ATU
RAL
R
ESO
UR
CES
INFR
ASTR
UC
TUR
ETO
WN
CR
OSS
RO
ADS
ENAB
LIN
GIN
STIT
UTI
ON
S154
AGRI
CULT
URE
NATU
RAL
RESO
URCE
SIN
FRAS
TRUC
TURE
TOW
NCR
OSSR
OADS
ENAB
LING
IN
STIT
UTIO
NSIMPLEMENTATION PLAN
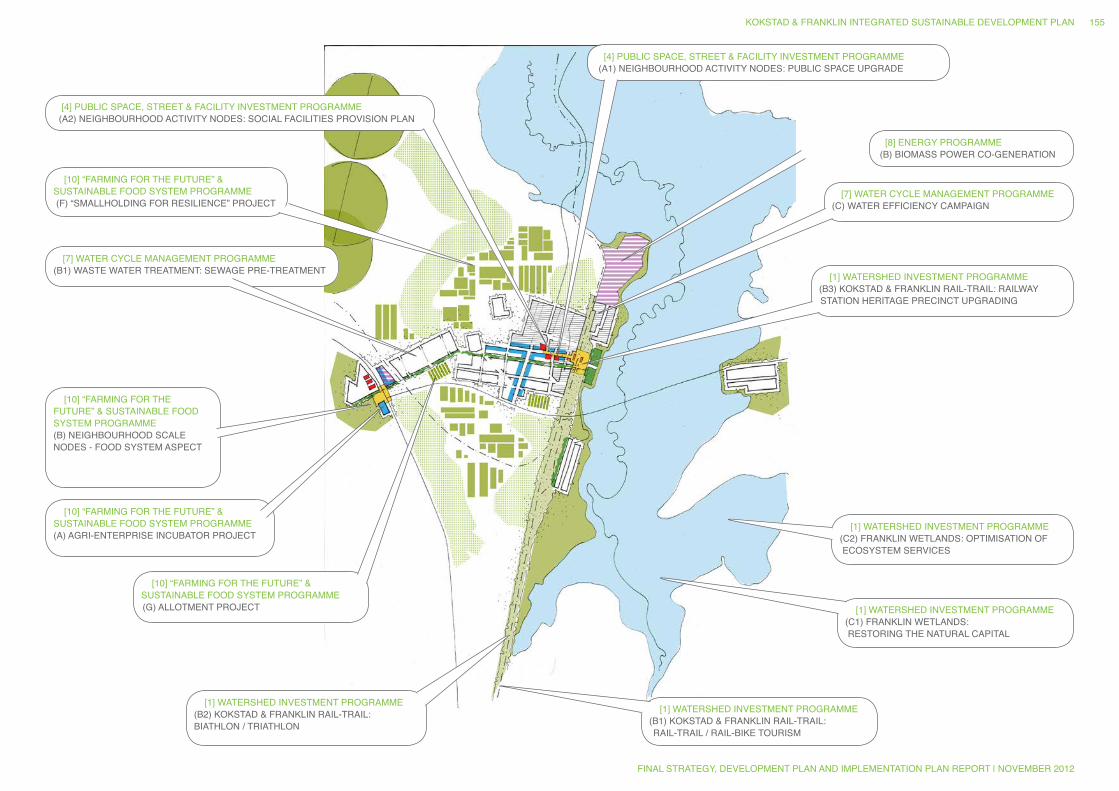
[10] “FARMING FOR THE FUTURE” & SUSTAINABLE FOOD SYSTEM PROGRAMME (F) “SMALLHOLDING FOR RESILIENCE” PROJECT
[10] “FARMING FOR THE FUTURE” & SUSTAINABLE FOOD SYSTEM PROGRAMME (G) ALLOTMENT PROJECT
[10] “FARMING FOR THE FUTURE” & SUSTAINABLE FOOD SYSTEM PROGRAMME (B) NEIGHBOURHOOD SCALE NODES - FOOD SYSTEM ASPECT
[10] “FARMING FOR THE FUTURE” & SUSTAINABLE FOOD SYSTEM PROGRAMME (A) AGRI-ENTERPRISE INCUBATOR PROJECT
[7] WATER CYCLE MANAGEMENT PROGRAMME (B1) WASTE WATER TREATMENT: SEWAGE PRE-TREATMENT
[7] WATER CYCLE MANAGEMENT PROGRAMME (C) WATER EFFICIENCY CAMPAIGN
[1] WATERSHED INVESTMENT PROGRAMME (B1) KOKSTAD & FRANKLIN RAIL-TRAIL: RAIL-TRAIL / RAIL-BIKE TOURISM
[1] WATERSHED INVESTMENT PROGRAMME (C1) FRANKLIN WETLANDS: RESTORING THE NATURAL CAPITAL
[1] WATERSHED INVESTMENT PROGRAMME (C2) FRANKLIN WETLANDS: OPTIMISATION OF ECOSYSTEM SERVICES
[1] WATERSHED INVESTMENT PROGRAMME (B3) KOKSTAD & FRANKLIN RAIL-TRAIL: RAILWAY STATION HERITAGE PRECINCT UPGRADING
[1] WATERSHED INVESTMENT PROGRAMME (B2) KOKSTAD & FRANKLIN RAIL-TRAIL: BIATHLON / TRIATHLON
[8] ENERGY PROGRAMME (B) BIOMASS POWER CO-GENERATION
[4] PUBLIC SPACE, STREET & FACILITY INVESTMENT PROGRAMME (A2) NEIGHBOURHOOD ACTIVITY NODES: SOCIAL FACILITIES PROVISION PLAN
[4] PUBLIC SPACE, STREET & FACILITY INVESTMENT PROGRAMME (A1) NEIGHBOURHOOD ACTIVITY NODES: PUBLIC SPACE UPGRADE
KOKSTAD & FRANKLIN INTEGRATED SUSTAINABLE DEVELOPMENT PLAN
FINAL STRATEGY, DEVELOPMENT PLAN AND IMPLEMENTATION PLAN REPORT | NOVEMBER 2012
155
MONITORING & EVALUATION
CONCLUSION
PART III THE WAY FORWARD
DOCUMENT PREPARED BY THE CITY THINK SPACE TEAM
KOKSTAD & FRANKLIN INTEGRATED SUSTAINABLE DEVELOPMENT PLAN156
11. MONITORING & EVALUATIONA monitoring and evaluation plan is a key component of successfully implementing a projects, plans and programmes.
Monitoring can improve cross-departmental communication. A key hurdle to implementing integrated plans is the tendency to work in silos. This may result in possible reluctance to sharing information. An internal communication effort that describes the common good goals of monitoring in combination with cross-sector indicators can induce departments to be more open towards information sharing.
Evaluation informs leaders on what policies have had an impact and what resources might be needed. An evaluation needs to be well linked to both planning and budgeting to be meaningful; it allows plans to be responsive because it allows for decisions to be made about plans if an evaluation suggests expanding or redesigning them (adapted from UN Habitat, 2012).
11.1. MONITORING & REPORTING APPROACH Monitoring of the ISDP will be closely aligned to the monitoring of the GKM’s IDP. It will involve the preparation of an annual report called “Kokstad’s Annual Sustainability Report”, which will be compiled by the Strategic Planning and Intergovernmental Relations Office and will focus on performance against the indicators listed below.
It will complement the report on its IDP. It will use information drawn from the number of sources including secondary data but will also require the implementation of a specially constructed Sustainability Survey (See below).
The survey will be implemented by the Green Ambassadors and will comprise both quantitative data collection as well as the preparation of short movie clips. Actual data collection will also involve GKM Councillors and Officials. The Annual Progress Report will be prepared over a three month period each year, from (month) to (month) and will be a key input to the municipality’s strategic planning process which takes place in (month).
11.2. EVALUATION APPROACH An evaluation is to be undertaken of the GKM’s implementation of the ISDP every fifth year. It will have two components; the first will be a technical exercise that review changes in the situation from that described in the Status Quo report prepared for the ISDP, the second component will be an integrated systematic report on a series of focus group interviews asking the question whether each of the intended outcomes described in the ISDP is being achieved and what has changed in the last few years.
The evaluation will be put out on tender to two separate service providers - each of the two reports will contain a brief set of recommendations that clearly indicate who should do what by when and what the implementation of the recommendation will cost. The two evaluation processes will be undertaken simultaneously and will be managed by the Strategic Planning and IGR (SP&IGR) office. Provision for the cost of the evaluation must be included in the GKM budget for the respective years.
11.3. CAPACITY CONSIDERATIONS In order to implement this M&E approach, fieldwork, analysis and knowledge management capacity is needed in the GKM. This should meet the needs of both the ISDP and the IDP. The Office currently lacks this capacity - an additional post will be created in the SP&IGR office at level [-] to play the convening and co-ordinating role in this regard.
11.4. THE SUSTAINABILITY SURVEY In order to implement this strategy, a Sustainability Survey will be developed that will enable the collection of the information required to report on progress against the indicators contained below. This survey will be implemented in four sites that will be selected as part of the implementation of the overall strategy.
The four sites will be chosen for their ability to represent Kokstad and to act as sentinel sites showing changes and trends in the ongoing
development of Kokstad and its implementation of the ISDP over the long term.
The data collection will be undertaken by Green Ambassadors working with officials and Councillors. The Survey will be reported upon in the Sustainability Survey.
11.5. THE GREEN AMBASSADORSAWARENESS RAISING
The Green Ambassadors remain under the EPWP stipend until the end of January 2013. Their work over the following three months (Nov, Dec and Jan) will include showing their “seeds of sustainability” movies across the different wards, as a way of introducing citizens to the content of the DEVELOPMENT PLAN. They will also be making a few more movies, some exploring “Christmas in Kokstad” and others documenting “Conversations with Elders” where they will find out how their elders have dealt with hardship in the past, as an introduction to thinking about resilience, one of the key guiding principles in the ISDP.
MONITORING AND EVALUATION BASELINE
One of the key dimensions to the Monitoring and Evaluation Plan is that the implementation of a baseline Sustainability Survey. It is intended that the GAs work closely with the ward councilors in conducting the baseline survey. Further funding will be required for this process.
MICRO-ENTERPRISE DEVELOPMENT
One idea under consideration that still requires further workshopping by all stakeholders, is that Yondlabantu and Scientific Roets be viewed as temporary “caretakers” of the training equipment until such time as a youth owned and managed structure be set up, where the training equipment could form part of the ‘seed’ capital for this microenterprise. The microenterprise would be generating sustainability-focused citizen journalism, in support of Kokstad’s long-term sustainable development. It is intended that this youth owned entity would create sustainable employment for some of the Green
Ambassadors, in alignment with the guiding principles of the ISDP.
This entity would also provide value to the GKM by being ambassadors of the ISDP into the future, as well as through playing a key role in monitoring and evaluation of the ISDP (as described above), creating video and photographic content and providing community liaison.
11.6. INDICATORS FOR MONITORING & REPORTING PURPOSES Indicators are the quantitative or qualitative variables that provide a valid and reliable way to measure achievement, assess performance, or reflect changes connected to a series of interventions.
Indicators relate to both how the plan is being implemented and its impact. Basic indicators measure plan delivery, including land used, the number of building permits, resources invested, and the amount of infrastructure delivered. The outcomes of the plan can be measured by indicators such as density, mix of uses, the amount of land used for private and public uses, traffic conditions and taxes generated.
Obtaining baseline information is a challenge - many indicators, such as economic productivity and gross product are readily available at the national level, but not at the city/town level. This further reinforces the need to be prudent in selecting the number of indicators. A limited number of indicators works better. It is better to set a limited number of indicators that can be realistically measured and easily understood (UN Habitat, 2012).
Accordingly, a list of thirty indicators, grouped per story, have been formulated for the ISDP. Their respective data sources (for efficiency, often overlapping) are stated in the left-hand column, and the desired outcome is stated on the right. Together, these should form a base for monitoring and evaluating Kokstad and Franklin into the future.
FINAL STRATEGY, DEVELOPMENT PLAN AND IMPLEMENTATION PLAN REPORT | NOVEMBER 2012
157
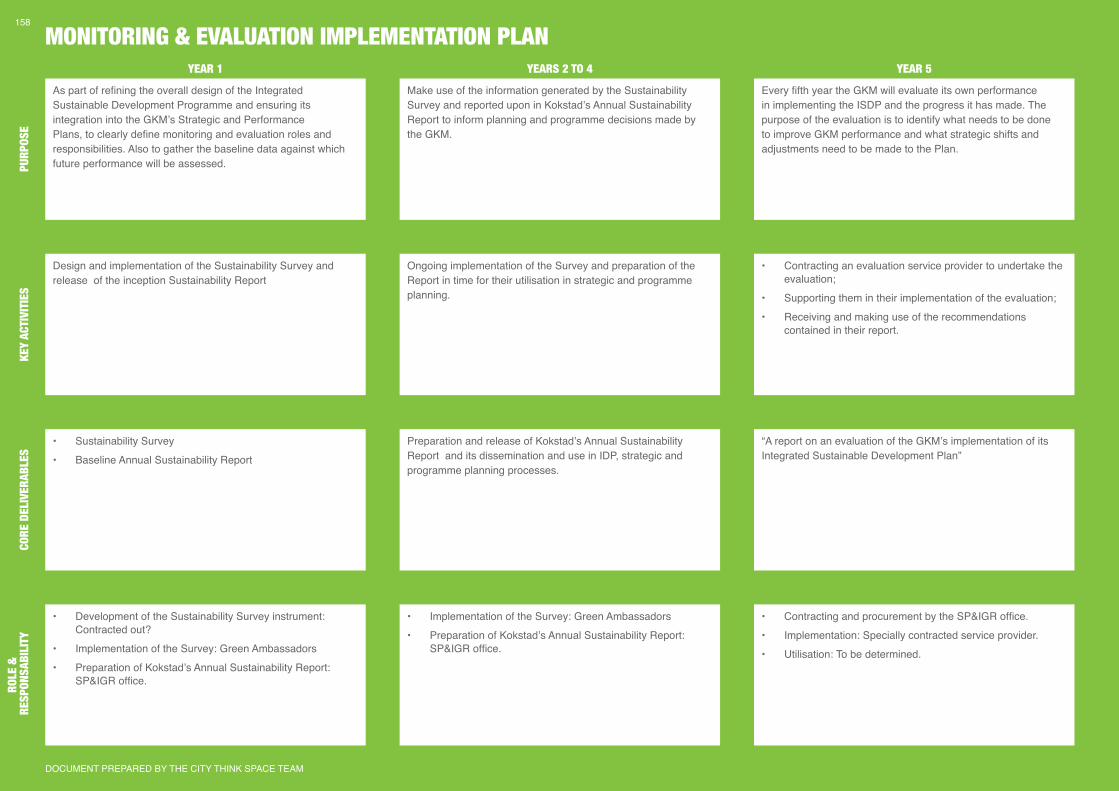
MONITORING & EVALUATION IMPLEMENTATION PLAN
As part of refining the overall design of the Integrated Sustainable Development Programme and ensuring its integration into the GKM’s Strategic and Performance Plans, to clearly define monitoring and evaluation roles and responsibilities. Also to gather the baseline data against which future performance will be assessed.
Design and implementation of the Sustainability Survey and release of the inception Sustainability Report
• Sustainability Survey • Baseline Annual Sustainability Report
• Development of the Sustainability Survey instrument: Contracted out?
• Implementation of the Survey: Green Ambassadors • Preparation of Kokstad’s Annual Sustainability Report:
SP&IGR office.
Make use of the information generated by the Sustainability Survey and reported upon in Kokstad’s Annual Sustainability Report to inform planning and programme decisions made by the GKM.
Ongoing implementation of the Survey and preparation of the Report in time for their utilisation in strategic and programme planning.
Preparation and release of Kokstad’s Annual Sustainability Report and its dissemination and use in IDP, strategic and programme planning processes.
• Implementation of the Survey: Green Ambassadors • Preparation of Kokstad’s Annual Sustainability Report:
SP&IGR office.
Every fifth year the GKM will evaluate its own performance in implementing the ISDP and the progress it has made. The purpose of the evaluation is to identify what needs to be done to improve GKM performance and what strategic shifts and adjustments need to be made to the Plan.
• Contracting an evaluation service provider to undertake the evaluation;
• Supporting them in their implementation of the evaluation; • Receiving and making use of the recommendations
contained in their report.
“A report on an evaluation of the GKM’s implementation of its Integrated Sustainable Development Plan”
• Contracting and procurement by the SP&IGR office. • Implementation: Specially contracted service provider. • Utilisation: To be determined.
ROLE
&
RES
PONS
ABIL
ITY
CORE
DEL
IVER
ABLE
S
KEY
ACTI
VITI
ES
PURP
OSE
YEAR 1 YEARS 2 TO 4
YEAR 5
DOCUMENT PREPARED BY THE CITY THINK SPACE TEAM
158
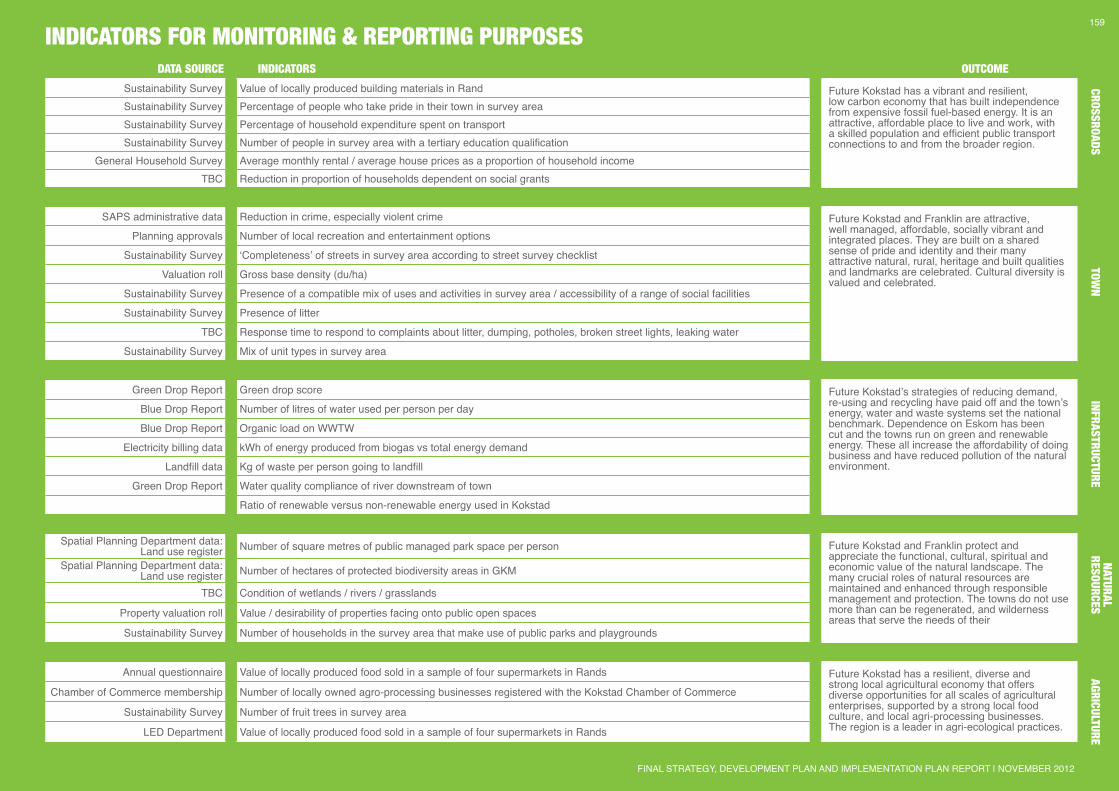
INDICATORS FOR MONITORING & REPORTING PURPOSESDATA SOURCE INDICATORS
OUTCOME
Sustainability Survey Value of locally produced building materials in Rand Future Kokstad has a vibrant and resilient, low carbon economy that has built independence from expensive fossil fuel-based energy. It is an attractive, affordable place to live and work, with a skilled population and efficient public transport connections to and from the broader region.
Sustainability Survey Percentage of people who take pride in their town in survey areaSustainability Survey Percentage of household expenditure spent on transport Sustainability Survey Number of people in survey area with a tertiary education qualification
General Household Survey Average monthly rental / average house prices as a proportion of household incomeTBC Reduction in proportion of households dependent on social grants
SAPS administrative data Reduction in crime, especially violent crime Future Kokstad and Franklin are attractive, well managed, affordable, socially vibrant and integrated places. They are built on a shared sense of pride and identity and their many attractive natural, rural, heritage and built qualities and landmarks are celebrated. Cultural diversity is valued and celebrated.
Planning approvals Number of local recreation and entertainment options
Sustainability Survey ‘Completeness’ of streets in survey area according to street survey checklist
Valuation roll Gross base density (du/ha)
Sustainability Survey Presence of a compatible mix of uses and activities in survey area / accessibility of a range of social facilities
Sustainability Survey Presence of litter
TBC Response time to respond to complaints about litter, dumping, potholes, broken street lights, leaking water
Sustainability Survey Mix of unit types in survey area
Green Drop Report Green drop score Future Kokstad’s strategies of reducing demand, re-using and recycling have paid off and the town’s energy, water and waste systems set the national benchmark. Dependence on Eskom has been cut and the towns run on green and renewable energy. These all increase the affordability of doing business and have reduced pollution of the natural environment.
Blue Drop Report Number of litres of water used per person per day
Blue Drop Report Organic load on WWTW
Electricity billing data kWh of energy produced from biogas vs total energy demand
Landfill data Kg of waste per person going to landfill
Green Drop Report Water quality compliance of river downstream of town
Ratio of renewable versus non-renewable energy used in Kokstad
Spatial Planning Department data: Land use register Number of square metres of public managed park space per person Future Kokstad and Franklin protect and
appreciate the functional, cultural, spiritual and economic value of the natural landscape. The many crucial roles of natural resources are maintained and enhanced through responsible management and protection. The towns do not use more than can be regenerated, and wilderness areas that serve the needs of their
Spatial Planning Department data: Land use register Number of hectares of protected biodiversity areas in GKM
TBC Condition of wetlands / rivers / grasslands
Property valuation roll Value / desirability of properties facing onto public open spaces
Sustainability Survey Number of households in the survey area that make use of public parks and playgrounds
Annual questionnaire Value of locally produced food sold in a sample of four supermarkets in Rands Future Kokstad has a resilient, diverse and strong local agricultural economy that offers diverse opportunities for all scales of agricultural enterprises, supported by a strong local food culture, and local agri-processing businesses. The region is a leader in agri-ecological practices.
Chamber of Commerce membership Number of locally owned agro-processing businesses registered with the Kokstad Chamber of Commerce
Sustainability Survey Number of fruit trees in survey area
LED Department Value of locally produced food sold in a sample of four supermarkets in Rands
FINAL STRATEGY, DEVELOPMENT PLAN AND IMPLEMENTATION PLAN REPORT | NOVEMBER 2012
159AGRICULTURE
NATURAL RESOURCES
INFRASTRUCTURETOW
NCROSSROADS
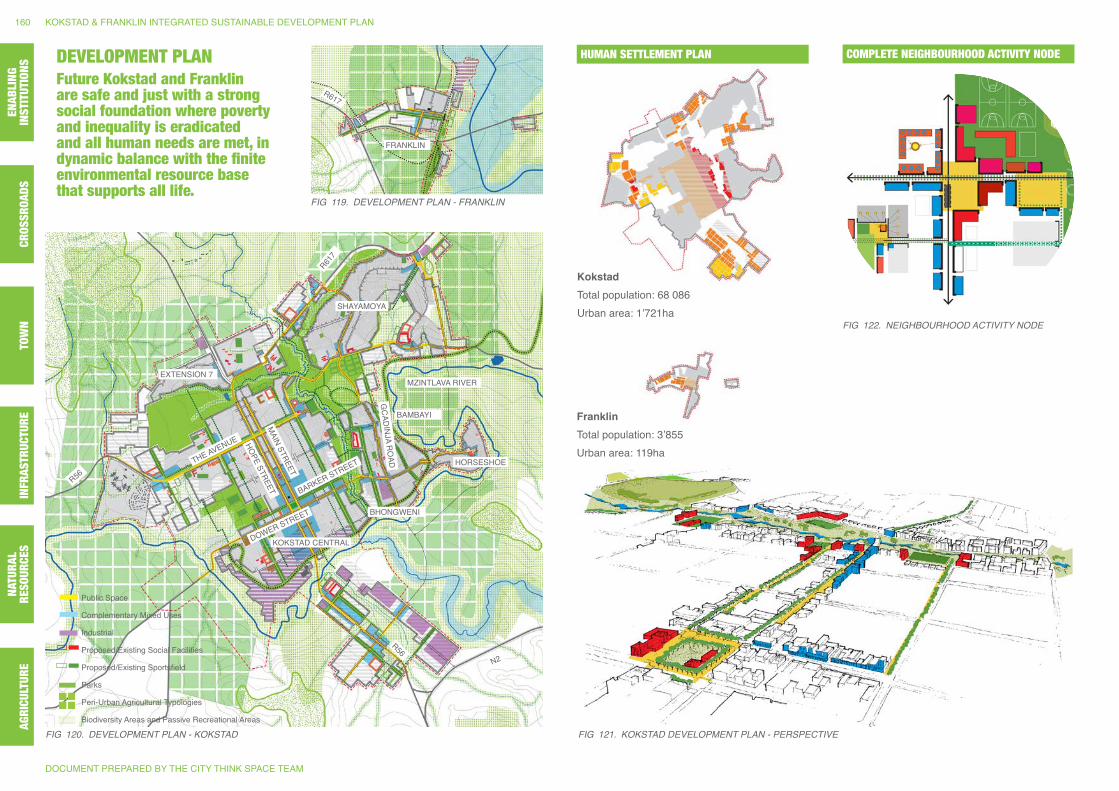
KOKSTAD CENTRAL
THE AVENUE
MAIN STREET
GCADINJA RO
AD
BARKER STREET
HOPE STREET
DOWER STREET
SHAYAMOYA
EXTENSION 7
BAMBAYI
HORSESHOE
BHONGWENI
R56
R617
R617
R56N2
MZINTLAVA RIVER
FRANKLIN
Proposed/Existing Social Facilities
Proposed/Existing Sportsfield
Complementary Mixed Uses
Industrial
Parks
Biodiversity Areas and Passive Recreational Areas
Peri-Urban Agricultural Typologies
Public Space
DEVELOPMENT PLANFuture Kokstad and Franklin are safe and just with a strong social foundation where poverty and inequality is eradicated and all human needs are met, in dynamic balance with the finite environmental resource base that supports all life.
Fig 119. DEVELOPMENT PLAN - FRANKLiN
COMPLETE NEIGHBOURHOOD ACTIVITY NODEHUMAN SETTLEMENT PLAN
Fig 120. DEVELOPMENT PLAN - KOKSTAD Fig 121. KOKSTAD DEVELOPMENT PLAN - PERSPECTiVE
Fig 122. NEigHBOURHOOD ACTiViTY NODE
KokstadTotal population: 68 086Urban area: 1’721ha
FranklinTotal population: 3’855Urban area: 119ha
DOCUMENT PREPARED BY THE CITY THINK SPACE TEAM
KOKSTAD & FRANKLIN INTEGRATED SUSTAINABLE DEVELOPMENT PLAN160AG
RICU
LTUR
ENA
TURA
L RE
SOUR
CES
INFR
ASTR
UCTU
RETO
WN
CROS
SROA
DSEN
ABLI
NG
INST
ITUT
IONS
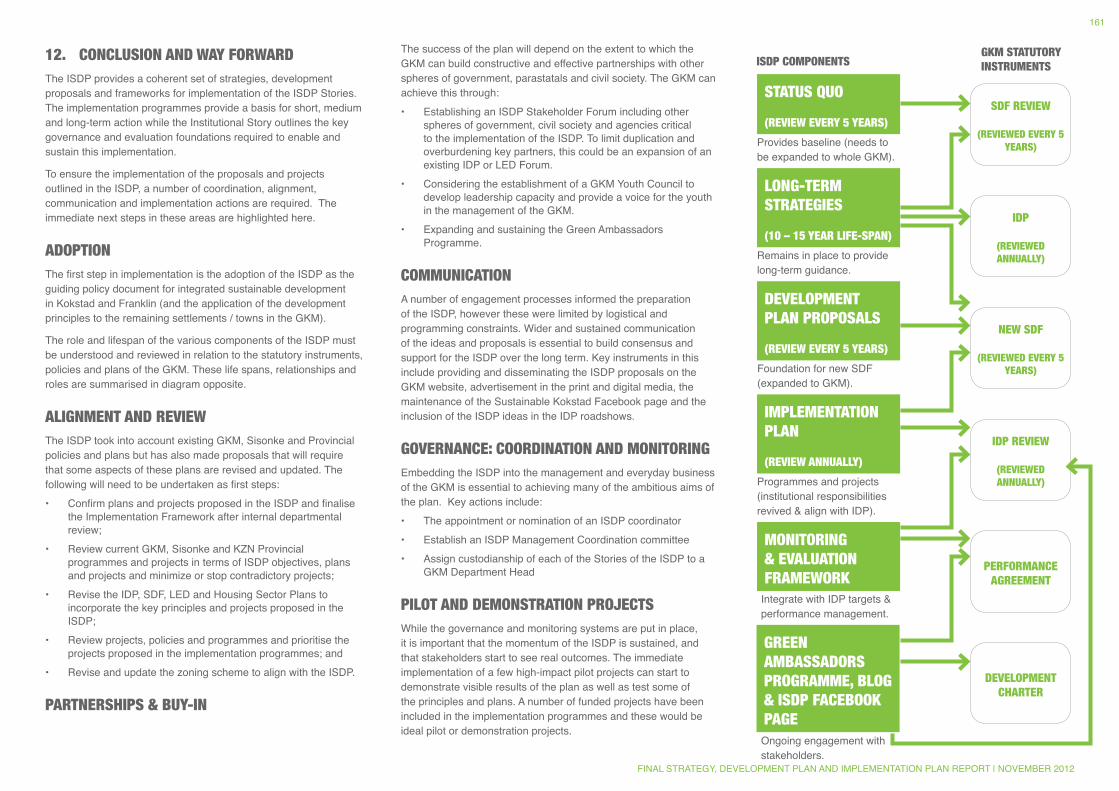
12. CONCLUSION AND WAY FORWARDThe ISDP provides a coherent set of strategies, development proposals and frameworks for implementation of the ISDP Stories. The implementation programmes provide a basis for short, medium and long-term action while the Institutional Story outlines the key governance and evaluation foundations required to enable and sustain this implementation.
To ensure the implementation of the proposals and projects outlined in the ISDP, a number of coordination, alignment, communication and implementation actions are required. The immediate next steps in these areas are highlighted here.
ADOPTIONThe first step in implementation is the adoption of the ISDP as the guiding policy document for integrated sustainable development in Kokstad and Franklin (and the application of the development principles to the remaining settlements / towns in the GKM).
The role and lifespan of the various components of the ISDP must be understood and reviewed in relation to the statutory instruments, policies and plans of the GKM. These life spans, relationships and roles are summarised in diagram opposite.
ALIGNMENT AND REVIEWThe ISDP took into account existing GKM, Sisonke and Provincial policies and plans but has also made proposals that will require that some aspects of these plans are revised and updated. The following will need to be undertaken as first steps: • Confirm plans and projects proposed in the ISDP and finalise
the Implementation Framework after internal departmental review;
• Review current GKM, Sisonke and KZN Provincial programmes and projects in terms of ISDP objectives, plans and projects and minimize or stop contradictory projects;
• Revise the IDP, SDF, LED and Housing Sector Plans to incorporate the key principles and projects proposed in the ISDP;
• Review projects, policies and programmes and prioritise the projects proposed in the implementation programmes; and
• Revise and update the zoning scheme to align with the ISDP.
PARTNERSHIPS & BUY-IN
The success of the plan will depend on the extent to which the GKM can build constructive and effective partnerships with other spheres of government, parastatals and civil society. The GKM can achieve this through:• Establishing an ISDP Stakeholder Forum including other
spheres of government, civil society and agencies critical to the implementation of the ISDP. To limit duplication and overburdening key partners, this could be an expansion of an existing IDP or LED Forum.
• Considering the establishment of a GKM Youth Council to develop leadership capacity and provide a voice for the youth in the management of the GKM.
• Expanding and sustaining the Green Ambassadors Programme.
COMMUNICATIONA number of engagement processes informed the preparation of the ISDP, however these were limited by logistical and programming constraints. Wider and sustained communication of the ideas and proposals is essential to build consensus and support for the ISDP over the long term. Key instruments in this include providing and disseminating the ISDP proposals on the GKM website, advertisement in the print and digital media, the maintenance of the Sustainable Kokstad Facebook page and the inclusion of the ISDP ideas in the IDP roadshows.
GOVERNANCE: COORDINATION AND MONITORINGEmbedding the ISDP into the management and everyday business of the GKM is essential to achieving many of the ambitious aims of the plan. Key actions include:• The appointment or nomination of an ISDP coordinator• Establish an ISDP Management Coordination committee• Assign custodianship of each of the Stories of the ISDP to a
GKM Department Head
PILOT AND DEMONSTRATION PROJECTS While the governance and monitoring systems are put in place, it is important that the momentum of the ISDP is sustained, and that stakeholders start to see real outcomes. The immediate implementation of a few high-impact pilot projects can start to demonstrate visible results of the plan as well as test some of the principles and plans. A number of funded projects have been included in the implementation programmes and these would be ideal pilot or demonstration projects.
FINAL STRATEGY, DEVELOPMENT PLAN AND IMPLEMENTATION PLAN REPORT | NOVEMBER 2012
161
SDF REVIEW
(REVIEWED EVERY 5 YEARS)
IDP
(REVIEWED ANNUALLY)
NEW SDF
(REVIEWED EVERY 5 YEARS)
IDP REVIEW
(REVIEWED ANNUALLY)
PERFORMANCE AGREEMENT
DEVELOPMENT CHARTER
STATUS QUO
(REVIEW EVERY 5 YEARS)
ISDP COMPONENTSGKM STATUTORY INSTRUMENTS
LONG-TERM STRATEGIES
(10 – 15 YEAR LIFE-SPAN)
DEVELOPMENT PLAN PROPOSALS
(REVIEW EVERY 5 YEARS)
IMPLEMENTATION PLAN
(REVIEW ANNUALLY)
MONITORING & EVALUATION FRAMEWORK
GREEN AMBASSADORS PROGRAMME, BLOG & ISDP FACEBOOK PAGE
Provides baseline (needs to be expanded to whole GKM).
Remains in place to provide long-term guidance.
Foundation for new SDF (expanded to GKM).
Programmes and projects (institutional responsibilities revived & align with IDP).
Integrate with IDP targets & performance management.
Ongoing engagement with stakeholders.
ANNEXURES
APPENDICIES
PART IV ANNEXURES & APPENDICES
DOCUMENT PREPARED BY THE CITY THINK SPACE TEAM
KOKSTAD & FRANKLIN INTEGRATED SUSTAINABLE DEVELOPMENT PLAN162
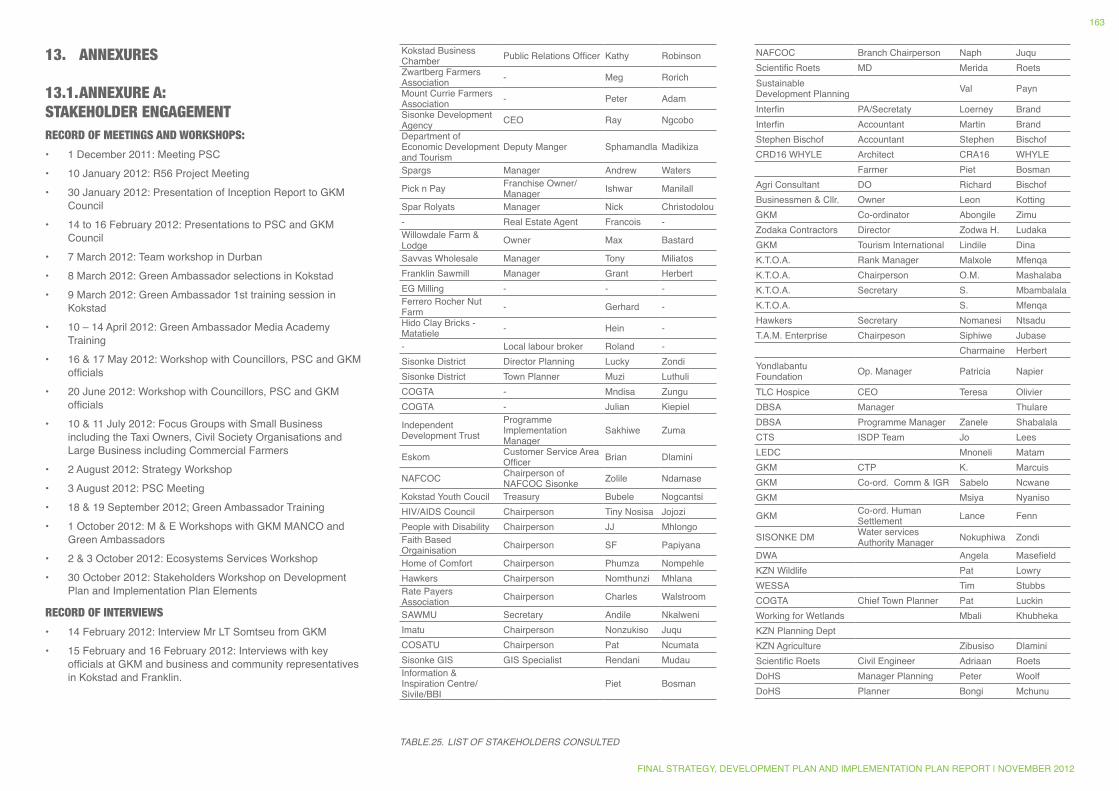
13. ANNEXURES
13.1. ANNEXURE A: STAKEHOLDER ENGAGEMENTRECORD OF MEETINGS AND WORKSHOPS:
• 1 December 2011: Meeting PSC• 10 January 2012: R56 Project Meeting• 30 January 2012: Presentation of Inception Report to GKM
Council• 14 to 16 February 2012: Presentations to PSC and GKM
Council • 7 March 2012: Team workshop in Durban• 8 March 2012: Green Ambassador selections in Kokstad• 9 March 2012: Green Ambassador 1st training session in
Kokstad• 10 – 14 April 2012: Green Ambassador Media Academy
Training• 16 & 17 May 2012: Workshop with Councillors, PSC and GKM
officials• 20 June 2012: Workshop with Councillors, PSC and GKM
officials• 10 & 11 July 2012: Focus Groups with Small Business
including the Taxi Owners, Civil Society Organisations and Large Business including Commercial Farmers
• 2 August 2012: Strategy Workshop• 3 August 2012: PSC Meeting • 18 & 19 September 2012; Green Ambassador Training• 1 October 2012: M & E Workshops with GKM MANCO and
Green Ambassadors• 2 & 3 October 2012: Ecosystems Services Workshop• 30 October 2012: Stakeholders Workshop on Development
Plan and Implementation Plan Elements
RECORD OF INTERVIEWS
• 14 February 2012: Interview Mr LT Somtseu from GKM• 15 February and 16 February 2012: Interviews with key
officials at GKM and business and community representatives in Kokstad and Franklin.
Kokstad Business Chamber Public Relations Officer Kathy RobinsonZwartberg Farmers Association - Meg RorichMount Currie Farmers Association - Peter AdamSisonke Development Agency CEO Ray NgcoboDepartment of Economic Development and Tourism
Deputy Manger Sphamandla Madikiza
Spargs Manager Andrew Waters
Pick n Pay Franchise Owner/ Manager Ishwar Manilall
Spar Rolyats Manager Nick Christodolou- Real Estate Agent Francois -Willowdale Farm & Lodge Owner Max Bastard
Savvas Wholesale Manager Tony Miliatos Franklin Sawmill Manager Grant HerbertEG Milling - - -Ferrero Rocher Nut Farm - Gerhard -Hido Clay Bricks - Matatiele - Hein -
- Local labour broker Roland -Sisonke District Director Planning Lucky ZondiSisonke District Town Planner Muzi LuthuliCOGTA - Mndisa ZunguCOGTA - Julian Kiepiel
Independent Development Trust
Programme Implementation Manager
Sakhiwe Zuma
Eskom Customer Service Area Officer Brian Dlamini
NAFCOC Chairperson of NAFCOC Sisonke Zolile Ndamase
Kokstad Youth Coucil Treasury Bubele NogcantsiHIV/AIDS Council Chairperson Tiny Nosisa JojoziPeople with Disability Chairperson JJ MhlongoFaith Based Orgainisation Chairperson SF Papiyana
Home of Comfort Chairperson Phumza NompehleHawkers Chairperson Nomthunzi MhlanaRate Payers Association Chairperson Charles Walstroom
SAWMU Secretary Andile NkalweniImatu Chairperson Nonzukiso JuquCOSATU Chairperson Pat NcumataSisonke GIS GIS Specialist Rendani MudauInformation & Inspiration Centre/Sivile/BBI
Piet Bosman
NAFCOC Branch Chairperson Naph JuquScientific Roets MD Merida RoetsSustainable Development Planning Val Payn
Interfin PA/Secretaty Loerney BrandInterfin Accountant Martin BrandStephen Bischof Accountant Stephen BischofCRD16 WHYLE Architect CRA16 WHYLE Farmer Piet BosmanAgri Consultant DO Richard BischofBusinessmen & Cllr. Owner Leon KottingGKM Co-ordinator Abongile ZimuZodaka Contractors Director Zodwa H. LudakaGKM Tourism International Lindile DinaK.T.O.A. Rank Manager Malxole MfenqaK.T.O.A. Chairperson O.M. MashalabaK.T.O.A. Secretary S. MbambalalaK.T.O.A. S. MfenqaHawkers Secretary Nomanesi NtsaduT.A.M. Enterprise Chairpeson Siphiwe Jubase Charmaine HerbertYondlabantu Foundation Op. Manager Patricia Napier
TLC Hospice CEO Teresa OlivierDBSA Manager ThulareDBSA Programme Manager Zanele ShabalalaCTS ISDP Team Jo LeesLEDC Mnoneli MatamGKM CTP K. MarcuisGKM Co-ord. Comm & IGR Sabelo NcwaneGKM Msiya Nyaniso
GKM Co-ord. Human Settlement Lance Fenn
SISONKE DM Water services Authority Manager Nokuphiwa Zondi
DWA Angela MasefieldKZN Wildlife Pat LowryWESSA Tim StubbsCOGTA Chief Town Planner Pat LuckinWorking for Wetlands Mbali KhubhekaKZN Planning Dept KZN Agriculture Zibusiso DlaminiScientific Roets Civil Engineer Adriaan RoetsDoHS Manager Planning Peter WoolfDoHS Planner Bongi Mchunu
TABLE.25. LiST OF STAKEHOLDERS CONSULTED
FINAL STRATEGY, DEVELOPMENT PLAN AND IMPLEMENTATION PLAN REPORT | NOVEMBER 2012
163
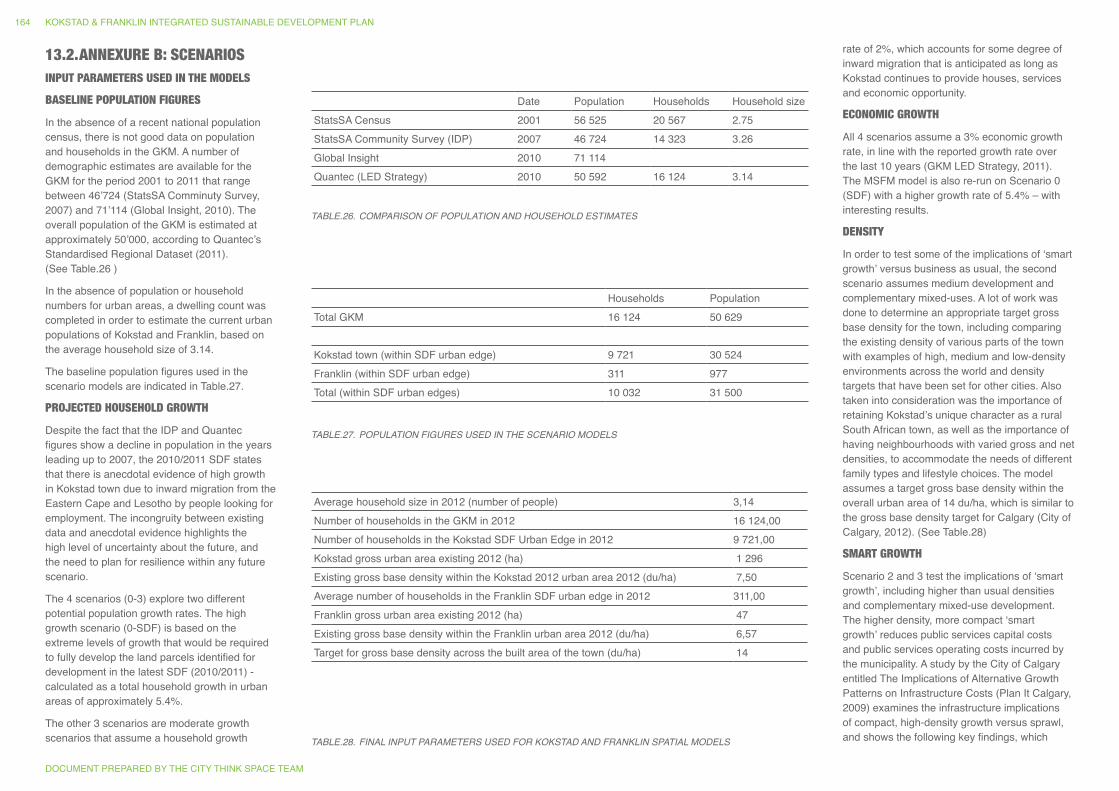
Households PopulationTotal GKM 16 124 50 629 Kokstad town (within SDF urban edge) 9 721 30 524Franklin (within SDF urban edge) 311 977Total (within SDF urban edges) 10 032 31 500
rate of 2%, which accounts for some degree of inward migration that is anticipated as long as Kokstad continues to provide houses, services and economic opportunity.
ECONOMIC GROWTH
All 4 scenarios assume a 3% economic growth rate, in line with the reported growth rate over the last 10 years (GKM LED Strategy, 2011). The MSFM model is also re-run on Scenario 0 (SDF) with a higher growth rate of 5.4% – with interesting results.
DENSITY
In order to test some of the implications of ‘smart growth’ versus business as usual, the second scenario assumes medium development and complementary mixed-uses. A lot of work was done to determine an appropriate target gross base density for the town, including comparing the existing density of various parts of the town with examples of high, medium and low-density environments across the world and density targets that have been set for other cities. Also taken into consideration was the importance of retaining Kokstad’s unique character as a rural South African town, as well as the importance of having neighbourhoods with varied gross and net densities, to accommodate the needs of different family types and lifestyle choices. The model assumes a target gross base density within the overall urban area of 14 du/ha, which is similar to the gross base density target for Calgary (City of Calgary, 2012). (See Table.28)
SMART GROWTH
Scenario 2 and 3 test the implications of ‘smart growth’, including higher than usual densities and complementary mixed-use development. The higher density, more compact ‘smart growth’ reduces public services capital costs and public services operating costs incurred by the municipality. A study by the City of Calgary entitled The Implications of Alternative Growth Patterns on Infrastructure Costs (Plan It Calgary, 2009) examines the infrastructure implications of compact, high-density growth versus sprawl, and shows the following key findings, which
TABLE.26. COMPARiSON OF POPULATiON AND HOUSEHOLD ESTiMATES
TABLE.27. POPULATiON FigURES USED iN THE SCENARiO MODELS
TABLE.28. FiNAL iNPUT PARAMETERS USED FOR KOKSTAD AND FRANKLiN SPATiAL MODELS
Date Population Households Household sizeStatsSA Census 2001 56 525 20 567 2.75StatsSA Community Survey (IDP) 2007 46 724 14 323 3.26Global Insight 2010 71 114Quantec (LED Strategy) 2010 50 592 16 124 3.14
Average household size in 2012 (number of people) 3,14Number of households in the GKM in 2012 16 124,00Number of households in the Kokstad SDF Urban Edge in 2012 9 721,00Kokstad gross urban area existing 2012 (ha) 1 296Existing gross base density within the Kokstad 2012 urban area 2012 (du/ha) 7,50Average number of households in the Franklin SDF urban edge in 2012 311,00Franklin gross urban area existing 2012 (ha) 47Existing gross base density within the Franklin urban area 2012 (du/ha) 6,57Target for gross base density across the built area of the town (du/ha) 14
13.2. ANNEXURE B: SCENARIOSINPUT PARAMETERS USED IN THE MODELS
BASELINE POPULATION FIGURES
In the absence of a recent national population census, there is not good data on population and households in the GKM. A number of demographic estimates are available for the GKM for the period 2001 to 2011 that range between 46’724 (StatsSA Comminuty Survey, 2007) and 71’114 (Global Insight, 2010). The overall population of the GKM is estimated at approximately 50’000, according to Quantec’s Standardised Regional Dataset (2011). (See Table.26 )
In the absence of population or household numbers for urban areas, a dwelling count was completed in order to estimate the current urban populations of Kokstad and Franklin, based on the average household size of 3.14.
The baseline population figures used in the scenario models are indicated in Table.27.
PROJECTED HOUSEHOLD GROWTH
Despite the fact that the IDP and Quantec figures show a decline in population in the years leading up to 2007, the 2010/2011 SDF states that there is anecdotal evidence of high growth in Kokstad town due to inward migration from the Eastern Cape and Lesotho by people looking for employment. The incongruity between existing data and anecdotal evidence highlights the high level of uncertainty about the future, and the need to plan for resilience within any future scenario.
The 4 scenarios (0-3) explore two different potential population growth rates. The high growth scenario (0-SDF) is based on the extreme levels of growth that would be required to fully develop the land parcels identified for development in the latest SDF (2010/2011) - calculated as a total household growth in urban areas of approximately 5.4%.
The other 3 scenarios are moderate growth scenarios that assume a household growth
DOCUMENT PREPARED BY THE CITY THINK SPACE TEAM
KOKSTAD & FRANKLIN INTEGRATED SUSTAINABLE DEVELOPMENT PLAN164
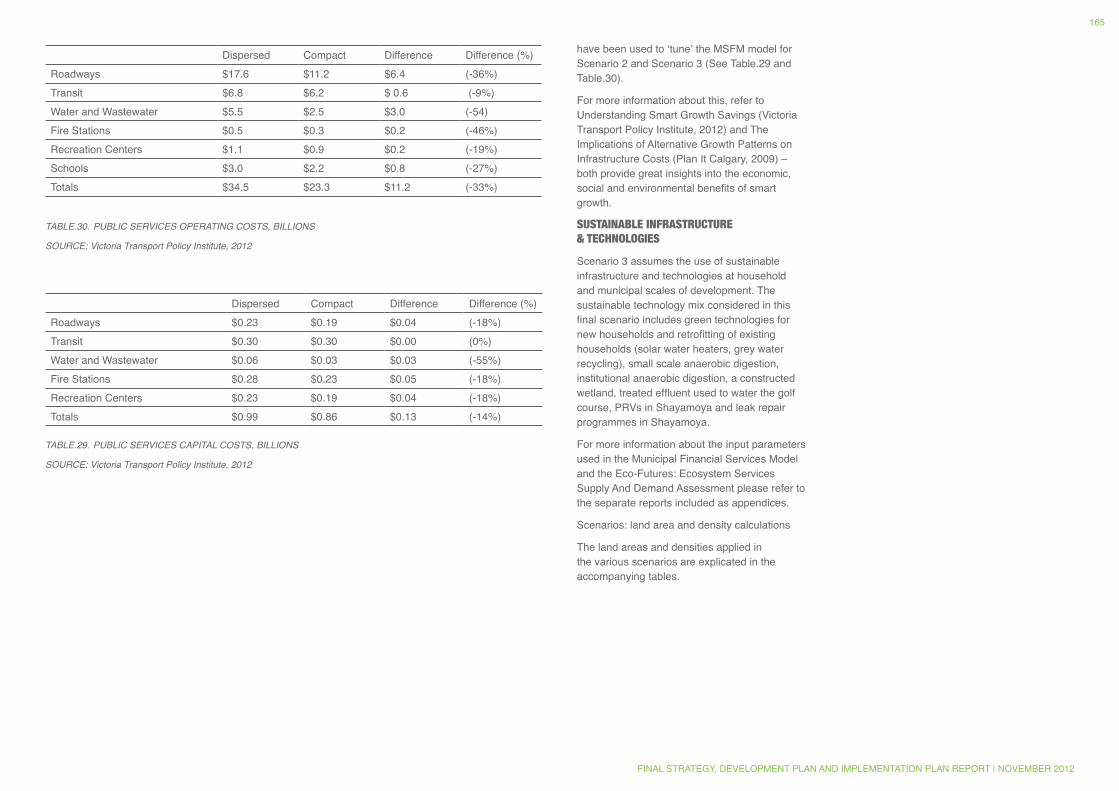
have been used to ‘tune’ the MSFM model for Scenario 2 and Scenario 3 (See Table.29 and Table.30).
For more information about this, refer to Understanding Smart Growth Savings (Victoria Transport Policy Institute, 2012) and The Implications of Alternative Growth Patterns on Infrastructure Costs (Plan It Calgary, 2009) – both provide great insights into the economic, social and environmental benefits of smart growth.
SUSTAINABLE INFRASTRUCTURE & TECHNOLOGIES
Scenario 3 assumes the use of sustainable infrastructure and technologies at household and municipal scales of development. The sustainable technology mix considered in this final scenario includes green technologies for new households and retrofitting of existing households (solar water heaters, grey water recycling), small scale anaerobic digestion, institutional anaerobic digestion, a constructed wetland, treated effluent used to water the golf course, PRVs in Shayamoya and leak repair programmes in Shayamoya.
For more information about the input parameters used in the Municipal Financial Services Model and the Eco-Futures: Ecosystem Services Supply And Demand Assessment please refer to the separate reports included as appendices.
Scenarios: land area and density calculations
The land areas and densities applied in the various scenarios are explicated in the accompanying tables.
TABLE.29. PUBLiC SERViCES CAPiTAL COSTS, BiLLiONS
SOURCE: Victoria Transport Policy institute, 2012
TABLE.30. PUBLiC SERViCES OPERATiNg COSTS, BiLLiONS
SOURCE: Victoria Transport Policy institute, 2012
Dispersed Compact Difference Difference (%)Roadways $17.6 $11.2 $6.4 (-36%)Transit $6.8 $6.2 $ 0.6 (-9%)Water and Wastewater $5.5 $2.5 $3.0 (-54)Fire Stations $0.5 $0.3 $0.2 (-46%)Recreation Centers $1.1 $0.9 $0.2 (-19%)Schools $3.0 $2.2 $0.8 (-27%)Totals $34.5 $23.3 $11.2 (-33%)
Dispersed Compact Difference Difference (%)Roadways $0.23 $0.19 $0.04 (-18%)Transit $0.30 $0.30 $0.00 (0%)Water and Wastewater $0.06 $0.03 $0.03 (-55%)Fire Stations $0.28 $0.23 $0.05 (-18%)Recreation Centers $0.23 $0.19 $0.04 (-18%)Totals $0.99 $0.86 $0.13 (-14%)
FINAL STRATEGY, DEVELOPMENT PLAN AND IMPLEMENTATION PLAN REPORT | NOVEMBER 2012
165
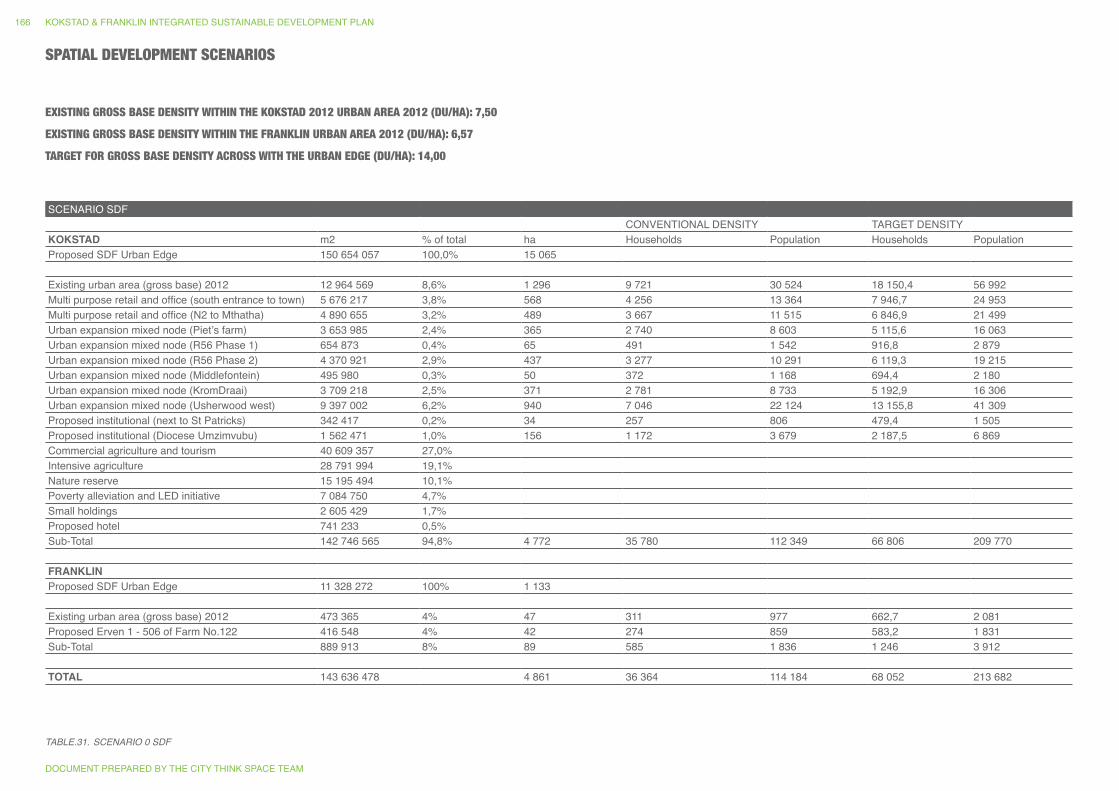
SCENARIO SDF CONVENTIONAL DENSITY TARGET DENSITY
KOKSTAD m2 % of total ha Households Population Households PopulationProposed SDF Urban Edge 150 654 057 100,0% 15 065 Existing urban area (gross base) 2012 12 964 569 8,6% 1 296 9 721 30 524 18 150,4 56 992Multi purpose retail and office (south entrance to town) 5 676 217 3,8% 568 4 256 13 364 7 946,7 24 953Multi purpose retail and office (N2 to Mthatha) 4 890 655 3,2% 489 3 667 11 515 6 846,9 21 499Urban expansion mixed node (Piet’s farm) 3 653 985 2,4% 365 2 740 8 603 5 115,6 16 063Urban expansion mixed node (R56 Phase 1) 654 873 0,4% 65 491 1 542 916,8 2 879Urban expansion mixed node (R56 Phase 2) 4 370 921 2,9% 437 3 277 10 291 6 119,3 19 215Urban expansion mixed node (Middlefontein) 495 980 0,3% 50 372 1 168 694,4 2 180Urban expansion mixed node (KromDraai) 3 709 218 2,5% 371 2 781 8 733 5 192,9 16 306Urban expansion mixed node (Usherwood west) 9 397 002 6,2% 940 7 046 22 124 13 155,8 41 309Proposed institutional (next to St Patricks) 342 417 0,2% 34 257 806 479,4 1 505Proposed institutional (Diocese Umzimvubu) 1 562 471 1,0% 156 1 172 3 679 2 187,5 6 869Commercial agriculture and tourism 40 609 357 27,0% Intensive agriculture 28 791 994 19,1% Nature reserve 15 195 494 10,1% Poverty alleviation and LED initiative 7 084 750 4,7% Small holdings 2 605 429 1,7% Proposed hotel 741 233 0,5% Sub-Total 142 746 565 94,8% 4 772 35 780 112 349 66 806 209 770 FRANKLIN Proposed SDF Urban Edge 11 328 272 100% 1 133 Existing urban area (gross base) 2012 473 365 4% 47 311 977 662,7 2 081Proposed Erven 1 - 506 of Farm No.122 416 548 4% 42 274 859 583,2 1 831Sub-Total 889 913 8% 89 585 1 836 1 246 3 912 TOTAL 143 636 478 4 861 36 364 114 184 68 052 213 682
TABLE.31. SCENARiO 0 SDF
SPATIAL DEVELOPMENT SCENARIOS
EXISTING GROSS BASE DENSITY WITHIN THE KOKSTAD 2012 URBAN AREA 2012 (DU/HA): 7,50
EXISTING GROSS BASE DENSITY WITHIN THE FRANKLIN URBAN AREA 2012 (DU/HA): 6,57
TARGET FOR GROSS BASE DENSITY ACROSS WITH THE URBAN EDGE (DU/HA): 14,00
DOCUMENT PREPARED BY THE CITY THINK SPACE TEAM
KOKSTAD & FRANKLIN INTEGRATED SUSTAINABLE DEVELOPMENT PLAN166
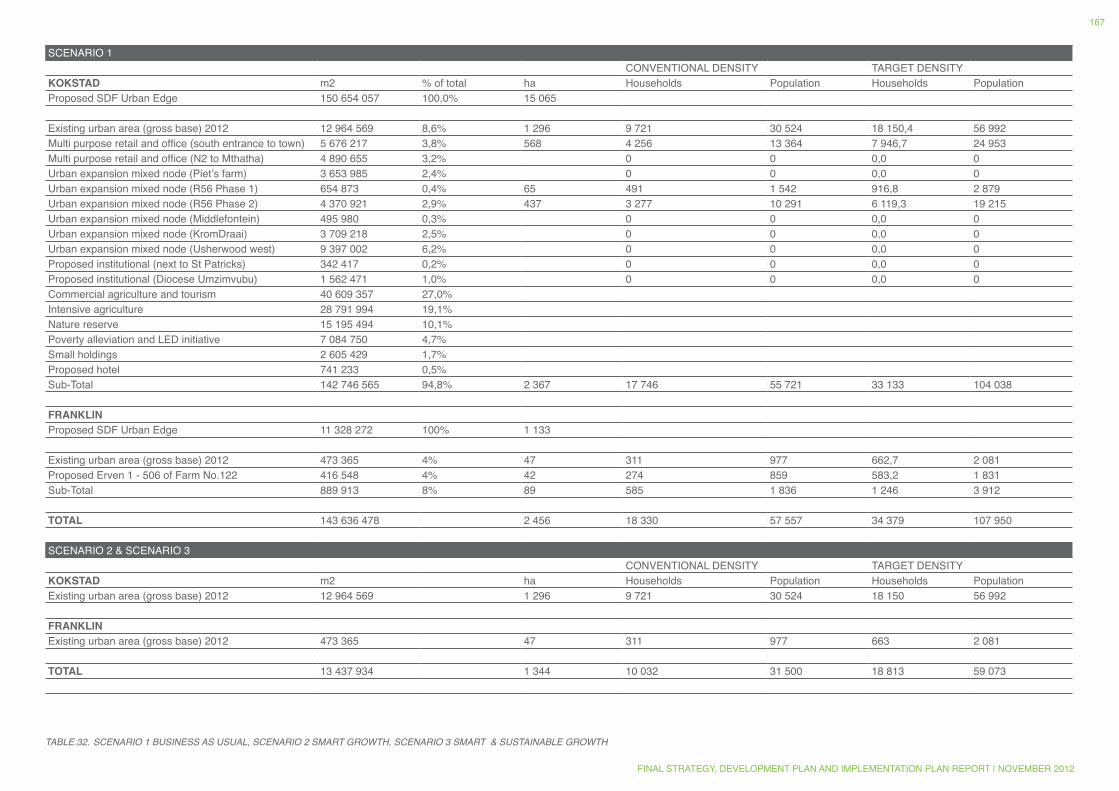
SCENARIO 1 CONVENTIONAL DENSITY TARGET DENSITY
KOKSTAD m2 % of total ha Households Population Households PopulationProposed SDF Urban Edge 150 654 057 100,0% 15 065 Existing urban area (gross base) 2012 12 964 569 8,6% 1 296 9 721 30 524 18 150,4 56 992Multi purpose retail and office (south entrance to town) 5 676 217 3,8% 568 4 256 13 364 7 946,7 24 953Multi purpose retail and office (N2 to Mthatha) 4 890 655 3,2% 0 0 0,0 0Urban expansion mixed node (Piet’s farm) 3 653 985 2,4% 0 0 0,0 0Urban expansion mixed node (R56 Phase 1) 654 873 0,4% 65 491 1 542 916,8 2 879Urban expansion mixed node (R56 Phase 2) 4 370 921 2,9% 437 3 277 10 291 6 119,3 19 215Urban expansion mixed node (Middlefontein) 495 980 0,3% 0 0 0,0 0Urban expansion mixed node (KromDraai) 3 709 218 2,5% 0 0 0,0 0Urban expansion mixed node (Usherwood west) 9 397 002 6,2% 0 0 0,0 0Proposed institutional (next to St Patricks) 342 417 0,2% 0 0 0,0 0Proposed institutional (Diocese Umzimvubu) 1 562 471 1,0% 0 0 0,0 0Commercial agriculture and tourism 40 609 357 27,0% Intensive agriculture 28 791 994 19,1% Nature reserve 15 195 494 10,1% Poverty alleviation and LED initiative 7 084 750 4,7% Small holdings 2 605 429 1,7% Proposed hotel 741 233 0,5% Sub-Total 142 746 565 94,8% 2 367 17 746 55 721 33 133 104 038 FRANKLIN Proposed SDF Urban Edge 11 328 272 100% 1 133 Existing urban area (gross base) 2012 473 365 4% 47 311 977 662,7 2 081Proposed Erven 1 - 506 of Farm No.122 416 548 4% 42 274 859 583,2 1 831Sub-Total 889 913 8% 89 585 1 836 1 246 3 912 TOTAL 143 636 478 2 456 18 330 57 557 34 379 107 950
SCENARIO 2 & SCENARIO 3 CONVENTIONAL DENSITY TARGET DENSITY KOKSTAD m2 ha Households Population Households PopulationExisting urban area (gross base) 2012 12 964 569 1 296 9 721 30 524 18 150 56 992 FRANKLIN Existing urban area (gross base) 2012 473 365 47 311 977 663 2 081 TOTAL 13 437 934 1 344 10 032 31 500 18 813 59 073
TABLE.32. SCENARiO 1 BUSiNESS AS USUAL, SCENARiO 2 SMART gROWTH, SCENARiO 3 SMART & SUSTAiNABLE gROWTH
FINAL STRATEGY, DEVELOPMENT PLAN AND IMPLEMENTATION PLAN REPORT | NOVEMBER 2012
167
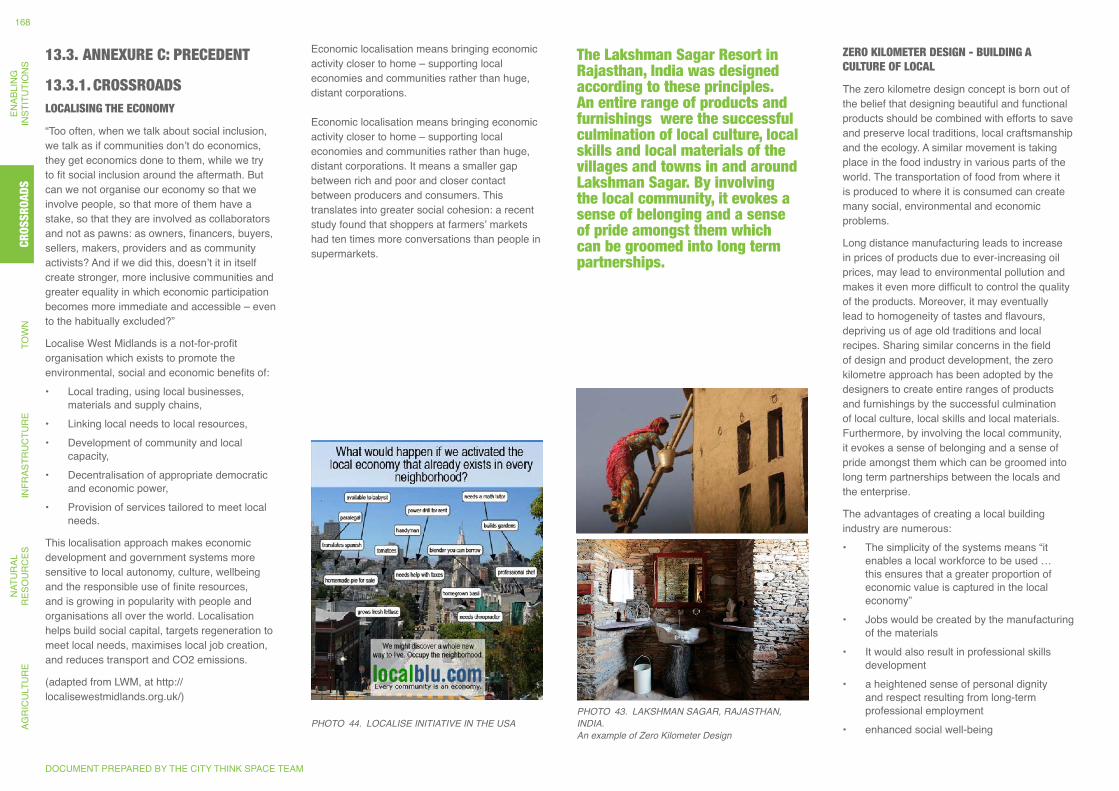
13.3. ANNEXURE C: PRECEDENT
13.3.1. CROSSROADSLOCALISING THE ECONOMY
“Too often, when we talk about social inclusion, we talk as if communities don’t do economics, they get economics done to them, while we try to fit social inclusion around the aftermath. But can we not organise our economy so that we involve people, so that more of them have a stake, so that they are involved as collaborators and not as pawns: as owners, financers, buyers, sellers, makers, providers and as community activists? And if we did this, doesn’t it in itself create stronger, more inclusive communities and greater equality in which economic participation becomes more immediate and accessible – even to the habitually excluded?”
Localise West Midlands is a not-for-profit organisation which exists to promote the environmental, social and economic benefits of: • Local trading, using local businesses,
materials and supply chains, • Linking local needs to local resources,• Development of community and local
capacity,• Decentralisation of appropriate democratic
and economic power,• Provision of services tailored to meet local
needs.
This localisation approach makes economic development and government systems more sensitive to local autonomy, culture, wellbeing and the responsible use of finite resources, and is growing in popularity with people and organisations all over the world. Localisation helps build social capital, targets regeneration to meet local needs, maximises local job creation, and reduces transport and CO2 emissions.
(adapted from LWM, at http://localisewestmidlands.org.uk/)
ZERO KILOMETER DESIGN - BUILDING A CULTURE OF LOCAL
The zero kilometre design concept is born out of the belief that designing beautiful and functional products should be combined with efforts to save and preserve local traditions, local craftsmanship and the ecology. A similar movement is taking place in the food industry in various parts of the world. The transportation of food from where it is produced to where it is consumed can create many social, environmental and economic problems.
Long distance manufacturing leads to increase in prices of products due to ever-increasing oil prices, may lead to environmental pollution and makes it even more difficult to control the quality of the products. Moreover, it may eventually lead to homogeneity of tastes and flavours, depriving us of age old traditions and local recipes. Sharing similar concerns in the field of design and product development, the zero kilometre approach has been adopted by the designers to create entire ranges of products and furnishings by the successful culmination of local culture, local skills and local materials. Furthermore, by involving the local community, it evokes a sense of belonging and a sense of pride amongst them which can be groomed into long term partnerships between the locals and the enterprise.
The advantages of creating a local building industry are numerous: • The simplicity of the systems means “it
enables a local workforce to be used … this ensures that a greater proportion of economic value is captured in the local economy”
• Jobs would be created by the manufacturing of the materials
• It would also result in professional skills development
• a heightened sense of personal dignity and respect resulting from long-term professional employment
• enhanced social well-being
Economic localisation means bringing economic activity closer to home – supporting local economies and communities rather than huge, distant corporations. Economic localisation means bringing economic activity closer to home – supporting local economies and communities rather than huge, distant corporations. It means a smaller gap between rich and poor and closer contact between producers and consumers. This translates into greater social cohesion: a recent study found that shoppers at farmers’ markets had ten times more conversations than people in supermarkets.
The Lakshman Sagar Resort in Rajasthan, India was designed according to these principles. An entire range of products and furnishings were the successful culmination of local culture, local skills and local materials of the villages and towns in and around Lakshman Sagar. By involving the local community, it evokes a sense of belonging and a sense of pride amongst them which can be groomed into long term partnerships.
PHOTO 43. LAKSHMAN SAgAR, RAJASTHAN, iNDiA.An example of Zero Kilometer Design
PHOTO 44. LOCALiSE iNiTiATiVE iN THE USA
DOCUMENT PREPARED BY THE CITY THINK SPACE TEAM
AGR
ICU
LTU
RE
NAT
UR
AL
RES
OU
RC
ESIN
FRAS
TRU
CTU
RE
TOW
NC
RO
SSR
OAD
SEN
ABLI
NG
INST
ITU
TIO
NS
168CR
OSSR
OADS
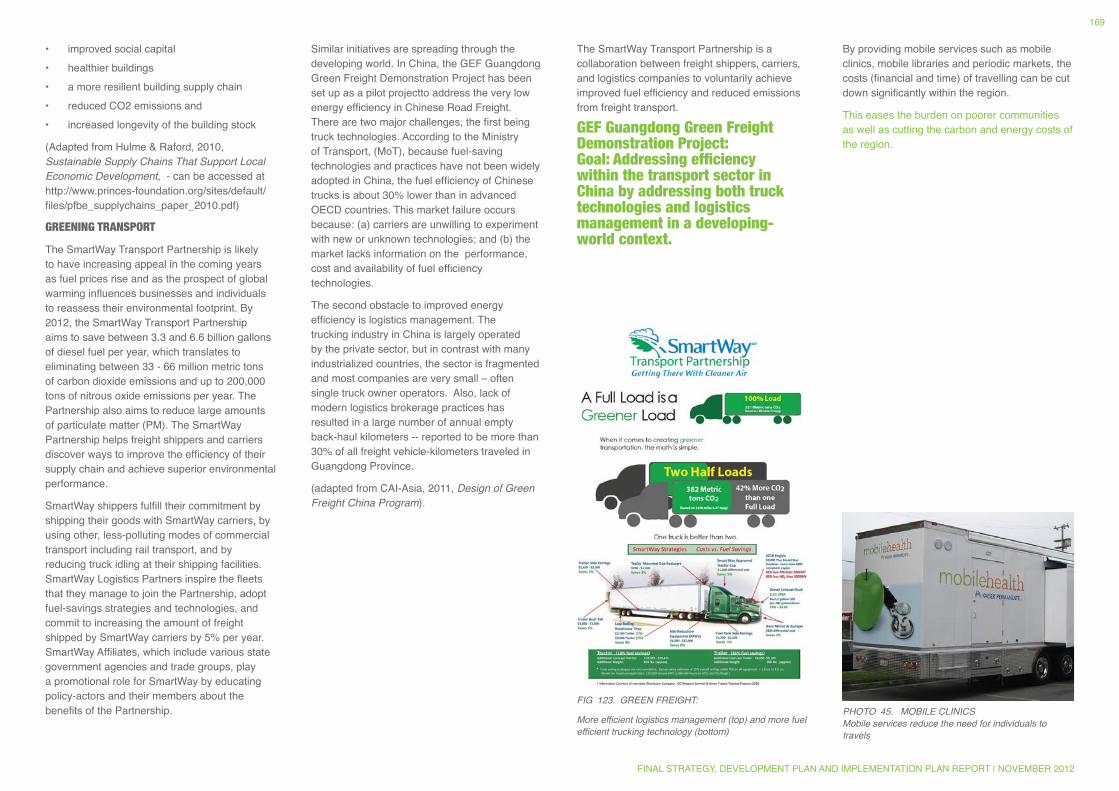
The SmartWay Transport Partnership is a collaboration between freight shippers, carriers, and logistics companies to voluntarily achieve improved fuel efficiency and reduced emissions from freight transport.
GEF Guangdong Green Freight Demonstration Project: Goal: Addressing efficiency within the transport sector in China by addressing both truck technologies and logistics management in a developing-world context.
By providing mobile services such as mobile clinics, mobile libraries and periodic markets, the costs (financial and time) of travelling can be cut down significantly within the region.
This eases the burden on poorer communities as well as cutting the carbon and energy costs of the region.
• improved social capital• healthier buildings• a more resilient building supply chain• reduced CO2 emissions and• increased longevity of the building stock
(Adapted from Hulme & Raford, 2010, Sustainable Supply Chains That Support Local Economic Development, - can be accessed at http://www.princes-foundation.org/sites/default/files/pfbe_supplychains_paper_2010.pdf)
GREENING TRANSPORT
The SmartWay Transport Partnership is likely to have increasing appeal in the coming years as fuel prices rise and as the prospect of global warming influences businesses and individuals to reassess their environmental footprint. By 2012, the SmartWay Transport Partnership aims to save between 3.3 and 6.6 billion gallons of diesel fuel per year, which translates to eliminating between 33 - 66 million metric tons of carbon dioxide emissions and up to 200,000 tons of nitrous oxide emissions per year. The Partnership also aims to reduce large amounts of particulate matter (PM). The SmartWay Partnership helps freight shippers and carriers discover ways to improve the efficiency of their supply chain and achieve superior environmental performance.
SmartWay shippers fulfill their commitment by shipping their goods with SmartWay carriers, by using other, less-polluting modes of commercial transport including rail transport, and by reducing truck idling at their shipping facilities. SmartWay Logistics Partners inspire the fleets that they manage to join the Partnership, adopt fuel-savings strategies and technologies, and commit to increasing the amount of freight shipped by SmartWay carriers by 5% per year. SmartWay Affiliates, which include various state government agencies and trade groups, play a promotional role for SmartWay by educating policy-actors and their members about the benefits of the Partnership.
Similar initiatives are spreading through the developing world. In China, the GEF Guangdong Green Freight Demonstration Project has been set up as a pilot projectto address the very low energy efficiency in Chinese Road Freight.There are two major challenges, the first being truck technologies. According to the Ministry of Transport, (MoT), because fuel-saving technologies and practices have not been widely adopted in China, the fuel efficiency of Chinese trucks is about 30% lower than in advanced OECD countries. This market failure occurs because: (a) carriers are unwilling to experiment with new or unknown technologies; and (b) the market lacks information on the performance, cost and availability of fuel efficiency technologies.
The second obstacle to improved energy efficiency is logistics management. The trucking industry in China is largely operated by the private sector, but in contrast with many industrialized countries, the sector is fragmented and most companies are very small – often single truck owner operators. Also, lack of modern logistics brokerage practices has resulted in a large number of annual empty back-haul kilometers -- reported to be more than 30% of all freight vehicle-kilometers traveled in Guangdong Province.
(adapted from CAI-Asia, 2011, Design of green Freight China Program).
Fig 123. gREEN FREigHT:
More efficient logistics management (top) and more fuel efficient trucking technology (bottom)
PHOTO 45. MOBiLE CLiNiCS Mobile services reduce the need for individuals to travels
FINAL STRATEGY, DEVELOPMENT PLAN AND IMPLEMENTATION PLAN REPORT | NOVEMBER 2012
169
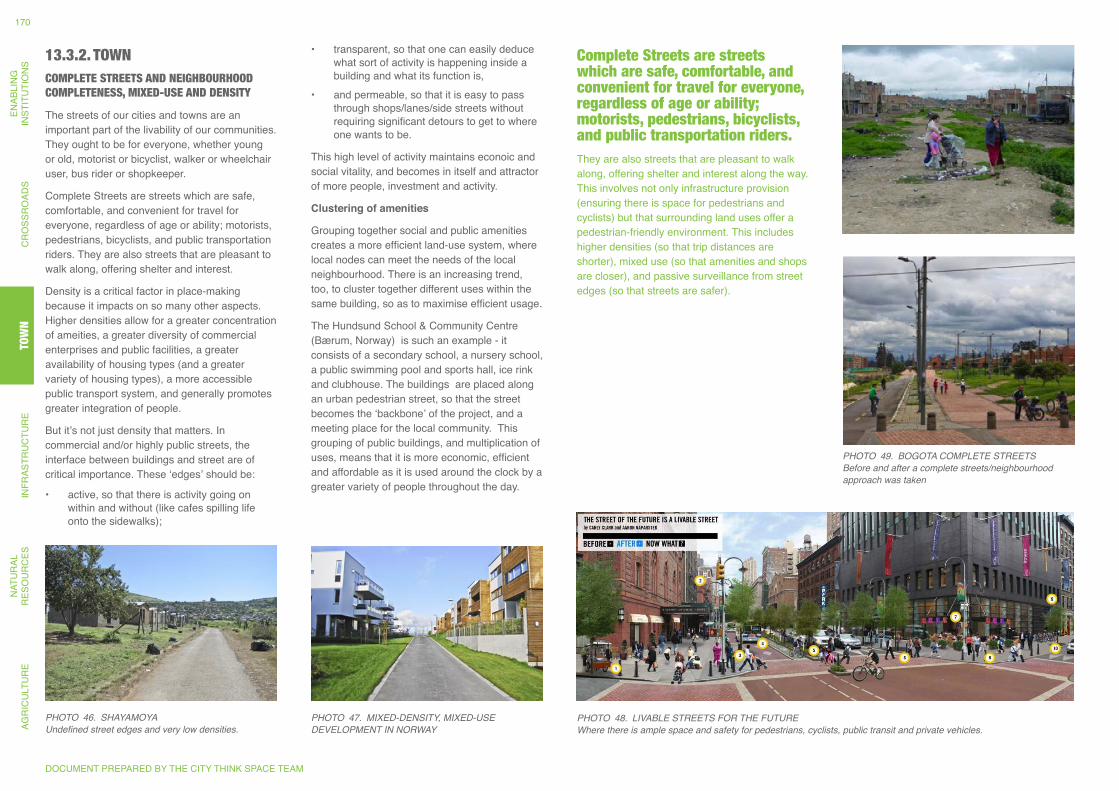
13.3.2. TOWNCOMPLETE STREETS AND NEIGHBOURHOOD COMPLETENESS, MIXED-USE AND DENSITY
The streets of our cities and towns are an important part of the livability of our communities. They ought to be for everyone, whether young or old, motorist or bicyclist, walker or wheelchair user, bus rider or shopkeeper.
Complete Streets are streets which are safe, comfortable, and convenient for travel for everyone, regardless of age or ability; motorists, pedestrians, bicyclists, and public transportation riders. They are also streets that are pleasant to walk along, offering shelter and interest.
Density is a critical factor in place-making because it impacts on so many other aspects. Higher densities allow for a greater concentration of ameities, a greater diversity of commercial enterprises and public facilities, a greater availability of housing types (and a greater variety of housing types), a more accessible public transport system, and generally promotes greater integration of people.
But it’s not just density that matters. In commercial and/or highly public streets, the interface between buildings and street are of critical importance. These ‘edges’ should be:
• active, so that there is activity going on within and without (like cafes spilling life onto the sidewalks);
PHOTO 46. SHAYAMOYA Undefined street edges and very low densities.
PHOTO 47. MiXED-DENSiTY, MiXED-USE DEVELOPMENT iN NORWAY
• transparent, so that one can easily deduce what sort of activity is happening inside a building and what its function is,
• and permeable, so that it is easy to pass through shops/lanes/side streets without requiring significant detours to get to where one wants to be.
This high level of activity maintains econoic and social vitality, and becomes in itself and attractor of more people, investment and activity.
Clustering of amenities
Grouping together social and public amenities creates a more efficient land-use system, where local nodes can meet the needs of the local neighbourhood. There is an increasing trend, too, to cluster together different uses within the same building, so as to maximise efficient usage.
The Hundsund School & Community Centre (Bærum, Norway) is such an example - it consists of a secondary school, a nursery school, a public swimming pool and sports hall, ice rink and clubhouse. The buildings are placed along an urban pedestrian street, so that the street becomes the ‘backbone’ of the project, and a meeting place for the local community. This grouping of public buildings, and multiplication of uses, means that it is more economic, efficient and affordable as it is used around the clock by a greater variety of people throughout the day.
PHOTO 48. LiVABLE STREETS FOR THE FUTUREWhere there is ample space and safety for pedestrians, cyclists, public transit and private vehicles.
Complete Streets are streets which are safe, comfortable, and convenient for travel for everyone, regardless of age or ability; motorists, pedestrians, bicyclists, and public transportation riders. They are also streets that are pleasant to walk along, offering shelter and interest along the way. This involves not only infrastructure provision (ensuring there is space for pedestrians and cyclists) but that surrounding land uses offer a pedestrian-friendly environment. This includes higher densities (so that trip distances are shorter), mixed use (so that amenities and shops are closer), and passive surveillance from street edges (so that streets are safer).
PHOTO 49. BOgOTA COMPLETE STREETSBefore and after a complete streets/neighbourhood approach was taken
DOCUMENT PREPARED BY THE CITY THINK SPACE TEAM
AGR
ICU
LTU
RE
NAT
UR
AL
RES
OU
RC
ESIN
FRAS
TRU
CTU
RE
TOW
NC
RO
SSR
OAD
SEN
ABLI
NG
INST
ITU
TIO
NS
170TO
WN
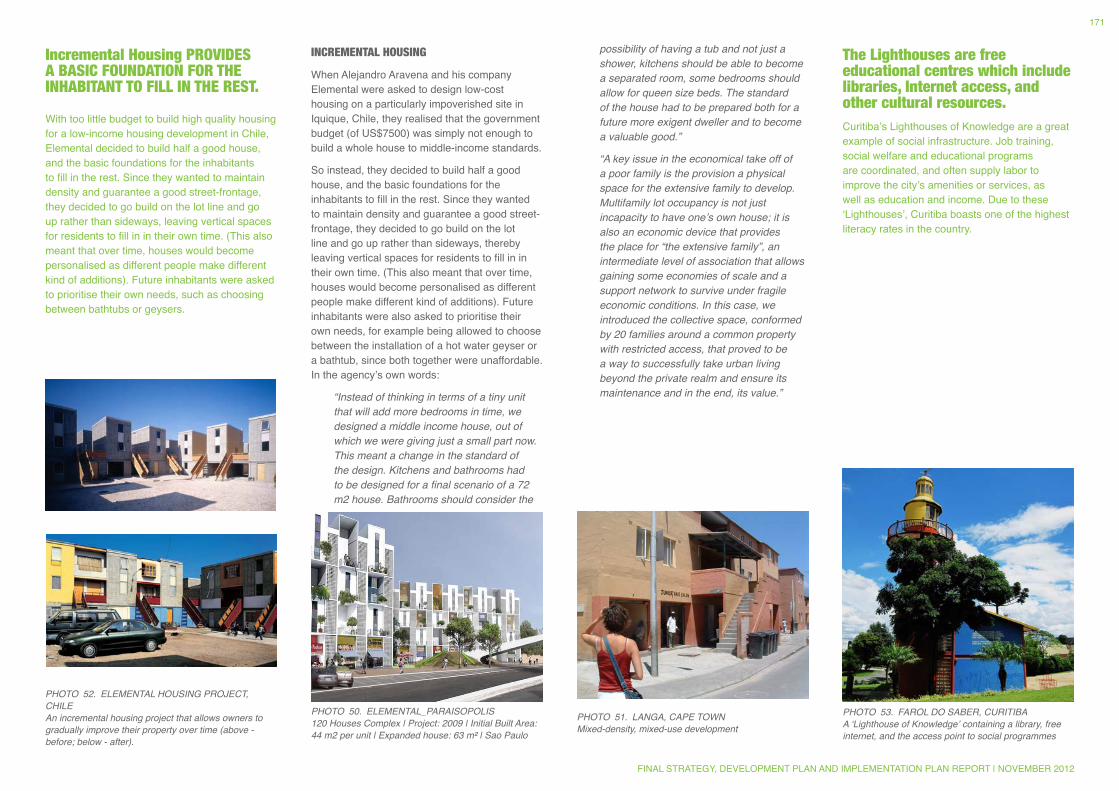
PHOTO 50. ELEMENTAL_PARAiSOPOLiS120 Houses Complex | Project: 2009 | initial Built Area: 44 m2 per unit | Expanded house: 63 m² | Sao Paulo
PHOTO 51. LANgA, CAPE TOWNMixed-density, mixed-use development
INCREMENTAL HOUSING
When Alejandro Aravena and his company Elemental were asked to design low-cost housing on a particularly impoverished site in Iquique, Chile, they realised that the government budget (of US$7500) was simply not enough to build a whole house to middle-income standards.
So instead, they decided to build half a good house, and the basic foundations for the inhabitants to fill in the rest. Since they wanted to maintain density and guarantee a good street-frontage, they decided to go build on the lot line and go up rather than sideways, thereby leaving vertical spaces for residents to fill in in their own time. (This also meant that over time, houses would become personalised as different people make different kind of additions). Future inhabitants were also asked to prioritise their own needs, for example being allowed to choose between the installation of a hot water geyser or a bathtub, since both together were unaffordable. In the agency’s own words:
“instead of thinking in terms of a tiny unit that will add more bedrooms in time, we designed a middle income house, out of which we were giving just a small part now. This meant a change in the standard of the design. Kitchens and bathrooms had to be designed for a final scenario of a 72 m2 house. Bathrooms should consider the
possibility of having a tub and not just a shower, kitchens should be able to become a separated room, some bedrooms should allow for queen size beds. The standard of the house had to be prepared both for a future more exigent dweller and to become a valuable good.”
“A key issue in the economical take off of a poor family is the provision a physical space for the extensive family to develop. Multifamily lot occupancy is not just incapacity to have one’s own house; it is also an economic device that provides the place for “the extensive family”, an intermediate level of association that allows gaining some economies of scale and a support network to survive under fragile economic conditions. in this case, we introduced the collective space, conformed by 20 families around a common property with restricted access, that proved to be a way to successfully take urban living beyond the private realm and ensure its maintenance and in the end, its value.”
PHOTO 52. ELEMENTAL HOUSiNg PROJECT, CHiLE An incremental housing project that allows owners to gradually improve their property over time (above - before; below - after).
Incremental Housing PROVIDES A BASIC FOUNDATION FOR THE INHABITANT TO FILL IN THE REST. With too little budget to build high quality housing for a low-income housing development in Chile, Elemental decided to build half a good house, and the basic foundations for the inhabitants to fill in the rest. Since they wanted to maintain density and guarantee a good street-frontage, they decided to go build on the lot line and go up rather than sideways, leaving vertical spaces for residents to fill in in their own time. (This also meant that over time, houses would become personalised as different people make different kind of additions). Future inhabitants were asked to prioritise their own needs, such as choosing between bathtubs or geysers.
The Lighthouses are free educational centres which include libraries, Internet access, and other cultural resources. Curitiba’s Lighthouses of Knowledge are a great example of social infrastructure. Job training, social welfare and educational programs are coordinated, and often supply labor to improve the city’s amenities or services, as well as education and income. Due to these ‘Lighthouses’, Curitiba boasts one of the highest literacy rates in the country.
PHOTO 53. FAROL DO SABER, CURiTiBAA ‘Lighthouse of Knowledge’ containing a library, free internet, and the access point to social programmes
FINAL STRATEGY, DEVELOPMENT PLAN AND IMPLEMENTATION PLAN REPORT | NOVEMBER 2012
171
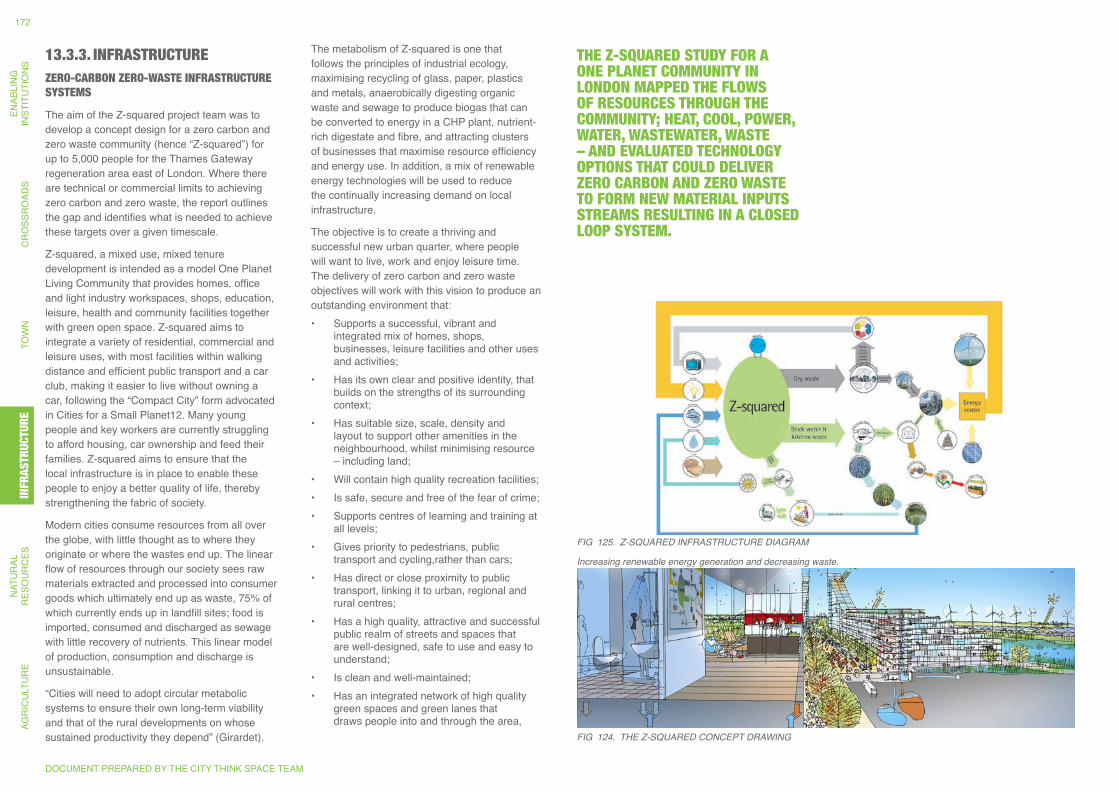
13.3.3. INFRASTRUCTUREZERO-CARBON ZERO-WASTE INFRASTRUCTURE SYSTEMS
The aim of the Z-squared project team was to develop a concept design for a zero carbon and zero waste community (hence “Z-squared”) for up to 5,000 people for the Thames Gateway regeneration area east of London. Where there are technical or commercial limits to achieving zero carbon and zero waste, the report outlines the gap and identifies what is needed to achieve these targets over a given timescale.
Z-squared, a mixed use, mixed tenure development is intended as a model One Planet Living Community that provides homes, office and light industry workspaces, shops, education, leisure, health and community facilities together with green open space. Z-squared aims to integrate a variety of residential, commercial and leisure uses, with most facilities within walking distance and efficient public transport and a car club, making it easier to live without owning a car, following the “Compact City” form advocated in Cities for a Small Planet12. Many young people and key workers are currently struggling to afford housing, car ownership and feed their families. Z-squared aims to ensure that the local infrastructure is in place to enable these people to enjoy a better quality of life, thereby strengthening the fabric of society.
Modern cities consume resources from all over the globe, with little thought as to where they originate or where the wastes end up. The linear flow of resources through our society sees raw materials extracted and processed into consumer goods which ultimately end up as waste, 75% of which currently ends up in landfill sites; food is imported, consumed and discharged as sewage with little recovery of nutrients. This linear model of production, consumption and discharge is unsustainable.
“Cities will need to adopt circular metabolic systems to ensure their own long-term viability and that of the rural developments on whose sustained productivity they depend” (Girardet).
The metabolism of Z-squared is one that follows the principles of industrial ecology, maximising recycling of glass, paper, plastics and metals, anaerobically digesting organic waste and sewage to produce biogas that can be converted to energy in a CHP plant, nutrient-rich digestate and fibre, and attracting clusters of businesses that maximise resource efficiency and energy use. In addition, a mix of renewable energy technologies will be used to reduce the continually increasing demand on local infrastructure.
The objective is to create a thriving and successful new urban quarter, where people will want to live, work and enjoy leisure time. The delivery of zero carbon and zero waste objectives will work with this vision to produce an outstanding environment that:• Supports a successful, vibrant and
integrated mix of homes, shops, businesses, leisure facilities and other uses and activities;
• Has its own clear and positive identity, that builds on the strengths of its surrounding context;
• Has suitable size, scale, density and layout to support other amenities in the neighbourhood, whilst minimising resource – including land;
• Will contain high quality recreation facilities;• Is safe, secure and free of the fear of crime;• Supports centres of learning and training at
all levels;• Gives priority to pedestrians, public
transport and cycling,rather than cars;• Has direct or close proximity to public
transport, linking it to urban, regional and rural centres;
• Has a high quality, attractive and successful public realm of streets and spaces that are well-designed, safe to use and easy to understand;
• Is clean and well-maintained;• Has an integrated network of high quality
green spaces and green lanes that draws people into and through the area,
THE Z-SQUARED STUDY FOR A ONE PLANET COMMUNITY IN LONDON MAPPED THE FLOWS OF RESOURCES THROUGH THE COMMUNITY; HEAT, COOL, POWER, WATER, WASTEWATER, WASTE – AND EVALUATED TECHNOLOGY OPTIONS THAT COULD DELIVER ZERO CARBON AND ZERO WASTE TO FORM NEW MATERIAL INPUTS STREAMS RESULTING IN A CLOSED LOOP SYSTEM.
Fig 124. THE Z-SQUARED CONCEPT DRAWiNg
Fig 125. Z-SQUARED iNFRASTRUCTURE DiAgRAM
increasing renewable energy generation and decreasing waste.
DOCUMENT PREPARED BY THE CITY THINK SPACE TEAM
AGR
ICU
LTU
RE
NAT
UR
AL
RES
OU
RC
ESIN
FRAS
TRU
CTU
RE
TOW
NC
RO
SSR
OAD
SEN
ABLI
NG
INST
ITU
TIO
NS
172IN
FRAS
TRUC
TURE
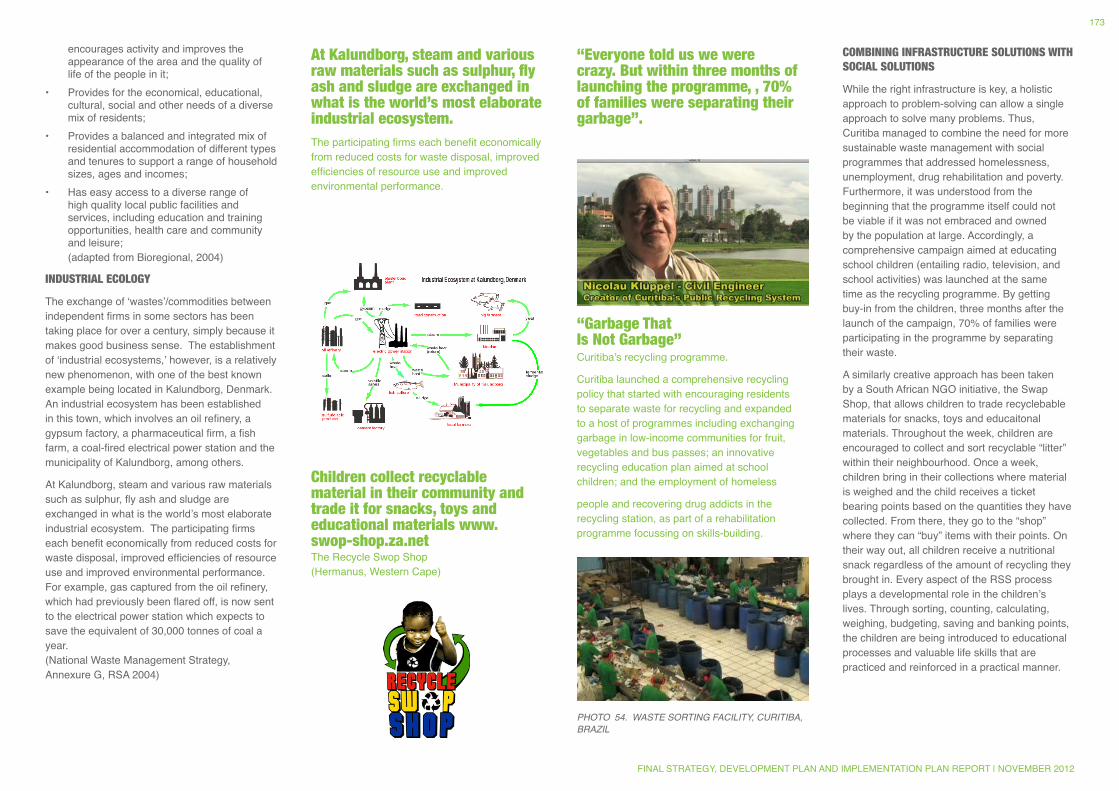
encourages activity and improves the appearance of the area and the quality of life of the people in it;
• Provides for the economical, educational, cultural, social and other needs of a diverse mix of residents;
• Provides a balanced and integrated mix of residential accommodation of different types and tenures to support a range of household sizes, ages and incomes;
• Has easy access to a diverse range of high quality local public facilities and services, including education and training opportunities, health care and community and leisure; (adapted from Bioregional, 2004)
INDUSTRIAL ECOLOGY
The exchange of ‘wastes’/commodities between independent firms in some sectors has been taking place for over a century, simply because it makes good business sense. The establishment of ‘industrial ecosystems,’ however, is a relatively new phenomenon, with one of the best known example being located in Kalundborg, Denmark. An industrial ecosystem has been established in this town, which involves an oil refinery, a gypsum factory, a pharmaceutical firm, a fish farm, a coal-fired electrical power station and the municipality of Kalundborg, among others.
At Kalundborg, steam and various raw materials such as sulphur, fly ash and sludge are exchanged in what is the world’s most elaborate industrial ecosystem. The participating firms each benefit economically from reduced costs for waste disposal, improved efficiencies of resource use and improved environmental performance. For example, gas captured from the oil refinery, which had previously been flared off, is now sent to the electrical power station which expects to save the equivalent of 30,000 tonnes of coal a year. (National Waste Management Strategy, Annexure G, RSA 2004)
COMBINING INFRASTRUCTURE SOLUTIONS WITH SOCIAL SOLUTIONS
While the right infrastructure is key, a holistic approach to problem-solving can allow a single approach to solve many problems. Thus, Curitiba managed to combine the need for more sustainable waste management with social programmes that addressed homelessness, unemployment, drug rehabilitation and poverty. Furthermore, it was understood from the beginning that the programme itself could not be viable if it was not embraced and owned by the population at large. Accordingly, a comprehensive campaign aimed at educating school children (entailing radio, television, and school activities) was launched at the same time as the recycling programme. By getting buy-in from the children, three months after the launch of the campaign, 70% of families were participating in the programme by separating their waste.
A similarly creative approach has been taken by a South African NGO initiative, the Swap Shop, that allows children to trade recyclebable materials for snacks, toys and educaitonal materials. Throughout the week, children are encouraged to collect and sort recyclable “litter” within their neighbourhood. Once a week, children bring in their collections where material is weighed and the child receives a ticket bearing points based on the quantities they have collected. From there, they go to the “shop” where they can “buy” items with their points. On their way out, all children receive a nutritional snack regardless of the amount of recycling they brought in. Every aspect of the RSS process plays a developmental role in the children’s lives. Through sorting, counting, calculating, weighing, budgeting, saving and banking points, the children are being introduced to educational processes and valuable life skills that are practiced and reinforced in a practical manner.
“Garbage That Is Not Garbage” Curitiba’s recycling programme.
Curitiba launched a comprehensive recycling policy that started with encouraging residents to separate waste for recycling and expanded to a host of programmes including exchanging garbage in low-income communities for fruit, vegetables and bus passes; an innovative recycling education plan aimed at school children; and the employment of homeless
people and recovering drug addicts in the recycling station, as part of a rehabilitation programme focussing on skills-building.
At Kalundborg, steam and various raw materials such as sulphur, fly ash and sludge are exchanged in what is the world’s most elaborate industrial ecosystem. The participating firms each benefit economically from reduced costs for waste disposal, improved efficiencies of resource use and improved environmental performance.
Children collect recyclable material in their community and trade it for snacks, toys and educational materials www.swop-shop.za.net The Recycle Swop Shop (Hermanus, Western Cape)
“Everyone told us we were crazy. But within three months of launching the programme, , 70% of families were separating their garbage”.
PHOTO 54. WASTE SORTiNg FACiLiTY, CURiTiBA, BRAZiL
FINAL STRATEGY, DEVELOPMENT PLAN AND IMPLEMENTATION PLAN REPORT | NOVEMBER 2012
173
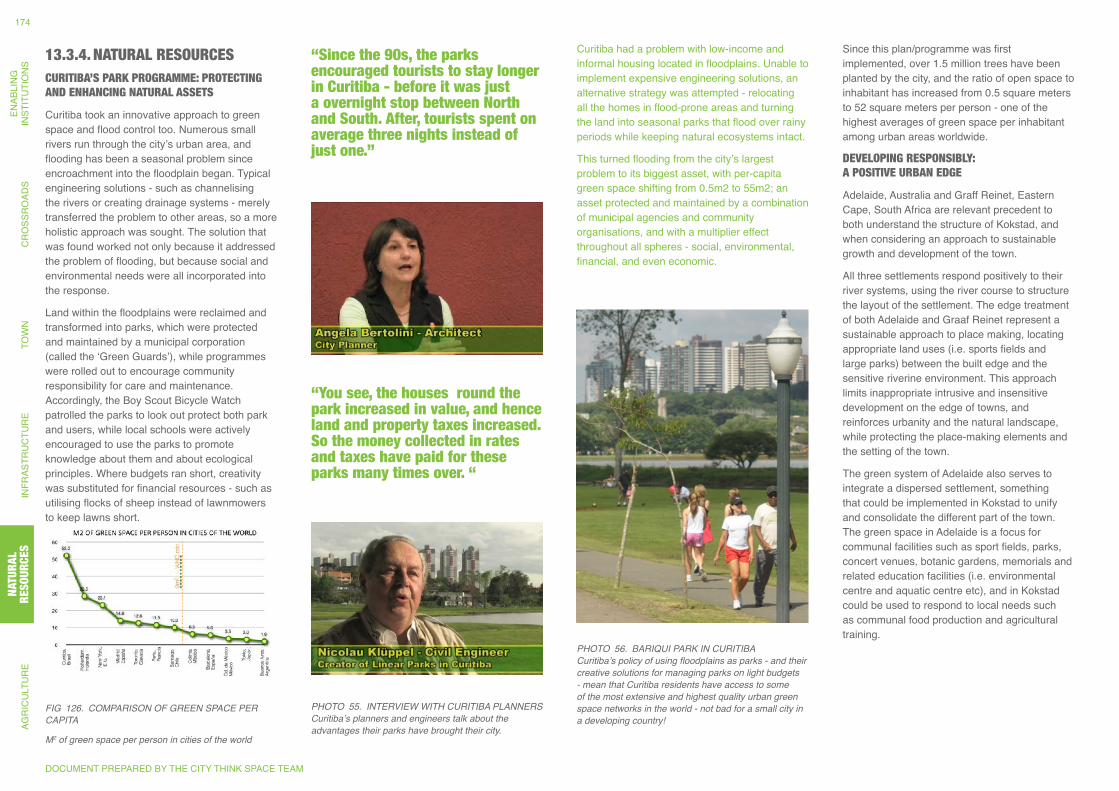
13.3.4. NATURAL RESOURCESCURITIBA’S PARK PROGRAMME: PROTECTING AND ENHANCING NATURAL ASSETS
Curitiba took an innovative approach to green space and flood control too. Numerous small rivers run through the city’s urban area, and flooding has been a seasonal problem since encroachment into the floodplain began. Typical engineering solutions - such as channelising the rivers or creating drainage systems - merely transferred the problem to other areas, so a more holistic approach was sought. The solution that was found worked not only because it addressed the problem of flooding, but because social and environmental needs were all incorporated into the response.
Land within the floodplains were reclaimed and transformed into parks, which were protected and maintained by a municipal corporation (called the ‘Green Guards’), while programmes were rolled out to encourage community responsibility for care and maintenance. Accordingly, the Boy Scout Bicycle Watch patrolled the parks to look out protect both park and users, while local schools were actively encouraged to use the parks to promote knowledge about them and about ecological principles. Where budgets ran short, creativity was substituted for financial resources - such as utilising flocks of sheep instead of lawnmowers to keep lawns short.
Since this plan/programme was first implemented, over 1.5 million trees have been planted by the city, and the ratio of open space to inhabitant has increased from 0.5 square meters to 52 square meters per person - one of the highest averages of green space per inhabitant among urban areas worldwide.
DEVELOPING RESPONSIBLY: A POSITIVE URBAN EDGE
Adelaide, Australia and Graff Reinet, Eastern Cape, South Africa are relevant precedent to both understand the structure of Kokstad, and when considering an approach to sustainable growth and development of the town.
All three settlements respond positively to their river systems, using the river course to structure the layout of the settlement. The edge treatment of both Adelaide and Graaf Reinet represent a sustainable approach to place making, locating appropriate land uses (i.e. sports fields and large parks) between the built edge and the sensitive riverine environment. This approach limits inappropriate intrusive and insensitive development on the edge of towns, and reinforces urbanity and the natural landscape, while protecting the place-making elements and the setting of the town.
The green system of Adelaide also serves to integrate a dispersed settlement, something that could be implemented in Kokstad to unify and consolidate the different part of the town. The green space in Adelaide is a focus for communal facilities such as sport fields, parks, concert venues, botanic gardens, memorials and related education facilities (i.e. environmental centre and aquatic centre etc), and in Kokstad could be used to respond to local needs such as communal food production and agricultural training.
Fig 126. COMPARiSON OF gREEN SPACE PER CAPiTA
M2 of green space per person in cities of the world
Curitiba had a problem with low-income and informal housing located in floodplains. Unable to implement expensive engineering solutions, an alternative strategy was attempted - relocating all the homes in flood-prone areas and turning the land into seasonal parks that flood over rainy periods while keeping natural ecosystems intact.
This turned flooding from the city’s largest problem to its biggest asset, with per-capita green space shifting from 0.5m2 to 55m2; an asset protected and maintained by a combination of municipal agencies and community organisations, and with a multiplier effect throughout all spheres - social, environmental, financial, and even economic.
“Since the 90s, the parks encouraged tourists to stay longer in Curitiba - before it was just a overnight stop between North and South. After, tourists spent on average three nights instead of just one.”
“You see, the houses round the park increased in value, and hence land and property taxes increased. So the money collected in rates and taxes have paid for these parks many times over. “
PHOTO 55. iNTERViEW WiTH CURiTiBA PLANNERSCuritiba’s planners and engineers talk about the advantages their parks have brought their city.
PHOTO 56. BARiQUi PARK iN CURiTiBA Curitiba’s policy of using floodplains as parks - and their creative solutions for managing parks on light budgets - mean that Curitiba residents have access to some of the most extensive and highest quality urban green space networks in the world - not bad for a small city in a developing country!
DOCUMENT PREPARED BY THE CITY THINK SPACE TEAM
AGR
ICU
LTU
RE
NAT
UR
AL
RES
OU
RC
ESIN
FRAS
TRU
CTU
RE
TOW
NC
RO
SSR
OAD
SEN
ABLI
NG
INST
ITU
TIO
NS
174NA
TURA
L RE
SOUR
CES
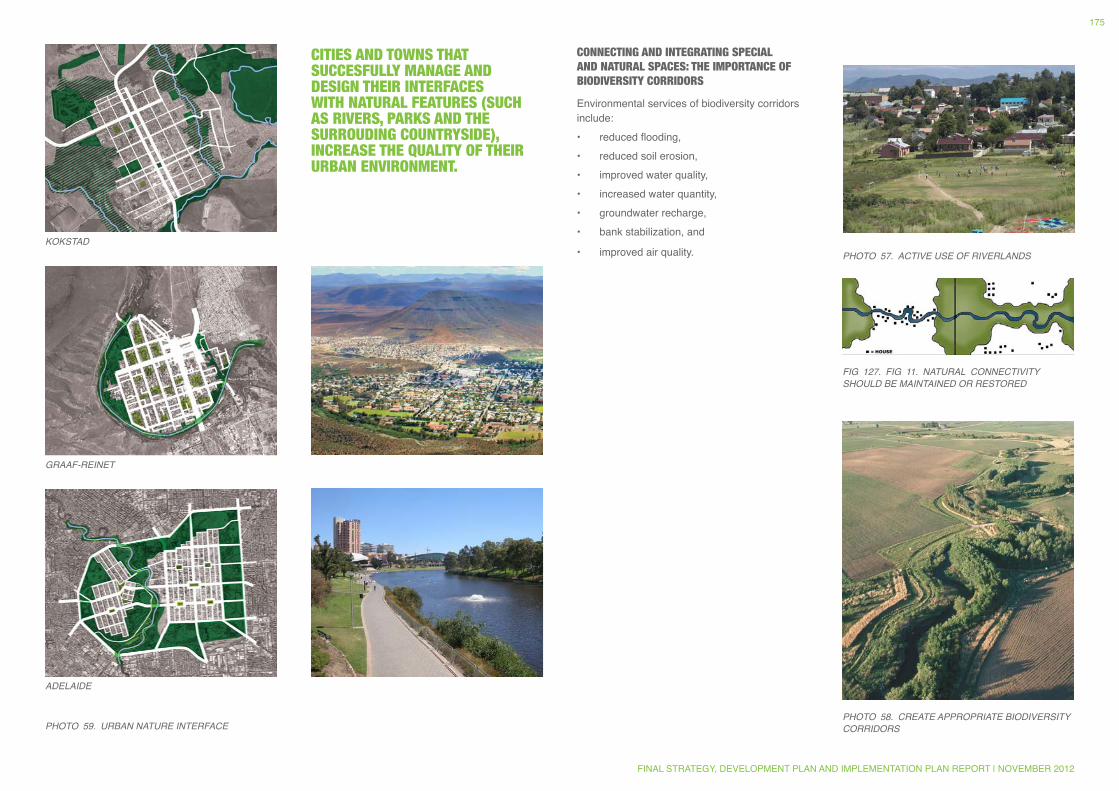
CITIES AND TOWNS THAT SUCCESFULLY MANAGE AND DESIGN THEIR INTERFACES WITH NATURAL FEATURES (SUCH AS RIVERS, PARKS AND THE SURROUDING COUNTRYSIDE), INCREASE THE QUALITY OF THEIR URBAN ENVIRONMENT.
PHOTO 57. ACTiVE USE OF RiVERLANDS
PHOTO 58. CREATE APPROPRiATE BiODiVERSiTY CORRiDORS
Fig 127. Fig 11. NATURAL CONNECTiViTY SHOULD BE MAiNTAiNED OR RESTORED
CONNECTING AND INTEGRATING SPECIAL AND NATURAL SPACES: THE IMPORTANCE OF BIODIVERSITY CORRIDORS
Environmental services of biodiversity corridors include:• reduced flooding,• reduced soil erosion,• improved water quality,• increased water quantity,• groundwater recharge,• bank stabilization, and
• improved air quality.KOKSTAD
gRAAF-REiNET
PHOTO 59. URBAN NATURE iNTERFACE
ADELAiDE
FINAL STRATEGY, DEVELOPMENT PLAN AND IMPLEMENTATION PLAN REPORT | NOVEMBER 2012
175
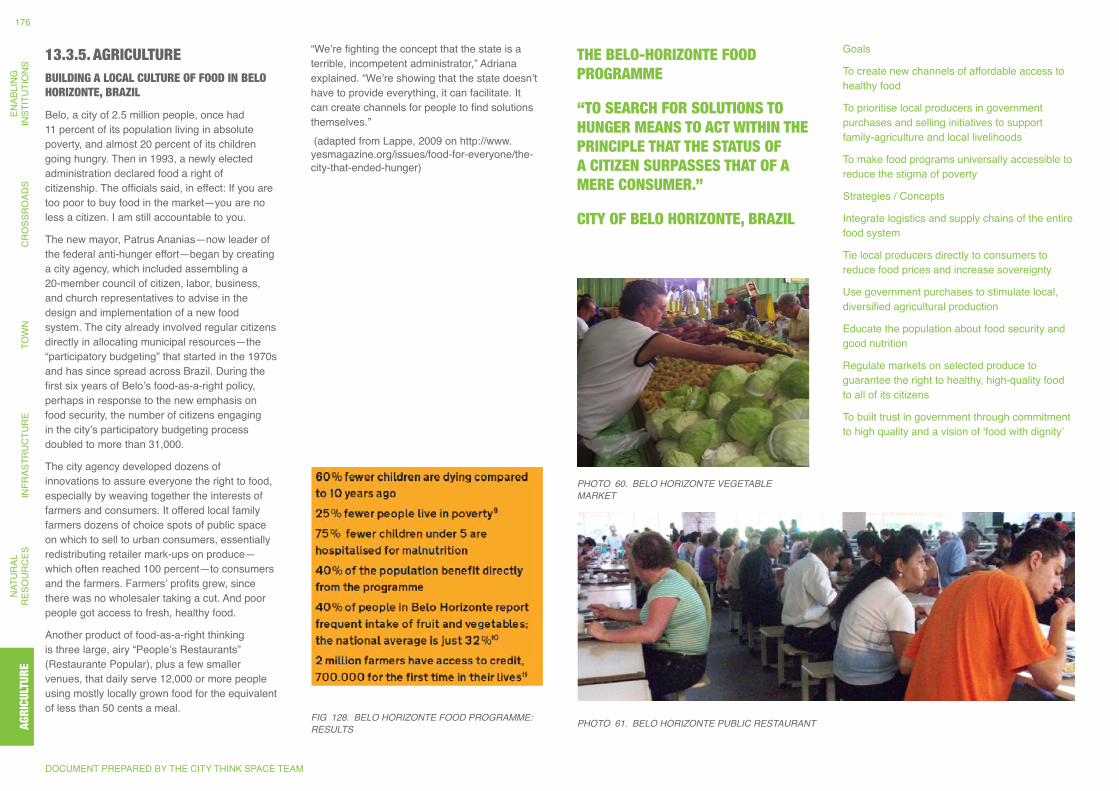
Fig 128. BELO HORiZONTE FOOD PROgRAMME: RESULTS
13.3.5. AGRICULTUREBUILDING A LOCAL CULTURE OF FOOD IN BELO HORIZONTE, BRAZIL
Belo, a city of 2.5 million people, once had 11 percent of its population living in absolute poverty, and almost 20 percent of its children going hungry. Then in 1993, a newly elected administration declared food a right of citizenship. The officials said, in effect: If you are too poor to buy food in the market—you are no less a citizen. I am still accountable to you.
The new mayor, Patrus Ananias—now leader of the federal anti-hunger effort—began by creating a city agency, which included assembling a 20-member council of citizen, labor, business, and church representatives to advise in the design and implementation of a new food system. The city already involved regular citizens directly in allocating municipal resources—the “participatory budgeting” that started in the 1970s and has since spread across Brazil. During the first six years of Belo’s food-as-a-right policy, perhaps in response to the new emphasis on food security, the number of citizens engaging in the city’s participatory budgeting process doubled to more than 31,000.
The city agency developed dozens of innovations to assure everyone the right to food, especially by weaving together the interests of farmers and consumers. It offered local family farmers dozens of choice spots of public space on which to sell to urban consumers, essentially redistributing retailer mark-ups on produce—which often reached 100 percent—to consumers and the farmers. Farmers’ profits grew, since there was no wholesaler taking a cut. And poor people got access to fresh, healthy food.
Another product of food-as-a-right thinking is three large, airy “People’s Restaurants” (Restaurante Popular), plus a few smaller venues, that daily serve 12,000 or more people using mostly locally grown food for the equivalent of less than 50 cents a meal.
“We’re fighting the concept that the state is a terrible, incompetent administrator,” Adriana explained. “We’re showing that the state doesn’t have to provide everything, it can facilitate. It can create channels for people to find solutions themselves.” (adapted from Lappe, 2009 on http://www.yesmagazine.org/issues/food-for-everyone/the-city-that-ended-hunger)
PHOTO 60. BELO HORiZONTE VEgETABLE MARKET
PHOTO 61. BELO HORiZONTE PUBLiC RESTAURANT
Goals
To create new channels of affordable access to healthy food
To prioritise local producers in government purchases and selling initiatives to support family-agriculture and local livelihoods
To make food programs universally accessible to reduce the stigma of poverty
Strategies / Concepts
Integrate logistics and supply chains of the entire food system
Tie local producers directly to consumers to reduce food prices and increase sovereignty
Use government purchases to stimulate local, diversified agricultural production
Educate the population about food security and good nutrition
Regulate markets on selected produce to guarantee the right to healthy, high-quality food to all of its citizens
To built trust in government through commitment to high quality and a vision of ‘food with dignity’
THE BELO-HORIZONTE FOOD PROGRAMME
“TO SEARCH FOR SOLUTIONS TO HUNGER MEANS TO ACT WITHIN THE PRINCIPLE THAT THE STATUS OF A CITIZEN SURPASSES THAT OF A MERE CONSUMER.”
CITY OF BELO HORIZONTE, BRAZIL
DOCUMENT PREPARED BY THE CITY THINK SPACE TEAM
AGR
ICU
LTU
RE
NAT
UR
AL
RES
OU
RC
ESIN
FRAS
TRU
CTU
RE
TOW
NC
RO
SSR
OAD
SEN
ABLI
NG
INST
ITU
TIO
NS
176AG
RICU
LTUR
E
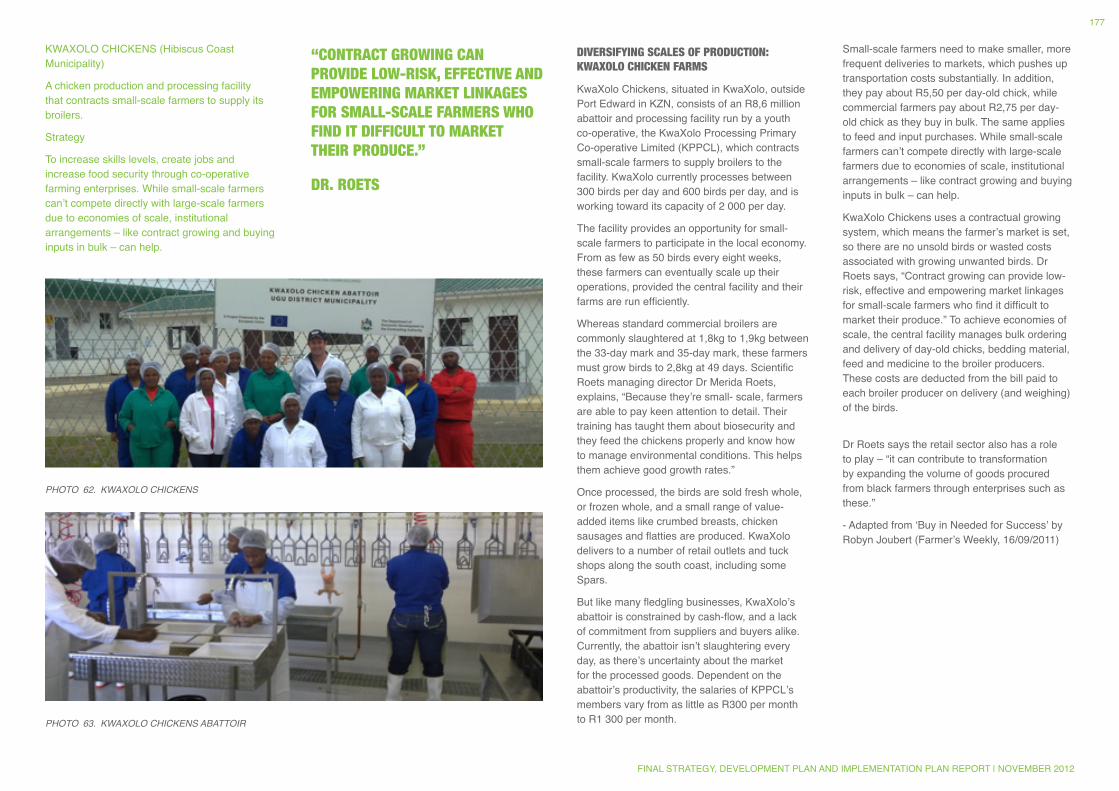
KWAXOLO CHICKENS (Hibiscus Coast Municipality)
A chicken production and processing facility that contracts small-scale farmers to supply its broilers.
Strategy
To increase skills levels, create jobs and increase food security through co-operative farming enterprises. While small-scale farmers can’t compete directly with large-scale farmers due to economies of scale, institutional arrangements – like contract growing and buying inputs in bulk – can help.
PHOTO 62. KWAXOLO CHiCKENS
PHOTO 63. KWAXOLO CHiCKENS ABATTOiR
DIVERSIFYING SCALES OF PRODUCTION: KWAXOLO CHICKEN FARMS
KwaXolo Chickens, situated in KwaXolo, outside Port Edward in KZN, consists of an R8,6 million abattoir and processing facility run by a youth co-operative, the KwaXolo Processing Primary Co-operative Limited (KPPCL), which contracts small-scale farmers to supply broilers to the facility. KwaXolo currently processes between 300 birds per day and 600 birds per day, and is working toward its capacity of 2 000 per day.
The facility provides an opportunity for small-scale farmers to participate in the local economy. From as few as 50 birds every eight weeks, these farmers can eventually scale up their operations, provided the central facility and their farms are run efficiently.
Whereas standard commercial broilers are commonly slaughtered at 1,8kg to 1,9kg between the 33-day mark and 35-day mark, these farmers must grow birds to 2,8kg at 49 days. Scientific Roets managing director Dr Merida Roets, explains, “Because they’re small- scale, farmers are able to pay keen attention to detail. Their training has taught them about biosecurity and they feed the chickens properly and know how to manage environmental conditions. This helps them achieve good growth rates.”
Once processed, the birds are sold fresh whole, or frozen whole, and a small range of value- added items like crumbed breasts, chicken sausages and flatties are produced. KwaXolo delivers to a number of retail outlets and tuck shops along the south coast, including some Spars.
But like many fledgling businesses, KwaXolo’s abattoir is constrained by cash-flow, and a lack of commitment from suppliers and buyers alike. Currently, the abattoir isn’t slaughtering every day, as there’s uncertainty about the market for the processed goods. Dependent on the abattoir’s productivity, the salaries of KPPCL’s members vary from as little as R300 per month to R1 300 per month.
Small-scale farmers need to make smaller, more frequent deliveries to markets, which pushes up transportation costs substantially. In addition, they pay about R5,50 per day-old chick, while commercial farmers pay about R2,75 per day-old chick as they buy in bulk. The same applies to feed and input purchases. While small-scale farmers can’t compete directly with large-scale farmers due to economies of scale, institutional arrangements – like contract growing and buying inputs in bulk – can help.
KwaXolo Chickens uses a contractual growing system, which means the farmer’s market is set, so there are no unsold birds or wasted costs associated with growing unwanted birds. Dr Roets says, “Contract growing can provide low-risk, effective and empowering market linkages for small-scale farmers who find it difficult to market their produce.” To achieve economies of scale, the central facility manages bulk ordering and delivery of day-old chicks, bedding material, feed and medicine to the broiler producers. These costs are deducted from the bill paid to each broiler producer on delivery (and weighing) of the birds.
Dr Roets says the retail sector also has a role to play – “it can contribute to transformation by expanding the volume of goods procured from black farmers through enterprises such as these.”
- Adapted from ‘Buy in Needed for Success’ by Robyn Joubert (Farmer’s Weekly, 16/09/2011)
“CONTRACT GROWING CAN PROVIDE LOW-RISK, EFFECTIVE AND EMPOWERING MARKET LINKAGES FOR SMALL-SCALE FARMERS WHO FIND IT DIFFICULT TO MARKET THEIR PRODUCE.”
DR. ROETS
FINAL STRATEGY, DEVELOPMENT PLAN AND IMPLEMENTATION PLAN REPORT | NOVEMBER 2012
177
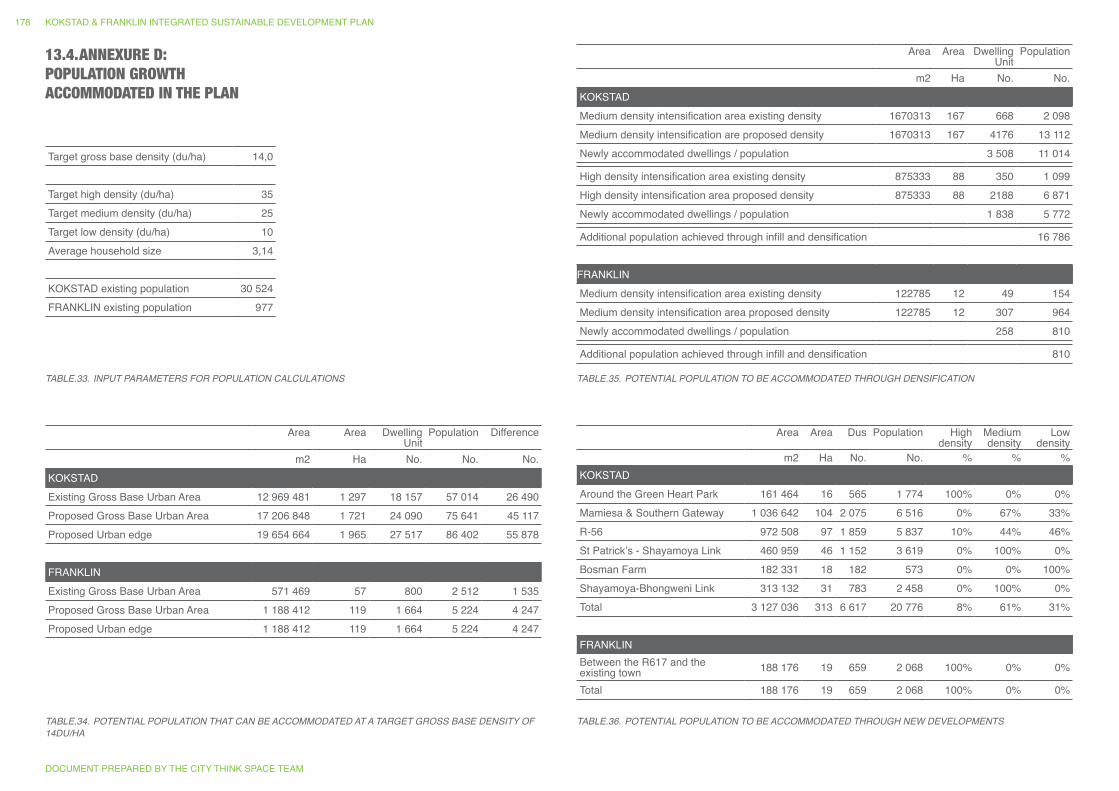
13.4. ANNEXURE D: POPULATION GROWTH ACCOMMODATED IN THE PLAN
Target gross base density (du/ha) 14,0
Target high density (du/ha) 35Target medium density (du/ha) 25Target low density (du/ha) 10Average household size 3,14
KOKSTAD existing population 30 524FRANKLIN existing population 977
TABLE.33. iNPUT PARAMETERS FOR POPULATiON CALCULATiONS
TABLE.34. POTENTiAL POPULATiON THAT CAN BE ACCOMMODATED AT A TARgET gROSS BASE DENSiTY OF 14DU/HA
TABLE.35. POTENTiAL POPULATiON TO BE ACCOMMODATED THROUgH DENSiFiCATiON
TABLE.36. POTENTiAL POPULATiON TO BE ACCOMMODATED THROUgH NEW DEVELOPMENTS
Area Area Dwelling Unit
Population Difference
m2 Ha No. No. No.KOKSTADExisting Gross Base Urban Area 12 969 481 1 297 18 157 57 014 26 490Proposed Gross Base Urban Area 17 206 848 1 721 24 090 75 641 45 117Proposed Urban edge 19 654 664 1 965 27 517 86 402 55 878
FRANKLINExisting Gross Base Urban Area 571 469 57 800 2 512 1 535Proposed Gross Base Urban Area 1 188 412 119 1 664 5 224 4 247Proposed Urban edge 1 188 412 119 1 664 5 224 4 247
Area Area Dwelling Unit
Population
m2 Ha No. No.KOKSTADMedium density intensification area existing density 1670313 167 668 2 098Medium density intensification are proposed density 1670313 167 4176 13 112Newly accommodated dwellings / population 3 508 11 014
High density intensification area existing density 875333 88 350 1 099High density intensification area proposed density 875333 88 2188 6 871Newly accommodated dwellings / population 1 838 5 772
Additional population achieved through infill and densification 16 786
FRANKLINMedium density intensification area existing density 122785 12 49 154Medium density intensification area proposed density 122785 12 307 964Newly accommodated dwellings / population 258 810
Additional population achieved through infill and densification 810
Area Area Dus Population High density
Medium density
Low density
m2 Ha No. No. % % %KOKSTADAround the Green Heart Park 161 464 16 565 1 774 100% 0% 0%Mamiesa & Southern Gateway 1 036 642 104 2 075 6 516 0% 67% 33%R-56 972 508 97 1 859 5 837 10% 44% 46%St Patrick’s - Shayamoya Link 460 959 46 1 152 3 619 0% 100% 0%Bosman Farm 182 331 18 182 573 0% 0% 100%Shayamoya-Bhongweni Link 313 132 31 783 2 458 0% 100% 0%Total 3 127 036 313 6 617 20 776 8% 61% 31%
FRANKLINBetween the R617 and the existing town 188 176 19 659 2 068 100% 0% 0%
Total 188 176 19 659 2 068 100% 0% 0%
DOCUMENT PREPARED BY THE CITY THINK SPACE TEAM
KOKSTAD & FRANKLIN INTEGRATED SUSTAINABLE DEVELOPMENT PLAN178
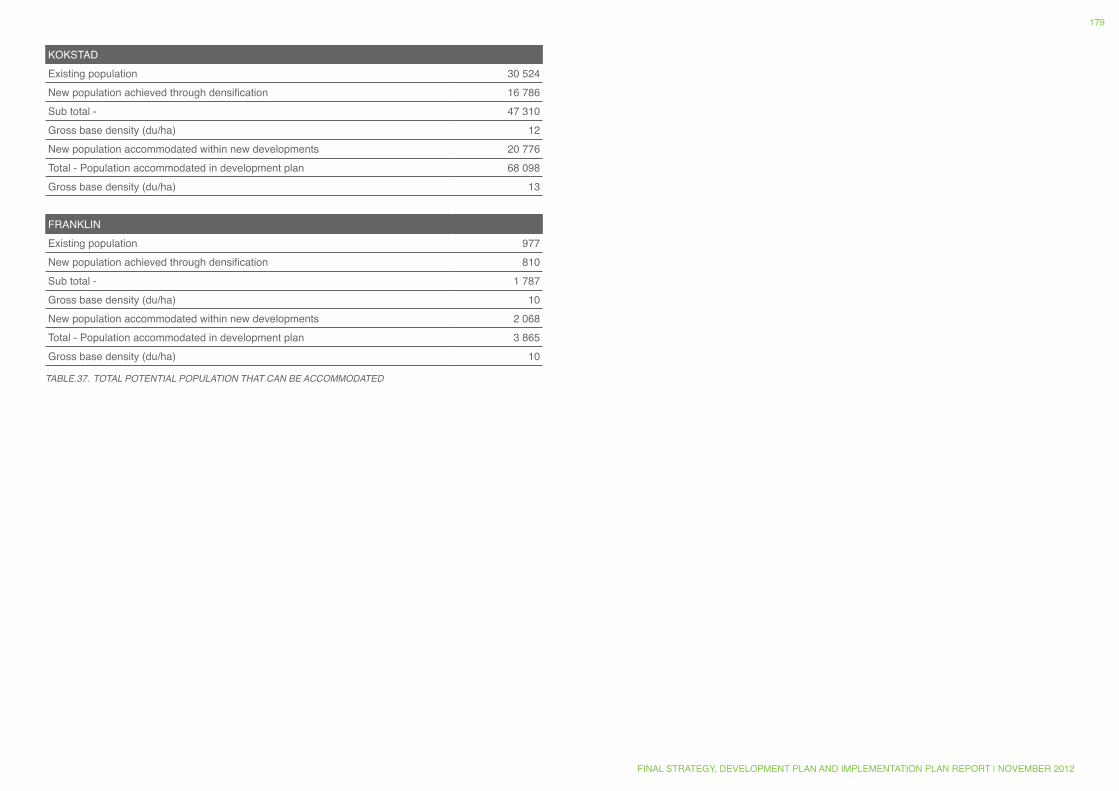
TABLE.37. TOTAL POTENTiAL POPULATiON THAT CAN BE ACCOMMODATED
KOKSTADExisting population 30 524New population achieved through densification 16 786Sub total - 47 310Gross base density (du/ha) 12New population accommodated within new developments 20 776Total - Population accommodated in development plan 68 098Gross base density (du/ha) 13
FRANKLINExisting population 977New population achieved through densification 810Sub total - 1 787Gross base density (du/ha) 10New population accommodated within new developments 2 068Total - Population accommodated in development plan 3 865Gross base density (du/ha) 10
FINAL STRATEGY, DEVELOPMENT PLAN AND IMPLEMENTATION PLAN REPORT | NOVEMBER 2012
179
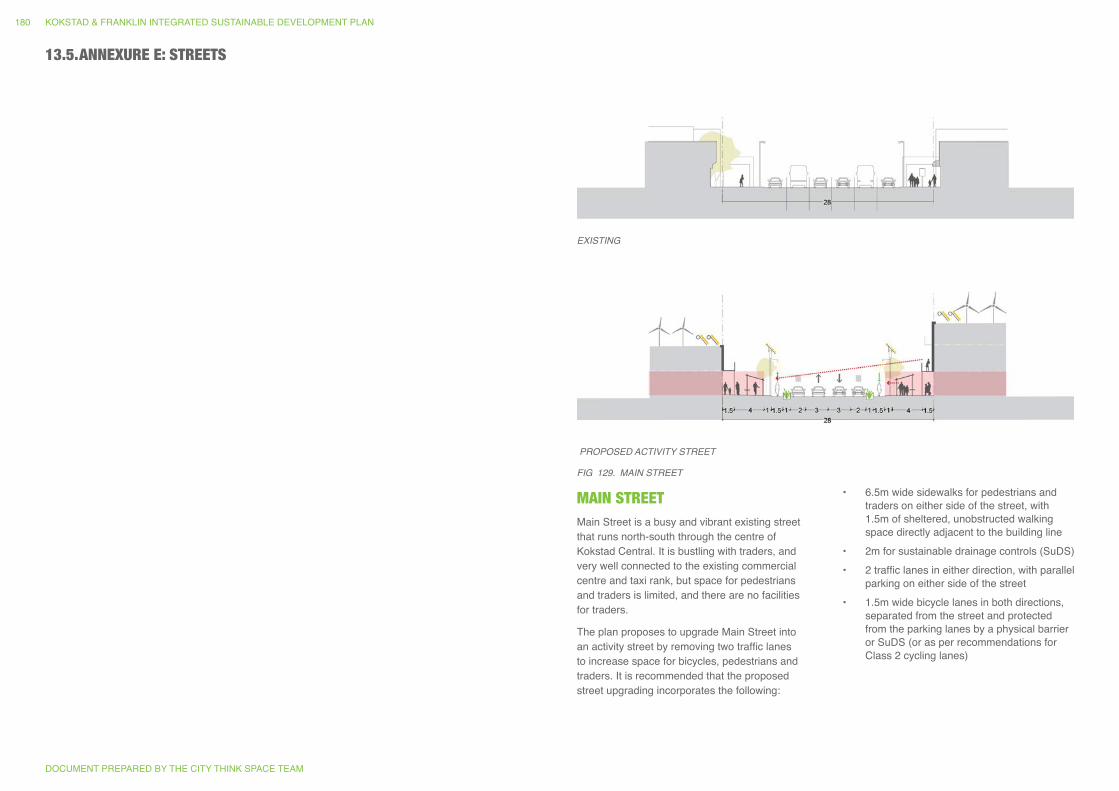
13.5. ANNEXURE E: STREETS
MAIN STREETMain Street is a busy and vibrant existing street that runs north-south through the centre of Kokstad Central. It is bustling with traders, and very well connected to the existing commercial centre and taxi rank, but space for pedestrians and traders is limited, and there are no facilities for traders.
The plan proposes to upgrade Main Street into an activity street by removing two traffic lanes to increase space for bicycles, pedestrians and traders. It is recommended that the proposed street upgrading incorporates the following:
• 6.5m wide sidewalks for pedestrians and traders on either side of the street, with 1.5m of sheltered, unobstructed walking space directly adjacent to the building line
• 2m for sustainable drainage controls (SuDS)• 2 traffic lanes in either direction, with parallel
parking on either side of the street• 1.5m wide bicycle lanes in both directions,
separated from the street and protected from the parking lanes by a physical barrier or SuDS (or as per recommendations for Class 2 cycling lanes)
EXiSTiNg
PROPOSED ACTiViTY STREET
Fig 129. MAiN STREET
DOCUMENT PREPARED BY THE CITY THINK SPACE TEAM
KOKSTAD & FRANKLIN INTEGRATED SUSTAINABLE DEVELOPMENT PLAN180
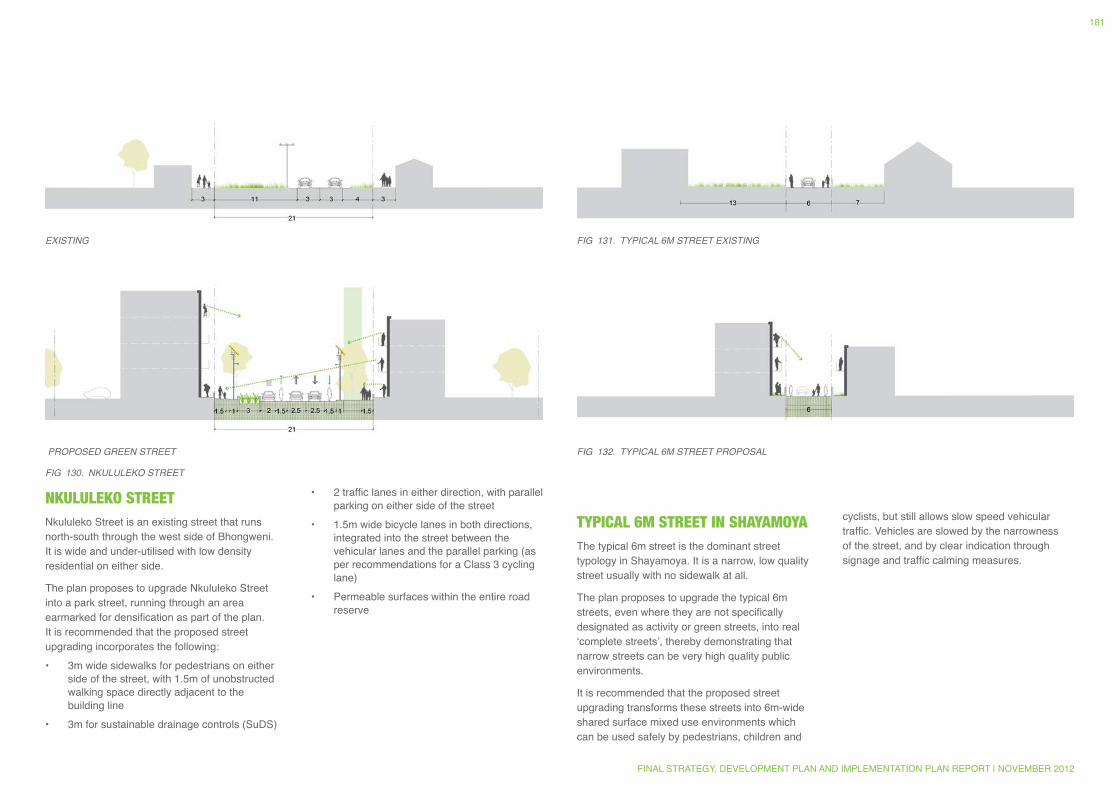
Fig 131. TYPiCAL 6M STREET EXiSTiNg
Fig 132. TYPiCAL 6M STREET PROPOSAL
EXiSTiNg
PROPOSED gREEN STREET
Fig 130. NKULULEKO STREET
NKULULEKO STREETNkululeko Street is an existing street that runs north-south through the west side of Bhongweni. It is wide and under-utilised with low density residential on either side.
The plan proposes to upgrade Nkululeko Street into a park street, running through an area earmarked for densification as part of the plan. It is recommended that the proposed street upgrading incorporates the following:• 3m wide sidewalks for pedestrians on either
side of the street, with 1.5m of unobstructed walking space directly adjacent to the building line
• 3m for sustainable drainage controls (SuDS)
• 2 traffic lanes in either direction, with parallel parking on either side of the street
• 1.5m wide bicycle lanes in both directions, integrated into the street between the vehicular lanes and the parallel parking (as per recommendations for a Class 3 cycling lane)
• Permeable surfaces within the entire road reserve
TYPICAL 6M STREET IN SHAYAMOYAThe typical 6m street is the dominant street typology in Shayamoya. It is a narrow, low quality street usually with no sidewalk at all.
The plan proposes to upgrade the typical 6m streets, even where they are not specifically designated as activity or green streets, into real ‘complete streets’, thereby demonstrating that narrow streets can be very high quality public environments.
It is recommended that the proposed street upgrading transforms these streets into 6m-wide shared surface mixed use environments which can be used safely by pedestrians, children and
cyclists, but still allows slow speed vehicular traffic. Vehicles are slowed by the narrowness of the street, and by clear indication through signage and traffic calming measures.
FINAL STRATEGY, DEVELOPMENT PLAN AND IMPLEMENTATION PLAN REPORT | NOVEMBER 2012
181
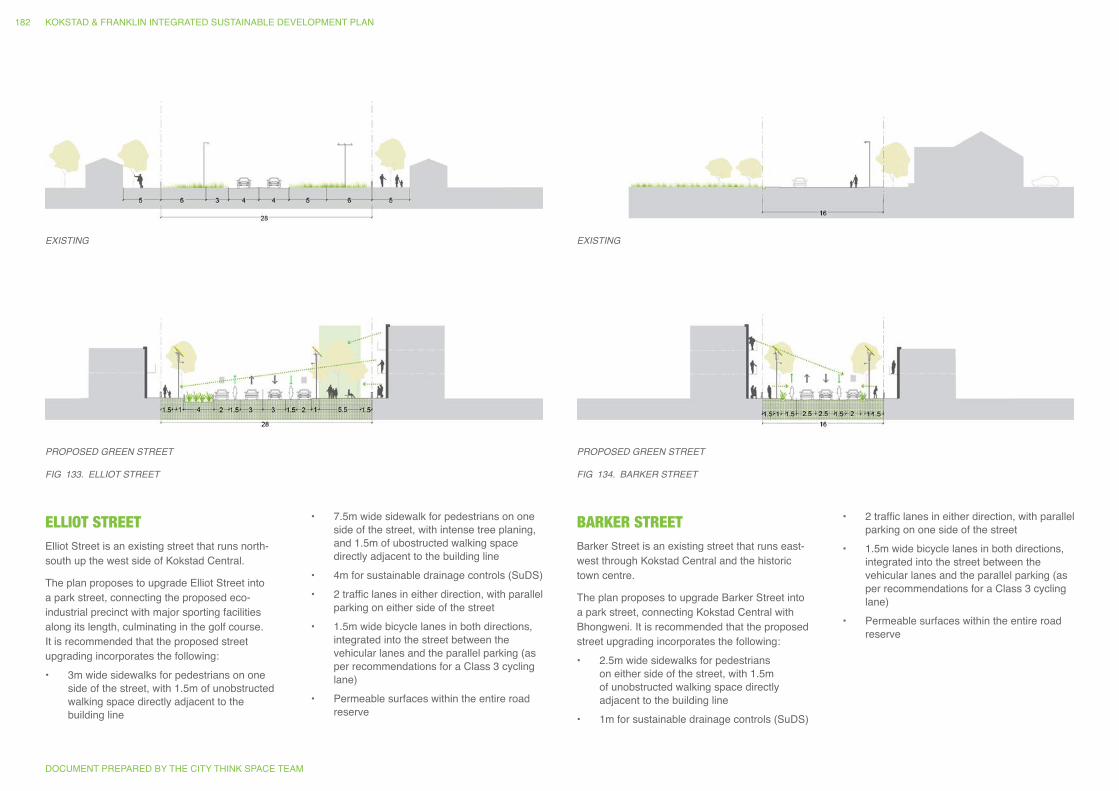
ELLIOT STREETElliot Street is an existing street that runs north-south up the west side of Kokstad Central.
The plan proposes to upgrade Elliot Street into a park street, connecting the proposed eco-industrial precinct with major sporting facilities along its length, culminating in the golf course. It is recommended that the proposed street upgrading incorporates the following:• 3m wide sidewalks for pedestrians on one
side of the street, with 1.5m of unobstructed walking space directly adjacent to the building line
• 7.5m wide sidewalk for pedestrians on one side of the street, with intense tree planing, and 1.5m of ubostructed walking space directly adjacent to the building line
• 4m for sustainable drainage controls (SuDS)• 2 traffic lanes in either direction, with parallel
parking on either side of the street• 1.5m wide bicycle lanes in both directions,
integrated into the street between the vehicular lanes and the parallel parking (as per recommendations for a Class 3 cycling lane)
• Permeable surfaces within the entire road reserve
Fig 133. ELLiOT STREET
EXiSTiNgEXiSTiNg
PROPOSED gREEN STREET PROPOSED gREEN STREET
Fig 134. BARKER STREET
BARKER STREETBarker Street is an existing street that runs east-west through Kokstad Central and the historic town centre.
The plan proposes to upgrade Barker Street into a park street, connecting Kokstad Central with Bhongweni. It is recommended that the proposed street upgrading incorporates the following:• 2.5m wide sidewalks for pedestrians
on either side of the street, with 1.5m of unobstructed walking space directly adjacent to the building line
• 1m for sustainable drainage controls (SuDS)
• 2 traffic lanes in either direction, with parallel parking on one side of the street
• 1.5m wide bicycle lanes in both directions, integrated into the street between the vehicular lanes and the parallel parking (as per recommendations for a Class 3 cycling lane)
• Permeable surfaces within the entire road reserve
DOCUMENT PREPARED BY THE CITY THINK SPACE TEAM
KOKSTAD & FRANKLIN INTEGRATED SUSTAINABLE DEVELOPMENT PLAN182
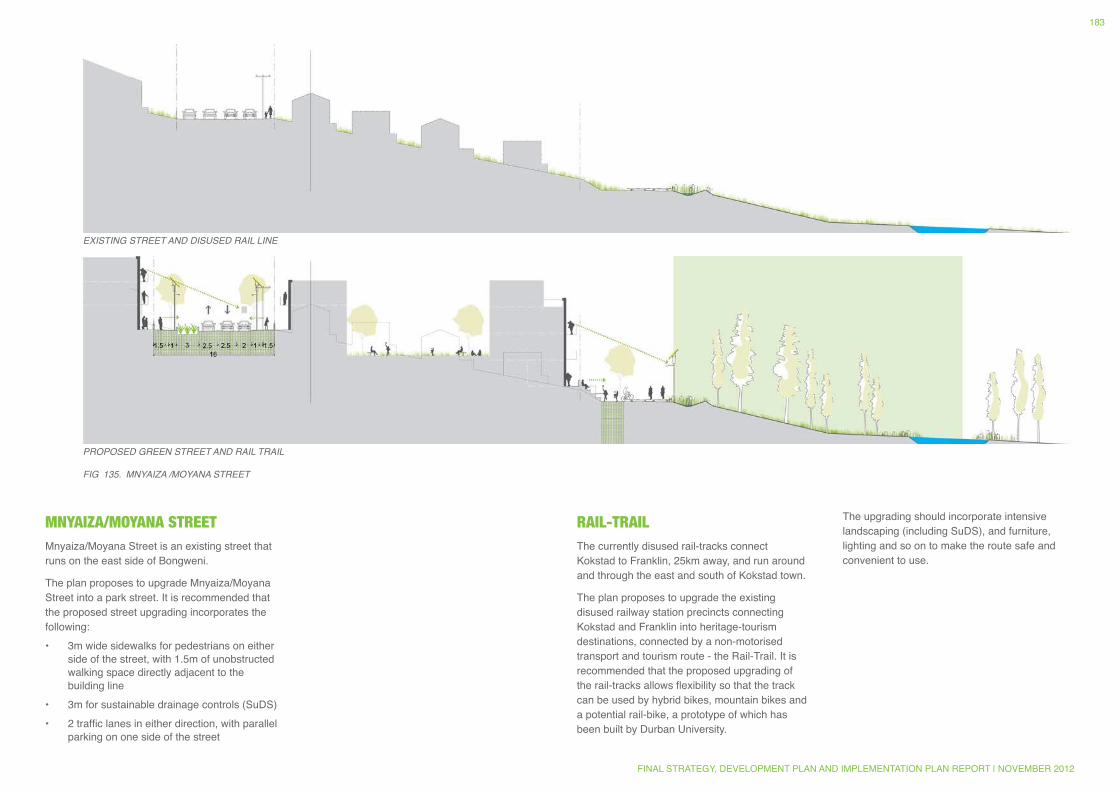
MNYAIZA/MOYANA STREETMnyaiza/Moyana Street is an existing street that runs on the east side of Bongweni.
The plan proposes to upgrade Mnyaiza/Moyana Street into a park street. It is recommended that the proposed street upgrading incorporates the following:• 3m wide sidewalks for pedestrians on either
side of the street, with 1.5m of unobstructed walking space directly adjacent to the building line
• 3m for sustainable drainage controls (SuDS)• 2 traffic lanes in either direction, with parallel
parking on one side of the street
RAIL-TRAILThe currently disused rail-tracks connect Kokstad to Franklin, 25km away, and run around and through the east and south of Kokstad town.
The plan proposes to upgrade the existing disused railway station precincts connecting Kokstad and Franklin into heritage-tourism destinations, connected by a non-motorised transport and tourism route - the Rail-Trail. It is recommended that the proposed upgrading of the rail-tracks allows flexibility so that the track can be used by hybrid bikes, mountain bikes and a potential rail-bike, a prototype of which has been built by Durban University.
The upgrading should incorporate intensive landscaping (including SuDS), and furniture, lighting and so on to make the route safe and convenient to use.
EXiSTiNg STREET AND DiSUSED RAiL LiNE
PROPOSED gREEN STREET AND RAiL TRAiL
Fig 135. MNYAiZA /MOYANA STREET
FINAL STRATEGY, DEVELOPMENT PLAN AND IMPLEMENTATION PLAN REPORT | NOVEMBER 2012
183
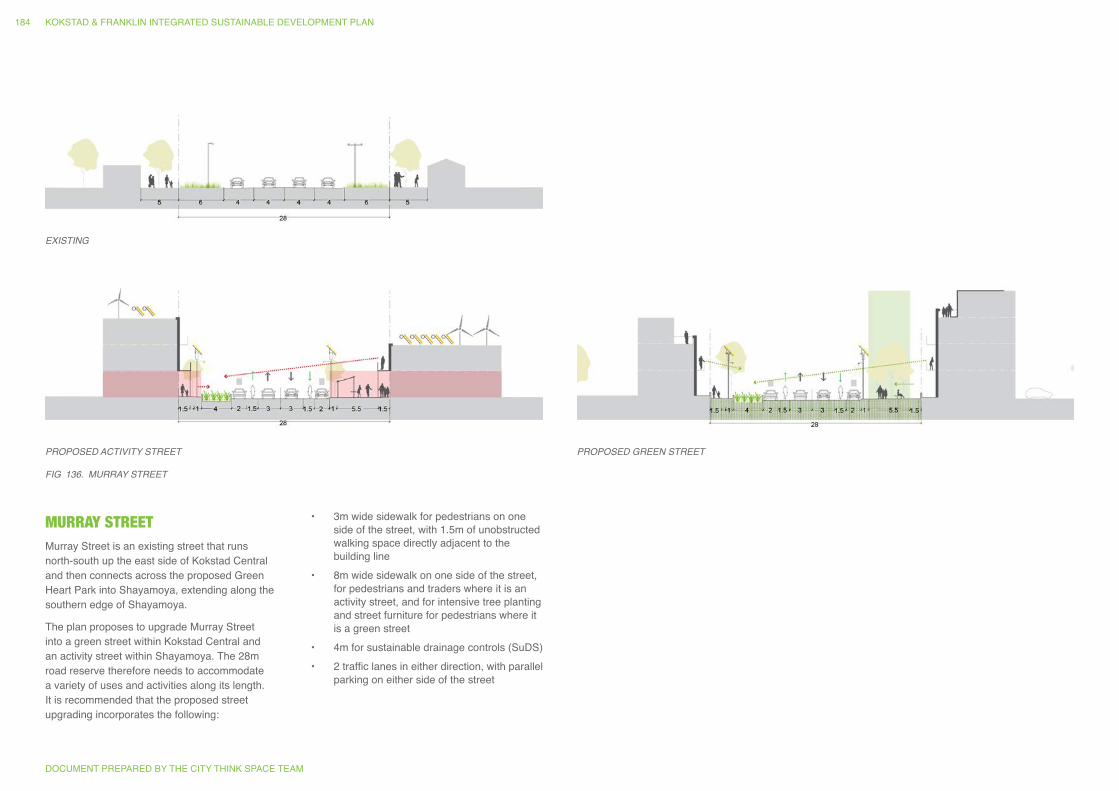
Fig 136. MURRAY STREET
EXiSTiNg
PROPOSED ACTiViTY STREET PROPOSED gREEN STREET
MURRAY STREETMurray Street is an existing street that runs north-south up the east side of Kokstad Central and then connects across the proposed Green Heart Park into Shayamoya, extending along the southern edge of Shayamoya.
The plan proposes to upgrade Murray Street into a green street within Kokstad Central and an activity street within Shayamoya. The 28m road reserve therefore needs to accommodate a variety of uses and activities along its length. It is recommended that the proposed street upgrading incorporates the following:
• 3m wide sidewalk for pedestrians on one side of the street, with 1.5m of unobstructed walking space directly adjacent to the building line
• 8m wide sidewalk on one side of the street, for pedestrians and traders where it is an activity street, and for intensive tree planting and street furniture for pedestrians where it is a green street
• 4m for sustainable drainage controls (SuDS)• 2 traffic lanes in either direction, with parallel
parking on either side of the street
DOCUMENT PREPARED BY THE CITY THINK SPACE TEAM
KOKSTAD & FRANKLIN INTEGRATED SUSTAINABLE DEVELOPMENT PLAN184
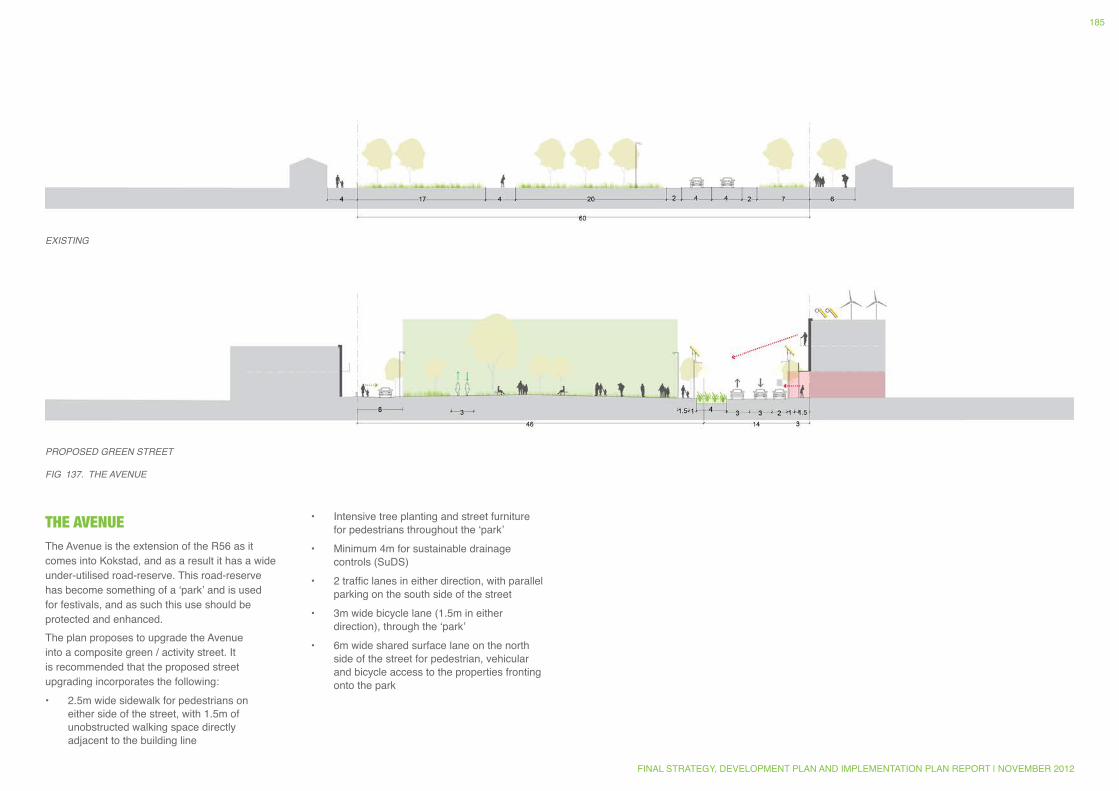
THE AVENUEThe Avenue is the extension of the R56 as it comes into Kokstad, and as a result it has a wide under-utilised road-reserve. This road-reserve has become something of a ‘park’ and is used for festivals, and as such this use should be protected and enhanced. The plan proposes to upgrade the Avenue into a composite green / activity street. It is recommended that the proposed street upgrading incorporates the following:• 2.5m wide sidewalk for pedestrians on
either side of the street, with 1.5m of unobstructed walking space directly adjacent to the building line
• Intensive tree planting and street furniture for pedestrians throughout the ‘park’
• Minimum 4m for sustainable drainage controls (SuDS)
• 2 traffic lanes in either direction, with parallel parking on the south side of the street
• 3m wide bicycle lane (1.5m in either direction), through the ‘park’
• 6m wide shared surface lane on the north side of the street for pedestrian, vehicular and bicycle access to the properties fronting onto the park
Fig 137. THE AVENUE
EXiSTiNg
PROPOSED gREEN STREET
FINAL STRATEGY, DEVELOPMENT PLAN AND IMPLEMENTATION PLAN REPORT | NOVEMBER 2012
185
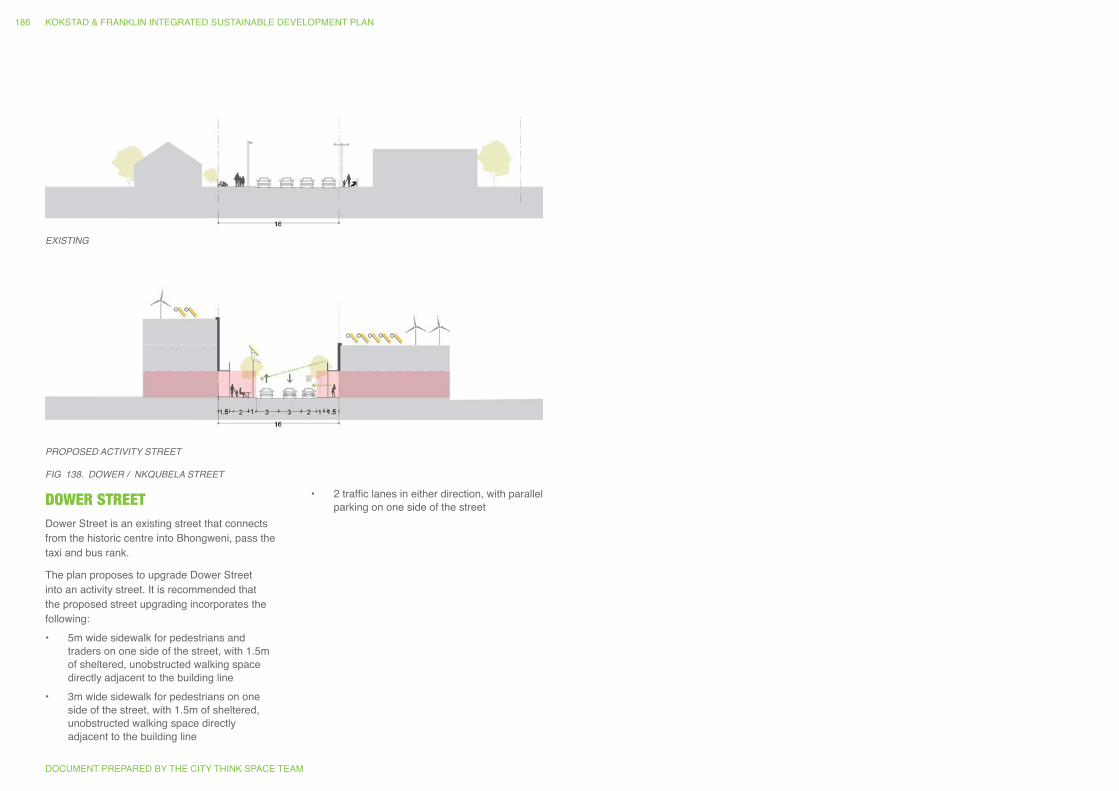
DOWER STREETDower Street is an existing street that connects from the historic centre into Bhongweni, pass the taxi and bus rank.
The plan proposes to upgrade Dower Street into an activity street. It is recommended that the proposed street upgrading incorporates the following:• 5m wide sidewalk for pedestrians and
traders on one side of the street, with 1.5m of sheltered, unobstructed walking space directly adjacent to the building line
• 3m wide sidewalk for pedestrians on one side of the street, with 1.5m of sheltered, unobstructed walking space directly adjacent to the building line
• 2 traffic lanes in either direction, with parallel parking on one side of the street
Fig 138. DOWER / NKQUBELA STREET
EXiSTiNg
PROPOSED ACTiViTY STREET
DOCUMENT PREPARED BY THE CITY THINK SPACE TEAM
KOKSTAD & FRANKLIN INTEGRATED SUSTAINABLE DEVELOPMENT PLAN186

FINAL STRATEGY, DEVELOPMENT PLAN AND IMPLEMENTATION PLAN REPORT | NOVEMBER 2012
187
13.6. ANNEXURE F: SETTLEMENT RESPONSE PROGRAMME EXPANDED INTRODUCTION PROGRAMME FOCUS AND AIMS
The desired outcome of the Settlement Response Programme is sustainable settlement growth. Residential development in Kokstad and Franklin is an opportunity to restructure the form of the settlements as a whole, through the creation of high quality sustainable living environments that are integrated; provide equitable access to opportunities and amenity; are diverse and locally appropriate; and are compact and efficient, optimizing natural, financial, infrastructure and human resources at all scales.
The current need for new residential provision and improved access to a diverse range of accommodation, in terms of form, tenure and affordability, parallel with the imperative of containing the development footprint, gives rise to a response that is essentially about intensification.
The key interventions identified for this programme are grouped as 3 sub-programmes that include seven capital investment projects and three support initiatives that are institutional or operational in nature.
POLICY CONTEXT
The opportunity for re-structuring the spatial form of post-apartheid SA (including in Kokstad), has so far, largely been missed, however the RDP mechanism has been replaced by the Integrated Residential Development Programme (IRDP) mechanism. This provides for the development of sites within a project for income groups that fall outside of the subsidy affordability bands, as well as non-residential sites.
The current KZN strategy indicates a policy shift from delivery of numbers and ownership, to sustainability, with emphasis on rental as a strategy for achieving this. Kokstad does not currently qualify for social housing funding as it
does not have the required Urban Re-structuring Zone (URZ) however application can be made to have URZ’s designated.
PROGRAMME COMPONENTS
The programme proposes that the GKM commits to three sub-programmes and projects:1. New integrated neighbourhoods• Pursue the R56 Integrated Sustainable
Settlement Project as a pilot, and include a mix of uses, typologies, tenure, and delivery agents.
• Plan new IDRP Project(s) within the existing urban footprint. Use the R56 concept as a reference. Package these parcels as one phased IRDP project even though the parcels are not contiguous. (Areas linking Shayamoya and Bhongweni to Old Town and sites alongside R56 to Franklin)
• Review current planned/approved projects in order to improve their sustainability as well as the sustainability of the town. Explore the feasibility of PPP arrangement that allows the GKM to apply for IRDP funding. (developer puts in the raw land and gets a portion of serviced land out).
The funding options available for these projects are:
integrated Residential Development Project (iRDP) Programme from Department of Human Settlements (DoHS)
Until some time ago, the subsidy instruments available for the development of Greenfields projects were limited as funding was only applicable to projects where all beneficiaries were subsidy qualifiers.
The Integrated Residential Development Programme replaced the Project Linked Subsidy Programme. The IRDP programme provides for planning and development of integrated housing projects. Projects can be planned and developed in phases and provides for a holistic development orientation.
PHASE 1: LAND, SERVICES AND TOWNSHIP PROCLAMATION
The first phase entails planning, land acquisition, township establishment and the provision of serviced residential and other land use stands to ensure a sustainable integrated community. Currently, the funding available for this Phase is R 23 403 per unit, of which R 3 834 is for professional fees and R 19 569 for internal roads and services.
PHASE 2: HOUSING CONSTRUCTION: INDIVIDUAL OWNERSHIP OPTIONS.
The second phase comprises the house construction phase for qualifying housing subsidy beneficiaries and the sale of stands to non-qualifying beneficiaries and to commercial interests etc. Currently the subsidy available for qualifying beneficiaries is R 58 825 and an additional “variation allowance” up to a maximum of 20% for site conditions, location, etc. can be granted making a maximum of R 70 590.
The IRDP programme provides a tool to plan and develop integrated settlements that include all the necessary land uses and housing types and price categories to become a truly integrated community.
The Programme in particular provides for planning and developing an integrated project, providing for the housing, social and economic needs of different income categories. It does away with the requirement found in other policy programmes to identify subsidised housing recipients up front and provides for both subsidised, as well as finance linked housing, social and rental housing, commercial, institutional and other land uses to be developed.
Owing to the holistic planning and development approach, the instrument also provides for substantial economies of scale to be realised. Integration is achieved through the provision of both bonded and subsidised housing in a mix appropriate to the projects location, which in turn lends itself to facilitating inclusionary housing development (which requires a certain number of affordable housing units to be delivered in any residential development).
Projects can be planned and developed in two phases. The first phase encompassing planning, land acquisition, township establishment and providing serviced residential stands in a variety of price categories as well as stands for other land uses to ensure a holistic and sustainable community. In the second phase houses are constructed for qualifying housing beneficiaries and the sale of stands to non-qualifying beneficiaries and to commercial interests etc. is undertaken.
In summary, the Integrated Residential Development Programme (IRDP) provides for a phased approach to provide for:A. Land acquisition where required;B. Township planning and municipal
engineering services design;C. The provision of municipal engineering
services to all the stands where no alternative funds are available;
D. Township establishment;E. The sale of the stands not identified for
subsidised housing created in the township; and
F. The construction of houses by registered contractors for housing subsidy beneficiaries who chose contractor built houses. This can be achieved through a variety of contracting options.
Where the need has been identified for the construction of rental housing on the stands created through the IRDP and or where beneficiaries elect to construct their own houses through the People’s Housing Process, the rules applicable to those specific programmes will apply to projects to be undertaken in the township.
This programme is ideally suited to large Greenfields projects such as the R56 where it is intended to develop a truly integrated new suburb.
MIG FUNDING
MIG funding is essential on large Greenfields projects, such as the R56. Depending on the
DOCUMENT PREPARED BY THE CITY THINK SPACE TEAM
KOKSTAD & FRANKLIN INTEGRATED SUSTAINABLE DEVELOPMENT PLAN188
budgets available to Sisonke District Municipality (water and sanitation) and GKM (roads and stormwater), it could be possible to provided bulk and internal roads and services to the R56 project using MIG and IRDP funding, as this is being achieved elsewhere in KZN. The design of the township is critical in achieving the correct densities and allocating costs to the MIG elements.
NER FUNDING
NER funding is critical on all projects but more so on new Greenfields projects as this will cover the provision of reticulation throughout the township. Funding is made available in phases and will only be released once the house construction process is started on any phase.
OTHER GOVERNMENT FUNDING
Again this funding is critical on IRDP projects to ensure that a truly integrated township is provided with the appropriate social and other amenities.
PRIVATE SECTOR
Private Sector funding will be required on IRDP and Social Housing projects, and will be required for FLISP.
On IRDP projects, private sector funding will be required to enable the “Gap” housing market to be reached. At present, this is proving difficult on projects driven by the private sector on privately owned land. However, on IRDP projects where the Municipality is the Developer, the land is often acquired by means of government funding and transferred to the Municipality. In these instances, the land cost has been fully subsidised and there are no “holding costs” and, if the IRDP funding and MIG funding is sufficient to provide roads and services to an appropriate level, it should be possible to make sites available to non-qualifying beneficiaries or private developers at cost which would be considerably lower that would be the case if the private developer had bought the land and serviced it.
RENTAL HOUSING
• Facilitate new Private Rental development within IRPD projects, including the R56 project. Make parcels of land available on condition the housing remains rental for a reasonable period.
• Apply for urban re-structuring zones to enable Social Housing and engage with potential SHI’s to co-develop feasibility studies
• Re-develop existing Community Residential Units sites in Bhongweni, Shayamoya and perhaps a new site in Franklin
The funding options available for these projects are:
COMMUNITY RESIDENTIAL UNITS (CRU) PROGRAMME
The Community Residential Units programme aims to facilitate the provision of secure, stable rental tenure for lower income persons. The programme provides a coherent framework for dealing with the many different forms of existing public sector residential accommodation. The previous allocation methodology for hostels only considered a “per-bed” approach which was not always favourable. Public stock was also not dealt with decisively and comprehensively.
The CRU programme targets low income persons and households earning below R3500 per month who are not able to be accommodated in the formal private rental and social housing market. The programme seeks to bridge the divide between social housing and lower markets which posed a significant problem.
The target market is households earning less than R 3 500 per month. The stock is owned by government, either Provincial or Local Government. In most cases Municipalities are the developers and owners of this stock.
The subsidy available is on a rate per square meter basis depending on the intervention required. The amount available is sufficient to provide adequate rental family accommodation of a robust and decent quality.
There is an existing CRU site in Bhongweni and this has been included in the “pipeline of
proposed projects” in the KZN Rental Strategy which was commissioned by SHRA on behalf of the KZN DoHS. The location of this site and site conditions appear suitable for a CRU project.
CRU subsidy amount: The last update on the amounts was done in 2009, and the maximum amount available is about R 8 000 per sq.m. for 3-storey walk-ups.
SOCIAL HOUSING PROGRAMME
The Social Housing Programme seeks to provide a rental or co-operative housing options for low income persons at a level of scale and built form which requires institutional management and which is to be provided by accredited social housing institutions and in designated restructuring zones.
The target market is households earning between R 1 500 and say R 12 000 per month, i.e. people who wish to rent and those who need to rent as they do not qualify for a subsidy to purchase a house and cannot obtain loan finance for this purpose.
Projects are implemented and owned by Social Housing Institutions which must be accredited by the Social Housing Regulatory Authority (SHRA).
Subsidies available are:
Capital restructuring Grant (National): R 125 615 if the income split is 30% under R 3 500 and 70% over. For every % above 30% there is an additional R 749 per unit up to a maximum of 70% of subsidies for incomes under R 3 500 – the accepted best mix is 50/50.
Provincial Top-Up: The latest amounts apply for topstructure, i.e. R 58 825 plus variation allowance up to a maximum of 20%. In some provinces the subsidy of R 23 403 for planning and services applies.
Total subsidy is around R 220 000 per unit.
The estimated cost for a mix of units ranging from 30 sq.m. to 45sqm is around R 300 000 per unit. Therefore there will be a shortfall in funding provided by DoHS and the SHI’s must provide any additional funding required over and above
the subsidies, usually by way of a loan from a financial institution.
Social Housing projects can only be undertaken within Urban Restructuring Zones (URZ). Thus Social Housing projects should be developed in areas that promote restructuring. Restructuring via social housing seeks to achieve three main dimensions of restructuring: • Spatial restructuring by bringing lower
income (and often disadvantaged) people into areas where there are major economic opportunities (both with respect to jobs and consumption) and from which they would otherwise be excluded because of the dynamics of the land market on the one hand and the effects of land use planning instruments such as large-lot zoning (minimum erf sizes). This it should be stressed is the primary meaning of spatial restructuring as it used in social housing policy. Indirectly social housing as understood here contributes to spatial restructuring by increasing densities and compacting growth thereby ensuring that the poor are not pushed out to marginal locations at the edge of the city.
• Social restructuring by promoting a mix of race and classes.
• Economic restructuring by promoting spatial access to economic opportunity and promoting job creation via the multiplier effect associated with building medium density housing stock.
The primary dimension of the meaning of restructuring is economic opportunity/access. It should be used to open up areas which have major economic opportunities and from which poor people have been excluded or to protect poor people from being displaced from areas with economic opportunity (e.g. inner cities experiencing a revival of property values and where rents are escalating).
A restructuring zone should be motivated on the basis that it contributes to all three types of restructuring. Promotion of economic access on its own is however not sufficient motivation. So too is race and class mix (where social
FINAL STRATEGY, DEVELOPMENT PLAN AND IMPLEMENTATION PLAN REPORT | NOVEMBER 2012
189
housing brings predominantly lower income people into higher income areas). Restructuring zones cannot be justified on the basis of spatial morphology alone (i.e. it cannot be solely motivated on the grounds that it contributes to changing the form of urban areas from low density areas with low-rise single unit dwellings to higher density areas with medium-rise buildings).
It is important to distinguish between “regeneration/urban renewal zones” and “restructuring zones”. Many local authorities have identified “regeneration/urban renewal” areas and as a general rule these are poor areas in need of upliftment and investment. They may be areas with significant latent economic potential but often they are not areas from which poor people have been excluded by virtue of the operation of the land market. In a South African context restructuring zones will often coincide with nodes and corridors of economic opportunity. Townships will not be restructuring areas although almost all will be regeneration areas. Of course there may be economic nodes and corridors within or abutting townships which could qualify as restructuring areas.
URZ’s have to be initiated by Municipality’s, approved by the Provincial DoHS and designated by National Government.
At present, there are no approved URZ’s in Kokstad but they have identified parcels of land which have been included in the “pipeline of proposed projects” in the KZN Rental Strategy which was commissioned by SHRA on behalf of the KZN DoHS.
Areas between the “townships” and town would be suitable for URZ’s. The R56 project proposal includes both Social Housing and CRU elements and the position of the R56 appears suitable for Social Housing.
On Social Housing projects the private sector funding is required to supplement the government funding which is normally not sufficient to provide rental housing stock at the required standard.
URBAN DENSIFICATION AND INTENSIFICATION
• Do detailed planning for densification of existing town, including changes to the Town Planning Zoning Scheme to enable private sector densification development.
The Finance Linked Individual Subsidy Programme (FLISP) provides a subsidy to qualifying beneficiaries who have secured mortgage finance to acquire an existing house or a vacant residential serviced stand linked to a house construction contract. The objective of the Programme is to reduce the initial mortgage loan amount to render the monthly loan repayment installments affordable over the loan repayment term and/or to make good any shortfall between the qualifying loan amount and the total product price subject to the conditions of the Programme. This group of people must satisfy the qualification criteria for the subsidy and the type of assistance may vary depending on a beneficiary’s circumstances.
This Programme intends to give effect to the Government’s objective to provide housing assistance to the gap market, assisting them to enter the mortgagee housing market by providing a once off down payment scheme to individual households who are able to access mortgage finance to acquire residential properties for the first time. In addition, persons who have acquired vacant serviced stands without state assistance and who need assistance to access mortgage finances to fund the construction of their houses may also apply for FLISP subsidies.
The Programme provides individual subsidies linked to the household income of the applicant and is subject to the approval of a mortgage loan. All applicants must satisfy the qualification criteria to enable them access to the benefits of the Programme. Households will only be able to access one Finance Linked Individual Subsidy.
The FLISP subsidy will be a once-off subsidy, to qualifying beneficiaries who will not qualify for any further or other state-assisted housing assistance and is only available to a first time home owner.
The 2012 income category for the FLISP is R3 501 to R15 000 per month. The quantum of the FLISP subsidy varies from R 87 000 for beneficiaries earning between R 3 501 and R 3 600 per month to R 10 050 for beneficiaries earning between R 14 901 and R 15 000 per month. It may be utilised to meet any deposit requirements that may be imposed by the relevant financial institution and if the amount is enough for the deposit, the lender will not pay any further deposit.
The value of the property may not exceed the maximum property value set for the Programme as announced from time to time. The current property value is set at R300 000, 00.
This programme will work well in conjunction with IRDP projects, such as the R56, or for densification of existing areas for GAP Housing.
Alignment and integration with other programmes
This programme is closely aligned with all of the infrastructure programmes, and the Green Building Programme. New settlement projects must take cognizance of these. It is also aligned with the Public Space, Street and Facility Investment Programme, as well as the Localised Economy Programme, which aim to improve the long term sustainability of the whole town. The GKM’s Kokstad Integrated Sustainable Settlements (KISS) Programme and the R56 project are aligned with the intentions of this ISDP.
DOCUMENT PREPARED BY THE CITY THINK SPACE TEAM
KOKSTAD & FRANKLIN INTEGRATED SUSTAINABLE DEVELOPMENT PLAN190

FINAL STRATEGY, DEVELOPMENT PLAN AND IMPLEMENTATION PLAN REPORT | NOVEMBER 2012
191

14. APPENDICESThe appendices listed below are available on the attached CD or upon request ([email protected]):
1. Kokstad ISDP - Kokstad-Franklin Ecosystem Services Supply and Demand Analysis, FutureWorks (2012)
2. Kokstad ISDP - Results of a Municipal Services Financial Model for Greater Kokstad Local Municipality - Report, PDG (2012)
3. Kokstad ISDP - Results of a Municipal Services Financial Model for Greater Kokstad Local Municipality - Presentation, PDG (2012)
4. Kokstad ISDP - LED Analysis and Proposals, Lees & Associates (2012)
5. Kokstad ISDP - Proposed and Priority Project Sheets, CTS Team and Subcontractors (2012)
6. Kokstad ISDP – Green Ambassador Report, Meshfield (2012)
7. Kokstad ISDP - Stakeholder Engagement Records (DPA) 2012
8. Kokstad ISDP Status Quo - Human Settlement Desktop Evaluation, Lees & Associates (2012)
9. Kokstad ISDP Status Quo - Human Settlement Field Work Report, Lees & Associates (2012)
10. Kokstad ISDP Status Quo - Land Report Annexure, SSI (2012)
11. Kokstad ISDP Status Quo - Land Report, SSI (2012)
12. Kokstad ISDP Status Quo - Social Capital Report, Lees & Associates (2012)
13. Kokstad ISDP Status Quo – Infrastructure Desktop Analysis, SSI (2012)
14. Kokstad ISDP Status Quo: Economic Analysis, Focus Project Management (2012)
DOCUMENT PREPARED BY THE CITY THINK SPACE TEAM
KOKSTAD & FRANKLIN INTEGRATED SUSTAINABLE DEVELOPMENT PLAN192

FINAL STRATEGY, DEVELOPMENT PLAN AND IMPLEMENTATION PLAN REPORT | NOVEMBER 2012
193
Recommended