Measuring the Value of SuppliersAssociate Professor, Ph.D., Kim Sundtoft Hald

2
Agenda
Time (approximate) Theme
14:00-14:30 Welcome
14:30-15:30 Value Drivers in Supplier Relationships (Workshop 1)
15:30-15:45 Coffe Break
15:45-16:45 Value Measurement (Workshop 2)
16:45-17:00 Wrap up

Value Drivers in Supplier Relationships

4
Understanding value is the key for understanding
exchange
Value = the cornerstone of business market management(Anderson and Narus, 1999)
Value creation = the essential purpose for a relationship (Anderson, 1995; Grönroos, 1997; Wilson, 1995)
Value = a trade-off between benefits and sacrifices (Sinha and DeSarbo, 1998; Ulaga, 1999; Woodruff, 1997)
Ritter (2014)

5
There are many views on value
Cost of ownership
Purchasing costs
Product value
Relationship value
Network value
Time
Value = - price - production costs + sales price premium + extras+ other relationships
Ritter (2014)

6
Value is central in the value chain
7
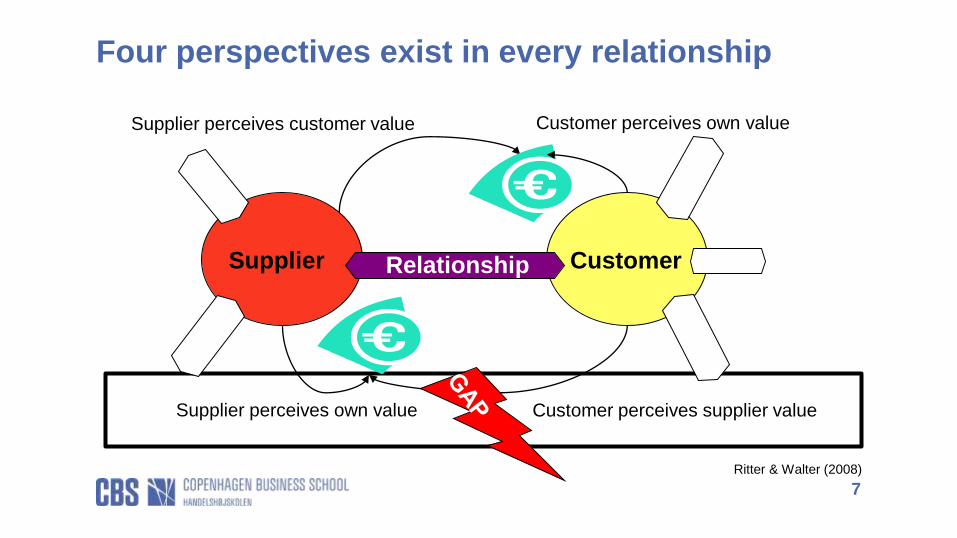
Four perspectives exist in every relationship
Ritter & Walter (2008)
Supplier CustomerRelationship
Supplier perceives customer value
Supplier perceives own value Customer perceives supplier value
Customer perceives own value

8
Value: (Benefits – Costs)
Perceived Value (PV) =Perceived
Benefits
Perceived
Costs-
When (PV > 0) there is a perceived payoff from the supplier relationship
and thus an incentive to engage in it
9
Relationship Benefits
• Product Quality
• Delivery Performance
• Service Support
• Personal Interaction
• Supplier Know-how
• Time-to-Market
Relationship Costs
• Direct product costs
• Process costs
Value Drivers in Supplier Relationships

10
Relationship Value
Relationship Benefits
Relationship Costs
CoreBenefits
SourcingBenefits
OperationsBenefits
DirectCosts
AcquisitionCosts
OperationsCosts
Ulaga and Eggert (2006)
Drivers of value creation opportunity

11
Value as comparison over time or across the Supply network
Outcomes given
comparison level (CL)(Obtained Value) > = < (Expected value (CL))
?
Comparing over Time
Based on Anderson & Narus (1984, 1990)
Comparison Level for
alternatives (CLALT)(Obtained Value) > = < (Alternative value (CLALT)
?
Comparing across the Supply Network

Value measurement
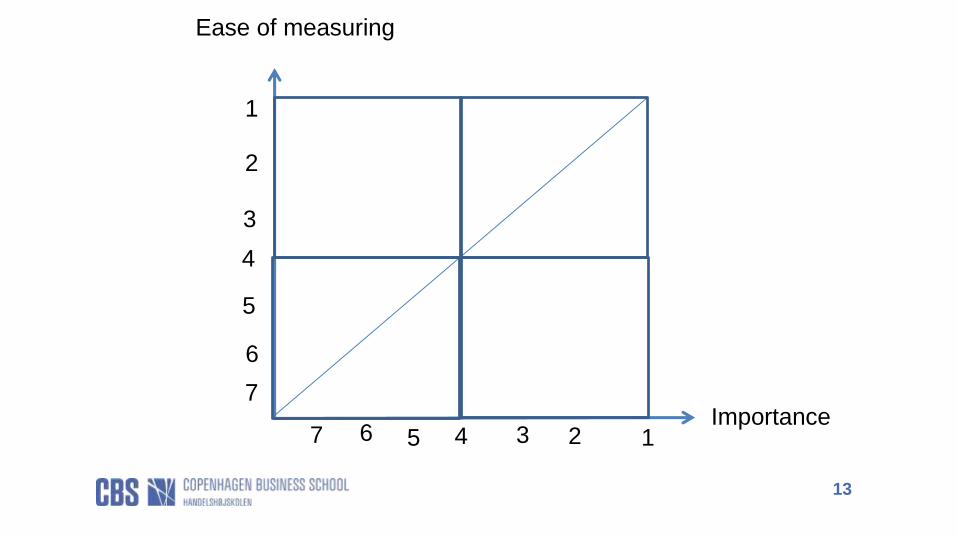
13
Importance
Ease of measuring
7
6
67 5
5
4
3
2
1
4 3 2 1
14
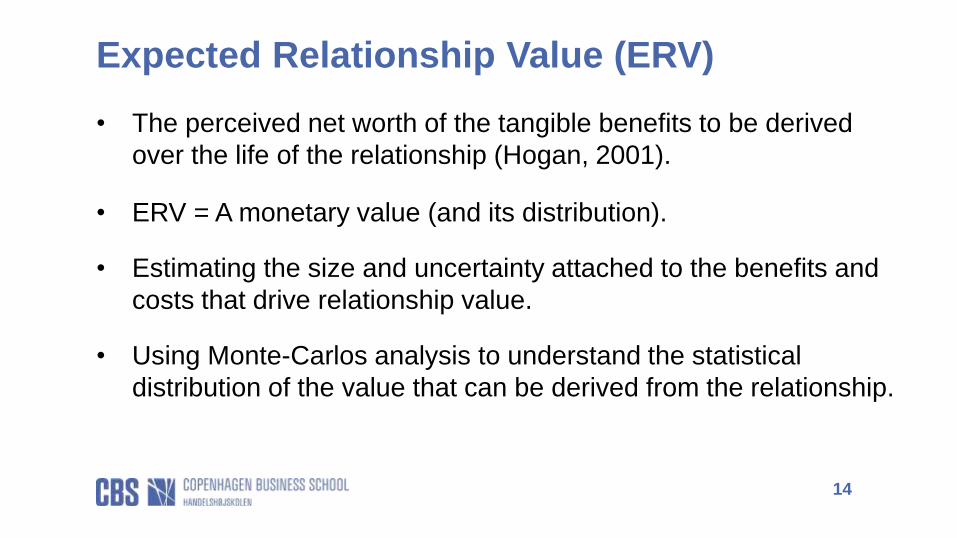
• The perceived net worth of the tangible benefits to be derived
over the life of the relationship (Hogan, 2001).
• ERV = A monetary value (and its distribution).
• Estimating the size and uncertainty attached to the benefits and
costs that drive relationship value.
• Using Monte-Carlos analysis to understand the statistical
distribution of the value that can be derived from the relationship.
Expected Relationship Value (ERV)

15
Hogan (2001)

16
Hogan (2001)
17
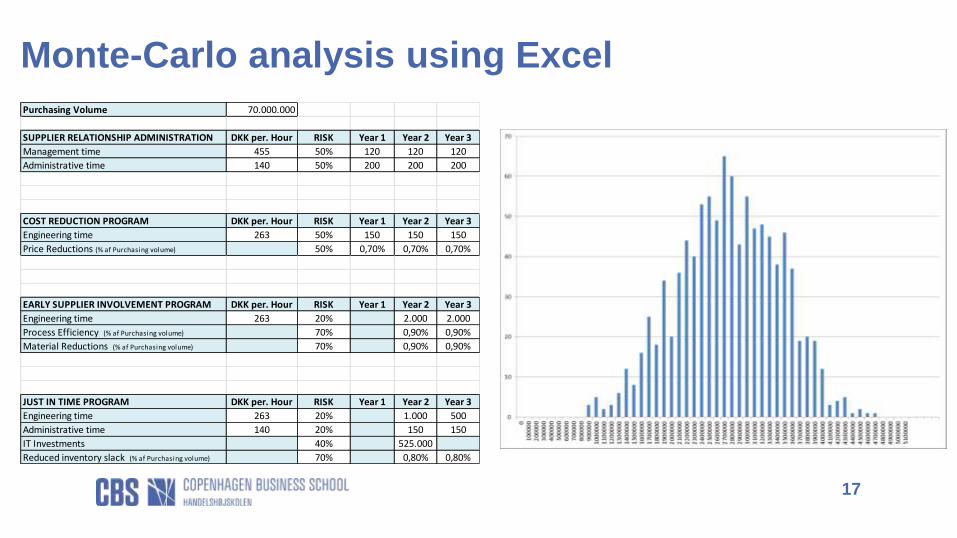
Monte-Carlo analysis using Excel
Purchasing Volume 70.000.000
SUPPLIER RELATIONSHIP ADMINISTRATION DKK per. Hour RISK Year 1 Year 2 Year 3
Management time 455 50% 120 120 120
Administrative time 140 50% 200 200 200
COST REDUCTION PROGRAM DKK per. Hour RISK Year 1 Year 2 Year 3
Engineering time 263 50% 150 150 150
Price Reductions (% af Purchasing volume) 50% 0,70% 0,70% 0,70%
EARLY SUPPLIER INVOLVEMENT PROGRAM DKK per. Hour RISK Year 1 Year 2 Year 3
Engineering time 263 20% 2.000 2.000
Process Efficiency (% af Purchasing volume) 70% 0,90% 0,90%
Material Reductions (% af Purchasing volume) 70% 0,90% 0,90%
JUST IN TIME PROGRAM DKK per. Hour RISK Year 1 Year 2 Year 3
Engineering time 263 20% 1.000 500
Administrative time 140 20% 150 150
IT Investments 40% 525.000
Reduced inventory slack (% af Purchasing volume) 70% 0,80% 0,80%

Wrap up

19
• Value Drivers in Supplier Relationships.
• What are they in your firm? Your sourcing operation?
• Qualitative assessment (comparing).
• Expected Relationship Value (ERV)
• Make an influence Diagram.
• Assessment of benefits/costs
• Assessment of uncertainties.
• Monte-Carlos analysis (using Excel or other more advance software)
Summary

20
• Multiple applications of the ERV-model in case firms
• How does ERV work in advanced settings?
• What are the obstacles using this approach?
• Access and accuracy of data available in the firm?
• Survey on the practices of value assessment in supplier relationships
• How do firms measure supplier value?
• How advanced are the methods of assessment?
• When are the methods more advanced?
Next steps in the project

Join us on
bit.ly/CBSCompeteLinkedIn

22
Kim Sundtoft Hald,
Associate Professor, Ph.D.
Copenhagen Business School, Department of Operations Management
Solbjerg Plads 3, 2000 Frederiksberg, Denmark
Mobile: +45 23 72 23 03
E-mail: [email protected]
Contact Details
Recommended