Key BC Silviculture Key BC Silviculture StatisticsStatistics
Key BC Silviculture Key BC Silviculture StatisticsStatistics
Forest Practices BranchForest Practices BranchBC Forest Service BC Forest Service
September 8, 2009 September 8, 2009

ObjectivesObjectivesObjectivesObjectives
To share key statistics on silviculture in BCTo share key statistics on silviculture in BC Purpose to give context for moving forward and Purpose to give context for moving forward and
improving BC’s silviculture programsimproving BC’s silviculture programs To illustrate management levels on TSAs vs To illustrate management levels on TSAs vs
other tenuresother tenures To illustrate some reforestation and tending To illustrate some reforestation and tending
opportunities for the futureopportunities for the future


How many silvicultureHow many silviculturefunding sourcesfunding sources
How many silvicultureHow many silviculturefunding sourcesfunding sources
There have been 43 There have been 43 different funding different funding sources used to datesources used to date
Only one funding Only one funding approach has lasted approach has lasted 21 years and delivered 21 years and delivered $200 million per year $200 million per year in silv fundingin silv funding
Assigned Funding Source Code to Fund Category to generalize for graph
SILV_FUND_SRCE_CO
DE DESCRIPTION Fund Category EFFECTIVE_DATE EXPIRY_DATE
BCT BC Timber Sales Legal-BCTS 2003-04-01 9999-12-31
CL Catastrophic Losses Non-legal 1905-01-01 2007-09-30
FID Forest Investment Account - FRPA 108 Non-legal 2003-04-01 2006-09-14
FIL Forest Investment Account - licensee administered Non-legal 2003-04-01 9999-12-31
FIM Forest Investment Account - ministry administered Non-legal 2003-04-01 9999-12-31
FIV Forest Investment Vote Non-legal 2002-04-02 9999-12-31
FMC COMFOR Non-legal 1905-01-01 2007-09-30
FME Forest Worker Development Program (non-MOF funded) Non-legal 1905-01-01 2007-09-30
FMY Youth Fund Non-legal 1905-01-01 2007-09-30
FR FRDA I & II Non-legal 1905-01-01 2007-09-30
FRP FRPA - Application For Relief Non-legal 2005-08-01 9999-12-31
FTL Forests for Tomorrow Lic Admin Non-legal 2005-04-01 9999-12-31
FTM Forests for Tomorrow MOF Admin Non-legal 2005-04-01 9999-12-31
GA Other Agencies or Voluntary Work Non-legal 1905-01-01 9999-12-31
GAC Corrections Non-legal 1905-01-01 9999-12-31
GFS Forest Stand Management Fund Legal-FSMF 1905-01-01 9999-12-31
GJF Job Creation, Federal Non-legal 1905-01-01 9999-12-31
GJJ Job Creation, Joint Non-legal 1905-01-01 9999-12-31
GJM Job Creation, MOF Non-legal 1905-01-01 9999-12-31
IA Industrial Appraisal Legal-Licensee 1905-01-01 9999-12-31
IIR Industrial Incr., Required Legal-Licensee 1905-01-01 9999-12-31
IIV Industrial Incr., Voluntary Non-legal 1905-01-01 9999-12-31
IO Industry Outstanding Non-legal 1905-01-01 2008-08-26
IR Industry Royalties Non-legal 1905-01-01 9999-12-31
LFP Licensee Funded Program Legal-Licensee 1905-01-01 9999-12-31
M Ministry Non-legal 1905-01-01 2003-03-31
O Operational Non-legal 1905-01-01 9999-12-31
RBC Forest Renewal B.C. Non-legal 1905-01-01 2007-09-30
RBL Forest Renewal B.C. - licensee administered Non-legal 1997-08-13 2003-03-31
RBM Forest Renewal B.C. - ministry administered Non-legal 1997-08-13 2003-03-31
S Section 88 Non-legal 1905-01-01 2007-09-30
SBF BC Timber Sales Legal-BCTS 1905-01-01 2003-03-31
SMF South Moresby Forest Replacement Account Non-legal 1905-01-01 9999-12-31
TSC Tree Seed Centre Non-legal 2005-09-13 9999-12-31
VCV Provincial Contingency Vote (Special Use Only) Non-legal 2007-08-01 9999-12-31
VFH Forest Health Non-legal 1905-01-01 2003-03-31
VFP Current Reforestation Non-legal 1905-01-01 2003-03-31
VG Ministry Outstanding Non-legal 1905-01-01 2003-03-31
VI Provicial Incremental Non-legal 1905-01-01 2007-09-30
VOB Ministry Vote, SBEP Non-legal 1905-01-01 2007-09-30
VOI Industry Outstanding Non-legal 1905-01-01 2003-03-31
VRT Afforestation Non-legal 1905-01-01 2007-09-30
XXX No Funding Source Non-legal 1905-01-01 9999-12-31

How do basic silviculture cost estimates How do basic silviculture cost estimates for appraisals relate to site productivityfor appraisals relate to site productivityHow do basic silviculture cost estimates How do basic silviculture cost estimates for appraisals relate to site productivityfor appraisals relate to site productivity
SITE INDEX
Cost Range a 0-12 b 13-17 c 18-23 d 24-28 e 29-33 f 34-38 g >38Grand Total
0.00% 0.01% 0.00% 0.00% 0.00% 0.00% 0.00% 0.01%
a 0-500 4.51% 14.43% 18.19% 1.33% 0.02% 0.00% 0.00% 38.48%
b 501-900 1.35% 6.28% 8.73% 0.91% 0.03% 0.00% 0.00% 17.31% 55.79%
c 901-1300 0.75% 4.20% 6.51% 0.59% 0.02% 0.00% 0.00% 12.07%
d 1301-1700 0.49% 2.81% 4.41% 0.62% 0.05% 0.00% 0.00% 8.39%
e 1701-2100 0.33% 2.20% 3.36% 0.49% 0.03% 0.00% 0.00% 6.41% 26.88%
f 2101-2500 0.30% 1.31% 2.34% 0.25% 0.01% 0.00% 0.00% 4.21%
g 2501-2900 0.14% 0.89% 1.36% 0.22% 0.01% 0.00% 0.00% 2.63%
h >2900 0.69% 3.62% 5.36% 0.80% 0.02% 0.00% 0.00% 10.48% 17.32%
Grand Total 8.57% 35.75% 50.27% 5.21% 0.18% 0.01% 0.01% 100.00%
site class lowpoor to
med med good good good good
percent area in class 44% 50.27% 5%

Does Agency or Tenure currently Does Agency or Tenure currently effect basic silviculture performanceeffect basic silviculture performance
Does Agency or Tenure currently Does Agency or Tenure currently effect basic silviculture performanceeffect basic silviculture performance

Does Agency or Tenure currently Does Agency or Tenure currently effect total silviculture performanceeffect total silviculture performance
Does Agency or Tenure currently Does Agency or Tenure currently effect total silviculture performanceeffect total silviculture performance

Silviculture is a keystone tool used to Silviculture is a keystone tool used to maintain the inherited estate for current maintain the inherited estate for current
and future generationsand future generations
Silviculture is a keystone tool used to Silviculture is a keystone tool used to maintain the inherited estate for current maintain the inherited estate for current
and future generationsand future generations
estimated standing tree value of the estimated standing tree value of the estate is estate is $1/4 trillion$1/4 trillion
It generates up to $15 billion/year in It generates up to $15 billion/year in exportsexports
It generates up to $1.2 billion/year It generates up to $1.2 billion/year in stumpage, rents and feesin stumpage, rents and fees
Industry and TSP spend ~ $200 Industry and TSP spend ~ $200 million/yr in basic maintenance million/yr in basic maintenance (silv) –(silv) –1.3% of export values 1.3% of export values
This year $45 million in This year $45 million in incremental enhancements -0.30% incremental enhancements -0.30% of export valuesof export values

A good foundation to start fromA good foundation to start fromA good foundation to start fromA good foundation to start from
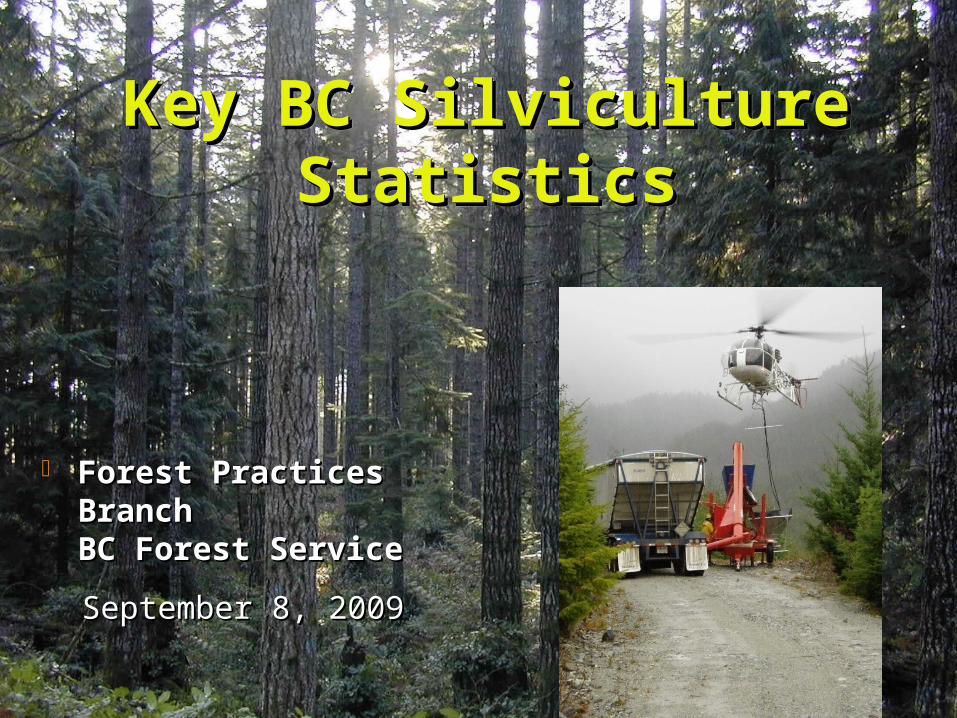
Average Delay in reforesting areas after harvesting
0
5
10
15
20
1970 1973 1976 1979 1982 1985 1988 1991 1994 1997 2000
Calendar year
Year
s
19871987
In the last few years In the last few years 82% of harvested 82% of harvested areas are planted areas are planted within 1.7 yearswithin 1.7 years
22 different tree 22 different tree species plantedspecies planted

Basic silviculture - aBasic silviculture - agreat industry success storygreat industry success story
Basic silviculture - aBasic silviculture - agreat industry success storygreat industry success story
Before 87 After 1987
% area planted 50% 73%
% survival 50% 93%
average RD 8-20 yrs 1-5 yrs
time to 3 metres 15-20 yrs 10-15 yrs
timeliness oftreatments
P H

Planting DensitiesBased on taking sum of planted trees/planted area
Data source: RESULTS as of December 11, 2008,
PL Yr BCTS GOV IND1995 1,383 1,204 1,2041996 1,367 1,089 1,2171997 1,380 1,043 1,3271998 1,306 1,136 1,3251999 1,408 1,173 1,3672000 1,359 1,104 1,3142001 1,347 1,198 1,3432002 1,377 1,259 1,3142003 1,400 1,237 1,2672004 1,410 1,170 1,2782005 1,402 1,379 1,2922006 1,397 1,376 1,2962007 1,459 1,257 1,3042008 1,399 1,192 1,230
average 1,385 1,201 1,291

free growing stand densities as free growing stand densities as reported since January 2006reported since January 2006
free growing stand densities as free growing stand densities as reported since January 2006reported since January 2006
on average at the free growing declaration on average at the free growing declaration the coast is achieving 86% of target free growing target number of well spaced the coast is achieving 86% of target free growing target number of well spaced
trees per hectaretrees per hectare the northern interior is achieving 86%the northern interior is achieving 86% the southern interior is achieving 82%the southern interior is achieving 82% and BC is achieving 84% of target free growing target number of well spaced and BC is achieving 84% of target free growing target number of well spaced
trees per hectaretrees per hectare Sites have on averageSites have on average 1005 free growing wellspaced trees per hectare and1005 free growing wellspaced trees per hectare and 1101 total well spaced trees per ha and1101 total well spaced trees per ha and 5414 TOTAL trees per hectare 5414 TOTAL trees per hectare
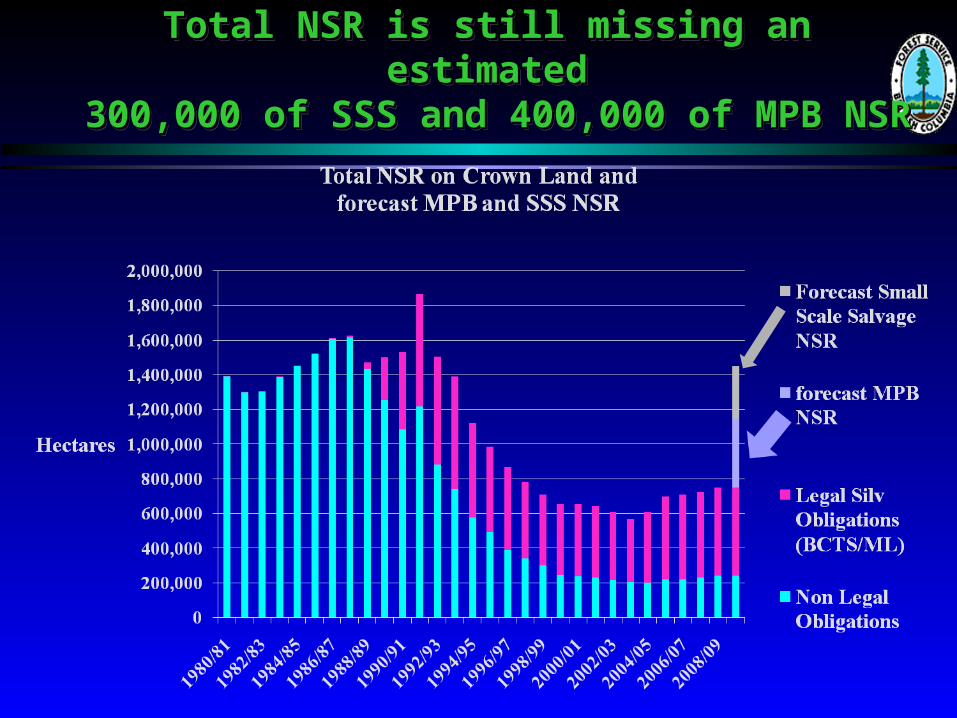
Total NSR is still missing an estimatedTotal NSR is still missing an estimated 300,000 of SSS and 400,000 of MPB NSR 300,000 of SSS and 400,000 of MPB NSRTotal NSR is still missing an estimatedTotal NSR is still missing an estimated
300,000 of SSS and 400,000 of MPB NSR 300,000 of SSS and 400,000 of MPB NSR

Estimated annual Estimated annual opportunities for treatmentopportunities for treatment
Estimated annual Estimated annual opportunities for treatmentopportunities for treatment

Silviculture investment programsSilviculture investment programsSilviculture investment programsSilviculture investment programs
Need to be developed best on management unit Need to be developed best on management unit silviculture strategies which are aimed at silviculture strategies which are aimed at achieving key mgmt objectivesachieving key mgmt objectives
Silviculture activities need to be designed to be Silviculture activities need to be designed to be complementary, integrated and synergistic in complementary, integrated and synergistic in impactimpact
The following are a few examples for coastal The following are a few examples for coastal type 2 silv strategiestype 2 silv strategies

Arrowsmith TSAArrowsmith TSAArrowsmith TSAArrowsmith TSA
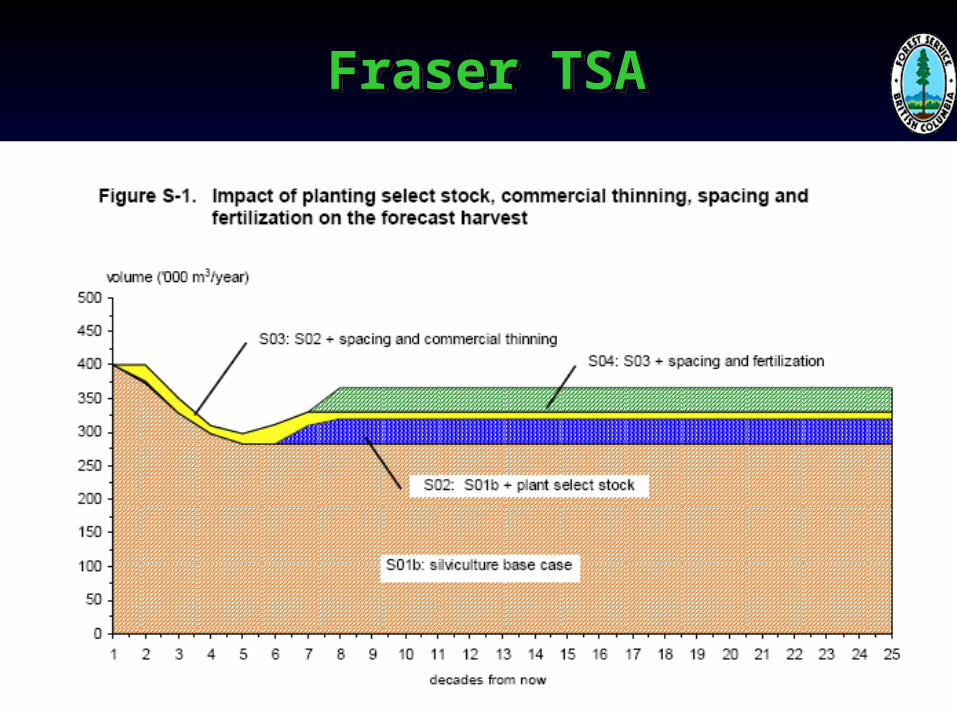
Fraser TSAFraser TSAFraser TSAFraser TSA

Strathcona TSAStrathcona TSAStrathcona TSAStrathcona TSA

Thanks to Thanks to Thanks to Thanks to
Mei Ching Tsoi for graphsMei Ching Tsoi for graphs Al Powelson and Ralph Winter for statsAl Powelson and Ralph Winter for stats Kelly Osbourne for financial estimatesKelly Osbourne for financial estimates
Recommended