Frankfurt, January 16, 2018
Kepler Cheuvreux & UniCredit
17th German Corporate Conference
SAFE HARBOR STATEMENT
Forward-looking statements involve risks.
This company presentation contains various statements concerning the future
performance of STRATEC. These statements are based on both assumptions and
estimates. Although we are convinced that these forward-looking statements are
realistic, we can provide no guarantee of this.
This is because our assumptions involve risks and uncertainties which could result
in a substantial divergence between actual results and those expected.
It is not planned to update these forward-looking statements.
2www.stratec.com17th German Corporate Conference,
January 16, 2018
www.stratec.com 3
AGENDA
OVERVIEW AND BUSINESS MODEL
THE IVD MARKET
FINANCIALS
FUTURE GROWTH
17th German Corporate Conference,
January 16, 2018
www.stratec.com 4
OVERVIEW AND
BUSINESS MODEL
17th German Corporate Conference,
January 16, 2018
Overview & Business Model FinancialsThe IVD Market Future Growth
5
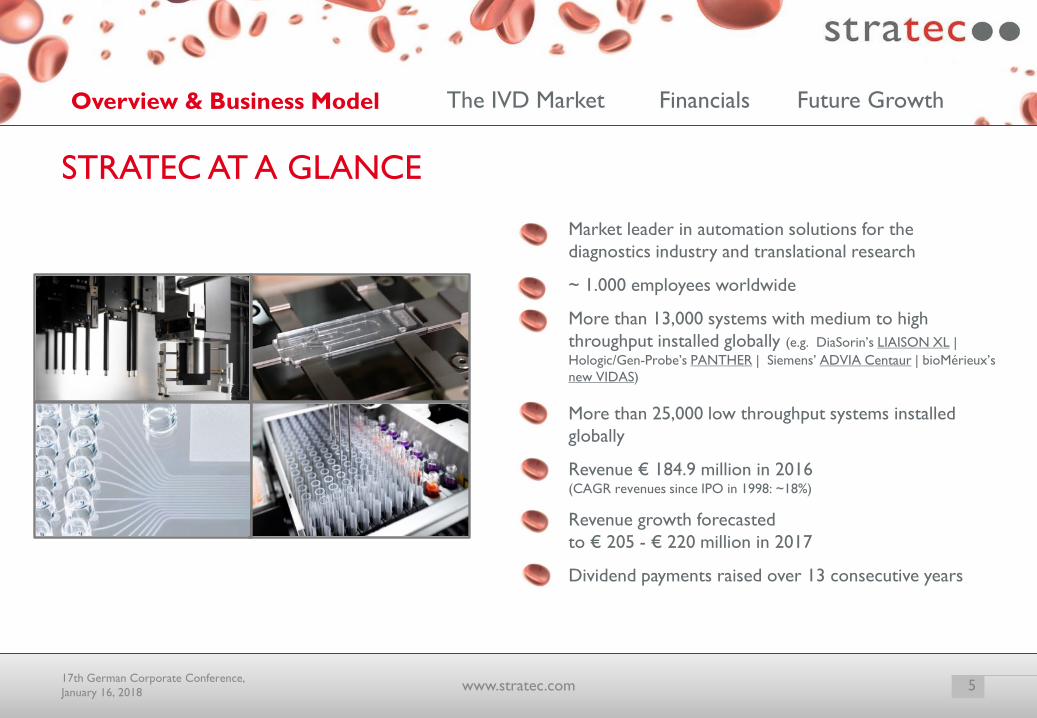
STRATEC AT A GLANCE
Market leader in automation solutions for the
diagnostics industry and translational research
~ 1.000 employees worldwide
More than 13,000 systems with medium to high
throughput installed globally (e.g. DiaSorin’s LIAISON XL |
Hologic/Gen-Probe’s PANTHER | Siemens’ ADVIA Centaur | bioMérieux’s
new VIDAS)
More than 25,000 low throughput systems installed
globally
Revenue € 184.9 million in 2016(CAGR revenues since IPO in 1998: ~18%)
Revenue growth forecasted
to € 205 - € 220 million in 2017
Dividend payments raised over 13 consecutive years
www.stratec.com17th German Corporate Conference,
January 16, 2018
Overview & Business Model FinancialsThe IVD Market Future Growth
6
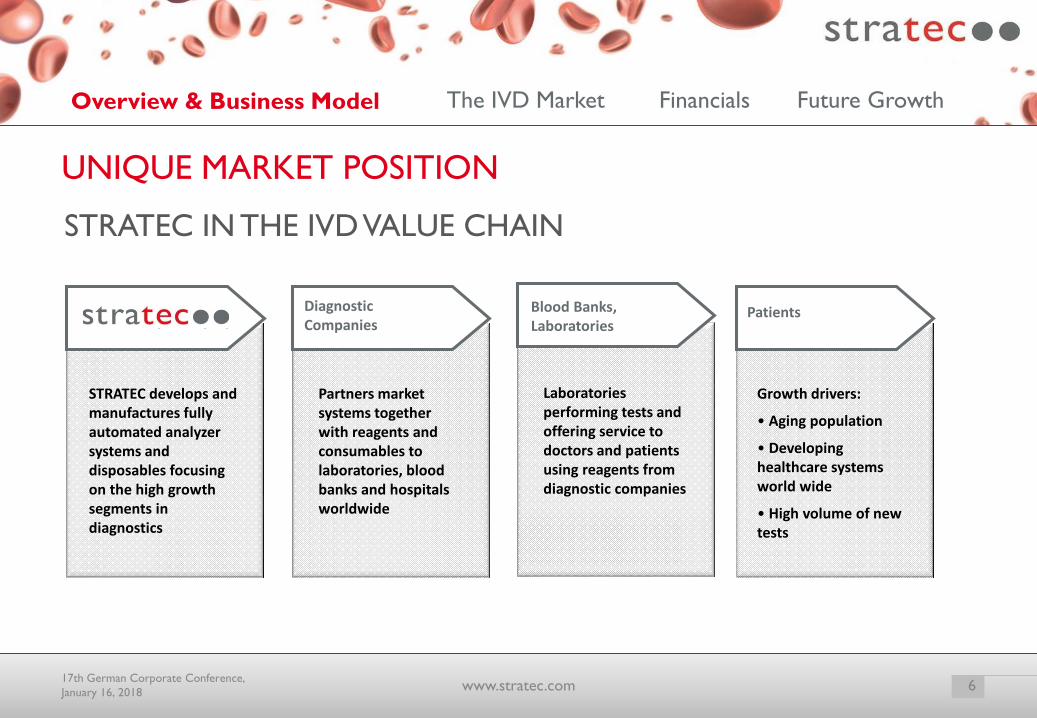
UNIQUE MARKET POSITION
STRATEC IN THE IVD VALUE CHAIN
DiagnosticCompanies
Blood Banks,Laboratories
Patients
STRATEC develops and manufactures fully automated analyzer systems and disposables focusing on the high growth segments in diagnostics
Partners market systems together with reagents and consumables to laboratories, blood banks and hospitals worldwide
Laboratories performing tests and offering service to doctors and patients using reagents from diagnostic companies
Growth drivers:
• Aging population
• Developing healthcare systems world wide
• High volume of new tests
www.stratec.com17th German Corporate Conference,
January 16, 2018
Overview & Business Model FinancialsThe IVD Market Future Growth
7
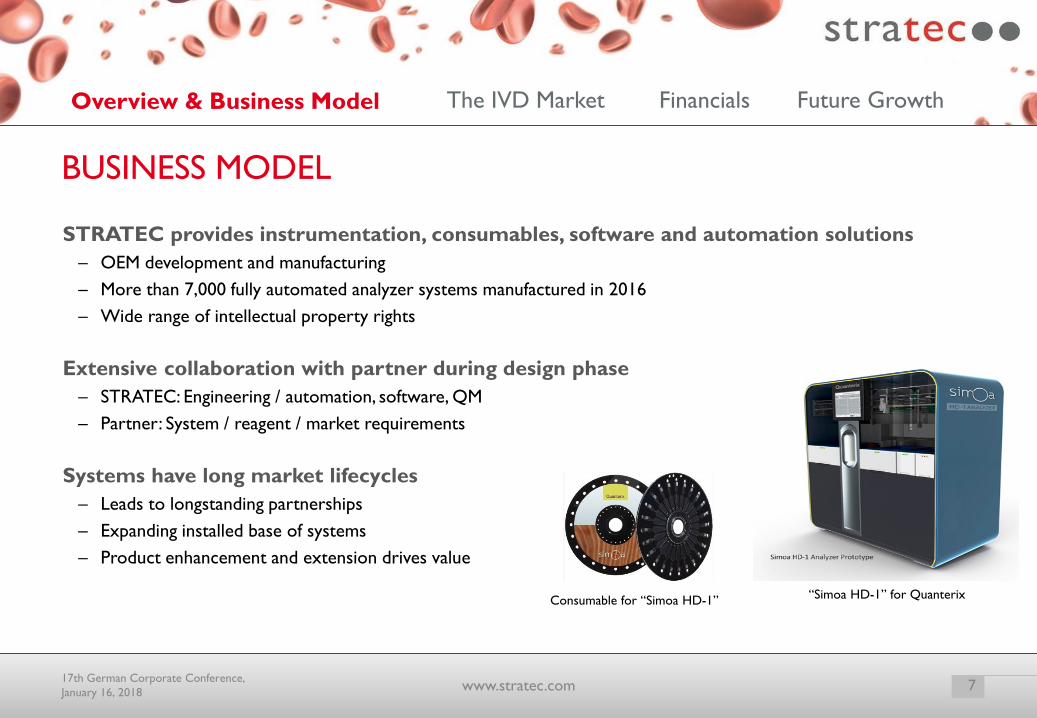
STRATEC provides instrumentation, consumables, software and automation solutions
– OEM development and manufacturing
– More than 7,000 fully automated analyzer systems manufactured in 2016
– Wide range of intellectual property rights
Extensive collaboration with partner during design phase
– STRATEC: Engineering / automation, software, QM
– Partner: System / reagent / market requirements
Systems have long market lifecycles
– Leads to longstanding partnerships
– Expanding installed base of systems
– Product enhancement and extension drives value
BUSINESS MODEL
www.stratec.com17th German Corporate Conference,
January 16, 2018
“Simoa HD-1” for QuanterixConsumable for “Simoa HD-1”
Overview & Business Model FinancialsThe IVD Market Future Growth
8
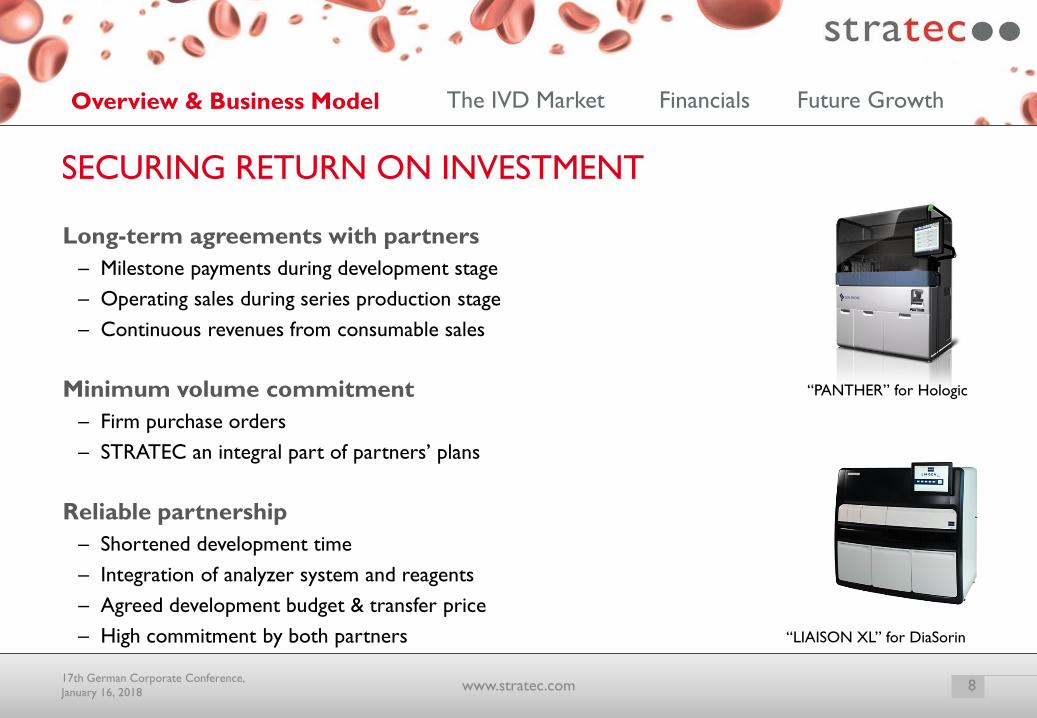
Long-term agreements with partners
– Milestone payments during development stage
– Operating sales during series production stage
– Continuous revenues from consumable sales
Minimum volume commitment
– Firm purchase orders
– STRATEC an integral part of partners’ plans
Reliable partnership
– Shortened development time
– Integration of analyzer system and reagents
– Agreed development budget & transfer price
– High commitment by both partners
SECURING RETURN ON INVESTMENT
www.stratec.com17th German Corporate Conference,
January 16, 2018
“LIAISON XL” for DiaSorin
“PANTHER” for Hologic

www.stratec.com 9
THE IVD MARKET
17th German Corporate Conference,
January 16, 2018
Overview & Business Model FinancialsThe IVD Market Future Growth
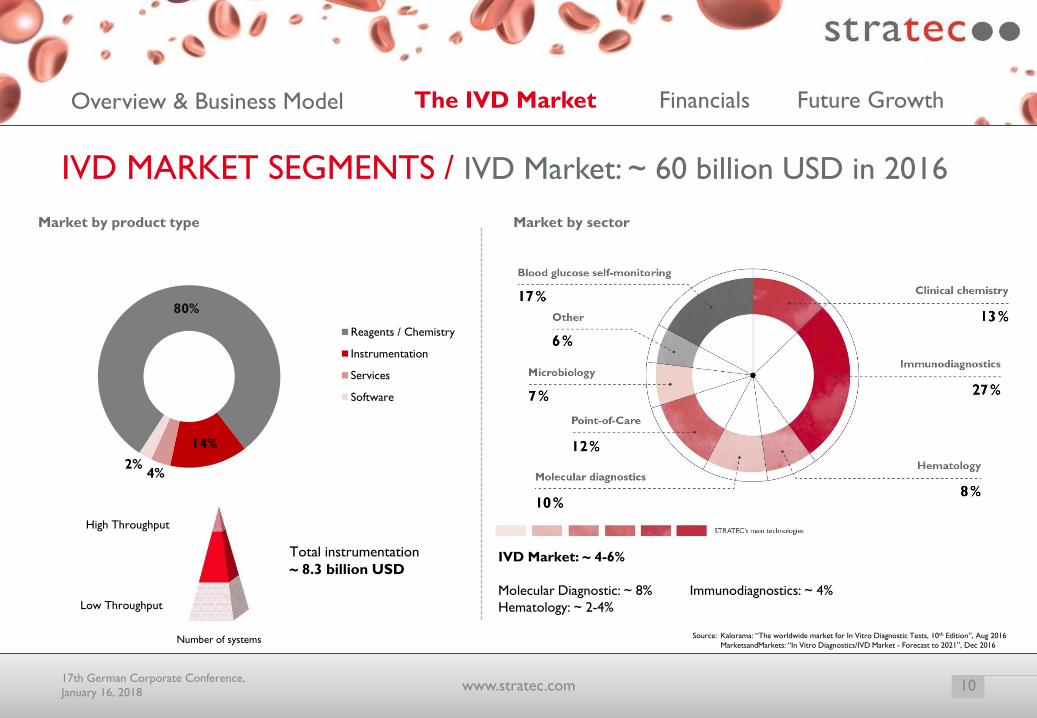
80%
14%
4%2%
Reagents / Chemistry
Instrumentation
Services
Software
10
IVD MARKET SEGMENTS / IVD Market: ~ 60 billion USD in 2016
High Throughput
Low Throughput
Total instrumentation
~ 8.3 billion USD
Market by product type
Number of systems
www.stratec.com17th German Corporate Conference,
January 16, 2018
CAGR 2016 - 2021:
IVD Market: ~ 4-6%
Molecular Diagnostic: ~ 8% Immunodiagnostics: ~ 4%
Hematology: ~ 2-4%
Source: Kalorama: “The worldwide market for In Vitro Diagnostic Tests, 10th Edition”, Aug 2016
MarketsandMarkets: “In Vitro Diagnostics/IVD Market - Forecast to 2021”, Dec 2016
Market by sector
Overview & Business Model FinancialsThe IVD Market Future Growth
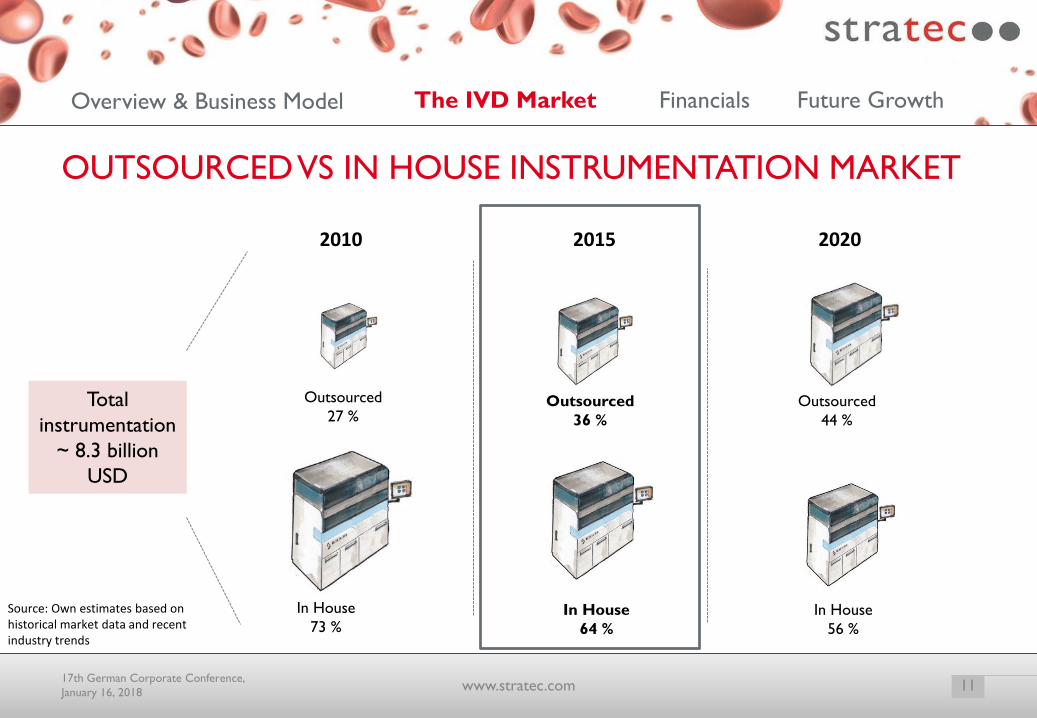
OUTSOURCED VS IN HOUSE INSTRUMENTATION MARKET
Total
instrumentation
~ 8.3 billion
USD
11
In House
64 %
Outsourced
36 %
In House
73 %
Outsourced
27 %
2010 2015 2020
In House
56 %
Outsourced
44 %
Source: Own estimates based on historical market data and recent industry trends
www.stratec.com17th German Corporate Conference,
January 16, 2018
Overview & Business Model FinancialsThe IVD Market Future Growth
12
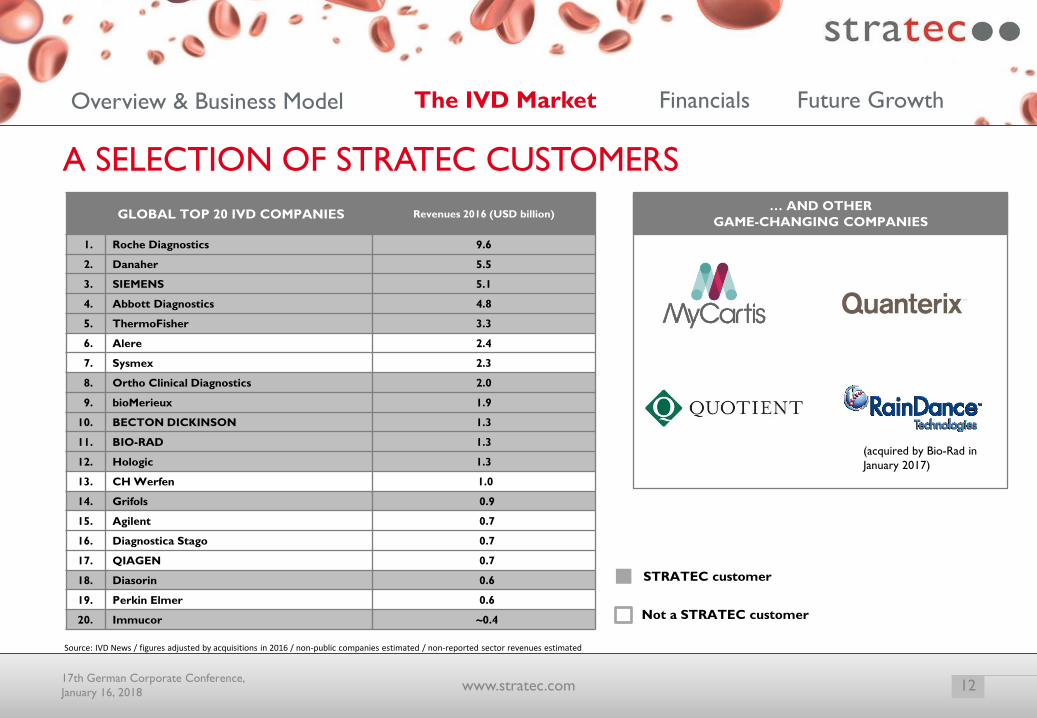
A SELECTION OF STRATEC CUSTOMERS
Source: IVD News / figures adjusted by acquisitions in 2016 / non-public companies estimated / non-reported sector revenues estimated
www.stratec.com17th German Corporate Conference,
January 16, 2018
… AND OTHER
GAME-CHANGING COMPANIES
(acquired by Bio-Rad in
January 2017)
GLOBAL TOP 20 IVD COMPANIES Revenues 2016 (USD billion)
1. Roche Diagnostics 9.6
2. Danaher 5.5
3. SIEMENS 5.1
4. Abbott Diagnostics 4.8
5. ThermoFisher 3.3
6. Alere 2.4
7. Sysmex 2.3
8. Ortho Clinical Diagnostics 2.0
9. bioMerieux 1.9
10. BECTON DICKINSON 1.3
11. BIO-RAD 1.3
12. Hologic 1.3
13. CH Werfen 1.0
14. Grifols 0.9
15. Agilent 0.7
16. Diagnostica Stago 0.7
17. QIAGEN 0.7
18. Diasorin 0.6
19. Perkin Elmer 0.6
20. Immucor ~0.4
STRATEC customer
Not a STRATEC customer

www.stratec.com 1317th German Corporate Conference,
January 16, 2018
FINANCIALS
Overview & Business Model Financials Future GrowthThe IVD Market
14
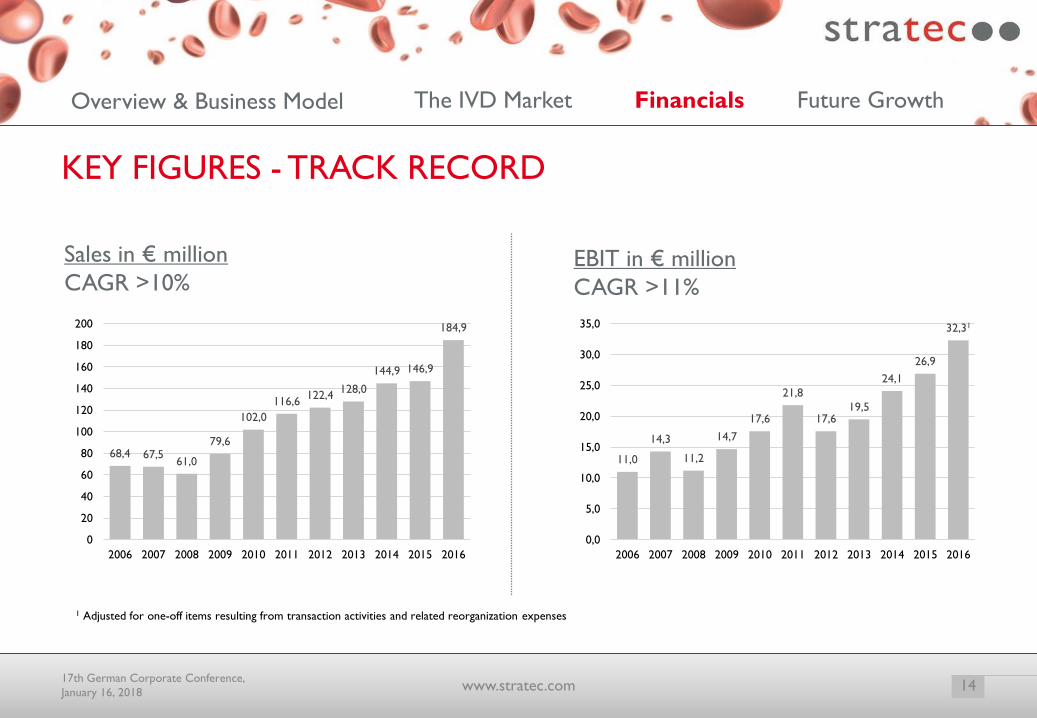
KEY FIGURES - TRACK RECORD
17th German Corporate Conference,
January 16, 2018
Sales in € million
CAGR >10%EBIT in € million
CAGR >11%
1 Adjusted for one-off items resulting from transaction activities and related reorganization expenses
11,0
14,3
11,2
14,7
17,6
21,8
17,619,5
24,1
26,9
32,31
0,0
5,0
10,0
15,0
20,0
25,0
30,0
35,0
2006 2007 2008 2009 2010 2011 2012 2013 2014 2015 2016
68,4 67,561,0
79,6
102,0
116,6122,4
128,0
144,9 146,9
184,9
0
20
40
60
80
100
120
140
160
180
200
2006 2007 2008 2009 2010 2011 2012 2013 2014 2015 2016
www.stratec.com
Overview & Business Model Financials Future GrowthThe IVD Market
15
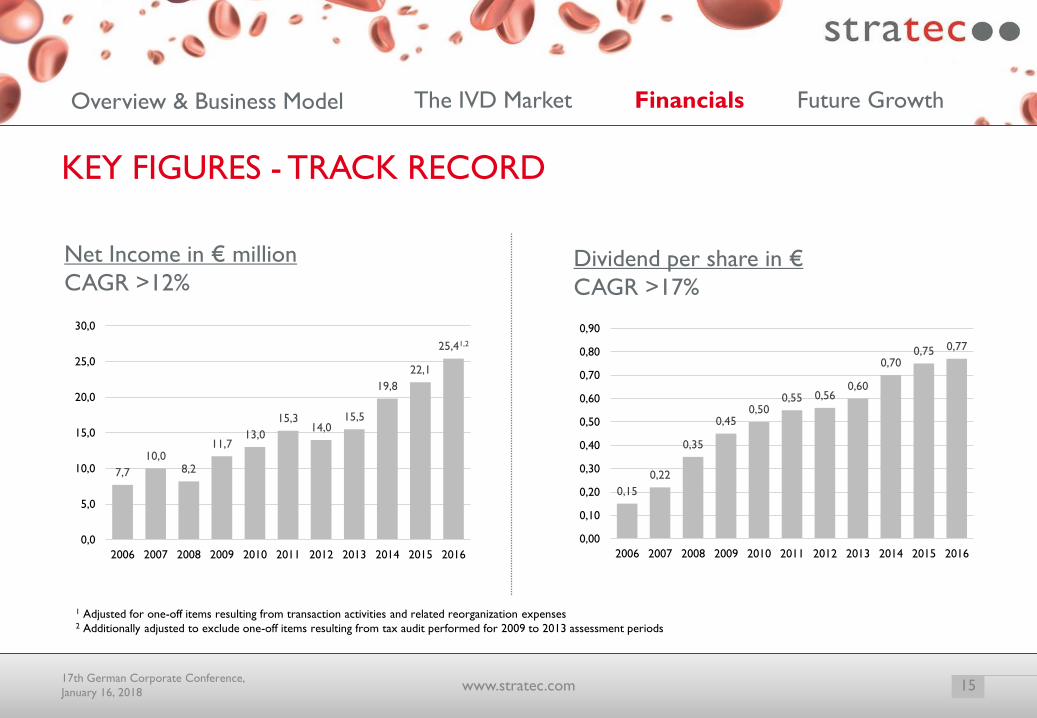
KEY FIGURES - TRACK RECORD
17th German Corporate Conference,
January 16, 2018
Net Income in € million
CAGR >12%Dividend per share in €
CAGR >17%
0,15
0,22
0,35
0,450,50
0,55 0,560,60
0,700,75 0,77
0,00
0,10
0,20
0,30
0,40
0,50
0,60
0,70
0,80
0,90
2006 2007 2008 2009 2010 2011 2012 2013 2014 2015 2016
1 Adjusted for one-off items resulting from transaction activities and related reorganization expenses2 Additionally adjusted to exclude one-off items resulting from tax audit performed for 2009 to 2013 assessment periods
7,7
10,08,2
11,713,0
15,314,0
15,5
19,8
22,1
25,41,2
0,0
5,0
10,0
15,0
20,0
25,0
30,0
2006 2007 2008 2009 2010 2011 2012 2013 2014 2015 2016
www.stratec.com
Overview & Business Model Financials Future GrowthThe IVD Market
16
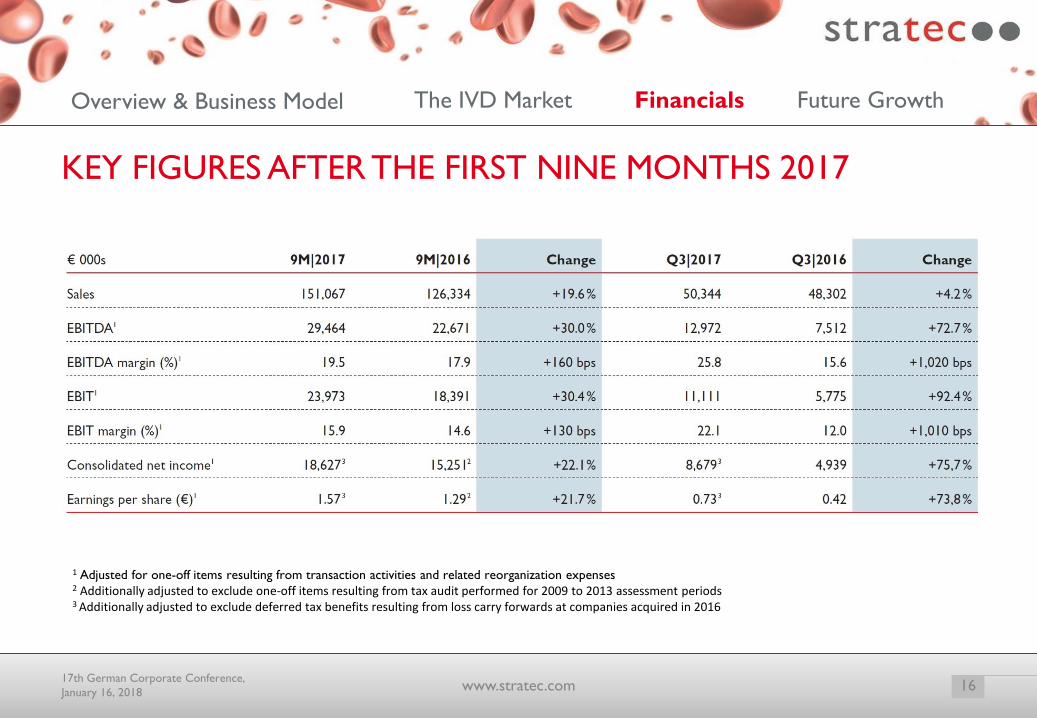
KEY FIGURES AFTER THE FIRST NINE MONTHS 2017
17th German Corporate Conference,
January 16, 2018
1 Adjusted for one-off items resulting from transaction activities and related reorganization expenses2 Additionally adjusted to exclude one-off items resulting from tax audit performed for 2009 to 2013 assessment periods3 Additionally adjusted to exclude deferred tax benefits resulting from loss carry forwards at companies acquired in 2016
www.stratec.com
17
FUTURE GROWTH
17th German Corporate Conference,
January 16, 2018 www.stratec.com
Overview & Business Model Financials Future GrowthThe IVD Market
18
Outlook for 2017
• Sales guidance of € 205 million to € 220 million
• Adjusted EBIT margin of around 17%
Medium-term expectations
• Average annual organic sales growth (CAGR) in the high single-digit or
low double-digit percentage range
• Broadly consistent EBIT margin development
Positive scale effects partly offset by growth activities related to packed development pipeline
STRATEC – FINANCIAL GUIDANCE
17th German Corporate Conference,
January 16, 2018 www.stratec.com
Overview & Business Model Financials Future GrowthThe IVD Market
19
• Improve profitability and reduce earnings volatility across business units
• Further realize synergies through development activities across STRATEC businesses
• Expand leading market role
• Leverage expanded platform offering
• Facilitate consumables integration on instruments for partners
• Achieve milestones & market launches within foreseen timeframe
• Execute development and supply agreements for a variety of pipeline products / projects
FOCUS IN 2018 AND BEYOND
17th German Corporate Conference,
January 16, 2018 www.stratec.com
THANK YOU
FOR YOURATTENTION!
STRATEC Biomedical AGGewerbestr. 37
75217 Birkenfeld
Germany
Tel: +49 7082 7916-991
Fax: +49 7082 7916-9190
www.stratec.com
TICKERSymbol: SBS.DE
Bloomberg: SBS:GR
Reuters: SBSG.DE
ISIN: DE000STRA555
WKN: STRA55
CONTACT
20www.stratec.com17th German Corporate Conference,
January 16, 2018
APPENDIX
21www.stratec.com17th German Corporate Conference,
January 16, 2018
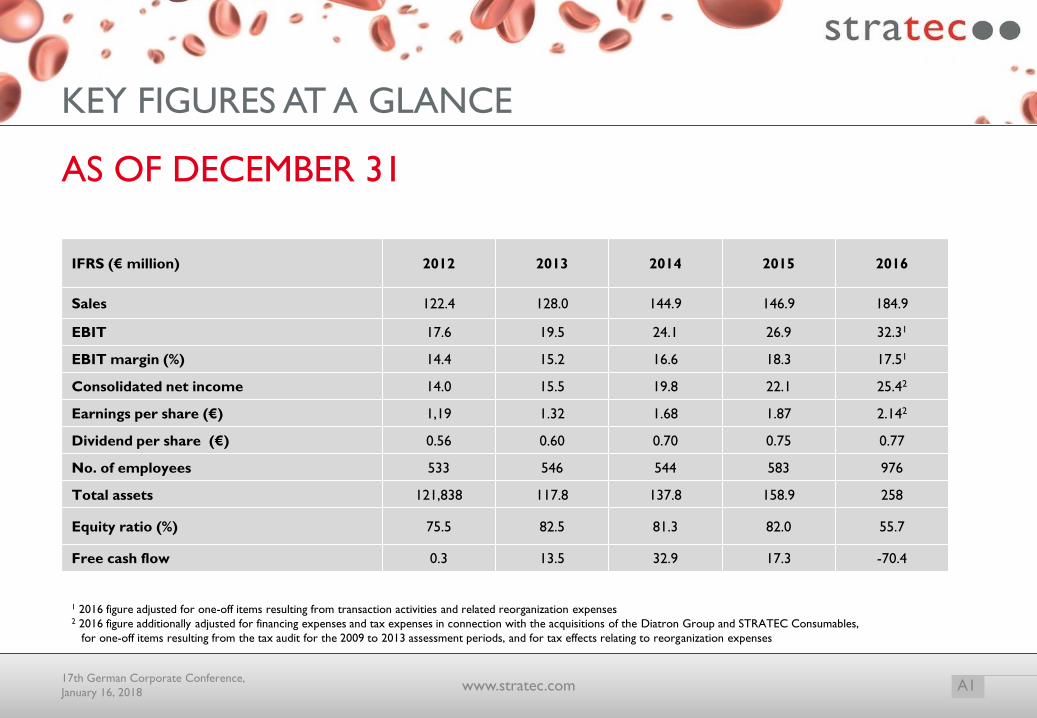
KEY FIGURES AT A GLANCE
IFRS (€ million) 2012 2013 2014 2015 2016
Sales 122.4 128.0 144.9 146.9 184.9
EBIT 17.6 19.5 24.1 26.9 32.31
EBIT margin (%) 14.4 15.2 16.6 18.3 17.51
Consolidated net income 14.0 15.5 19.8 22.1 25.42
Earnings per share (€) 1,19 1.32 1.68 1.87 2.142
Dividend per share (€) 0.56 0.60 0.70 0.75 0.77
No. of employees 533 546 544 583 976
Total assets 121,838 117.8 137.8 158.9 258
Equity ratio (%) 75.5 82.5 81.3 82.0 55.7
Free cash flow 0.3 13.5 32.9 17.3 -70.4
AS OF DECEMBER 31
A1www.stratec.com
1 2016 figure adjusted for one-off items resulting from transaction activities and related reorganization expenses2 2016 figure additionally adjusted for financing expenses and tax expenses in connection with the acquisitions of the Diatron Group and STRATEC Consumables,
for one-off items resulting from the tax audit for the 2009 to 2013 assessment periods, and for tax effects relating to reorganization expenses
17th German Corporate Conference,
January 16, 2018
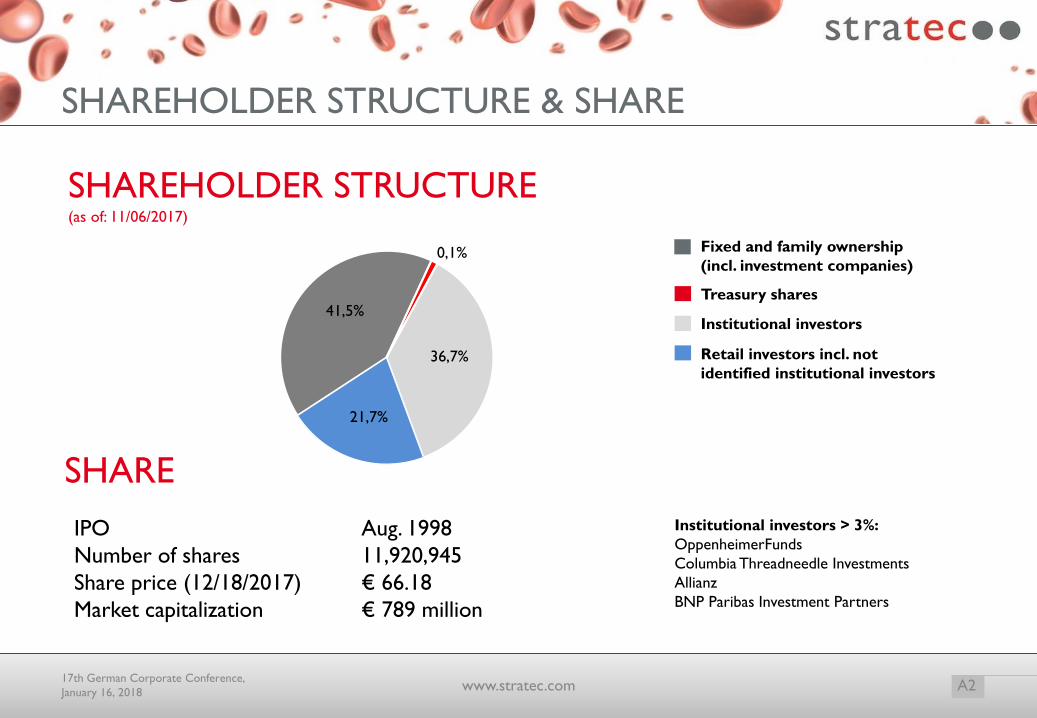
SHAREHOLDER STRUCTURE & SHARE
SHARE
IPO Aug. 1998
Number of shares 11,920,945
Share price (12/18/2017) € 66.18
Market capitalization € 789 million
Fixed and family ownership
(incl. investment companies)
Treasury shares
Retail investors incl. not
identified institutional investors
Institutional investors
SHAREHOLDER STRUCTURE(as of: 11/06/2017)
A2www.stratec.com17th German Corporate Conference,
January 16, 2018
41,5%
0,1%
36,7%
21,7%
Institutional investors > 3%:
OppenheimerFunds
Columbia Threadneedle Investments
Allianz
BNP Paribas Investment Partners
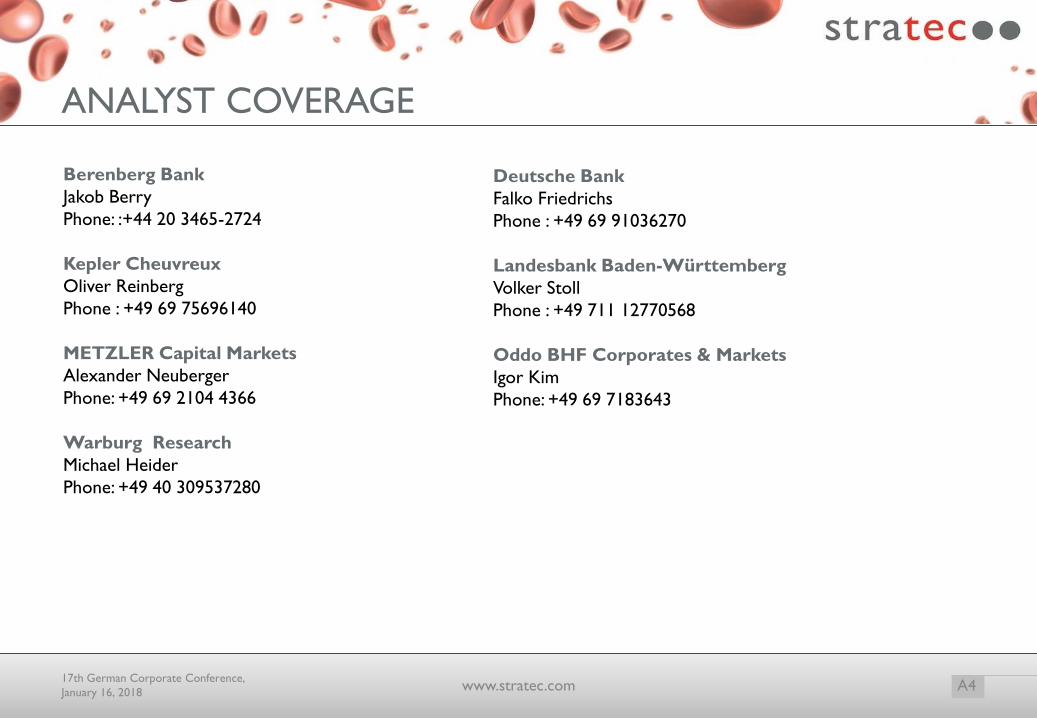
ANALYST COVERAGE
Berenberg Bank
Jakob Berry
Phone: :+44 20 3465-2724
Kepler Cheuvreux
Oliver Reinberg
Phone : +49 69 75696140
METZLER Capital Markets
Alexander Neuberger
Phone: +49 69 2104 4366
Warburg Research
Michael Heider
Phone: +49 40 309537280
Deutsche Bank
Falko Friedrichs
Phone : +49 69 91036270
Landesbank Baden-Württemberg
Volker Stoll
Phone : +49 711 12770568
Oddo BHF Corporates & Markets
Igor Kim
Phone: +49 69 7183643
A4www.stratec.com17th German Corporate Conference,
January 16, 2018
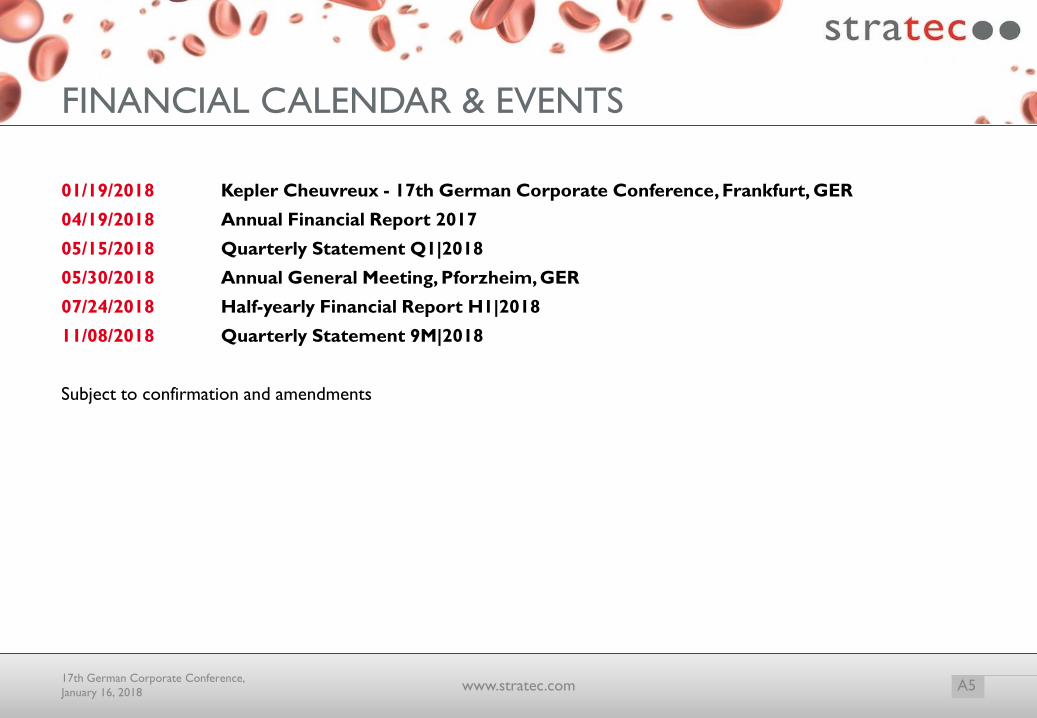
FINANCIAL CALENDAR & EVENTS
01/19/2018 Kepler Cheuvreux - 17th German Corporate Conference, Frankfurt, GER
04/19/2018 Annual Financial Report 2017
05/15/2018 Quarterly Statement Q1|2018
05/30/2018 Annual General Meeting, Pforzheim, GER
07/24/2018 Half-yearly Financial Report H1|2018
11/08/2018 Quarterly Statement 9M|2018
Subject to confirmation and amendments
A5www.stratec.com17th German Corporate Conference,
January 16, 2018
Recommended