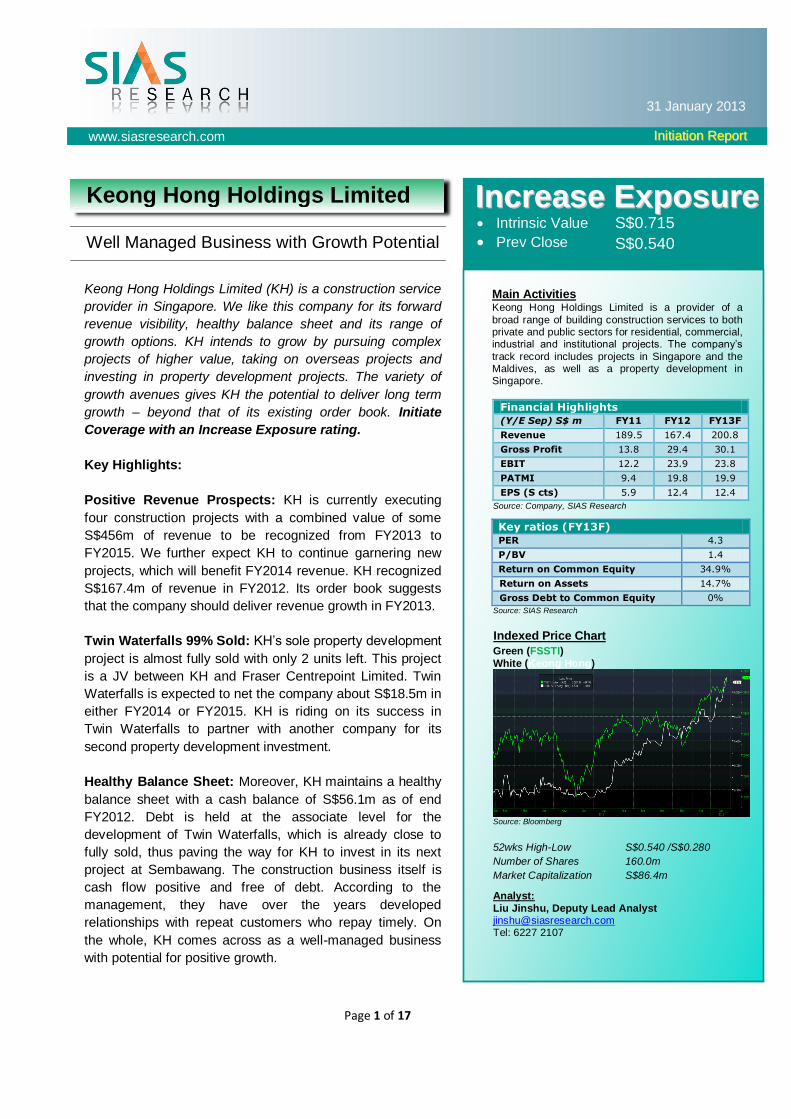
Page 1 of 17
www.siasresearch.com IInniittiiaattiioonn RReeppoorrtt
31 January 2013
IInnccrreeaassee EExxppoossuurree
Well Managed Business with Growth Potential
S$0.715
S$0.540
Intrinsic Value
Prev Close
Main Activities Keong Hong Holdings Limited is a provider of a
broad range of building construction services to both private and public sectors for residential, commercial, industrial and institutional projects. The company’s
track record includes projects in Singapore and the Maldives, as well as a property development in Singapore.
Financial Highlights
(Y/E Sep) S$ m FY11 FY12 FY13F
Revenue 189.5 167.4 200.8
Gross Profit 13.8 29.4 30.1
EBIT 12.2 23.9 23.8
PATMI 9.4 19.8 19.9
EPS (S cts) 5.9 12.4 12.4
Source: Company, SIAS Research
Key ratios (FY13F)
PER 4.3
P/BV 1.4
Return on Common Equity 34.9%
Return on Assets 14.7%
Gross Debt to Common Equity 0%
Source: SIAS Research
Indexed Price Chart
Green (FSSTI)
White (Keong Hong)
Source: Bloomberg
52wks High-Low S$0.540 /S$0.280
Number of Shares 160.0m
Market Capitalization S$86.4m
Analyst:
Liu Jinshu, Deputy Lead Analyst [email protected] Tel: 6227 2107
Keong Hong Holdings Limited (KH) is a construction service
provider in Singapore. We like this company for its forward
revenue visibility, healthy balance sheet and its range of
growth options. KH intends to grow by pursuing complex
projects of higher value, taking on overseas projects and
investing in property development projects. The variety of
growth avenues gives KH the potential to deliver long term
growth – beyond that of its existing order book. Initiate
Coverage with an Increase Exposure rating.
Key Highlights:
Positive Revenue Prospects: KH is currently executing
four construction projects with a combined value of some
S$456m of revenue to be recognized from FY2013 to
FY2015. We further expect KH to continue garnering new
projects, which will benefit FY2014 revenue. KH recognized
S$167.4m of revenue in FY2012. Its order book suggests
that the company should deliver revenue growth in FY2013.
Twin Waterfalls 99% Sold: KH’s sole property development
project is almost fully sold with only 2 units left. This project
is a JV between KH and Fraser Centrepoint Limited. Twin
Waterfalls is expected to net the company about S$18.5m in
either FY2014 or FY2015. KH is riding on its success in
Twin Waterfalls to partner with another company for its
second property development investment.
Healthy Balance Sheet: Moreover, KH maintains a healthy
balance sheet with a cash balance of S$56.1m as of end
FY2012. Debt is held at the associate level for the
development of Twin Waterfalls, which is already close to
fully sold, thus paving the way for KH to invest in its next
project at Sembawang. The construction business itself is
cash flow positive and free of debt. According to the
management, they have over the years developed
relationships with repeat customers who repay timely. On
the whole, KH comes across as a well-managed business
with potential for positive growth.
Keong Hong Holdings Limited
Page 2 of 17
www.siasresearch.com IInniittiiaattiioonn RReeppoorrtt
31 January 2013
Company Background
Keong Hong Holdings Limited (KH) is a homegrown construction company
established in 1983 and listed on the SGX Catalist Board in December 2011.
Its principal activities can best be described as the provision of building
construction services to both the private and public sectors in residential,
commercial, industrial and institutional projects. Other than plain vanilla
conventional construction contracts, KH also takes on additional and
alteration works, as well as design-and-build projects.
KH’s customers comprise of main contractors, project consultants and
property developers and owners. Repeat customers include Keppel Land
Group, Frasers Centrepoint Limited and MCL Land Ltd.
KH has a BCA grading of A1 for general building projects. This means that
KH can tender for public sector construction projects of unlimited value,
under the general building workhead, with no restrictions for private sector
projects.
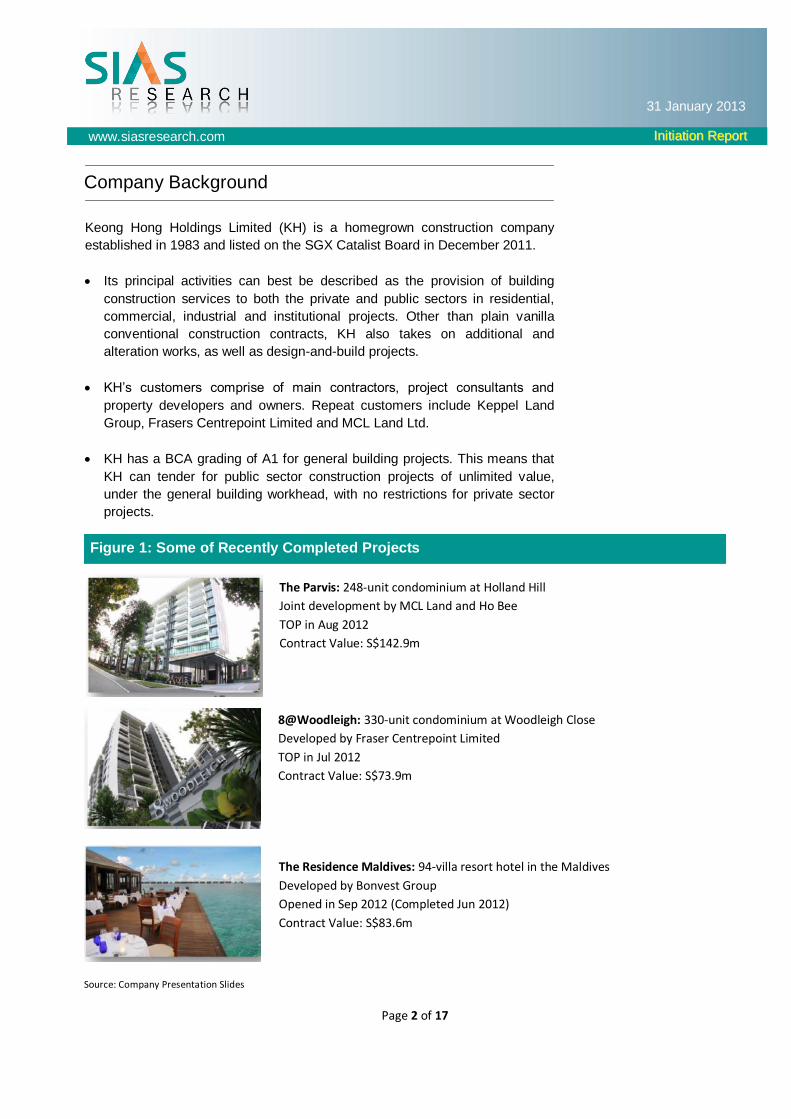
The Parvis: 248-unit condominium at Holland Hill
Joint development by MCL Land and Ho Bee
TOP in Aug 2012
Contract Value: S$142.9m
Figure 1: Some of Recently Completed Projects
8@Woodleigh: 330-unit condominium at Woodleigh Close
Developed by Fraser Centrepoint Limited
TOP in Jul 2012
Contract Value: S$73.9m
Source: Company Presentation Slides
The Residence Maldives: 94-villa resort hotel in the Maldives
Developed by Bonvest Group
Opened in Sep 2012 (Completed Jun 2012)
Contract Value: S$83.6m
Page 3 of 17
www.siasresearch.com IInniittiiaattiioonn RReeppoorrtt
31 January 2013
Figure 2: Wide Spectrum of Completed Projects – Across Different Types of Projects (e.g.
Design & Build, Additional & Alteration) and Segments (e.g. Residential & Commercial)
Description Contract
Value (S$m) Completion
Date Project Type Design & Build Projects
8@Woodleigh 73.9 Aug-12 Residential
Martin Places Residences 125.7 Sep-11 Residential
IBIS Hotel Project 46.3 Jan-09 Commercial
The Esta 74.3 Nov-08 Residential
The Belvedere 43.4 Oct-07 Residential
The Linc 13.7 Jan-06 Residential Overseas Projects
Kooddoo Airport 7.7 Sep-12 Institutional
The Residence Resort 83.6 Jun-12 Commercial Condominium Projects
The Parvis 142.9 Sep-12
Residential
Sunville 11.7 Apr-05
Butterworth 8 44.9 Apr-04 The Edgewater 11.7 Nov-03
Palm Gardens 147.9 May-00
Parc Vista 120.6 May-98 Commercial / Industrial Projects
Sime Darby Performance Centre Main building works for 6-storey motor vehicle service centre & ancillary motor vehicle showroom, offices and storage
38 Aug-08 Commercial
Vicplas - 8 storey factory building with a basement carpark 12.5 Dec-01 Industrial
Artform - 2 storey factory building with mezzanine floor and 1st storey ancillary office at Senoko Way
6.6 Jul-01 Industrial
Institutional / HDB Projects Mount Alvernia Hospital Sisters' Accommodation Sisters' Accommodation as an extension to the existing Mount Alvernia Hospital
6.1 Dec-05 Institutional
Pasir Laba Army Camp - Camp Redevelopment (Phase 3) 17.8 Apr-02 Institutional
SengKang N3 C17 - Building and electrical works at Sengkang neighbourhood North Zone 3
28.3 Jun-01 HDB
Additional & Alteration Projects
6-storey extension and A&A works to SIM 100 Sep-11 Institutional
A&A works to 4th storey and B3 to B1 of Tampines Mall Shopping Centre
6.9 Sep-04 Commercial
Fitting out works at Fuji Xerox 2.7 Aug-04 Commercial A&A works to existing factory comprising of a 3 storey technical and training centre with ancillary office
5.4 Oct-02 Industrial
Avaplas - Extension of factory and A&A Works 2.4 Jul-01 Industrial Terrace Housing
Springside (Phases 6A, 7A & 7B) 24.6 Dec-03
Residential Summerlea Green 20.1 Jun-98
Springside (Phase 1 to 5) 47.6 Nov-97 Source: Company Data
Page 4 of 17
www.siasresearch.com IInniittiiaattiioonn RReeppoorrtt
31 January 2013
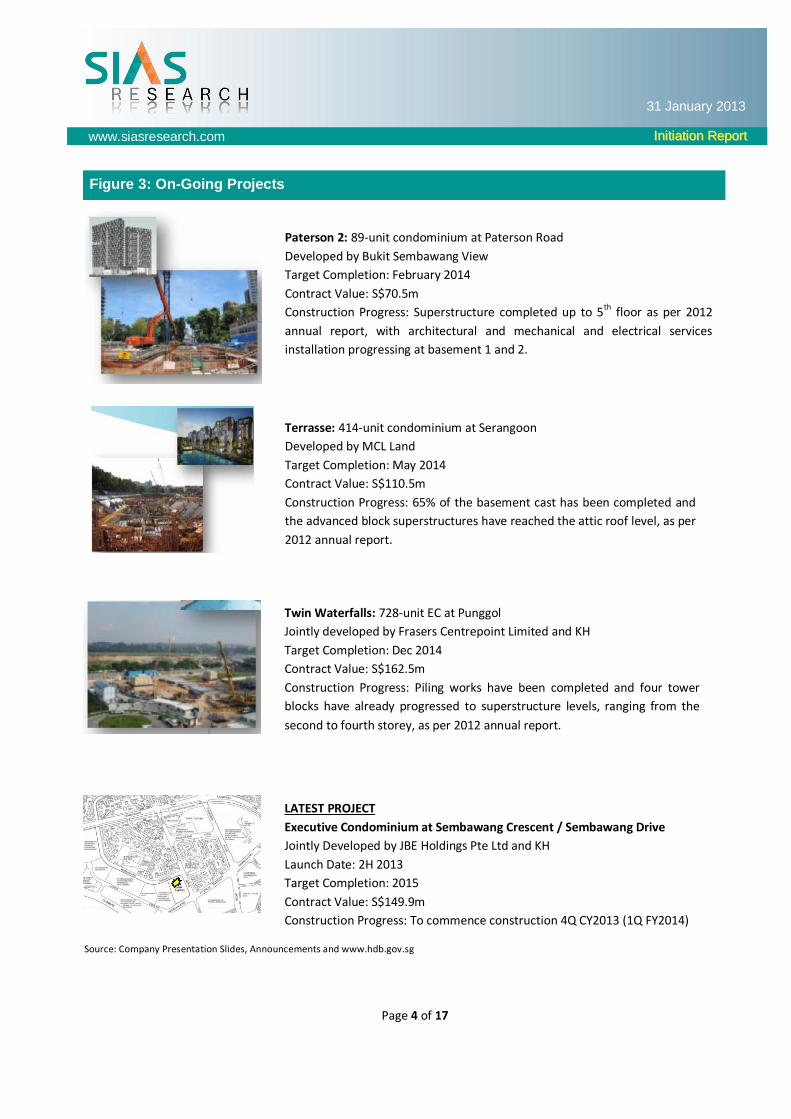
Paterson 2: 89-unit condominium at Paterson Road
Developed by Bukit Sembawang View
Target Completion: February 2014
Contract Value: S$70.5m
Construction Progress: Superstructure completed up to 5th floor as per 2012
annual report, with architectural and mechanical and electrical services
installation progressing at basement 1 and 2.
Figure 3: On-Going Projects
Terrasse: 414-unit condominium at Serangoon
Developed by MCL Land
Target Completion: May 2014
Contract Value: S$110.5m
Construction Progress: 65% of the basement cast has been completed and
the advanced block superstructures have reached the attic roof level, as per
2012 annual report.
Twin Waterfalls: 728-unit EC at Punggol
Jointly developed by Frasers Centrepoint Limited and KH
Target Completion: Dec 2014
Contract Value: S$162.5m
Construction Progress: Piling works have been completed and four tower
blocks have already progressed to superstructure levels, ranging from the
second to fourth storey, as per 2012 annual report.
LATEST PROJECT
Executive Condominium at Sembawang Crescent / Sembawang Drive
Jointly Developed by JBE Holdings Pte Ltd and KH
Launch Date: 2H 2013
Target Completion: 2015
Contract Value: S$149.9m
Construction Progress: To commence construction 4Q CY2013 (1Q FY2014)
Source: Company Presentation Slides, Announcements and www.hdb.gov.sg
Page 5 of 17
www.siasresearch.com IInniittiiaattiioonn RReeppoorrtt
31 January 2013
Positive Revenue Prospects
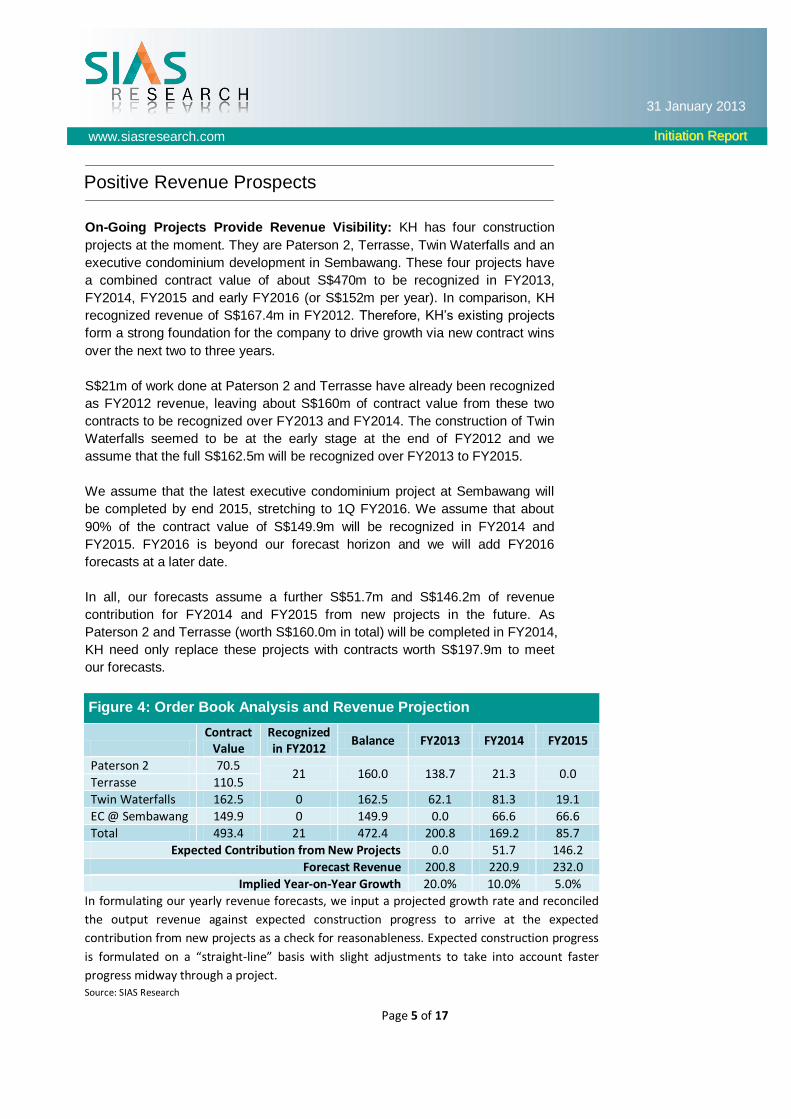
On-Going Projects Provide Revenue Visibility: KH has four construction
projects at the moment. They are Paterson 2, Terrasse, Twin Waterfalls and an
executive condominium development in Sembawang. These four projects have
a combined contract value of about S$470m to be recognized in FY2013,
FY2014, FY2015 and early FY2016 (or S$152m per year). In comparison, KH
recognized revenue of S$167.4m in FY2012. Therefore, KH’s existing projects
form a strong foundation for the company to drive growth via new contract wins
over the next two to three years.
S$21m of work done at Paterson 2 and Terrasse have already been recognized
as FY2012 revenue, leaving about S$160m of contract value from these two
contracts to be recognized over FY2013 and FY2014. The construction of Twin
Waterfalls seemed to be at the early stage at the end of FY2012 and we
assume that the full S$162.5m will be recognized over FY2013 to FY2015.
We assume that the latest executive condominium project at Sembawang will
be completed by end 2015, stretching to 1Q FY2016. We assume that about
90% of the contract value of S$149.9m will be recognized in FY2014 and
FY2015. FY2016 is beyond our forecast horizon and we will add FY2016
forecasts at a later date.
In all, our forecasts assume a further S$51.7m and S$146.2m of revenue
contribution for FY2014 and FY2015 from new projects in the future. As
Paterson 2 and Terrasse (worth S$160.0m in total) will be completed in FY2014,
KH need only replace these projects with contracts worth S$197.9m to meet
our forecasts.
Figure 4: Order Book Analysis and Revenue Projection
Contract
Value Recognized in FY2012
Balance FY2013 FY2014 FY2015
Paterson 2 70.5 21 160.0 138.7 21.3 0.0
Terrasse 110.5
Twin Waterfalls 162.5 0 162.5 62.1 81.3 19.1
EC @ Sembawang 149.9 0 149.9 0.0 66.6 66.6
Total 493.4 21 472.4 200.8 169.2 85.7
Expected Contribution from New Projects 0.0 51.7 146.2
Forecast Revenue 200.8 220.9 232.0
Implied Year-on-Year Growth 20.0% 10.0% 5.0%
In formulating our yearly revenue forecasts, we input a projected growth rate and reconciled
the output revenue against expected construction progress to arrive at the expected
contribution from new projects as a check for reasonableness. Expected construction progress
is formulated on a “straight-line” basis with slight adjustments to take into account faster
progress midway through a project. Source: SIAS Research
Page 6 of 17
www.siasresearch.com IInniittiiaattiioonn RReeppoorrtt
31 January 2013
Figure 5: Pipeline Supply Figure 6: Leveraging on Repeat Customers
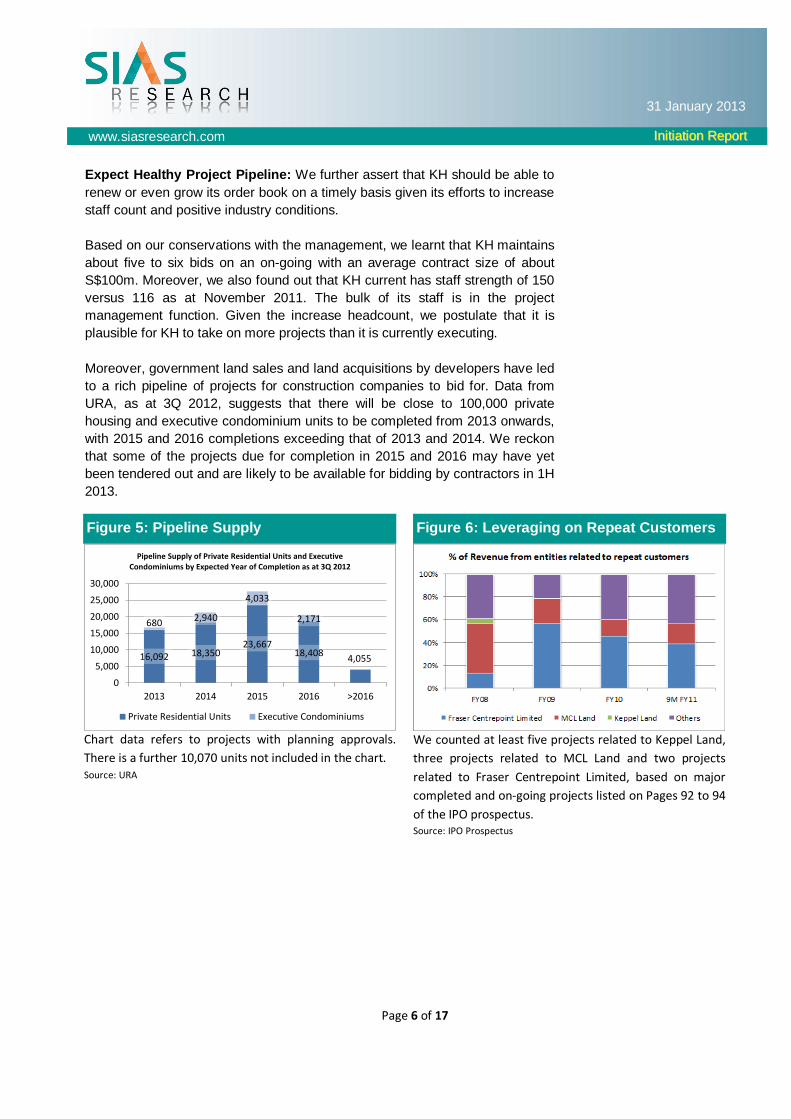
Expect Healthy Project Pipeline: We further assert that KH should be able to
renew or even grow its order book on a timely basis given its efforts to increase
staff count and positive industry conditions.
Based on our conservations with the management, we learnt that KH maintains
about five to six bids on an on-going with an average contract size of about
S$100m. Moreover, we also found out that KH current has staff strength of 150
versus 116 as at November 2011. The bulk of its staff is in the project
management function. Given the increase headcount, we postulate that it is
plausible for KH to take on more projects than it is currently executing.
Moreover, government land sales and land acquisitions by developers have led
to a rich pipeline of projects for construction companies to bid for. Data from
URA, as at 3Q 2012, suggests that there will be close to 100,000 private
housing and executive condominium units to be completed from 2013 onwards,
with 2015 and 2016 completions exceeding that of 2013 and 2014. We reckon
that some of the projects due for completion in 2015 and 2016 may have yet
been tendered out and are likely to be available for bidding by contractors in 1H
2013.
16,092 18,35023,667
18,4084,055
680 2,940
4,033
2,171
0
5,000
10,000
15,000
20,000
25,000
30,000
2013 2014 2015 2016 >2016
Pipeline Supply of Private Residential Units and Executive Condominiums by Expected Year of Completion as at 3Q 2012
Private Residential Units Executive Condominiums
Chart data refers to projects with planning approvals.
There is a further 10,070 units not included in the chart. Source: URA
We counted at least five projects related to Keppel Land,
three projects related to MCL Land and two projects
related to Fraser Centrepoint Limited, based on major
completed and on-going projects listed on Pages 92 to 94
of the IPO prospectus. Source: IPO Prospectus
Page 7 of 17
www.siasresearch.com IInniittiiaattiioonn RReeppoorrtt
31 January 2013
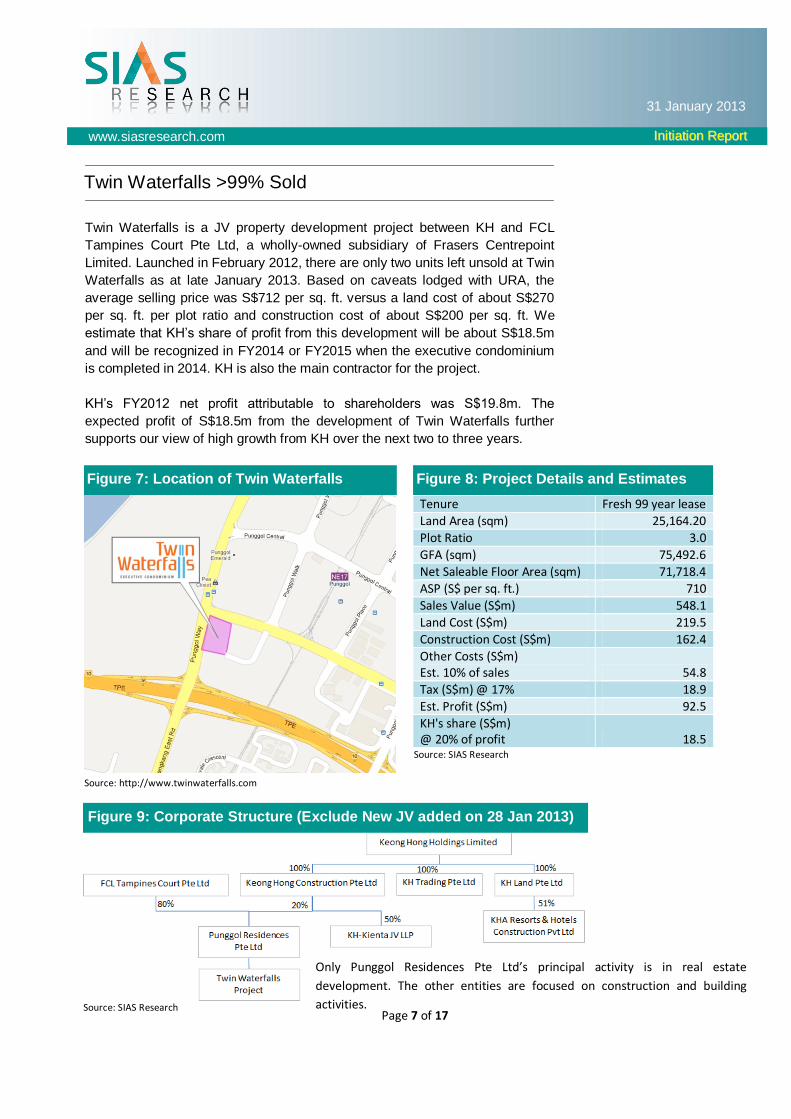
Twin Waterfalls >99% Sold
Figure 7: Location of Twin Waterfalls Figure 8: Project Details and Estimates
Figure 9: Corporate Structure (Exclude New JV added on 28 Jan 2013)
Twin Waterfalls is a JV property development project between KH and FCL
Tampines Court Pte Ltd, a wholly-owned subsidiary of Frasers Centrepoint
Limited. Launched in February 2012, there are only two units left unsold at Twin
Waterfalls as at late January 2013. Based on caveats lodged with URA, the
average selling price was S$712 per sq. ft. versus a land cost of about S$270
per sq. ft. per plot ratio and construction cost of about S$200 per sq. ft. We
estimate that KH’s share of profit from this development will be about S$18.5m
and will be recognized in FY2014 or FY2015 when the executive condominium
is completed in 2014. KH is also the main contractor for the project.
KH’s FY2012 net profit attributable to shareholders was S$19.8m. The
expected profit of S$18.5m from the development of Twin Waterfalls further
supports our view of high growth from KH over the next two to three years.
Source: http://www.twinwaterfalls.com
Tenure Fresh 99 year lease
Land Area (sqm) 25,164.20
Plot Ratio 3.0
GFA (sqm) 75,492.6
Net Saleable Floor Area (sqm) 71,718.4
ASP (S$ per sq. ft.) 710
Sales Value (S$m) 548.1
Land Cost (S$m) 219.5
Construction Cost (S$m) 162.4
Other Costs (S$m) Est. 10% of sales 54.8
Tax (S$m) @ 17% 18.9
Est. Profit (S$m) 92.5
KH's share (S$m) @ 20% of profit 18.5
Source: SIAS Research
Source: SIAS Research
Only Punggol Residences Pte Ltd’s principal activity is in real estate
development. The other entities are focused on construction and building
activities.
Page 8 of 17
www.siasresearch.com IInniittiiaattiioonn RReeppoorrtt
31 January 2013
Figure 10: Location of Site
Figure 11: Project Details and Estimates
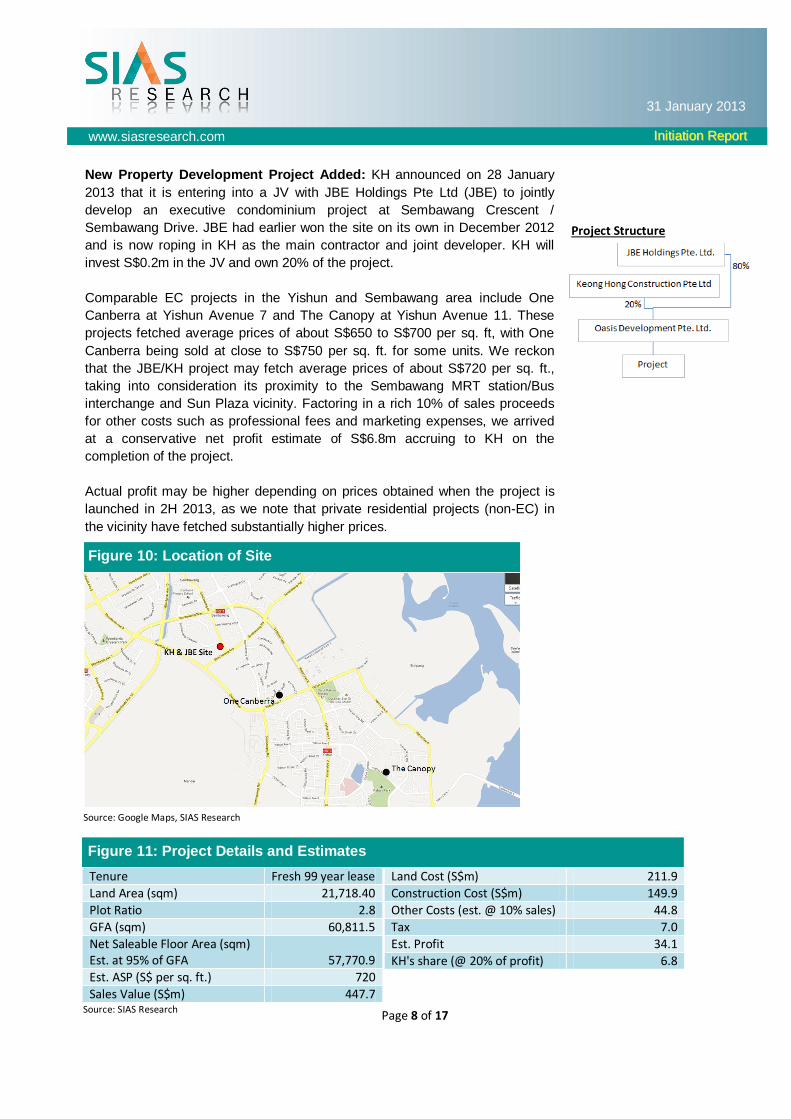
New Property Development Project Added: KH announced on 28 January
2013 that it is entering into a JV with JBE Holdings Pte Ltd (JBE) to jointly
develop an executive condominium project at Sembawang Crescent /
Sembawang Drive. JBE had earlier won the site on its own in December 2012
and is now roping in KH as the main contractor and joint developer. KH will
invest S$0.2m in the JV and own 20% of the project.
Comparable EC projects in the Yishun and Sembawang area include One
Canberra at Yishun Avenue 7 and The Canopy at Yishun Avenue 11. These
projects fetched average prices of about S$650 to S$700 per sq. ft, with One
Canberra being sold at close to S$750 per sq. ft. for some units. We reckon
that the JBE/KH project may fetch average prices of about S$720 per sq. ft.,
taking into consideration its proximity to the Sembawang MRT station/Bus
interchange and Sun Plaza vicinity. Factoring in a rich 10% of sales proceeds
for other costs such as professional fees and marketing expenses, we arrived
at a conservative net profit estimate of S$6.8m accruing to KH on the
completion of the project.
Actual profit may be higher depending on prices obtained when the project is
launched in 2H 2013, as we note that private residential projects (non-EC) in
the vicinity have fetched substantially higher prices.
Source: Google Maps, SIAS Research
Tenure Fresh 99 year lease
Land Area (sqm) 21,718.40
Plot Ratio 2.8
GFA (sqm) 60,811.5
Net Saleable Floor Area (sqm) Est. at 95% of GFA 57,770.9
Est. ASP (S$ per sq. ft.) 720
Sales Value (S$m) 447.7 Source: SIAS Research
Land Cost (S$m) 211.9
Construction Cost (S$m) 149.9
Other Costs (est. @ 10% sales) 44.8
Tax 7.0
Est. Profit 34.1
KH's share (@ 20% of profit) 6.8
Project Structure
Page 9 of 17
www.siasresearch.com IInniittiiaattiioonn RReeppoorrtt
31 January 2013
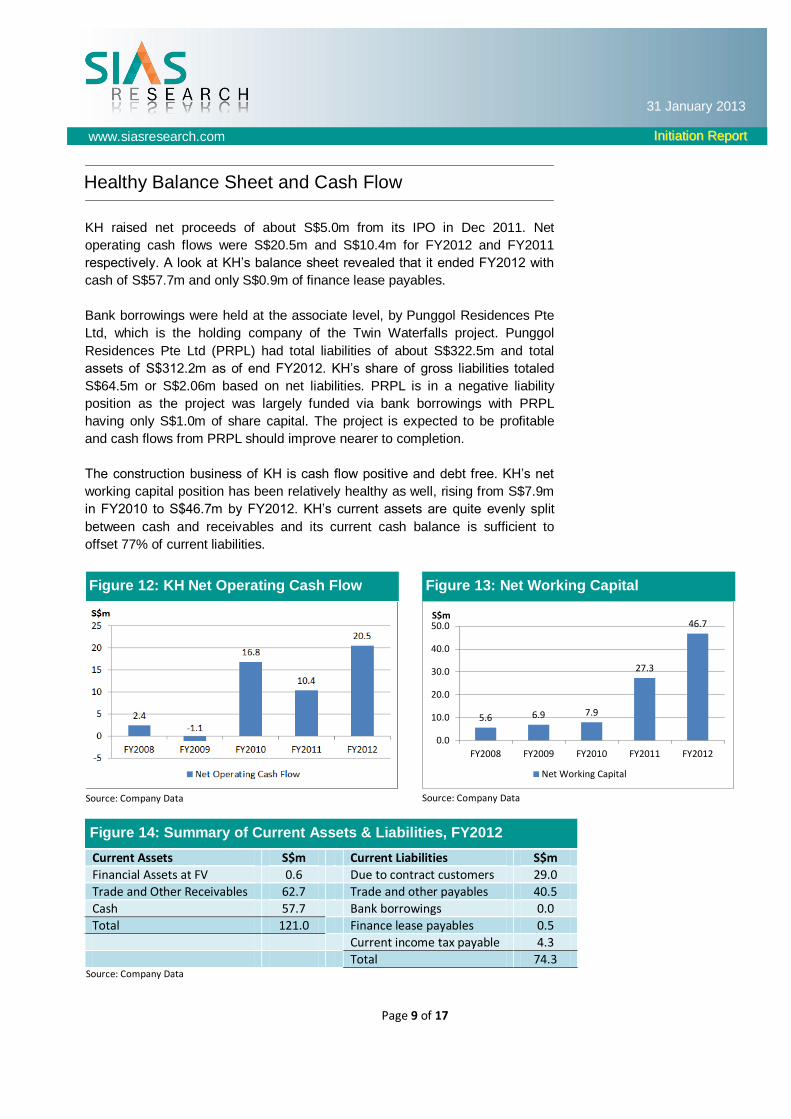
Healthy Balance Sheet and Cash Flow
Figure 12: KH Net Operating Cash Flow Figure 13: Net Working Capital
Figure 14: Summary of Current Assets & Liabilities, FY2012
KH raised net proceeds of about S$5.0m from its IPO in Dec 2011. Net
operating cash flows were S$20.5m and S$10.4m for FY2012 and FY2011
respectively. A look at KH’s balance sheet revealed that it ended FY2012 with
cash of S$57.7m and only S$0.9m of finance lease payables.
Bank borrowings were held at the associate level, by Punggol Residences Pte
Ltd, which is the holding company of the Twin Waterfalls project. Punggol
Residences Pte Ltd (PRPL) had total liabilities of about S$322.5m and total
assets of S$312.2m as of end FY2012. KH’s share of gross liabilities totaled
S$64.5m or S$2.06m based on net liabilities. PRPL is in a negative liability
position as the project was largely funded via bank borrowings with PRPL
having only S$1.0m of share capital. The project is expected to be profitable
and cash flows from PRPL should improve nearer to completion.
The construction business of KH is cash flow positive and debt free. KH’s net
working capital position has been relatively healthy as well, rising from S$7.9m
in FY2010 to S$46.7m by FY2012. KH’s current assets are quite evenly split
between cash and receivables and its current cash balance is sufficient to
offset 77% of current liabilities.
Source: Company Data
5.6 6.9 7.9
27.3
46.7
0.0
10.0
20.0
30.0
40.0
50.0
FY2008 FY2009 FY2010 FY2011 FY2012
S$m
Net Working Capital
Source: Company Data
Current Assets S$m Current Liabilities S$m
Financial Assets at FV 0.6 Due to contract customers 29.0
Trade and Other Receivables 62.7 Trade and other payables 40.5
Cash 57.7 Bank borrowings 0.0
Total 121.0 Finance lease payables 0.5
Current income tax payable 4.3
Total 74.3 Source: Company Data
Page 10 of 17
www.siasresearch.com IInniittiiaattiioonn RReeppoorrtt
31 January 2013
Future Plans for Growth
Figure 15: Maldives Annual Tourist Arrivals Figure 16: Maldives Bed Capacity and Utilization
Thus far, we have established that KH has done relatively well as a
construction company with an initial foothold in property development. Our
observation is that KH is still pursuing business development in several
frontiers to maintain long term growth of the company. These efforts, if
successful, lay the foundation for long term enhancement of shareholders’
value. These longer term measures can be viewed along three angles – a)
Overseas Expansion, b) Expansion into Property Development and c)
Competing for Higher Value Projects.
Overseas Expansion: KH secured a project in 2009 to construct a resort
development at Falhumaafushi Island at Gaafu Alifu Atoll, Maldives. Thereafter,
KH further secured a contract to build an airport on the island to service the
resort. These contracts had helped KH diversify its portfolio and gain
experience in overseas operations. As far as we understand, KH intends to
continue bidding for contracts in the Maldives as and when opportunities are
available. This is to leverage on its experience in this country and to export its
mature construction know how.
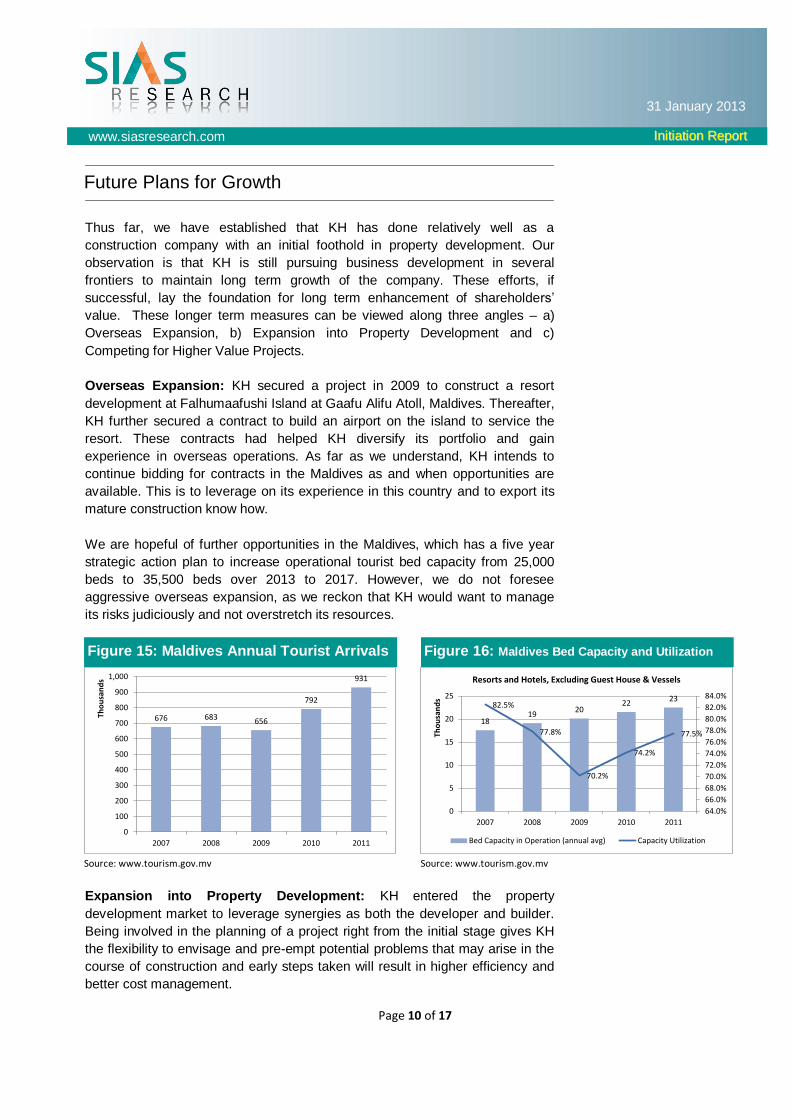
We are hopeful of further opportunities in the Maldives, which has a five year
strategic action plan to increase operational tourist bed capacity from 25,000
beds to 35,500 beds over 2013 to 2017. However, we do not foresee
aggressive overseas expansion, as we reckon that KH would want to manage
its risks judiciously and not overstretch its resources.
Expansion into Property Development: KH entered the property
development market to leverage synergies as both the developer and builder.
Being involved in the planning of a project right from the initial stage gives KH
the flexibility to envisage and pre-empt potential problems that may arise in the
course of construction and early steps taken will result in higher efficiency and
better cost management.
676 683 656
792
931
0
100
200
300
400
500
600
700
800
900
1,000
2007 2008 2009 2010 2011
Tho
usa
nd
s
Source: www.tourism.gov.mv
1819
2022
2382.5%
77.8%
70.2%
74.2%
77.5%
64.0%
66.0%
68.0%
70.0%
72.0%
74.0%
76.0%
78.0%
80.0%
82.0%
84.0%
0
5
10
15
20
25
2007 2008 2009 2010 2011
Tho
usa
nd
s
Resorts and Hotels, Excluding Guest House & Vessels
Bed Capacity in Operation (annual avg) Capacity Utilization
Source: www.tourism.gov.mv
Page 11 of 17
www.siasresearch.com IInniittiiaattiioonn RReeppoorrtt
31 January 2013
Figure 17: Avg. Value of Major Projects Figure 18: Total Value of Major Projects
On the other hand, lessons gained from the property development business will
allow KH to position itself as a solution provider to customers at the
construction business, offering feasible solutions from both the developer and
contractor’s perspective to reduce overall costs and refine specifications.
We gathered from our interviews with the management that KH is mindful of
current conditions within the property development space. We do not foresee
KH going on a land acquisition spree, but will instead continue to take an equity
investment in development opportunities that arise, to raise growth and to build
property development capabilities over time. The focus, in our impression,
remains more on construction. As evidenced by the latest Sembawang EC
project, KH only took on a 20% stake for an equity investment of S$0.2m.
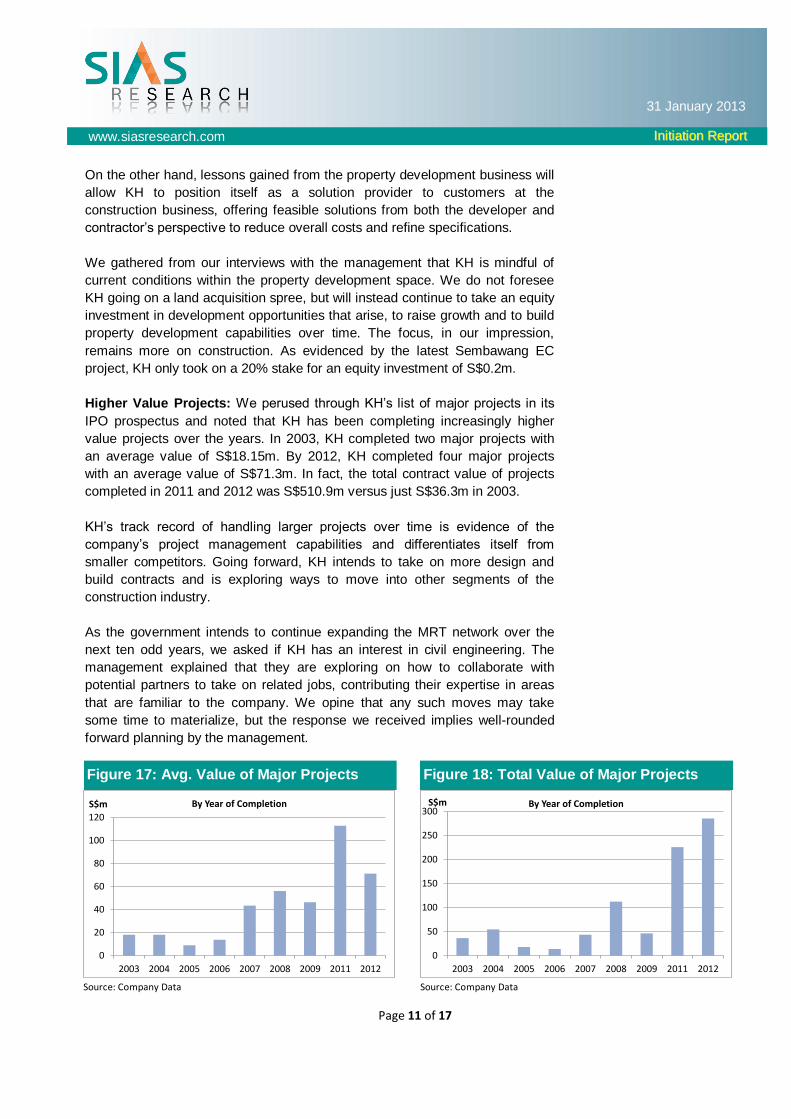
Higher Value Projects: We perused through KH’s list of major projects in its
IPO prospectus and noted that KH has been completing increasingly higher
value projects over the years. In 2003, KH completed two major projects with
an average value of S$18.15m. By 2012, KH completed four major projects
with an average value of S$71.3m. In fact, the total contract value of projects
completed in 2011 and 2012 was S$510.9m versus just S$36.3m in 2003.
KH’s track record of handling larger projects over time is evidence of the
company’s project management capabilities and differentiates itself from
smaller competitors. Going forward, KH intends to take on more design and
build contracts and is exploring ways to move into other segments of the
construction industry.
As the government intends to continue expanding the MRT network over the
next ten odd years, we asked if KH has an interest in civil engineering. The
management explained that they are exploring on how to collaborate with
potential partners to take on related jobs, contributing their expertise in areas
that are familiar to the company. We opine that any such moves may take
some time to materialize, but the response we received implies well-rounded
forward planning by the management.
0
20
40
60
80
100
120
2003 2004 2005 2006 2007 2008 2009 2011 2012
S$m By Year of Completion
Source: Company Data
0
50
100
150
200
250
300
2003 2004 2005 2006 2007 2008 2009 2011 2012
S$m By Year of Completion
Source: Company Data
Page 12 of 17
www.siasresearch.com IInniittiiaattiioonn RReeppoorrtt
31 January 2013
Attractive Valuation
Figure 19: P/BV versus ROE Figure 20: P/E versus EPS Growth
Figure 21: Sample Peer Comparison (as at 25 January 2013)
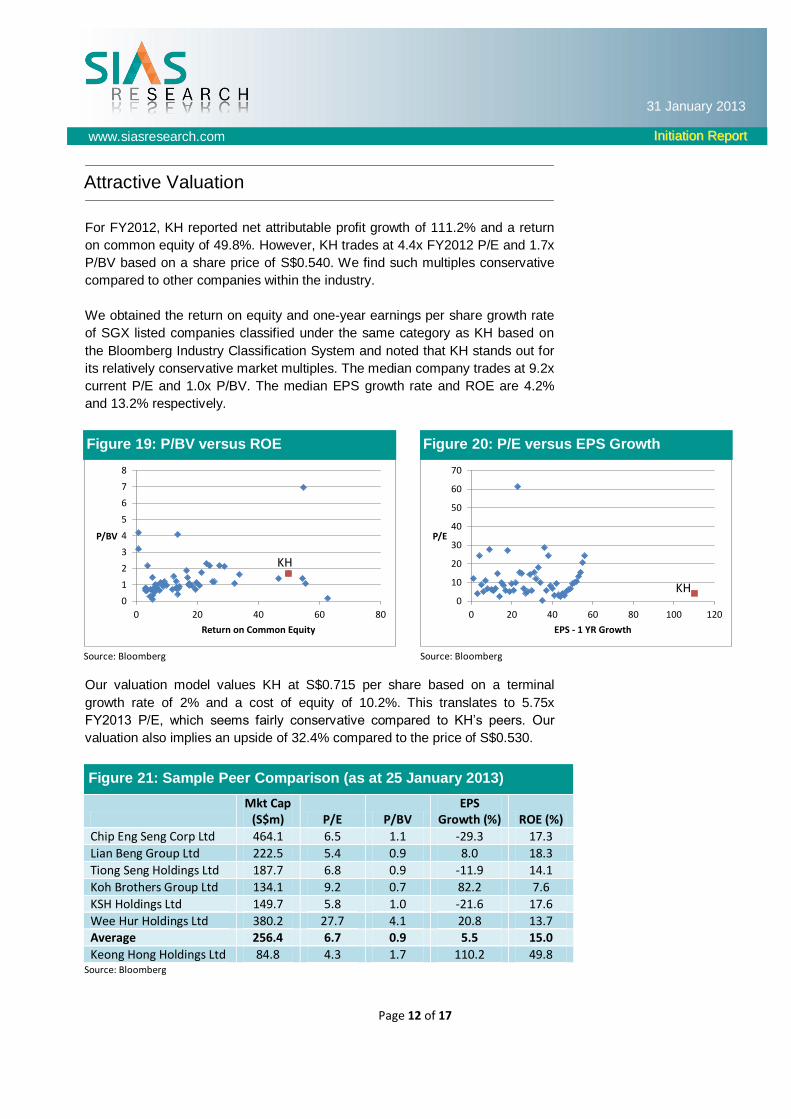
For FY2012, KH reported net attributable profit growth of 111.2% and a return
on common equity of 49.8%. However, KH trades at 4.4x FY2012 P/E and 1.7x
P/BV based on a share price of S$0.540. We find such multiples conservative
compared to other companies within the industry.
We obtained the return on equity and one-year earnings per share growth rate
of SGX listed companies classified under the same category as KH based on
the Bloomberg Industry Classification System and noted that KH stands out for
its relatively conservative market multiples. The median company trades at 9.2x
current P/E and 1.0x P/BV. The median EPS growth rate and ROE are 4.2%
and 13.2% respectively.
Our valuation model values KH at S$0.715 per share based on a terminal
growth rate of 2% and a cost of equity of 10.2%. This translates to 5.75x
FY2013 P/E, which seems fairly conservative compared to KH’s peers. Our
valuation also implies an upside of 32.4% compared to the price of S$0.530.
0
1
2
3
4
5
6
7
8
0 20 40 60 80
P/BV
Return on Common Equity
Source: Bloomberg
0
10
20
30
40
50
60
70
0 20 40 60 80 100 120
P/E
EPS - 1 YR Growth
Source: Bloomberg
KH
Mkt Cap
(S$m) P/E P/BV EPS
Growth (%) ROE (%)
Chip Eng Seng Corp Ltd 464.1 6.5 1.1 -29.3 17.3
Lian Beng Group Ltd 222.5 5.4 0.9 8.0 18.3
Tiong Seng Holdings Ltd 187.7 6.8 0.9 -11.9 14.1
Koh Brothers Group Ltd 134.1 9.2 0.7 82.2 7.6
KSH Holdings Ltd 149.7 5.8 1.0 -21.6 17.6
Wee Hur Holdings Ltd 380.2 27.7 4.1 20.8 13.7 Average 256.4 6.7 0.9 5.5 15.0
Keong Hong Holdings Ltd 84.8 4.3 1.7 110.2 49.8 Source: Bloomberg
KH
Page 13 of 17
www.siasresearch.com IInniittiiaattiioonn RReeppoorrtt
31 January 2013
Risks
Changes in Raw Material Prices: In pricing a contract, KH is exposed to risks
such as cost overruns due to raw material price fluctuations. Some construction
companies mitigate raw material price risk by procuring supplies shortly after
being awarded a contract, or by passing these costs to subcontractors.
According to the management, the price of most raw materials have stabilized
lately while cement costs have inched up somewhat. Therefore, raw material
costs do not seem to be a major risk to watch out for at this juncture.
Labor Costs and Availability: We opine that labor costs and availability
present a larger risk to the company – a point that KH mooted in its results
announcement dated November 2012. Our channel checks with some
construction companies suggest that labor availability is being challenged by
higher work volume versus limited local supply of construction professionals
and the government’s move to tighten foreign worker supply.
KH is mitigating this risk via productivity improvements. In FY2012, the
company invested in new plant and machinery, including boom lift, JCB
telescopic handler, crane tower and scissor lifts. KH asserted that the adoption
of technology and the mechanization of its work processes have raised
construction productivity by 25% to 35%. Long term solutions come in the form
of KH’s collaboration with SIM and BCA to offer scholarships for diploma
students and undergraduates to attract local talent.
Revenue/Sales Volatility: KH recognizes construction revenue based on the
percentage-of-completion method and manages two to three major projects at
any one point in time. As a result, the completion of one project may cause
short term fluctuations in revenue recognized if progress at a newer project has
yet to ramp up as fast even though the company may have successfully
renewed its order book.
Revenue from the Twin Waterfalls project will be recognized on completion and
will thus contribute towards FY2014 or FY2015 results depending on the actual
date of completion. The Twin Waterfalls is slated to be completed by December
2014 (FY2015). However, it is also possible that it be completed before end
Sep 2014 for recognition in FY2014. To be conservative, we assumed that the
Twin Waterfalls will be completed in FY2015.
There is uncertainty over how well KH’s latest property development investment
at Sembawang will sell and what prices it will fetch. We are of the view that this
project will ultimately still be profitable. To mitigate risks from this source, we
did not incorporate the results of this project into our forecasts and valuation.
Page 14 of 17
www.siasresearch.com IInniittiiaattiioonn RReeppoorrtt
31 January 2013
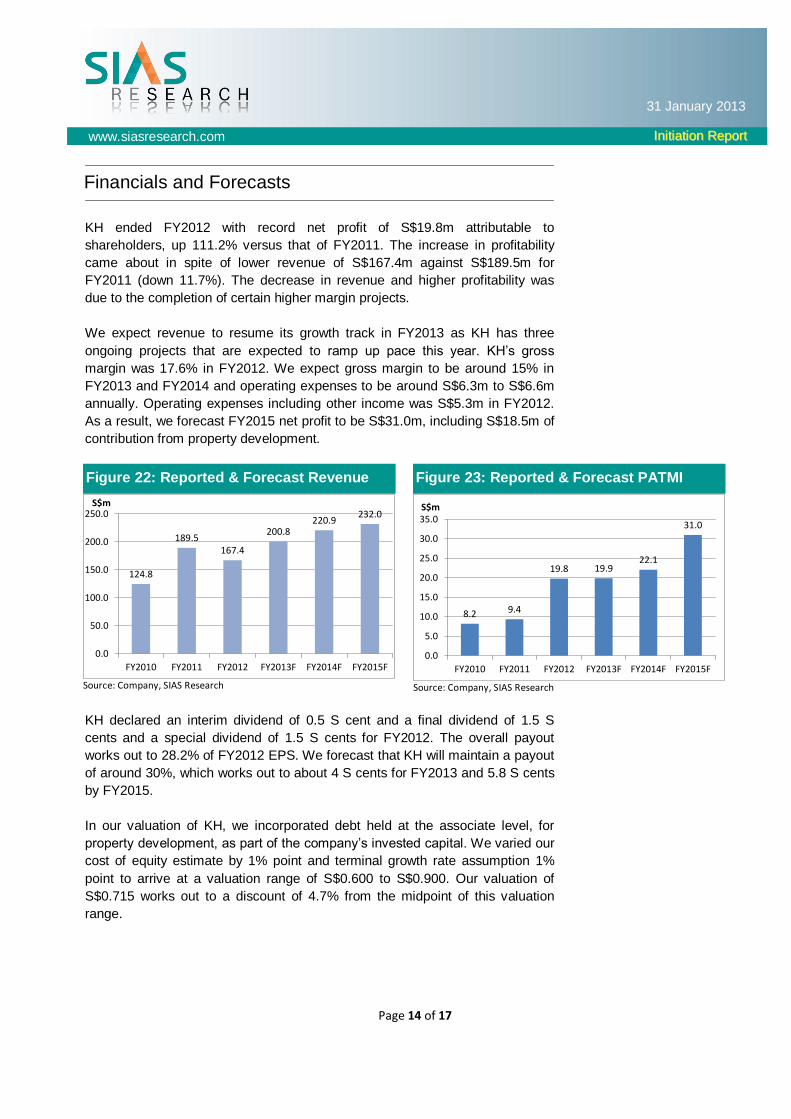
Figure 22: Reported & Forecast Revenue Figure 23: Reported & Forecast PATMI
Financials and Forecasts
KH ended FY2012 with record net profit of S$19.8m attributable to
shareholders, up 111.2% versus that of FY2011. The increase in profitability
came about in spite of lower revenue of S$167.4m against S$189.5m for
FY2011 (down 11.7%). The decrease in revenue and higher profitability was
due to the completion of certain higher margin projects.
We expect revenue to resume its growth track in FY2013 as KH has three
ongoing projects that are expected to ramp up pace this year. KH’s gross
margin was 17.6% in FY2012. We expect gross margin to be around 15% in
FY2013 and FY2014 and operating expenses to be around S$6.3m to S$6.6m
annually. Operating expenses including other income was S$5.3m in FY2012.
As a result, we forecast FY2015 net profit to be S$31.0m, including S$18.5m of
contribution from property development.
KH declared an interim dividend of 0.5 S cent and a final dividend of 1.5 S
cents and a special dividend of 1.5 S cents for FY2012. The overall payout
works out to 28.2% of FY2012 EPS. We forecast that KH will maintain a payout
of around 30%, which works out to about 4 S cents for FY2013 and 5.8 S cents
by FY2015.
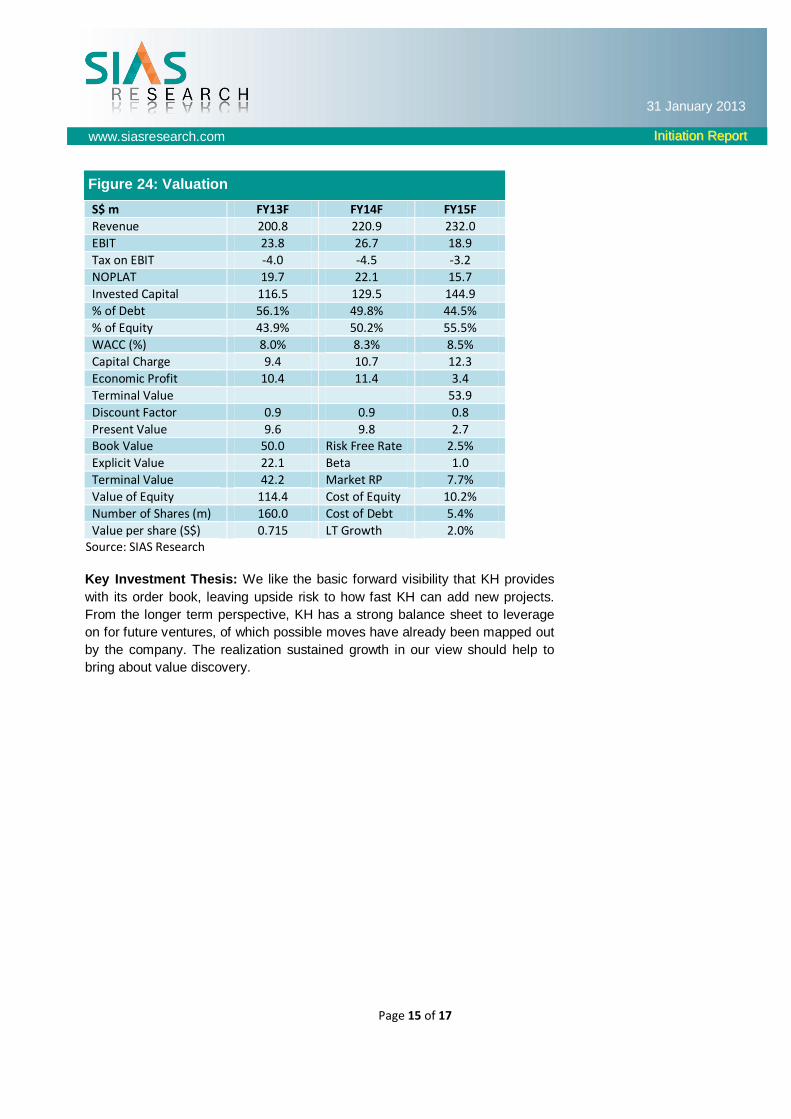
In our valuation of KH, we incorporated debt held at the associate level, for
property development, as part of the company’s invested capital. We varied our
cost of equity estimate by 1% point and terminal growth rate assumption 1%
point to arrive at a valuation range of S$0.600 to S$0.900. Our valuation of
S$0.715 works out to a discount of 4.7% from the midpoint of this valuation
range.
124.8
189.5167.4
200.8220.9
232.0
0.0
50.0
100.0
150.0
200.0
250.0
FY2010 FY2011 FY2012 FY2013F FY2014F FY2015F
S$m
Source: Company, SIAS Research
8.2 9.4
19.8 19.922.1
31.0
0.0
5.0
10.0
15.0
20.0
25.0
30.0
35.0
FY2010 FY2011 FY2012 FY2013F FY2014F FY2015F
S$m
Source: Company, SIAS Research
Page 15 of 17
www.siasresearch.com IInniittiiaattiioonn RReeppoorrtt
31 January 2013
Figure 24: Valuation
S$ m FY13F FY14F FY15F
Revenue 200.8 220.9 232.0
EBIT 23.8 26.7 18.9
Tax on EBIT -4.0 -4.5 -3.2
NOPLAT 19.7 22.1 15.7
Invested Capital 116.5 129.5 144.9
% of Debt 56.1% 49.8% 44.5%
% of Equity 43.9% 50.2% 55.5%
WACC (%) 8.0% 8.3% 8.5%
Capital Charge 9.4 10.7 12.3
Economic Profit 10.4 11.4 3.4
Terminal Value 53.9
Discount Factor 0.9 0.9 0.8
Present Value 9.6 9.8 2.7 Book Value 50.0 Risk Free Rate 2.5%
Explicit Value 22.1 Beta 1.0
Terminal Value 42.2 Market RP 7.7%
Value of Equity 114.4 Cost of Equity 10.2%
Number of Shares (m) 160.0 Cost of Debt 5.4%
Value per share (S$) 0.715 LT Growth 2.0% Source: SIAS Research
Key Investment Thesis: We like the basic forward visibility that KH provides
with its order book, leaving upside risk to how fast KH can add new projects.
From the longer term perspective, KH has a strong balance sheet to leverage
on for future ventures, of which possible moves have already been mapped out
by the company. The realization sustained growth in our view should help to
bring about value discovery.
Page 16 of 17
www.siasresearch.com IInniittiiaattiioonn RReeppoorrtt
31 January 2013
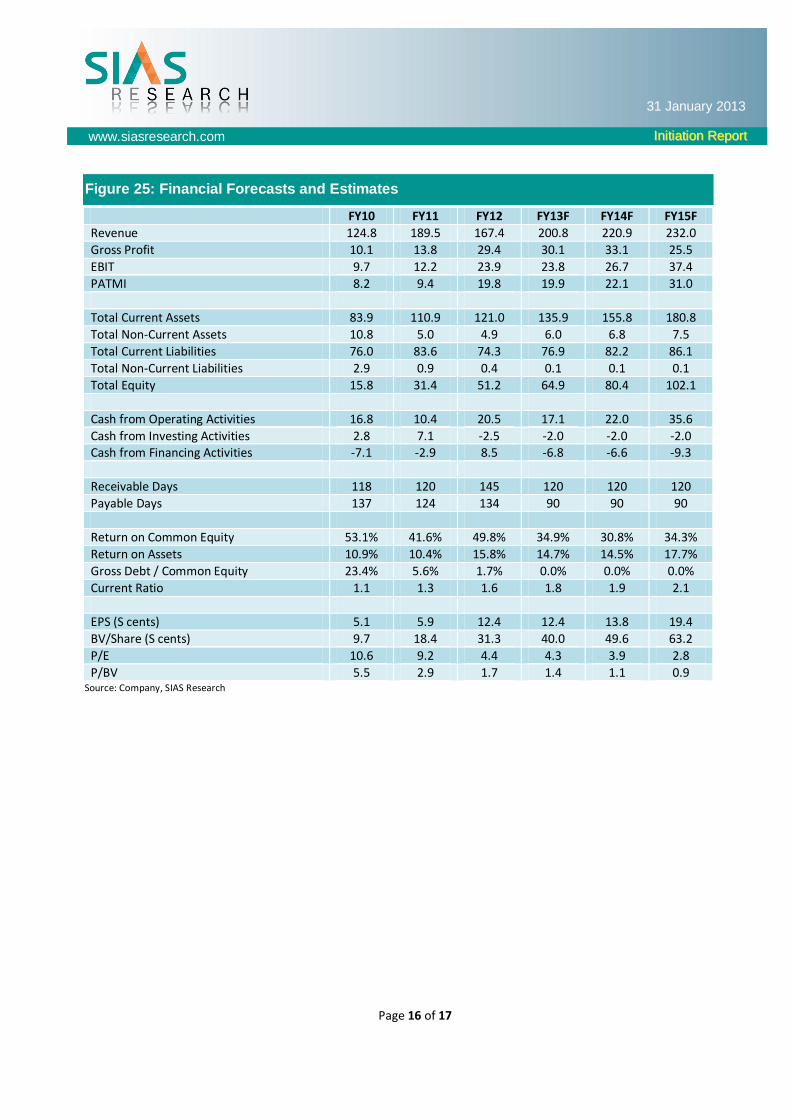
Figure 25: Financial Forecasts and Estimates
FY10 FY11 FY12 FY13F FY14F FY15F
Revenue 124.8 189.5 167.4 200.8 220.9 232.0
Gross Profit 10.1 13.8 29.4 30.1 33.1 25.5
EBIT 9.7 12.2 23.9 23.8 26.7 37.4
PATMI 8.2 9.4 19.8 19.9 22.1 31.0
Total Current Assets 83.9 110.9 121.0 135.9 155.8 180.8
Total Non-Current Assets 10.8 5.0 4.9 6.0 6.8 7.5
Total Current Liabilities 76.0 83.6 74.3 76.9 82.2 86.1
Total Non-Current Liabilities 2.9 0.9 0.4 0.1 0.1 0.1
Total Equity 15.8 31.4 51.2 64.9 80.4 102.1
Cash from Operating Activities 16.8 10.4 20.5 17.1 22.0 35.6
Cash from Investing Activities 2.8 7.1 -2.5 -2.0 -2.0 -2.0 Cash from Financing Activities -7.1 -2.9 8.5 -6.8 -6.6 -9.3
Receivable Days 118 120 145 120 120 120
Payable Days 137 124 134 90 90 90
Return on Common Equity 53.1% 41.6% 49.8% 34.9% 30.8% 34.3%
Return on Assets 10.9% 10.4% 15.8% 14.7% 14.5% 17.7%
Gross Debt / Common Equity 23.4% 5.6% 1.7% 0.0% 0.0% 0.0%
Current Ratio 1.1 1.3 1.6 1.8 1.9 2.1
EPS (S cents) 5.1 5.9 12.4 12.4 13.8 19.4
BV/Share (S cents) 9.7 18.4 31.3 40.0 49.6 63.2
P/E 10.6 9.2 4.4 4.3 3.9 2.8
P/BV 5.5 2.9 1.7 1.4 1.1 0.9 Source: Company, SIAS Research
Page 17 of 17
www.siasresearch.com IInniittiiaattiioonn RReeppoorrtt
31 January 2013
Rating Definition:
Increase Exposure – The current price of the stock is significantly lower than the underlying fundamental value. Readers can
consider increasing their exposure in their portfolio to a higher level.
Invest – The current price of the stock is sufficiently lower than the underlying fundamental value of the firm. Readers can
consider adding this stock to their portfolio. Fairly Valued – The current price of the stock is reflective of the underlying fundamental value of the firm. Readers may not
need to take actions at current price. Take Profit – The current price of the stock is sufficiently higher than the underlying fundamental value of the firm. Readers
can consider rebalancing their portfolio to take advantage of the profits. Reduce Exposure - The current price of the stock is significantly higher than the underlying fundamental value of the firm.
Readers can consider reducing their holdings in their portfolio.
IMPORTANT DISCLOSURE
As of the date of this report, the analyst and his immediate family may own or have positions in any securities mentioned
herein or any securities related thereto and may from time to time add or dispose of or may be materially interested in any such securities. Portfolio structure should be the responsibility of the investor and they should take into consideration their
financial position and risk profile when structuring their portfolio. Investors should seek the assistance of a qualified and
licensed financial advisor to help them structure their portfolio. This research report is based on information, which we believe
to be reliable. Any opinions expressed reflect our judgment at report date and are subject to change without notice. This research material is for information only. It does not have regards to the specific investment objectives, financial situation and
the particular needs of any specific person who may receive or access this research material. It is not to be construed as an offer, or solicitation of an offer to sell or buy securities referred herein. The use of this material does not absolve you of your
responsibility for your own investment decisions. We accept no liability for any direct or indirect loss arising from the use of this research material. We, our associates, directors and/or employees may have an interest in the securities and/or companies
mentioned herein. This research material may not be reproduced, distributed or published for any purpose by anyone without our specific prior consent.
Recommended