
Keeping It Simple: Financial Literacy and Rules of Thumb
The MIT Faculty has made this article openly available. Please share how this access benefits you. Your story matters.
Citation Drexler, Alejandro, Greg Fischer, and Antoinette Schoar. “ KeepingIt Simple: Financial Literacy and Rules of Thumb † .” AmericanEconomic Journal: Applied Economics 6, no. 2 (April 2014): 1–31.
As Published http://dx.doi.org/10.1257/app.6.2.1
Publisher American Economic Association
Version Author's final manuscript
Citable link http://hdl.handle.net/1721.1/88086
Terms of Use Creative Commons Attribution-Noncommercial-Share Alike
Detailed Terms http://creativecommons.org/licenses/by-nc-sa/4.0/

Keeping it Simple: Financial Literacy and Rules of Thumb
By ALEJANDRO DREXLER, GREG FISCHER, AND ANTOINETTE SCHOAR∗
Micro-entrepreneurs often lack the financial literacy required for the
complex financial decisions they face. We conduct a randomized con-
trol trial with a bank in the Dominican Republic to compare the im-
pact of two distinct programs: a standard accounting training versus
a simplified, rule-of-thumb training that teaches basic financial heuris-
tics. Only the latter produced significant improvements in firms’ finan-
cial practices, objective reporting quality and revenues. Looking at
treatment heterogeneity, the impact is especially pronounced for micro-
entrepreneurs with lower skills or poor initial financial practices. These
results suggest that reducing the complexity of training programs might
improve their effectiveness, especially for less sophisticated clients.
JEL: C93, D12, I21, J24, O12
Keywords: financial literacy, entrepreneurship, business training, mi-
crofinance, adult education
I. Introduction
Individuals and micro-entrepreneurs alike are asked to make complex financial deci-
sions in many areas of life, whether in their personal finances in the form of savings
decisions and retirement planning or in a business context as small business owners or
investors. However, a growing literature shows that a large fraction of the population
is woefully underprepared to make these decisions. Lusardi and Mitchell (2007b) and
Lusardi and Tufano (2009), for example, find low levels of financial literacy in the US
population, an inability to understand basic financial concepts such as the importance of
retirement savings, and poor judgment in borrowing decisions. Similarly, Cole, Samp-
son and Zia (2009) document very low levels of financial literacy for households in India
and Indonesia. In addition, these studies find a strong association between understanding
financial concepts, better financial decisions, and household well-being.
The challenge is to determine whether and how financial literacy can be taught and,
closely related, whether there is a causal link between improving financial literacy and
individual outcomes. The evidence so far has been mixed, with large heterogeneity in
∗ Drexler: UT Austin, [email protected]. Fischer: London School of Economics, Innova-
tions for Poverty Action, and Jameel Poverty Action Lab, [email protected]. Schoar: MIT, NBER, and ideas42,
[email protected]. We would like to thank Ximena Cadena and Héber Delgado for exceptional research assistance.
We are also deeply indebted to numerous individuals at ADOPEM whose dedication and patience were critical to this
project. Particular thanks are due to Mercedes de Canalda, Mercedes Canalda de Beras-Goico, Eva Carvajal de Toribio,
Eddy Santana, Juan Francisco Terrero, Claribel Diaz, and Felipe Diaz. We are grateful to Simeon Djankov, Bobbi Gray,
Dean Karlan, Sendhil Mullainathan, Russell Toth and seminar participants at the CEPR Development Economics Work-
shop, Cornell, LSE, the Microfinance Impact and Innovation Conference, UT Austin, and the World Bank for many
helpful comments and suggestions. Financial support from the IFC and two anonymous donors is acknowledged and
greatly appreciated.
1
the estimated success of training programs. For example, Bernheim and Garrett (2003)
and Lusardi (2005) provide survey evidence that people who attend financial counsel-
ing programs subsequently make better financial decisions, especially those attendees
with low income and education levels. The estimated effects of the programs are large;
however, self-selection into training could lead to an upward bias. In contrast, Duflo and
Saez (2003) conduct a randomized control trial exposing employees to a benefits fair that
raises awareness about retirement savings, but they find only a small effect on savings
plan enrollment. Similarly, Cole, Sampson and Zia (2009) find only modest effects from
a financial literacy training program in Indonesia.
One major challenge in studying the impact of such financial literacy programs is that
measured impacts conflate the usefulness of the financial skills with the effectiveness of
the specific training methodology used in the study. To date we have only very limited
systematic knowledge about the dimensions that determine a financial literacy program’s
impact. This impact might be crucially affected by the comprehensiveness and com-
plexity of the materials, and all training programs face a trade-off between the ease with
which participants can grasp the concepts and their potential depth of understanding.
To advance our knowledge of how differences in the structure and complexity of train-
ing programs affect participants’ performance, we worked with a bank in the Dominican
Republic to conduct a randomized control trial comparing the impact of two financial
literacy training programs for small business owners. While we do not focus specifically
on consumer financial literacy of the sort studied by Lusardi and Mitchell (2007a) and
others, we note that for microenterprises the boundary between business and personal
financial decisions is often blurred. In order to understand the channel through which
financial training may affect recipients, we developed two distinct types of training that
span the spectrum between comprehensiveness of the material and ease of understand-
ing. Our aim in designing and evaluating these two programs is to assess whether there
may be advantages to reducing the complexity of training programs and, in particular,
if the simpler rule-of-thumb training is a better fit for less-educated or less financially
sophisticated clients.
The standard accounting program closely follows a standard approach to small busi-
ness training, which is designed to teach micro-entrepreneurs the basics of double-entry
accounting, working capital management, and investment decisions. Similar programs
are used around the world by groups such as Freedom from Hunger, the International La-
bor Organization, BRAC, and many others. The rule-of-thumb training focuses on very
simple heuristics or routines for financial decision making without aiming to provide
comprehensive accounting knowledge. For example, the standard accounting trainings
taught participants to separate their business and personal accounts by instructing them
how to calculate business profits based on a typical accounting curriculum for micro-
entrepreneurs. The rule-of-thumb training gave them a physical rule to keep their money
in two separate drawers (or purses) and to only transfer money from one drawer to the
other with an explicit “IOU” note between the business and the household. At the end of
the month they could then count how much money was in the business drawer and know
what their profits were.
2
Between November 2006 and July 2008, we implemented a randomized control trial of
these two training programs in collaboration with ADOPEM, a microfinance institution
(MFI) that lends to individuals and small businesses in the Dominican Republic. We
selected 1193 existing clients of ADOPEM who had expressed some interest in training
and randomly assigned them either to one of the two trainings or a control group. Our
results document important differences in the impact of the two approaches. People who
were offered rule-of-thumb-based training showed significant improvements in the way
they managed their finances and in the accuracy and internal consistency of the numbers
they reported. They were more likely to keep accounting records, calculate monthly
revenues, and separate their books for the business and the home. Improvements along
these dimensions are on the order of 10 percentage points. In contrast, we did not find any
significant changes for those in the standard accounting training. Overall, it appears that
the micro-entrepreneurs in our study were more likely to implement what they learned
in the rule-of-thumb training.
In studying training programs, measurement effects are a natural concern. Respon-
dents may report what they believe surveyors want to hear. Therefore, we developed
and looked for changes in objective measures of reporting quality. Consistent with the
belief that SMEs lack financial controls, the quality of self-reported firm data is poor. In
the baseline survey, nearly half of the respondents make at least one error when asked to
report sales and profits over different time horizons and levels of aggregation. Similarly,
self-reported profits are on average substantially lower than what one would calculate
from respondents’ own revenue and expense detail.1 The standard accounting training
generates small and not statistically significant improvements in both dimensions. In
contrast, the rule-of-thumb training significantly improves objective reporting quality.
The error rate falls by nine percentage points, and the mean difference between the two
profit measures drops by more than 50 percent. These improvements in objective report-
ing quality suggest that the rule-of-thumb training changes actual business management
practices. They also underscore a key challenge in using profits as an outcome mea-
sure in business training studies. Not only are profits difficult to measure—this is well
understood—but estimated effects often conflate the effect of the treatment on actual
profits with changes in reporting quality.
When looking at the impact of training on business outcomes, we again find a more
significant change in the group that received the rule-of-thumb training. We find a statis-
tically significant and economically meaningful impact of 0.11 standard deviations on an
index of revenue measures. The most significant effect is observed in the level of sales
during bad weeks, consistent with an emerging pattern in other recent studies (Karlan
and Valdivia, 2011; Berge, Bjorvatn and Tungodden, 2010). The standard accounting
training produces no significant effects.
1The direction of this reporting bias goes in the opposite direction from what De Mel, McKenzie and Woodruff
(2009) found in their sample of small firms in Sri Lanka, for which self-reported profits are larger than those calculated
from revenue and expense detail. We speculate that the firms in our sample have less incentive to underreport revenues
but have poor recall over expense detail and fail to record the necessary information. Note also that there is substantial
variation in these errors. In the control group, directly reported profits are less than calculated profits for 58% of the
sample and larger for 28%.
3
In a second step we test for heterogeneous treatment effects, comparing the relative
effect of the trainings across clients with different characteristics. The rule-of-thumb
training produces a more pronounced effect for less sophisticated clients: those with
the lowest human capital, limited ex ante interest in accounting or financial training,
and with baseline business practices in the lowest quartile.2 For these clients, the dif-
ferences between the rule-of-thumb and standard accounting trainings are economically
and statistically significant. These findings highlight the importance of heterogeneity and
targeting training materials to client characteristics. A simplified rule-of-thumb training
appears well suited to the needs of the less sophisticated clients.
Taken together, these results suggest that effective training may operate by helping
individuals to better manage negative shocks or by improving their financial controls,
which may allow them to predict and counteract the effect of slow weeks more proac-
tively. However, it is important to note that improvements for firms in the rule-of-thumb
treatment could stem from net business growth or from a redistribution from other enter-
prises in their area. Our study design allows us to test for these negative spillovers. We
find a small but statistically significant drop in sales for firms located near more treated
firms if these treated firms are in the same general line of business. These results are
suggestive that some of the growth in the treated firms was due to crowding out of other
firms and identify an important avenue for future work.
The rest of the paper is organized as follows. Section 2 briefly describes the related
literature, and Section 3 details the experimental design. Section 4 describes the data and
empirical strategy, Section 5 presents the results, and Section 6 concludes.
II. Related Literature and Background
A growing literature has documented the low level of financial literacy in the general
population and its impact on individual decision making. Lusardi (2008) finds wide-
spread lack of financial literacy among large sections of the US population, especially
among people with low levels of education, women, and ethnic minorities. This lack of
financial literacy is associated with poor financial decision making, in particular regard-
ing retirement planning (Lusardi and Mitchell, 2007a), borrowing decisions (Lusardi
and Tufano, 2009; Stango and Zinman, 2009), investment choices (Lusardi and Mitchell,
2007b), and participation in the formal financial system (van Rooij, Lusardi and Alessie,
2007).
Yet despite the strong association between financial literacy and a range of measures
of financial well-being, little is known about the efficacy of financial literacy training
programs in improving these outcomes Braunstein and Welch (2002). Causal inference
for many studies is hindered by endogenous selection into training programs.3 Where
2The original sample frame of 1193 individuals comprised borrowers who expressed interest in generic business
training before the start of the program. In the baseline survey, respondents were asked to indicate their interest in
specific forms of training. We classify an individual as “interested in training” if she indicated a desire to receive training
in business accounting or financial management.3Meier and Sprenger (2008), for example, document that individuals who choose to acquire personal financial infor-
mation through a credit counseling program discount the future less than individuals who choose not to participate.
4
causal effects can be clearly identified, the results are mixed. Bernheim, Garrett and
Maki (2001) exploit variation across states and time in mandatory financial education for
high school students and find that mandates increased exposure to financial curricula and
ultimately asset accumulation; however, subsequent work by Cole and Shastry (2009)
uses a larger sample and finds little effect. Cole, Sampson and Zia (2009) conduct a
randomized control trial of a financial education program in Indonesia. They find that
while financial literacy is strongly correlated with the demand for financial services,
financial literacy education had modest effects on demand and was dwarfed by the effect
of even a small subsidy to open a savings account.
Moreover, most studies use the term “financial literacy training” to refer to a myriad of
different programs, varying from one-day consultation sessions in the field to one year of
detailed in-class training. This variation makes it difficult to interpret results and compare
the impact of training across studies. In particular, these studies do not allow one to
test which features of literacy training are more effective than others. In contrast, this
study explicitly tests the impact of different types of financial literacy training—standard
accounting and a simplified, rules-of-thumb approach—with the aim of beginning to
understand the mechanisms through which training programs may or may not work.
We also focus on a specific type of training aimed at small business owners. Until
recently, surprisingly few studies looked at financial literacy for this population, even
though significant resources are devoted to accounting and financial literacy training for
them.4 The first notable exception was Karlan and Valdivia (2011), which studies the im-
pact of teaching basic finance concepts to micro-entrepreneurs.5 Their study finds a large
impact on clients’ knowledge of financial terms and reported business practices. Results
are more mixed on real outcomes such as sales or consumption, but the microfinance
institution benefited from increased retention and repayment.
The issue of building managerial capital for small business owners has received in-
creased attention of late (McKenzie and Woodruff, 2012). Field, Jayachandran and
Pande (2010) evaluate a two-day training program for clients of an Indian microfinance
institution. Their study focuses on constraints to women’s entrepreneurial choices, with
particular attention on encouraging savings and improving debt management, and finds
that being invited to the training program increased both borrowing and the likelihood of
personal labor income. A recent program evaluation by Berge, Bjorvatn and Tungod-
den (2010) evaluates the effect of financial grants and a wide-ranging business training
program for clients of a microfinance institution in Tanzania. They find little effect on
female clients, but a substantial impact on men’s business practices and outcomes. Bruhn
4For example, the U.S. Small Business Administration’s (SBA) small business training network, the World Bank’s
SME Toolkit, the International Labour Organization’s Know About Business Programme, the Financial Education for
the Poor (FEP) project sponsored by Microfinance Opportunities, the Citigroup Foundation, Freedom from Hunger, and
many others aim to teach financial skills at huge expense every year. The SBA training includes modules on finance
and accounting, business planning, business start up, business management, government contracting, marketing and
advertising, and how to survive in a slow economy. The training is available online at http://www.sba.gov/training/. The
FEP targets microfinance clients, many of whom have only subsistence level business activity. The FEP project includes
five modules: credit administration, savings, financial negotiation, budgeting, and bank services.5The micro-entrepreneurs in their study are part of a group lending program with weekly meetings. In these weekly
sessions, clients in the treatment group also receive training.
5

and Zia (2011) study a training program for young entrepreneurs in post-conflict Bosnia
and Herzegovina, finding that while the program did not affect business survival, it sig-
nificantly improved business practices for surviving businesses. Similar to our study,
they find some evidence of heterogeneous responses: the training program appears to
improve business performance only for those individuals who were more skilled before
the program began.
A related strand in the literature on capacity building for small- and medium-size en-
terprises focuses on providing consulting and management services to firms. Bloom
et al. (2013) study the impact of intensive consulting services from an international man-
agement consulting firm on the business practices of medium- to large-size firms in the
Indian textile industry. Even these large firms were unaware of many modern manage-
ment practices, and treated plants significantly improved their management practices.
Bruhn, Karlan and Schoar (2010) conduct a randomized control trial of consulting ser-
vices in which small businesses were paired with a local management consultant for one
year. The study assigned firms to a wide range of management consulting services, with
financial literacy as an integral part of the intervention. More than 30 percent of the firms
requested financial advice as one of the main inputs.
We contribute to this literature by conducting an experiment designed to further our
understanding of the mechanisms through which training can affect businesses, explic-
itly comparing a standard accounting training with a simplified, rule-of-thumb-based
program. In this vein, we also build on a growing literature that supports the merits of
simplification in settings as varied as retirement savings plan enrollment (Beshears et al.,
2010; Choi, Laibson and Madrian, 2009), Medicare drug plans (Mullainathan and Shafir,
2009), weight loss (Mata, Todd and Lippke, 2010), and college student loan applications
(Bettinger et al., 2009). Research in cognitive psychology offers additional evidence
that simpler rules and less feedback may be preferable in certain learning environments
(Maddox et al., 2008; Maes and Eling, 2007). As Feldman (2003) notes, it is not sur-
prising that more complex tasks are also often more difficult to learn. However, this
seemingly obvious idea has until recently played little role in theories of concept learn-
ing. Similarly, the trend in business and financial literacy training appears to have been
towards increasing complexity. In the context of Dominican micro-entrepreneurs, our
results suggest that optimality may lie in the direction of simplification.
III. Experimental Design
ADOPEM is a savings and credit bank based in Santo Domingo, Dominican Repub-
lic serving primarily low-income, urban individuals and small businesses throughout the
country. ADOPEM was founded in 1982 as a non-governmental organization provid-
ing a range of programs aimed at reducing poverty levels in the Dominican Republic.
Since then, they have increased their focus on financial services and related activities,
incorporating as a bank in 2004. Large by Dominican standards, in 2006 ADOPEM
had approximately 59,000 clients in 19 branches. The bank offers a wide range of lend-
ing products; in 2006, 90 percent of loans were for amounts between RD$2,500 and
RD$50,000 (US$70-1,400). Over that same period, 56 percent of loans were made to
6
individual persons or businesses and 44 percent were made to solidarity groups of two to
five borrowers.6 Approximately 80 percent of these clients were women.
In addition to extending loans, ADOPEM offers savings, insurance, and remittance
products. It also operates a training center, with programs including basic computing, en-
trepreneurship, and specific trade skills. In the year before this experiment was launched,
ADOPEM was actively planning to launch a dedicated financial education program and
was interested in evaluating different approaches.
We worked with ADOPEM and Dominican training experts to develop two alterna-
tive financial education training programs. The standard accounting treatment offered a
traditional, principles-based course in basic accounting techniques. Topics covered in-
cluded daily record-keeping of cash sales and expenses, aggregation of daily records into
weekly and monthly reports, inventory management, accounts receivable and accounts
payable, calculating cash profits, and investment planning. The materials and capacitator
training program for the standard accounting treatment were based on the financial edu-
cation program designed by Freedom from Hunger, a US-based non-profit organization,
together with the Citigroup Foundation and adapted to local conditions.7
The rule-of-thumb treatment taught participants simple rules for financial decision
making, focusing on the need to separate business and personal accounts. Account sep-
aration is a staple rule in developed country entrepreneurship. In developing countries,
where the tax and legal motivations for account separation often are weaker, it contin-
ues to receive a great deal of attention. The proposed benefits of account separation are
twofold. On the one hand, it is seen as a very crude but easy way to monitor whether the
business is self-sustainable and provides an estimate of the profitability of the business.
The second rationale is more behavioral: keeping accounts separate serves as a commit-
ment device for the business owner (or relatives) not to over-consume and deplete the
working capital in the business. In addition to presenting several strategies for physi-
cally separating business and personal funds, the rule-of-thumb treatment taught how to
estimate business profits by simple changes in business cash on hand, paying oneself a
fixed salary, distinguishing business and personal expenses, and easy-to-implement tools
for reconciling accounts when business funds have been used for personal expenses or
the reverse. In both treatments, clients received record-keeping books, handouts, and
homework assignments to reinforce ideas or techniques from the meetings. Both classes
were offered once a week for three hours at a time. The standard accounting treatment
lasted for six weeks and the rule-of-thumb treatment for five. The first three classes of
both treatments covered consumption, savings, and debt management. The final three
classes of the standard accounting treatment comprised basic cash accounting, distin-
6ADOPEM’s solidarity groups follow the traditional joint liability model. Each borrower takes out his or her loan
as an individual, but all group members are jointly responsible for one another’s repayment. Should any member fail to
repay, each member suffers the default consequences as if she herself failed to repay.7The ADOPEM training program is most closely related to the budgeting module of the FFH training program. This
module includes training on: how to develop a financial plan for the household expenses, how to adapt the spending
to a restricted income, how to develop a budget for the house and the business, how to prioritize spending, how to
record income and expenses, how to use income and expenses book keeping to make financial decisions, and how to
store financial documents. Importantly, both ADOPEM training programs focused on maintaining a clear separation of
business accounts.
7
guishing business and personal expenses, calculating profits, and working capital man-
agement. Classes four and five of the rule-of-thumb treatment focused on separating
business and personal money and estimation techniques for calculating profits.8 Atten-
dance for classes one through five did not differ across the two treatments.
The sample consisted of 1,193 existing ADOPEM business or personal loan clients
from Santo Domingo.9 Of these, we assigned 402 to the accounting treatment, 404 to
the rule-of-thumb treatment, and 387 to a control group which received no additional
training services. The treatment was assigned at the individual level and administrative
data was used to stratify according to loan size, years of borrowing, and whether or not a
client maintained a formal savings account with the bank. Baseline survey data was not
available at the time of the stratification. ADOPEM made no additional policy changes
concurrent with the training program. The treatment was conducted in two waves. The
first wave, comprising 302 treatment assignments, was conducted from March to May
2007, and the second wave, comprising the remainder, ran from July to August of the
same year.10
All courses were taught by qualified local instructors. The majority had university
degrees and experience with adult education, in most cases with ADOPEM directly.
Courses were offered at seven schools throughout Santo Domingo and scheduled based
on preferences elicited during the baseline survey. In addition, the course was heavily
subsidized. Fees were randomly assigned at RD$200 (approximately US$6) or zero,
relative to an overall program cost of approximately RD$700.11
In order to begin understanding the potential limitations to classroom-based, financial
training, we also randomly assigned half of the people in each of the treatment groups to
receive follow-up training consisting of in-person visits of a financial trainer to the micro-
entrepreneur’s business. When necessary, the trainers reviewed the class materials with
the entrepreneurs and helped clarify any questions they might have had. The purpose of
the on-site visits was to ensure that individuals understood the material and were capable
of implementing their newly-acquired financial accounting skills in their businesses. This
structure helps us to differentiate the channel by which training affects the participants.
If we do not find an effect of training we can determine whether this result is due to
the inability of the participants to understand what was taught in class or whether the
material itself, even when properly understood, is not helpful.
8See Table A1 for a more detailed summary of the materials covered.9At the request of ADOPEM, group loan clients with loans smaller than RD$15,000 were excluded from the study.
The original sample comprised 1,200 individuals; however, 7 observations were discarded due to errors in the baseline
survey.10A third wave of 800 individuals across all three assignment categories was planned for late 2007, but was cancelled
due to the disruption caused by Hurricanes Dean and Noel and Tropical Storm Olga.11The original design was intended to test for selection effects. As noted in Karlan and Valdivia (2011), the emerging
approach to business development services calls for pricing training services at or above marginal costs. However, if those
entrepreneurs who would most benefit are uncertain of the program’s benefits or subject to tighter credit constraints, this
approach may induce adverse selection. Unfortunately, due to logistical issues associated with data gathering we are
unable to analyze the selection results along this dimension.
8
IV. Data and Empirical Strategy
We constructed the original sample frame based on administrative data collected by
ADOPEM in the ordinary course of operations. Beginning in November 2006, we con-
ducted a baseline survey of each study participant using a professional survey firm unaf-
filiated with ADOPEM. We collected information on household and business character-
istics, business practices and performance, business skills, training history, and interest
in future training. The endline survey was conducted during the summer of 2008, at least
12 months after training was completed. We augmented the surveys with administrative
data from ADOPEM.
A. Descriptive Statistics
Table 1 reports summary statistics for the full sample and each of the three assign-
ment groups from the baseline data. Given that the treatments were randomly assigned,
we expect individuals in the three assignment groups to be similar in the baseline. As
shown in the table, this expectation generally holds across our 18 baseline characteris-
tics; however, there are two marginally significant differences. Individuals assigned to
the standard accounting treatment are marginally less likely to report keeping accounting
records or separating their business and personal accounts in the baseline. Individuals in
the rule-of-thumb training also report lower revenues in both average and bad weeks, al-
though these differences fall below the 10%-significance level. Therefore, we control for
these characteristics in the regression analytics that follow. Based on our sample size of
approximately 400 individuals per assignment group, any small-sample bias introduced
by inclusion of these baseline characteristics as covariates is minimal.12
As shown in the table, the average person in our sample is 40 years old, has three
children and holds a loan size of RD$26,514, approximately US$750; the median was
RD$20,000. The median borrower in the sample reported revenues during an average
week of RD$3,000 (US$85). In addition, 90 percent of the sample is female, 35 percent
have more than a high school degree, and 66 percent have at least some savings. While
all participants had been chosen by ADOPEM as clients who potentially were interested
in financial training, only about 47 percent explicitly stated interest in training when
surveyed. Reported sales are RD$6,399 in an average week and RD$3,500 in a bad
week. Approximately half of the participants operate businesses engaged in retail sales
and trading. We also found (not reported in the table) that 60 percent of the businesses
are sole proprietorships with no employees in addition to the borrower. Of the rest, 80
12Appendix Table A2 demonstrates a clear pattern of selection into training and highlights the need for exogenous
variation in treatment assignment to assess the causal mechanisms though which training can affect outcomes. Condi-
tional on assignment to the treatment group, those who attend have more education. They are also more likely to have
expressed an interest in accounting training during the baseline survey; however, a prior interest in increasing savings
or improving cash management is not associated with increased attendance. They also tend to have lower revenues but
bigger plans, as measured by the share of the loan intended for fixed asset purchases. Attendance does not vary with
individuals’ business type. Interestingly, we see some evidence for the reverse of an “Ashenfelter dip”: individuals
reporting that their business had improved in the month preceding the baseline survey were 6.4 percentage points more
likely to attend the training.
9
percent have one or two employees in addition to the borrower and few have more than
five. Typical businesses include small retail shops, general stores (colmados), beauty
salons, and food service, serving geographically-clustered, local markets.
The final panel of Table 1 reports the business practices of the small business owners.
A majority of them report already implementing several financial management practices:
74 percent report that they are separating personal and business cash; 66 percent keep
accounting records; 53 percent have separate business and personal accounts and 80
percent say they calculate their revenues formally.
The endline survey was conducted in mid-2008, one year after the last wave of train-
ing was completed. Anecdotal evidence and discussions with ADOPEM suggest an un-
usually high level of program dropout, business closure, and out-migration from the Do-
minican Republic by the sample population in response to Hurricanes Dean and Noel and
Tropical Storm Olga, which flooded large parts of the country and caused catastrophic
damage. The survey team utilized various forms of contact information from baseline
and administrative data as well as credit officers in the field in its efforts to locate all
individuals in the study for the endline survey. Ultimately, we collected endline data for
87 percent of participants reporting in the baseline.13
B. Objective Reporting Measures
Self-reporting bias raises concerns about any measures of business management prac-
tices. Treated individuals may, for example, report maintaining separate business and
personal accounts because they were told this was important and not because they actu-
ally do so. To allay such concerns, we construct an objective index of financial reporting
errors. We classify as an error any report of (i) bad period sales greater than average or
good, (ii) average period sales better than good, or (iii) average period profits better than
good period sales for each of daily, weekly, and monthly reported outcomes. In the base-
line, 45 percent of subjects make at least one mistake and 11 percent make three or more.
Along the same lines, we compare self-reported profits to profits calculated from respon-
dents’ own revenue and expense detail. These differences are large; self-reported profits
are only 60 percent of those calculated from the disaggregated components. While these
differences could result from misreporting any of the components, we believe the most
plausible explanation is that respondents fail to remember and hence underreport their
various detailed business expenses. This poses challenges when interpreting the im-
pact of either treatment on profits. For example, training could increase actual profits
while improving recall of business expenses, leaving reported profits unchanged. For
this reason, we are cautious when interpreting any profit measure as a stand-alone out-
come. To account for this possibility, we estimate the effect of each treatment on the
raw and absolute difference between self-reported and calculated profits. Because we
do not have a measure of true profits, we cannot make statements about the accuracy of
these measures; however, we expect that if either treatment improves financial controls,
the difference between the two profit measures become smaller.
13Section V.D discusses attrition in more detail.
10
C. Empirical Strategy
Random assignment of the treatments allows us to obtain unbiased estimates of the
effect of being offered the training program by estimating the following equation:
(1) yEi = α + β1 Accti + β2 RoTi + γ X i + δyB
i + εi ,
where yEi is the endline value of the outcome variable of interest; Accti is an indicator
for being assigned to the accounting treatment; RoTi is an indicator for being assigned
to the rule-of-thumb treatment; X i is a matrix of baseline-measured covariates includ-
ing business types, loan size, and participation in an ADOPEM savings account. The
pre-treatment measure of the outcome variable, yBi , explains a substantial share of the
variance in outcomes across individuals and is included where available. The β parame-
ters are an estimate of each program’s average effect on outcome y. For binary outcome
variables, we estimate a linear probability model following the same specification in (1),
which allows interpretation of β as the difference in the mean level of an activity, e.g.,
keeping formal accounts, conditional on assignment to the particular treatment group.
We restrict the sample to only those individuals who report owning a business in the
endline, so answers to all business outcome and performance measures (e.g., weekly
revenues or keeping business and personal accounts separate) are well defined.14 Stan-
dard errors are clustered at the barrio level to account for community-level shocks to
business conditions. We also estimate the simple cell means regression,
(2) yEi = α + β1 Accti + β2 RoTi + δyB
i + εi ,
to verify that the choice of covariates is not affecting parameter estimates.
We test for heterogeneous treatment effects with respect to skill level, prior interest in
training, and baseline quartile of business financial practices by re-estimating equation
(1) while restricting the sample in turn to each of the partitioning subgroups.15
Next we look at the effect of the intensive follow-up visits. Because we randomly
assigned treated participants to these visits conditional on attending the first class, we es-
timate the effect of the follow-up with the following specification, restricting the sample
in turn to only those participants who attended the first class in either treatment group:
(3) yEi = α + βFollowi + γ X i + δyB
i + εi ,
where Followi is an indicator for assignment to receive the in-person follow-up.
We then estimate the effect of treatment on the treated with the equation,
(4) yEi = α + β1 Attend Accti + β2 Attend RoTi + γ X i + δyB
i + εi ,
14The rate of business ownership in the endline is 78.1% in the full sample and does not differ significantly across the
various treatment groups. See Section V.D for a discussion of attrition and potential differential non-reporting.15Each of these subgroups was specified in the analysis plan before the endline data was collected. We also considered
heterogeneity across industries and loan type (individual or group). The results, not reported, are available on request.
11

where Attend Accti and Attend RoTi are indicators for whether individual i attended
any accounting or rule-of-thumb training classes, respectively. Because attendance is
endogenous, we instrument for attendance in (4) with assignment to the treatments.
While we focus on a few key business practices and performance measures, we have
data on a range of distinct outcomes. Because testing multiple outcomes independently
increases the probability that we will reject the null of no effect for at least one outcome,
we follow Kling, Liebman and Katz (2007) and Karlan and Valdivia (2011) in construct-
ing index measures for three families of outcomes: business practices, personal financial
practices, and business revenues.16 Within each category, we rescale each outcome such
that larger values indicate better values for the individual or business and convert each
measure to a z-score such that zki = (yki − µk)/σ k , where µ and σ are the mean
and standard deviation of yk for the control group. Thus each component of the index
has mean 0 and standard deviation 1 for the control group. For each category, we then
construct a summary measure zi =∑
k zki/k. We then estimate:
(5) zEi = α + β1 Accti + β2 RoTi + γ X i + δz
Bi + εi ,
to test whether the training treatments affected the set of outcomes within the category.
Next, we turn to look for potential spatial externalities from the training. These
spillovers can take two forms. First, there may be positive knowledge spillovers. Trained
clients may actively pass on newly acquired knowledge to their peers or neighboring
businesses may observe and mimic improved management practices. Second, business
outcomes for the treated may improve either by expanding the overall market, “growing
the pie”, or by a reallocation of revenues from control firms to the treated, “business
stealing.” As described above, the businesses in this study tend to serve spatially local
markets, therefore we follow a strategy similar to Miguel and Kremer (2004) in testing
for these externalities. Using address information for each observation in the sample,
we construct a measure of the distance between every pair of businesses.17 We then
construct density measures for the total number of firms located within 0.5 kilometers of
business i , Ni , as well as the number of firms in the accounting (N Ai ) and rule-of-thumb
(N Ri ) treatments. We can further characterize these proximate firms by whether or not
they operate in the same basic industry as firm i (N ASi and N RS
i ) or a different industry
16Business practices includes indicators for keeping financial accounts, maintaining accounts separately for business
and home, keeping business and personal cash separate, maintaining a plan for business expenditures, setting aside cash
for business expenditures, paying a salary, taking business funds for personal use,∗ calculating revenues, calculating
profits, keeping records of revenues, keeping records of expenses, keeping records of accounts payable, keeping records
of accounts receivable, and keeping records of inventory. Personal financial practices comprise gambling,∗ buying goods
from door-to-door vendors that one would not otherwise buy,∗ buying goods that one regrets afterwards,∗ saving regularly,
the amount saved in the last month, and utilizing remittances for business purposes. The revenue index comprises
reported business revenues in good, average, bad, and the last period across three reporting periods: day, week, and
month. All reported revenue measures are winsorized at 1%. Items marked with an asterisk (∗) are rescaled such that
positive values indicate better outcomes.17Measurement error in the actual travel distance between firms and the effective catchment area for customers leads
to attenuation bias, making it more difficult to find treatment externalities.
12
(N ADi and N RD
i ). We then run the following regressions:
(6) yEi = α + β1 Ni + β2 N A
i + β3 N Ri + δyB
i + εi ,
and
(7) yEi = α +
∑I
{β I
1 N Ii + β
I2 N AI
i + βI3 N RI
i
}+ δyB
i + εi ,
where I ∈ {S, D}. We consider as outcome variables both revenues and business prac-
tices. Positive treatment externalities would generate β2, β3 > 0. Whereas if firms are
growing through “business stealing” we would expect β S2 , β
S3 < 0 when revenues are the
outcome.
V. Results
A. Business and Personal Financial Practices and Firm Performance
Table 2 presents the effect of each training program on our three main sets of outcomes:
business and financial practices, objective reporting quality and business performance.
All the regressions in this section follow the estimation strategy detailed in the prior
section. The first set of results reported in columns 2 and 3 shows that assignment to the
standard accounting training has a muted impact on business practices. The estimated
effect on the business practices index is 0.07, approximately 0.12 standard deviations,
but not statistically significant (p-value: 0.198). Among the component elements, only
the estimated effect on setting aside funds for business expenses is significant at the 10%-
level or better. Estimates for the other business practice outcomes, while all positive, are
not statistically significant and generally close to zero.
In contrast, the rule-of-thumb training, reported in columns 5 and 6, substantially in-
creases the likelihood that individuals adopt better financial practices. Clients in that
treatment group report a higher likelihood of separating business and personal cash,
keeping accounting records, separating business and personal accounts, setting aside
cash for business, and calculating revenues formally. Each of these measures increases
by 6 to 12 percentage points relative to the control group, which did not receive train-
ing, and all are significant at the 5%-level or better. The rule-of-thumb treatment also
produces a significant 0.14 increase in the business practices index, approximately 0.25
standard deviations. When looking at savings behavior, we find a marginally signifi-
cant impact of the rule-of-thumb training on the likelihood of having any savings. The
increase in total reported savings, while large, is not significant. Columns 7 and 8 re-
port the p-values for tests of the equality of the standard accounting and rule-of-thumb
treatment effects. When considering the full sample, the rule-of-thumb training has a
consistently more positive effect. The differential impact on both separating business
and personal cash and keeping accounting records are significant at the 10%-level or bet-
ter, but despite the rather large difference we cannot reject equality for the impact on the
index of business practices.
13
The second set of results shows the impact of training on measures of objective report-
ing quality. Fifty percent of the control group made at least one objective reporting error
in their responses to survey questions regarding financial outcomes (see Section IV.B for
a detailed description). Individuals in both treatment groups are less likely to make any
such mistakes errors. However, only for the rule-of-thumb training is the improvement
significant, with treated individuals 8 percentage points less likely to make any errors.
Similarly, both treatments appear to reduce differences between directly reported profits
and profits calculated from respondents’ reported revenues and expenses. The rule-of-
thumb training reduces the mean difference between these measures by nearly 50 percent
(p-value: 0.56), and the non-parametric Wilcoxon rank-sum test rejects equivalence in
the distribution of reporting errors (p-value: 0.077).
Finally, when looking at business performance outcomes, we find an increase of 0.09
(0.11 standard deviations) in the revenue index18 for individuals assigned to the rule-
of-thumb treatment (p-value: 0.054). No significant change is observed in the standard
accounting treatment, and, as reported in columns 7 and 8, this difference between the
treatments is significant at the 5%-level. While there are differences throughout the rev-
enue measures, the most significant difference is observed in sales during bad weeks,
where the rule-of-thumb treatment generates a substantial increase. This increase of
RD$967 to RD$979 is economically large—25 percent of mean endline reports and
nearly 60 percent of the median—and significant at the 10%-level. Those assigned to
the rule-of-thumb training also reported higher sales in average weeks, but the effect is
not statistically significant.
These results should be interpreted with some caution. As noted, individuals assigned
to the rule-of-thumb training reported lower sales in these periods than those assigned to
the control group. These differences in baseline revenues are not significant at conven-
tional levels; however, the treatment effect is insignificant when the controls for baseline
sales are dropped. With this caveat in mind, these results parallel those of Karlan and
Valdivia (2011) and Berge, Bjorvatn and Tungodden (2010), both of which find revenue
improvements in bad periods as a result of training. The findings remain consistent with
the possibility that effective training may operate by helping individuals to better man-
age negative shocks or by alerting them to such shocks such that they can counteract the
effect of slow weeks. In contrast, the standard accounting program has no discernible
effects on revenues in the broad sample.
Table 3 describes the effects of training on institutional outcomes. The accounting
treatment had no appreciable effects on loan size, loan type, savings, or dropout. Those
assigned to the rule-of-thumb treatment are approximately 8 percentage points more
likely to save, with the result marginally significant. Point estimates for the effect of
training on savings in the month immediately prior to the endline survey are large—an
increase of RD$443 or nearly 25 percent of the endline mean—but not statistically sig-
nificant. There is no evidence that the rule-of-thumb training causes any other changes
in institutional outcomes.
18See Section IV.C for details on index construction.
14
B. Heterogeneous Treatment Effects
The efficacy of different training programs is likely to vary through the population. Ta-
bles 4 and 5 report whether the rule-of-thumb and standard accounting trainings, respec-
tively, have heterogeneous treatment effects for different subgroups. We focus on three
dimensions along which we expected training may have differential effects. First, we
classify an individual as high-skilled if she has completed high school or received previ-
ous formal financial training and low-skilled otherwise. Differences in treatment effects
along this dimension allow us to test whether the effectiveness of training depends on
initial levels of human capital. Second, we classify an individual as interested in training
if she indicated in the baseline survey a desire to receive training in business accounting
or financial management and not otherwise. Differences along this dimension allow us
to test whether the effectiveness of training depends on a participant’s motivation. Third,
we compare individuals across the quartiles of baseline business management practices.
Table 4 reports the impact of the rule-of-thumb training for these different subgroups.
Columns 2 and 3 compare the impact of the training across different levels of initial
human capital. The first set of results focuses on whether the clients adopted better
business practices. The rule-of-thumb treatment has a consistently positive effect on
both subgroups across most of the outcome variables. There is a slightly larger effect
on more skilled clients when looking at the likelihood to separate business and personal
cash and likelihood to save, but the aggregate measure of business practices is higher for
the less skilled clients. On balance, the rule-of-thumb treatment’s impacts on business
practices appear independent of skill level.
We then look at our different measures of objective reporting quality. Across both skill
levels, we find that the rule-of-thumb treatment on average reduced the likelihood that
individuals made reporting errors. Treated individuals also have more consistent profit
measures. The improvements are more pronounced for the low-skilled individuals, but
the differences are not significant at traditional levels.
Finally, we also test whether there is a differential impact on business outcomes. The
coefficients for the impact on the revenue measures are positive for both groups, but none
of the effects is significant when splitting the sample by skill level. The pattern for the
number of employees is interesting. The rule-of-thumb treatment reduces the number
of employees for the low-skill group but increases employment in the businesses of the
high-skilled. Both impacts are significant and significantly different from one another.
We lack additional information with which to explore the precise mechanism at work
here and therefore do not want to push the interpretation. However, in light of Karlan
and Zinman’s (2011) finding that small business owners in the Philippines shed paid
employees after receiving a microcredit loan, the results suggest it would be valuable to
further study the determinants of labor demand by small businesses.
We now repeat the heterogeneous treatment analysis along the dimensions of interest
in training (columns 4 and 5). As before, we first look across various financial practice
measures and outcomes measures. Again, we find that on average there is a positive
effect on both groups. There is quite a lot of variation in particular outcomes, e.g., those
who reported limited interest in training show a larger response on separating accounts
15

and keeping accounting records, while those with greater interest have a larger response
for setting aside funds for business expenses. The effect on the business practices index
is nearly identical across groups. Objective reporting quality improves for both groups,
with a larger effect for those expressing greater interest in training. There are no signifi-
cant differences in the business performance measures across the groups.
This stands in contrast to the results of Karlan and Valdivia (2011), which finds that
less interested clients benefitted more from the training. We hypothesize that this differ-
ence stems from the voluntary nature of ADOPEM’s training program—individuals who
were not sufficiently interested in training could opt out at any time—versus the manda-
tory program studied by Karlan and Valdivia. It suggests that in certain circumstances
the price mechanism may effectively allocate training programs.
The last four columns of Table 4 show that the rule-of-thumb training had a larger im-
pact on businesses with poorer management practices in the baseline. On all dimensions
of business practices, the first quartile exhibits the largest improvement in response to the
training. The effects on objective reporting quality and business performance are insuf-
ficiently precise to draw further conclusions. This might suggest that the rule-of-thumb
training allows the people with poor practices ex ante to catch up with the others. The
ability of the rule-of-thumb training to benefit even the most poorly managed businesses
is primarily responsible for its larger average treatment effect and supports the hypothe-
sis that there may be advantages to reducing the complexity of training programs when
targeting micro-entrepreneurs.
In Table 5 we repeat the exact same set of regressions for the different subsamples as
in Table 4 but now focusing on the standard accounting treatment group. There are sev-
eral points of note. First, the standard accounting treatment improves objective reporting
quality, but only for high-skilled individuals. The accounting training actually increases
reporting errors for businesses in the lowest quartile of baseline business practices. Sec-
ond, those who expressed greater interest in the training ex ante appear to change their
business practices in response to the accounting training, while those with less interest are
unaffected. This stands in contrast to the pattern of heterogeneity for the rule-of-thumb
training, which produced comparable and in some cases larger improvements for those
who expressed less interest in training. Finally, lower-skilled clients in the accounting
training report meaningful drops in their revenues. These effects are substantial, approx-
imately 0.2 standard deviations from the baseline reported values. Similarly, we find a
significant reduction in sales for the quartile of clients with the worst business practices
in the baseline.
This result is quite surprising and could be driven by several different channels. On the
one hand, there could be a negative causal effect of accounting training on less educated
clients if they spend a lot of time trying to implement standard accounting techniques
without much success. Alternatively one could conjecture that trained clients are more
realistic about their actual revenues while prior to the training they might have been
overly optimistic. The relatively large effect on the raw difference in reported profits for
this subgroup is consistent with the hypothesis that treated clients may be more aware
of their true revenues but the observed increase in reporting errors points in the other
16
direction. Ultimately, we cannot rule out either channel.
C. Differences between Rule-of-Thumb and Standard Accounting Training
We now test whether there is a differential impact of the two types of trainings. We
have shown above that the rule-of-thumb training has a stronger positive impact across
several dimensions than the accounting training, especially on clients with low educa-
tion and worse business practices relative to the control group. We now compare these
two trainings directly to each other. Table 6 reports the difference in the treatment ef-
fect between the rule-of-thumb and accounting trainings, and the p-values for testing
the equality of treatment effects for all subgroups. Looking across the subgroups we
find a very strong and consistent pattern according to individuals’ interest in training
(columns 4 and 5). The rule-of-thumb training had a substantially more positive impact
than the accounting training for clients that reported limited interest in training ex ante.
There is a significantly larger effect across almost all business and financial practices,
e.g., separating personal and business cash and accounts, and keeping formal records.
This culminates in a 0.12 difference in the index of business practices, 0.21 standard
deviations (p-value: 0.052), and a 0.17 difference in the revenue index, 0.20 standard
deviations (p-value: 0.055). A similar pattern is observed in average and bad week sales,
with results significant at approximately the 5%-level. For those with a strong prior in-
terest in training, the differences between the two trainings are not significant. On the
whole, the rule-of-thumb training generates substantially better outcomes for those with
a lower interest in training.
While not evident in the measures of business practices, we find similar outcomes
along the skill dimension in terms of objective reporting quality and business perfor-
mance. Low-skilled individuals in the rule-of-thumb treatment were 12 percentage points
less likely to commit any reporting errors than those in the standard accounting training
(p-value: 0.016). This translates into differences in reported revenues, with a difference
of 0.17 in the revenue index, 0.20 standard deviations (p-value: 0.044).
Finally, we look across quartiles of baseline business practices. In line with the find-
ings above, we see that the clients in the lowest quartile receiving the rule-of-thumb
training see substantially larger and significant improvements in business and financial
practices relative to those in the accounting training. There are even significant positive
relative effects in savings behavior. Again, these results translate into substantially better
sales outcomes. Within the middle quartiles there are no significant differences between
the two trainings. Surprisingly, the difference in business practices reemerges in the top
quartile, but these differences are not observed in objective reporting quality or revenues.
Taken together the findings suggest that the rule-of-thumb training has a significant
and positive effect relative to the accounting training on clients that start from lower
levels of skill, business practices, and interest in training. The same does not hold for
higher skilled, better managed or more interested businesses, where the impact of both
trainings is similar. Not only is the rule-of-thumb training more likely to improve busi-
ness practices for clients at the lower end of the spectrum, it has real effects on outcomes.
This suggests that it is important to correctly match the characteristics of the clients with
17
the type of training that will be useful for them. Giving an unsophisticated client stan-
dard accounting training can actually reduce their performance, while the rule-of-thumb
training substantially improves their outcomes.
D. Robustness Checks
Table 7 reports the effects of the treatment on the treated for both the accounting and
rule-of-thumb training according to equation (4). These estimates represent the Wald Es-
timator for the treatment effect, effectively rescaling the intention-to-treat effect by the
probability of attending the course conditional on assignment to the treatment. Consis-
tent with the results reported in Table 3, we see large and statistically significant effects
from the rule-of-thumb treatment on business practices and an economically and sta-
tistically significant increase in reported sales in bad weeks. While the effects of the
accounting training lack statistical significance, there is a consistent pattern of negative
reported effects on measures of sales performance.
Table 8 reports the results of estimating equation (3), with the aim of understanding the
role of follow-up training and the mechanisms though which training improves or fails
to improve outcomes. The results are puzzling. For both the standard accounting and
rule-of-thumb trainings, assignment to the intensive follow-up trainings appears to re-
duce the quality of reported business practices. Yet for the standard-accounting training,
follow-up visits also cause a substantial and statistically significant reduction in objective
reporting errors. Further, the point estimates for the effect of the follow-up on revenues
are positive. This effect is statistically significant in the full sample, column 3, but not
when restricting attention to a single treatment type. We do not have sufficient sample
size to evaluate the effect of the follow-up visits on further subgroups. It would, for
example, be useful to look for differential effects along the dimensions of heterogeneity
discussed above. Taken as a whole, we consider this weak suggestive evidence that the
impact of the standard accounting training may have been limited by either the length or
the intensity of instruction.
Finally, we discuss attrition. Our response rate was relatively high—87 percent of par-
ticipants were reached for the endline—but we find some evidence for selective attrition.
Treatment group individuals who were not reached for the endline survey have generally
higher baseline revenues (revenue index 0.05) than those who dropped from the control
group (revenue index -0.09). Given the relatively low level of attrition, this difference of
0.18 standard deviations is not statistically significant. Nonetheless, it suggests that the
reported results for business outcomes may understate the program’s true effect. There
are no differences across the two treatment groups.
In addition to survey non-response, there is a relatively high incidence of business
exit: 78 percent of individuals reached in the endline report operating their own busi-
ness relative to 97 percent in the baseline. As discussed above, qualitative evidence and
discussions with ADOPEM suggest that a string of natural disasters led to an unusually
high rate of out-migration from the Dominican Republic and business exit by the sam-
ple population. To test for differential attrition, we estimate a linear probability model
of business ownership in the endline on indicators for treatment status. Coefficients for
18
assignment to the standard accounting and rule-of-thumb trainings are -0.037 (p-value:
0.235) and 0.001 (p-value: 0.977).
We analyze the implications for our estimated treatment effects of different plausible
assumptions for the potential outcomes of individuals who are not reached in the endline
or who report not having a business. We construct bounds on the treatment effects for the
rule-of-thumb training on the business practices index, revenue index and any reporting
errors indicator using a range of assumptions for the pattern of attrition following an
approach based on Horowitz and Manski (2000), Lee (2002) and Kling and Liebman
(2004).
Table 9 reports these results. Column 5 reproduces the unadjusted results from Table
2. Columns 1 and 9 report lower and upper bounds under the worst-case scenario. We
compute worst case lower bounds by imputing missing values for each observation in the
treatment group as the minimum value observed in that group. For missing observations
in the control group, we use the maximum value observed in the control group. In prac-
tice, because many of the outcomes are binary, this equates to assuming that all missing
data for the treatment groups is zero and all missing data for the control is one. Worst
case upper bounds are computed analogously.
We also consider alternative scenarios for missing observations. Column 2 constructs
a lower bound by imputing missing values for the treatment group as the mean for treat-
ment group minus 0.25 standard deviations of the observed distribution for the group.
Missing values for the control group are imputed as the control group mean plus 0.25
standard deviations. Columns 3 and 4 repeat this calculation for 0.10 standard deviations
and 0.05 standard deviations, respectively. Upper bounds calculated using the same sce-
narios are reported in columns 6 through 8. Given the combined magnitude of attrition
and business closure, the worst case bounds are large and uninformative. The range
tightens considerably when we employ plausible assumptions for the missing data. The
results for business practices are the most robust, maintaining significance at the 10%-
level up to nearly a 0.50 standard deviation difference between the imputed values for
missing treatment and control observations. The effect on reporting errors also maintains
statistical significance for a relatively large band of assumptions regarding missing data.
Results for the revenue index, which were only marginally significant in the unadjusted
results, are the most sensitive to assumptions regarding missing observations.
E. Spillover Effects
Table 10 provides suggestive evidence that some of the improvement in revenues gen-
erated by the treatments is due in part to crowding out competing businesses. It reports
the results from estimating equations (6) and (7). As shown in columns 1 and 2, there
is no evidence of learning spillovers from the training. Conditional on the density of
businesses in one’s neighborhood, the proximity of additional firms that were randomly
assigned to either training program does not have a demonstrable affect on the index of
own business practices. The results for the index of revenues, average week revenues
and bad week revenues suggest the possibility of negative revenue spillovers. The co-
efficients on the number of treated firms within 0.5 kilometers are generally negative in
19
columns 3, 5 and 7. This is what we would expect if there were crowd-out, but the
magnitudes are all close to zero and none are statistically significant. However, when
we distinguish those neighboring businesses according to their industry, a clearer pattern
emerges. Treatment of additional nearby businesses in different industries is no longer
associated with a drop in own revenues. However, treating neighboring businesses in the
same industry reduces own revenues. As reported in column 4, one additional treated
business within 0.5 kilometers causes a firm’s revenue index to fall by approximately
0.03 standard deviations for both the accounting and rule-of-thumb treatments with p-
values of 0.077 and 0.023, respectively. The results for sales in average and bad weeks,
reported in columns 6 and 8, follow the same pattern, but none of the differences are
significant. Overall these results provide suggestive evidence that at least some of the
improved sales due to financial literacy training in this setting are due to crowd-out of
other businesses.
VI. Conclusion
The results from this study suggest that training to improve knowledge of finance and
financial accounting indeed can have a positive effect on the management practices of
small businesses in an emerging market such as the Dominican Republic. However, we
show that the impact of such training crucially depends on the form in which financial
literacy training is provided. In this setting, a program that relies on the standard ap-
proach to small business training, teaching the fundamentals of financial accounting, had
no measurable effect. But a training program based on simple rules of thumb led to sig-
nificant improvements in the way businesses managed their finances. Businesses in the
rule-of-thumb training were more likely to implement the material that was taught, keep
accounting records, calculate monthly revenues, and separate their business and personal
financial records. Moreover, these results translated into improvements in objective re-
porting quality and revenues.
Beneath these average results, there is a clear pattern of heterogeneity. The relative
gains from the rule-of-thumb training were particularly large for firms starting at the
lower ends of the performance, ability or interest spectrums. This highlights the impor-
tance of precisely evaluating the mechanisms through which training works or does not
work. We do not suggest that the value of simplification is generic. Rather, we show that
one size does not fit all when it comes to training programs. It is important to match the
training to the targeted client base.
More research is needed to investigate how rules of thumb can be applied effectively.
We believe that going forward it will be important to understand in more detail the po-
tential costs and benefits of rule-of-thumb-based learning. For example, would more
advanced clients do better with more sophisticated training material? Are there situa-
tions where rule-of-thumb-based training could make it more difficult for businesses to
adjust to new circumstances or make sense of unforeseen developments?
These results come with two caveats. First, business performance is ultimately mea-
sured by profits not revenue. Not only are small business profits difficult to measure, but
as we demonstrate, training can affect reporting quality as well as actual profits. Sig-
20

nificant methodological improvements are necessary to generate reliable measures for
this important outcome. Second, we find suggestive evidence that at least some of the
observed revenue increases come from crowding out sales by other firms in the vicinity.
More research is required before we can make conclusive statements about the welfare
effects of business training programs. Nevertheless, based on these findings, it appears
that in at least some contexts significant gains could be made from simplifying training
programs and relying more on easy-to-implement, practical rules of thumb.
21
REFERENCES
Berge, Lars Ivar Oppedal, Kjetil Bjorvatn, and Bertil Tungodden. 2010. “On The
Role of Human and Financial Capital for Microenterprise Development: Evidence
from a Field Experiment in Tanzania.” Unpublished NEUDC conference paper.
Bernheim, B. Douglas, and Daniel M. Garrett. 2003. “The Effects of Financial Edu-
cation in the Workplace: Evidence from a Survey of Households.” Journal of Public
Economics, 87(7-8): 1487–1519.
Bernheim, B. Douglas, Daniel M. Garrett, and Dean M. Maki. 2001. “Education
and Saving: The Long-Term Effects of High School Financial Curriculum Mandates.”
Journal of Public Economics, 80(3): 435–465.
Beshears, John, James Choi, David Laibson, and Brigitte C. Madrian. 2010. “Sim-
plification and Saving.” mimeo.
Bettinger, Eric P., Bridget Terry Long, Philip Oreopoulos, and Lisa Sanbonmatsu.
2009. “The Role of Simplification and Information in College Decisions: Results from
the H&R Block FAFSA Experiment.” NBER Working Paper No. 15361.
Bloom, Nick, Benn Eifert, Aprajit Mahajan, David McKenzie, and John Roberts.
2013. “Does Management Matter? Evidence from India.” Quarterly Journal of Eco-
nomics, 128: 1–15.
Braunstein, Sandra, and Carolyn Welch. 2002. “Financial Literacy: An Overview of
Practice, Research, and Policy.” Federal Reserve Bulletin, 88(11): 445–457.
Bruhn, Miriam, and Bilal Zia. 2011. “Stimulating Managerial Capital in Emerging
Markets : the impact of business and financial literacy for young entrepreneurs.” World
Bank. WPS 5642.
Bruhn, Miriam, Dean Karlan, and Antoinette Schoar. 2010. “What Capital Is Missing
in Developing Countries?” American Economic Review, 100(2): 629–633.
Choi, James, David Laibson, and Brigitte Madrian. 2009. “Reducing the Complexity
Costs of 401 (k) Participation through Quick Enrollment.” NBER Working Paper No.
11979.
Cole, Shawn, and Gauri Kartini Shastry. 2009. “Smart Money: The Effect of Edu-
cation, Cognitive Ability, and Financial Literacy on Financial Market Participation.”
Harvard Business School Working Paper 09-171.
Cole, Shawn, Thomas Sampson, and Bilal Zia. 2009. “Financial Literacy, Financial
Decisions, and the Demand for Financial Services: Evidence from India and Indone-
sia.” Harvard Business School Working Paper 09-117.
22
De Mel, Suresh, David McKenzie, and Christopher Woodruff. 2009. “Measuring
Microenterprise Profits: Must We Ask How the Sausage Is Made?” Journal of Devel-
opment Economics, 88(1): 19–31.
Duflo, Esther, and Emmanuel Saez. 2003. “The Role of Information and Social In-
teractions in Retirement Plan Decisions: Evidence from a Randomized Experiment.”
Quarterly Journal of Economics, 118(3): 815–842.
Feldman, Jacob. 2003. “The Simplicity Principle in Human Concept Learning.” Current
Directions in Psychological Science, 12(6): 227–232.
Field, Erica, Seema Jayachandran, and Rohini Pande. 2010. “Do Traditional Institu-
tions Constrain Female Entrepreneurship? A Field Experiment on Business Training
in India.” American Economic Review Papers and Preceedings, 100(2): 125–129.
Horowitz, Joel L., and Charles F. Manski. 2000. “Nonparametric Analysis of Random-
ized Experiments with Missing Covariate and Outcome Data.” Journal of the Ameri-
can Statistical Association, 95(449): 77–84.
Karlan, Dean, and Jonathan Zinman. 2011. “Microcredit in Theory and Practice: Us-
ing Randomized Credit Scoring for Impact Evaluation.” Science, 332(6035): 1278–
1284.
Karlan, Dean, and Martin Valdivia. 2011. “Teaching Entrepreneurship: Impact of
Business Training on Microfinance Clients and Institutions.” Review of Economics
and Statistics, 93(2): 510–527.
Kling, Jeffrey, and Jeffrey Liebman. 2004. “Experimental Analysis of Neighborhood
Effects on Youth.” Princeton IRS Working Paper 483, March.
Kling, Jeffrey R., Jeffrey B. Liebman, and Lawrence F. Katz. 2007. “Experimental
Analysis of Neighborhood Effects.” Econometrica, 75(1): 83–119.
Lee, David S. 2002. “Trimming for Bounds on Treatment Effects with Missing Out-
comes.” NBER Technical Working Paper 277.
Lusardi, Annamaria. 2005. “Saving and the Effectiveness of Financial Education.”
Pension Design and Structure: New Lessons from Behavioral Finance, , ed. Olivia
Mitchell and Stephen Utkus, Chapter 9. Oxford University Press.
Lusardi, Annamaria. 2008. “Household Saving Behavior: The Role of Financial Liter-
acy, Information, and Financial Education Programs.” NBER Working Paper 13824.
Lusardi, Annamaria, and Olivia S. Mitchell. 2007a. “Baby Boomer Retirement Se-
curity: The Roles of Planning, Financial Literacy, and Housing Wealth.” Journal of
Monetary Economics, 54(1): 205–224.
Lusardi, Annamaria, and Olivia S. Mitchell. 2007b. “Financial Literacy and Retire-
ment Preparedness: Evidence and Implications for Financial Education.” Business
Economics, 42(1): 35–44.
23

Lusardi, Annamaria, and Peter Tufano. 2009. “Debt Literacy, Financial Experiences,
and Overindebtedness.” Dartmouth Working Paper.
Maddox, W.Todd, Bradley C. Love, Brian D. Glass, and J. Vincent Filoteo. 2008.
“When More is Less: Feedback Effects in Perceptual Category Learning.” Cognition,
108(2): 578–589.
Maes, Roald, and Paul Eling. 2007. “Discrimination Learning in Humans: Role of
Number and Complexity of Rules.” Learning & Behavior, 35(4): 225–232.
Mata, Jutta, Peter M. Todd, and Sonia Lippke. 2010. “When Weight Management
Lasts. Lower Perceived Rule Complexity Increases Adherence.” Appetite, 54(1): 37–
43.
McKenzie, David, and Christopher Woodruff. 2012. “What Are We Learning from
Business Training and Entrepreneurship Evaluations around the Developing World?”
World Bank Policy Research Working Paper 6202.
Meier, Stephan, and Charles Sprenger. 2008. “Discounting Financial Literacy: Time
Preferences and Participation in Financial Education Programs.” Federal Reserve
Bank of Boston Public Policy Discussion Papers No. 07-5, IZA.
Miguel, Edward, and Michael Kremer. 2004. “Worms: Identifying Impacts on
Education and Health in the Presence of Treatment Externalities.” Econometrica,
72(1): 159–218.
Mullainathan, Sendhil, and Eldar Shafir. 2009. “Savings Policy and Decision-Making
in Low-Income Households.” Insufficient Funds: Savings, Assets, Credit and Banking
Among Low-Income Households, , ed. Michael Barr and Rebecca Blank, Chapter 5,
121–145. Russell Sage Foundation Press.
Stango, Victor, and Jonathan Zinman. 2009. “Exponential Growth Bias and House-
hold Finance.” The Journal of Finance, 64(6): 2807–2849.
van Rooij, Maarten, Annamaria Lusardi, and R.J.M. (Rob) Alessie. 2007. “Finan-
cial Literacy and Stock Market Participation.” MRRC Working Paper No. 2007-162,
SSRN.
24
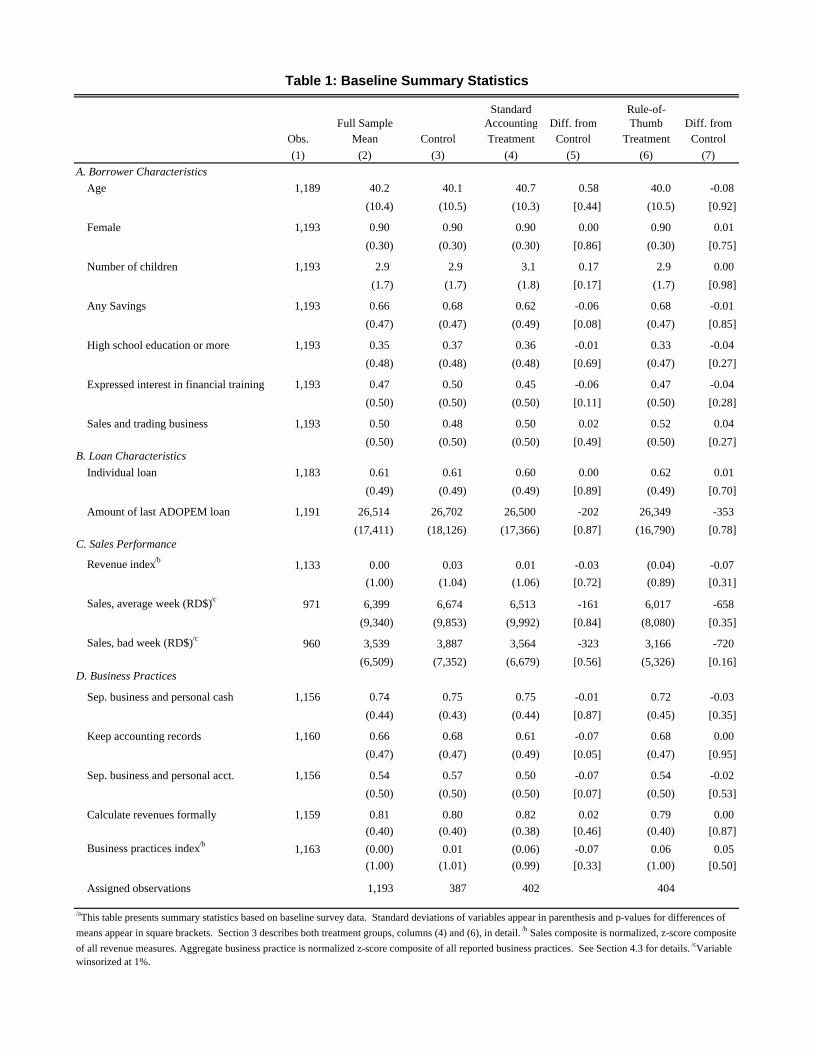
Standard Rule-of-Full Sample Accounting Diff. from Thumb Diff. from
Obs. Mean Control Treatment Control Treatment Control
(1) (2) (3) (4) (5) (6) (7)
A. Borrower Characteristics
Age 1,189 40.2 40.1 40.7 0.58 40.0 -0.08
(10.4) (10.5) (10.3) [0.44] (10.5) [0.92]
Female 1,193 0.90 0.90 0.90 0.00 0.90 0.01
(0.30) (0.30) (0.30) [0.86] (0.30) [0.75]
Number of children 1,193 2.9 2.9 3.1 0.17 2.9 0.00
(1.7) (1.7) (1.8) [0.17] (1.7) [0.98]
Any Savings 1,193 0.66 0.68 0.62 -0.06 0.68 -0.01
(0.47) (0.47) (0.49) [0.08] (0.47) [0.85]
High school education or more 1,193 0.35 0.37 0.36 -0.01 0.33 -0.04
(0.48) (0.48) (0.48) [0.69] (0.47) [0.27]
Expressed interest in financial training 1,193 0.47 0.50 0.45 -0.06 0.47 -0.04
(0.50) (0.50) (0.50) [0.11] (0.50) [0.28]
Sales and trading business 1,193 0.50 0.48 0.50 0.02 0.52 0.04
(0.50) (0.50) (0.50) [0.49] (0.50) [0.27]B. Loan Characteristics
Individual loan 1,183 0.61 0.61 0.60 0.00 0.62 0.01
(0.49) (0.49) (0.49) [0.89] (0.49) [0.70]
Amount of last ADOPEM loan 1,191 26,514 26,702 26,500 -202 26,349 -353
(17,411) (18,126) (17,366) [0.87] (16,790) [0.78]C. Sales Performance
Revenue index/b1,133 0.00 0.03 0.01 -0.03 (0.04) -0.07
(1.00) (1.04) (1.06) [0.72] (0.89) [0.31]
Sales, average week (RD$)/c 971 6,399 6,674 6,513 -161 6,017 -658
(9,340) (9,853) (9,992) [0.84] (8,080) [0.35]
Sales, bad week (RD$)/c960 3,539 3,887 3,564 -323 3,166 -720
(6,509) (7,352) (6,679) [0.56] (5,326) [0.16]D. Business Practices
Sep. business and personal cash 1,156 0.74 0.75 0.75 -0.01 0.72 -0.03
(0.44) (0.43) (0.44) [0.87] (0.45) [0.35]
Keep accounting records 1,160 0.66 0.68 0.61 -0.07 0.68 0.00
(0.47) (0.47) (0.49) [0.05] (0.47) [0.95]
Sep. business and personal acct. 1,156 0.54 0.57 0.50 -0.07 0.54 -0.02
(0.50) (0.50) (0.50) [0.07] (0.50) [0.53]
Calculate revenues formally 1,159 0.81 0.80 0.82 0.02 0.79 0.00
(0.40) (0.40) (0.38) [0.46] (0.40) [0.87]
Business practices index/b1,163 (0.00) 0.01 (0.06) -0.07 0.06 0.05
(1.00) (1.01) (0.99) [0.33] (1.00) [0.50]
Assigned observations 1,193 387 402 404
Table 1: Baseline Summary Statistics
/aThis table presents summary statistics based on baseline survey data. Standard deviations of variables appear in parenthesis and p-values for differences of
means appear in square brackets. Section 3 describes both treatment groups, columns (4) and (6), in detail. /b Sales composite is normalized, z-score composite
of all revenue measures. Aggregate business practice is normalized z-score composite of all reported business practices. See Section 4.3 for details. /cVariable winsorized at 1%.

Control Treatment Incl. Treatment Incl. Treatment Incl. Treatment Incl.
Obs. Mean Only Covariates/b Only Covariates/b Only Covariates/b Only Covariates/b
(1) (2) (3) (4) (5) (6) (7) (8) (9) (10)
Business and Personal Financial Practices
Sep. business and personal cash 793 0.71 0.00 0.00 0.08*** 0.08*** 0.010 0.014 0.04 0.04
(0.46) (0.03) (0.03) (0.03) (0.03) (0.03) (0.03)
Keep accounting records 794 0.58 0.04 0.04 0.11*** 0.11*** 0.127 0.095 0.08** 0.08**
(0.49) (0.05) (0.05) (0.03) (0.03) (0.04) (0.04)
Sep. business and personal acct. 791 0.50 0.04 0.03 0.11*** 0.12*** 0.139 0.103 0.08** 0.08**
(0.50) (0.05) (0.05) (0.03) (0.03) (0.03) (0.03)
Set aside cash for business exp. 793 0.48 0.07** 0.07** 0.12*** 0.12*** 0.179 0.188 0.10*** 0.09***
(0.50) (0.03) (0.03) (0.04) (0.04) (0.03) (0.03)
Calculate revenues formally 794 0.72 0.02 0.02 0.06** 0.06** 0.219 0.242 0.04 0.04
(0.45) (0.04) (0.04) (0.03) (0.03) (0.03) (0.03)
Business practices index/d795 0.00 0.08 0.07 0.14*** 0.14*** 0.225 0.195 0.11*** 0.11***
(0.59) (0.06) (0.06) (0.04) (0.04) (0.04) (0.04)
Any savings 804 0.53 0.02 0.02 0.08* 0.08* 0.215 0.177 0.05 0.05
(0.50) (0.05) (0.05) (0.04) (0.04) (0.04) (0.04)
Savings amount, $RD/e /h661 15,033 -2,646 -2,952 985 1,187 0.158 0.107 -806 -855
(34,722) (2,846) (2,909) (2,336) (2,383) (2,261) (2,327)
Objective Reporting QualityAny Reporting Errors/f
757 0.50 -0.04 -0.04 -0.08** -0.09*** 0.175 0.161 -0.06* -0.06*
(0.50) (0.04) (0.04) (0.03) (0.03) (0.03) (0.03)
Raw profit calc. diff. (RD$), weekly/g427 -2,154 761 905 1,060* 1,058* 0.660 0.831 918* 987*
(5,307) (711) (741) (579) (556) (548) (540)
Abs. value profit calc. diff. (RD$), weekly/g427 3,844 -173 -333 -668 -660 0.362 0.565 -434 -509
(4,238) (602) (642) (518) (480) (494) (487)
Business PerformanceTotal number of employees 794 0.81 0.07 0.07 -0.05 -0.03 0.337 0.399 0.01 0.02
(1.26) (0.09) (0.09) (0.09) (0.09) (0.06) (0.07)
Revenue index/c774 0.00 -0.02 -0.02 0.09* 0.09* 0.031 0.031 0.04 0.04
(0.82) (0.04) (0.05) (0.05) (0.05) (0.04) (0.04)
Sales, Average Week/h570 8,711 -582 -682 547 424 0.273 0.290 10 -105
(11,710) (794) (809) (888) (867) (669) (657)
Sales, Bad Week (RD$)/h551 5,232 -669 -660 967* 979* 0.003 0.002 176 190
(7,880) (507) (514) (523) (524) (438) (451)
Table 2: Impact of Training on Business Practices and Performance/a
Any TreatmentRule-of-ThumbStandard Accounting
/a Each coefficient reported in the table is from a regression for each outcome variable of the form described in equation (1) for columns (4) and (6) and equation (2) for columns (3) and (5). Standard errors, clustered at the
barrio-level, in parentheses. Regression includes only those individuals with own business. * Denotes significance at the 10%-level, ** at the 5%-level, and *** at the 1%-level. /b Covariates include variables used for
stratification: business types, loan size, and participation in an ADOPEM savings account. /c p-value for F-test of equality of accounting and rule-of-thumb treatment effect coefficients. /d Indices are unweighted mean of z-
scores of all component elements, scaled by control group mean and standard deviation, as detailed in Section 4.3. /e Results reflect OLS regression of savings amount on treatment indicator, unconditional on any savings.
Results of CLAD and Tobit regressions are available on request and not significant at the 10%-level. /f Error defined as reporting bad period revenues better than average or good period; average period revenues better than
good; or average profits greater than good period revenues. /g Raw difference equals self-reported profits for period minus profits calculated for period using reported revenues minus expenses. Absolute value of raw
difference described above. Tobit and CLAD regressions for absolute value generate similar estimates. Results available on request. /h Variable winsorized at 1%.
p-value for equality/c
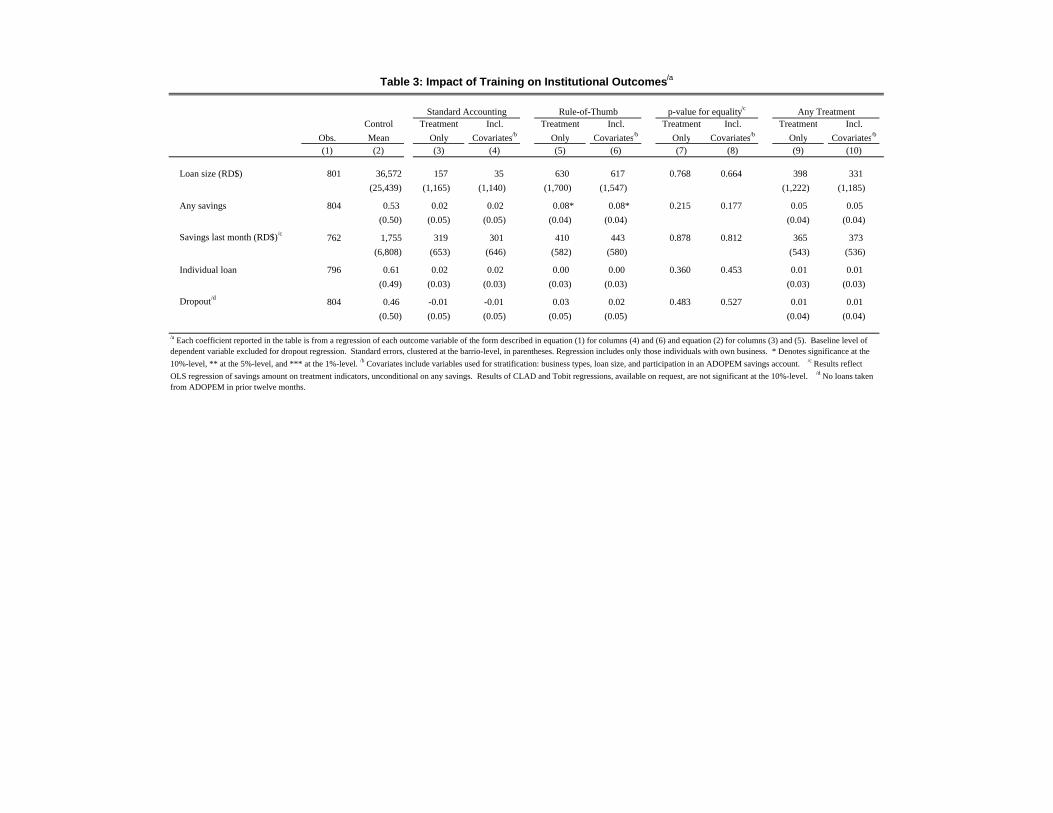
Control Treatment Incl. Treatment Incl. Treatment Incl. Treatment Incl.
Obs. Mean Only Covariates/b Only Covariates/b Only Covariates/b Only Covariates/b
(1) (2) (3) (4) (5) (6) (7) (8) (9) (10)
Loan size (RD$) 801 36,572 157 35 630 617 0.768 0.664 398 331
(25,439) (1,165) (1,140) (1,700) (1,547) (1,222) (1,185)
Any savings 804 0.53 0.02 0.02 0.08* 0.08* 0.215 0.177 0.05 0.05
(0.50) (0.05) (0.05) (0.04) (0.04) (0.04) (0.04)
Savings last month (RD$)/c762 1,755 319 301 410 443 0.878 0.812 365 373
(6,808) (653) (646) (582) (580) (543) (536)
Individual loan 796 0.61 0.02 0.02 0.00 0.00 0.360 0.453 0.01 0.01
(0.49) (0.03) (0.03) (0.03) (0.03) (0.03) (0.03)
Dropout/d804 0.46 -0.01 -0.01 0.03 0.02 0.483 0.527 0.01 0.01
(0.50) (0.05) (0.05) (0.05) (0.05) (0.04) (0.04)
Table 3: Impact of Training on Institutional Outcomes/a
Standard Accounting Rule-of-Thumb Any Treatmentp-value for equality/c
/a Each coefficient reported in the table is from a regression of each outcome variable of the form described in equation (1) for columns (4) and (6) and equation (2) for columns (3) and (5). Baseline level of dependent variable excluded for dropout regression. Standard errors, clustered at the barrio-level, in parentheses. Regression includes only those individuals with own business. * Denotes significance at the
10%-level, ** at the 5%-level, and *** at the 1%-level. /b Covariates include variables used for stratification: business types, loan size, and participation in an ADOPEM savings account. /c Results reflect
OLS regression of savings amount on treatment indicators, unconditional on any savings. Results of CLAD and Tobit regressions, available on request, are not significant at the 10%-level. /d No loans taken from ADOPEM in prior twelve months.
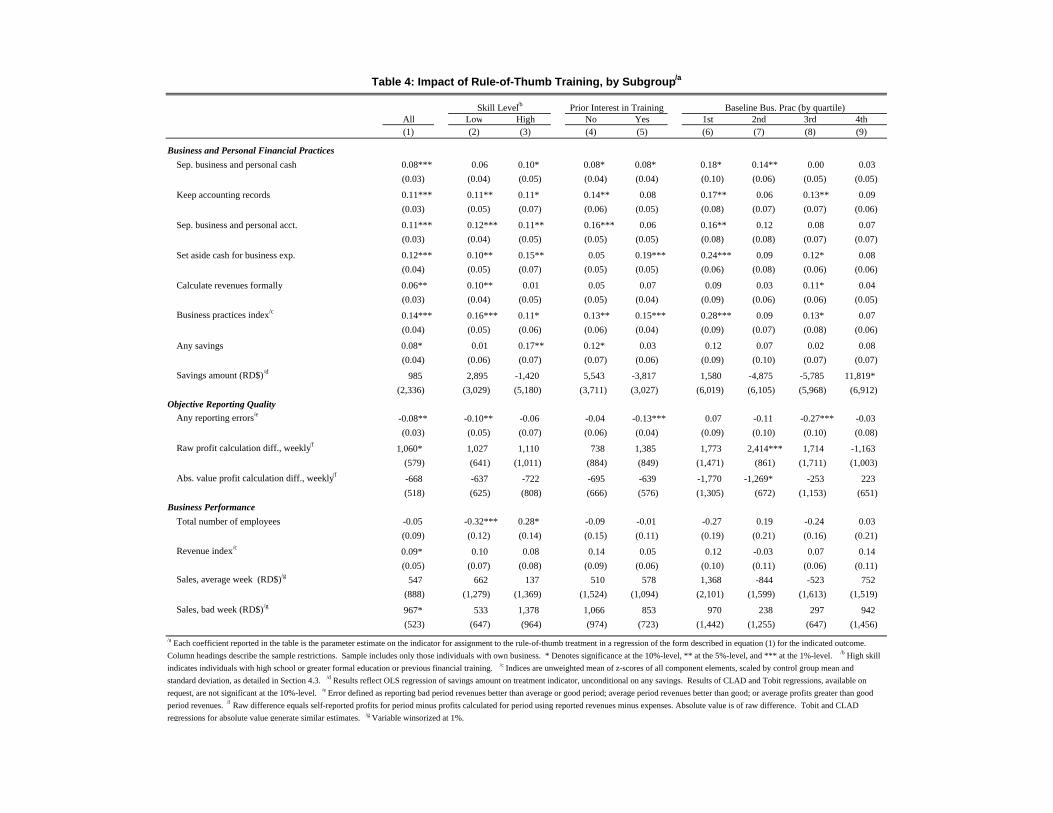
All Low High No Yes 1st 2nd 3rd 4th(1) (2) (3) (4) (5) (6) (7) (8) (9)
Business and Personal Financial PracticesSep. business and personal cash 0.08*** 0.06 0.10* 0.08* 0.08* 0.18* 0.14** 0.00 0.03
(0.03) (0.04) (0.05) (0.04) (0.04) (0.10) (0.06) (0.05) (0.05)
Keep accounting records 0.11*** 0.11** 0.11* 0.14** 0.08 0.17** 0.06 0.13** 0.09
(0.03) (0.05) (0.07) (0.06) (0.05) (0.08) (0.07) (0.07) (0.06)
Sep. business and personal acct. 0.11*** 0.12*** 0.11** 0.16*** 0.06 0.16** 0.12 0.08 0.07
(0.03) (0.04) (0.05) (0.05) (0.05) (0.08) (0.08) (0.07) (0.07)
Set aside cash for business exp. 0.12*** 0.10** 0.15** 0.05 0.19*** 0.24*** 0.09 0.12* 0.08
(0.04) (0.05) (0.07) (0.05) (0.05) (0.06) (0.08) (0.06) (0.06)
Calculate revenues formally 0.06** 0.10** 0.01 0.05 0.07 0.09 0.03 0.11* 0.04
(0.03) (0.04) (0.05) (0.05) (0.04) (0.09) (0.06) (0.06) (0.05)
Business practices index/c0.14*** 0.16*** 0.11* 0.13** 0.15*** 0.28*** 0.09 0.13* 0.07
(0.04) (0.05) (0.06) (0.06) (0.04) (0.09) (0.07) (0.08) (0.06)
Any savings 0.08* 0.01 0.17** 0.12* 0.03 0.12 0.07 0.02 0.08
(0.04) (0.06) (0.07) (0.07) (0.06) (0.09) (0.10) (0.07) (0.07)
Savings amount (RD$)/d985 2,895 -1,420 5,543 -3,817 1,580 -4,875 -5,785 11,819*
(2,336) (3,029) (5,180) (3,711) (3,027) (6,019) (6,105) (5,968) (6,912)
Objective Reporting QualityAny reporting errors/e
-0.08** -0.10** -0.06 -0.04 -0.13*** 0.07 -0.11 -0.27*** -0.03
(0.03) (0.05) (0.07) (0.06) (0.04) (0.09) (0.10) (0.10) (0.08)
Raw profit calculation diff., weekly/f1,060* 1,027 1,110 738 1,385 1,773 2,414*** 1,714 -1,163
(579) (641) (1,011) (884) (849) (1,471) (861) (1,711) (1,003)
Abs. value profit calculation diff., weekly/f-668 -637 -722 -695 -639 -1,770 -1,269* -253 223
(518) (625) (808) (666) (576) (1,305) (672) (1,153) (651)
Business PerformanceTotal number of employees -0.05 -0.32*** 0.28* -0.09 -0.01 -0.27 0.19 -0.24 0.03
(0.09) (0.12) (0.14) (0.15) (0.11) (0.19) (0.21) (0.16) (0.21)
Revenue index/c0.09* 0.10 0.08 0.14 0.05 0.12 -0.03 0.07 0.14
(0.05) (0.07) (0.08) (0.09) (0.06) (0.10) (0.11) (0.06) (0.11)
Sales, average week (RD$)/g547 662 137 510 578 1,368 -844 -523 752
(888) (1,279) (1,369) (1,524) (1,094) (2,101) (1,599) (1,613) (1,519)
Sales, bad week (RD$)/g967* 533 1,378 1,066 853 970 238 297 942
(523) (647) (964) (974) (723) (1,442) (1,255) (647) (1,456)
Table 4: Impact of Rule-of-Thumb Training, by Subgroup/a
Prior Interest in Training Baseline Bus. Prac (by quartile)Skill Level/b
/a Each coefficient reported in the table is the parameter estimate on the indicator for assignment to the rule-of-thumb treatment in a regression of the form described in equation (1) for the indicated outcome.
Column headings describe the sample restrictions. Sample includes only those individuals with own business. * Denotes significance at the 10%-level, ** at the 5%-level, and *** at the 1%-level. /b High skill
indicates individuals with high school or greater formal education or previous financial training. /c Indices are unweighted mean of z-scores of all component elements, scaled by control group mean and
standard deviation, as detailed in Section 4.3. /d Results reflect OLS regression of savings amount on treatment indicator, unconditional on any savings. Results of CLAD and Tobit regressions, available on
request, are not significant at the 10%-level. /e Error defined as reporting bad period revenues better than average or good period; average period revenues better than good; or average profits greater than good
period revenues. /f Raw difference equals self-reported profits for period minus profits calculated for period using reported revenues minus expenses. Absolute value is of raw difference. Tobit and CLAD
regressions for absolute value generate similar estimates. /g Variable winsorized at 1%.
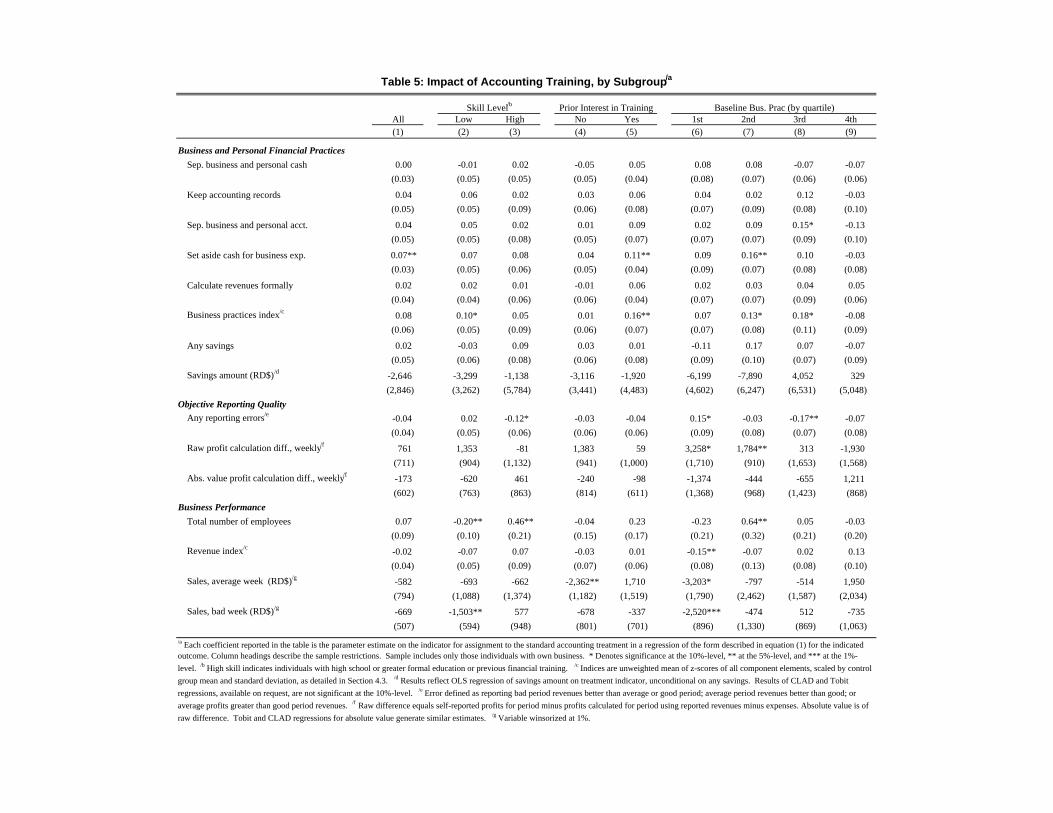
All Low High No Yes 1st 2nd 3rd 4th(1) (2) (3) (4) (5) (6) (7) (8) (9)
Business and Personal Financial PracticesSep. business and personal cash 0.00 -0.01 0.02 -0.05 0.05 0.08 0.08 -0.07 -0.07
(0.03) (0.05) (0.05) (0.05) (0.04) (0.08) (0.07) (0.06) (0.06)
Keep accounting records 0.04 0.06 0.02 0.03 0.06 0.04 0.02 0.12 -0.03
(0.05) (0.05) (0.09) (0.06) (0.08) (0.07) (0.09) (0.08) (0.10)
Sep. business and personal acct. 0.04 0.05 0.02 0.01 0.09 0.02 0.09 0.15* -0.13
(0.05) (0.05) (0.08) (0.05) (0.07) (0.07) (0.07) (0.09) (0.10)
Set aside cash for business exp. 0.07** 0.07 0.08 0.04 0.11** 0.09 0.16** 0.10 -0.03
(0.03) (0.05) (0.06) (0.05) (0.04) (0.09) (0.07) (0.08) (0.08)
Calculate revenues formally 0.02 0.02 0.01 -0.01 0.06 0.02 0.03 0.04 0.05
(0.04) (0.04) (0.06) (0.06) (0.04) (0.07) (0.07) (0.09) (0.06)
Business practices index/c0.08 0.10* 0.05 0.01 0.16** 0.07 0.13* 0.18* -0.08
(0.06) (0.05) (0.09) (0.06) (0.07) (0.07) (0.08) (0.11) (0.09)
Any savings 0.02 -0.03 0.09 0.03 0.01 -0.11 0.17 0.07 -0.07
(0.05) (0.06) (0.08) (0.06) (0.08) (0.09) (0.10) (0.07) (0.09)
Savings amount (RD$)/d-2,646 -3,299 -1,138 -3,116 -1,920 -6,199 -7,890 4,052 329
(2,846) (3,262) (5,784) (3,441) (4,483) (4,602) (6,247) (6,531) (5,048)
Objective Reporting QualityAny reporting errors/e
-0.04 0.02 -0.12* -0.03 -0.04 0.15* -0.03 -0.17** -0.07
(0.04) (0.05) (0.06) (0.06) (0.06) (0.09) (0.08) (0.07) (0.08)
Raw profit calculation diff., weekly/f761 1,353 -81 1,383 59 3,258* 1,784** 313 -1,930
(711) (904) (1,132) (941) (1,000) (1,710) (910) (1,653) (1,568)
Abs. value profit calculation diff., weekly/f-173 -620 461 -240 -98 -1,374 -444 -655 1,211
(602) (763) (863) (814) (611) (1,368) (968) (1,423) (868)
Business PerformanceTotal number of employees 0.07 -0.20** 0.46** -0.04 0.23 -0.23 0.64** 0.05 -0.03
(0.09) (0.10) (0.21) (0.15) (0.17) (0.21) (0.32) (0.21) (0.20)
Revenue index/c-0.02 -0.07 0.07 -0.03 0.01 -0.15** -0.07 0.02 0.13
(0.04) (0.05) (0.09) (0.07) (0.06) (0.08) (0.13) (0.08) (0.10)
Sales, average week (RD$)/g-582 -693 -662 -2,362** 1,710 -3,203* -797 -514 1,950
(794) (1,088) (1,374) (1,182) (1,519) (1,790) (2,462) (1,587) (2,034)
Sales, bad week (RD$)/g-669 -1,503** 577 -678 -337 -2,520*** -474 512 -735
(507) (594) (948) (801) (701) (896) (1,330) (869) (1,063)
Table 5: Impact of Accounting Training, by Subgroup/a
Skill Level/b Prior Interest in Training Baseline Bus. Prac (by quartile)
/a Each coefficient reported in the table is the parameter estimate on the indicator for assignment to the standard accounting treatment in a regression of the form described in equation (1) for the indicated outcome. Column headings describe the sample restrictions. Sample includes only those individuals with own business. * Denotes significance at the 10%-level, ** at the 5%-level, and *** at the 1%-
level. /b High skill indicates individuals with high school or greater formal education or previous financial training. /c Indices are unweighted mean of z-scores of all component elements, scaled by control
group mean and standard deviation, as detailed in Section 4.3. /d Results reflect OLS regression of savings amount on treatment indicator, unconditional on any savings. Results of CLAD and Tobit
regressions, available on request, are not significant at the 10%-level. /e Error defined as reporting bad period revenues better than average or good period; average period revenues better than good; or
average profits greater than good period revenues. /f Raw difference equals self-reported profits for period minus profits calculated for period using reported revenues minus expenses. Absolute value is of
raw difference. Tobit and CLAD regressions for absolute value generate similar estimates. /g Variable winsorized at 1%.

All Low High No Yes 1st 2nd 3rd 4th(1) (2) (3) (4) (5) (6) (7) (8) (9)
Business and Personal Financial Practices
Sep. business and personal cash 0.08 0.08 0.08 0.13 0.03 0.10 0.06 0.07 0.11
[0.010] [0.132] [0.115] [0.006] [0.450] [0.252] [0.318] [0.254] [0.052]
Keep accounting records 0.07 0.05 0.09 0.11 0.02 0.13 0.04 0.01 0.12
[0.127] [0.353] [0.161] [0.052] [0.720] [0.049] [0.654] [0.935] [0.088]
Sep. business and personal acct. 0.07 0.06 0.09 0.16 -0.02 0.13 0.03 -0.07 0.20
[0.139] [0.304] [0.178] [0.008] [0.723] [0.098] [0.712] [0.333] [0.007]
Set aside cash for business exp. 0.05 0.03 0.07 0.02 0.08 0.15 -0.07 0.01 0.11
[0.179] [0.491] [0.308] [0.763] [0.125] [0.073] [0.330] [0.870] [0.175]
Calculate revenues formally 0.04 0.08 0.00 0.07 0.01 0.08 -0.01 0.07 -0.01
[0.219] [0.076] [0.949] [0.168] [0.799] [0.193] [0.899] [0.336] [0.869]
Business practices index/c0.07 0.06 0.05 0.12 -0.01 0.21 -0.04 -0.05 0.15
[0.225] [0.328] [0.449] [0.052] [0.899] [0.010] [0.589] [0.501] [0.055]
Any savings 0.06 0.04 0.08 0.09 0.02 0.23 -0.11 -0.05 0.15
[0.215] [0.522] [0.282] [0.095] [0.744] [0.006] [0.248] [0.643] [0.169]
Savings amount (RD$)/d 3,631 6,193 -282 8,659 -1,897 7,779 3,016 -9,837 11,490
[0.158] [0.072] [0.944] [0.011] [0.606] [0.020] [0.581] [0.252] [0.103]
Objective Reporting QualityAny reporting errors/e
-0.05 -0.12 0.07 0.00 -0.09 -0.08 -0.08 -0.10 0.03
[0.175] [0.016] [0.268] [0.929] [0.135] [0.368] [0.231] [0.239] [0.701]
Raw profit calculation diff., weekly/f299 -326 1,191 -645 1,326 -1,485 630 1,401 767
[0.660] [0.648] [0.281] [0.442] [0.116] [0.327] [0.531] [0.203] [0.564]
Abs. value profit calculation diff., weekly/f-495 -17 -1,183 -456 -541 -396 -825 402 -987
[0.362] [0.976] [0.128] [0.467] [0.442] [0.656] [0.380] [0.635] [0.314]
Business Performance
Total number of employees -0.12 -0.12 -0.18 -0.05 -0.23 -0.04 -0.45 -0.29 0.05
[0.337] [0.309] [0.474] [0.748] [0.214] [0.781] [0.162] [0.172] [0.833]
Revenue index/c0.11 0.17 0.02 0.17 0.04 0.28 0.04 0.05 0.01
[0.031] [0.044] [0.832] [0.055] [0.553] [0.014] [0.790] [0.493] [0.935]
Sales, average week (RD$)/g1,129 1,356 799 2,872 -1,132 4,571 -47 -9 -1,197
[0.273] [0.406] [0.505] [0.044] [0.504] [0.086] [0.986] [0.991] [0.601]
Sales, bad week (RD$)/g1,635 2,036 801 1,743 1,190 3,490 712 -215 1,678
[0.003] [0.010] [0.396] [0.063] [0.045] [0.014] [0.655] [0.771] [0.186]
/a Each coefficient reported in the table is the parameter estimate on the indicator for assignment to the rule-of-thumb treatment minus that for assignment to the standard accounting treatment in a regression
of the form described in equation (1) for the indicated outcome. Column headings describe the sample restrictions. Sample includes only those individuals with own business. p-values appear in brackets. /b
High skill indicates individuals with high school or greater formal education or previous financial training. /c Indices are unweighted mean of z-scores of all component elements, scaled by control group
mean and standard deviation, as detailed in Section 4.3. /d Results reflect OLS regression of savings amount on treatment indicator, unconditional on any savings. Results of CLAD and Tobit regressions,
available on request, are not significant at the 10%-level. /e Error defined as reporting bad period revenues better than average or good period; average period revenues better than good; or average profits
greater than good period revenues. /f Raw difference equals self-reported profits for period minus profits calculated for period using reported revenues minus expenses. Absolute value is of raw difference.
Tobit and CLAD regressions for absolute value generate similar estimates. /g Variable winsorized at 1%.
Table 6: Difference between Rule of Thumb and Accounting Treatment, by Subgroup/a
Skill Level/b Prior Interest in Training Baseline Bus. Prac (by quartile)
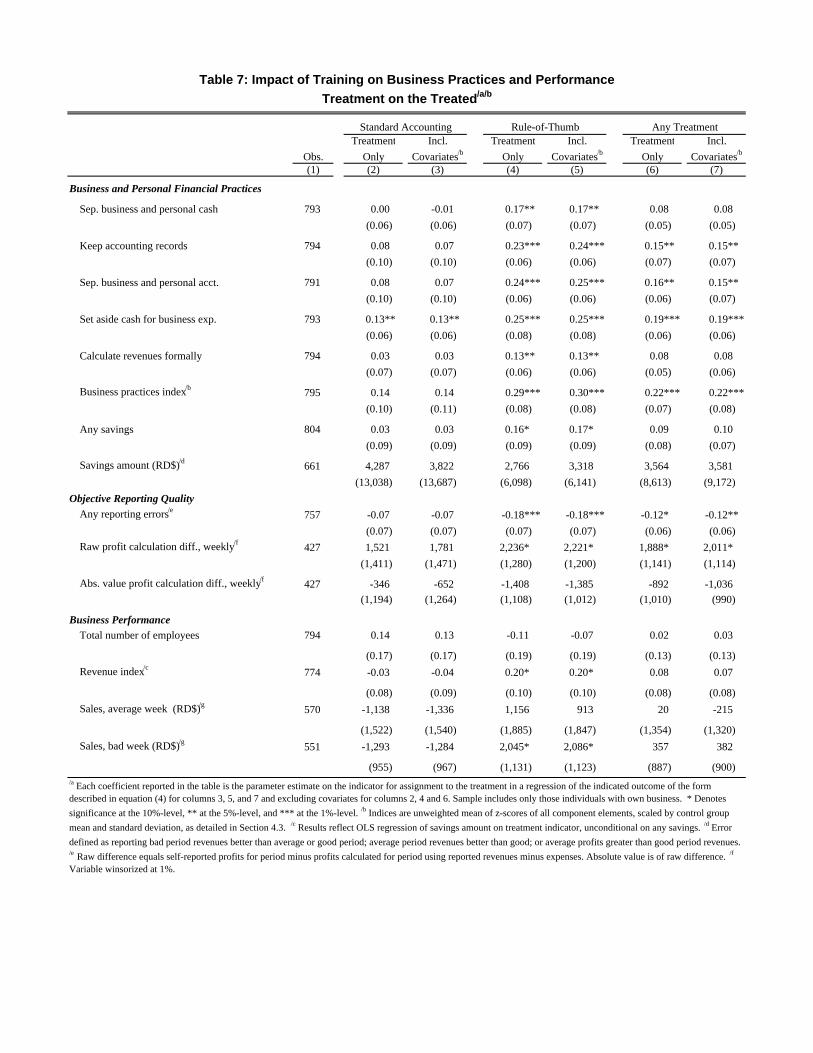
Treatment Incl. Treatment Incl. Treatment Incl.
Obs. Only Covariates/b Only Covariates/b Only Covariates/b
(1) (2) (3) (4) (5) (6) (7)
Business and Personal Financial Practices
Sep. business and personal cash 793 0.00 -0.01 0.17** 0.17** 0.08 0.08
(0.06) (0.06) (0.07) (0.07) (0.05) (0.05)
Keep accounting records 794 0.08 0.07 0.23*** 0.24*** 0.15** 0.15**
(0.10) (0.10) (0.06) (0.06) (0.07) (0.07)
Sep. business and personal acct. 791 0.08 0.07 0.24*** 0.25*** 0.16** 0.15**
(0.10) (0.10) (0.06) (0.06) (0.06) (0.07)
Set aside cash for business exp. 793 0.13** 0.13** 0.25*** 0.25*** 0.19*** 0.19***
(0.06) (0.06) (0.08) (0.08) (0.06) (0.06)
Calculate revenues formally 794 0.03 0.03 0.13** 0.13** 0.08 0.08
(0.07) (0.07) (0.06) (0.06) (0.05) (0.06)
Business practices index/b795 0.14 0.14 0.29*** 0.30*** 0.22*** 0.22***
(0.10) (0.11) (0.08) (0.08) (0.07) (0.08)
Any savings 804 0.03 0.03 0.16* 0.17* 0.09 0.10
(0.09) (0.09) (0.09) (0.09) (0.08) (0.07)
Savings amount (RD$)/d661 4,287 3,822 2,766 3,318 3,564 3,581
(13,038) (13,687) (6,098) (6,141) (8,613) (9,172)
Objective Reporting QualityAny reporting errors/e
757 -0.07 -0.07 -0.18*** -0.18*** -0.12* -0.12**
(0.07) (0.07) (0.07) (0.07) (0.06) (0.06)
Raw profit calculation diff., weekly/f427 1,521 1,781 2,236* 2,221* 1,888* 2,011*
(1,411) (1,471) (1,280) (1,200) (1,141) (1,114)
Abs. value profit calculation diff., weekly/f427 -346 -652 -1,408 -1,385 -892 -1,036
(1,194) (1,264) (1,108) (1,012) (1,010) (990)
Business PerformanceTotal number of employees 794 0.14 0.13 -0.11 -0.07 0.02 0.03
(0.17) (0.17) (0.19) (0.19) (0.13) (0.13)
Revenue index/c774 -0.03 -0.04 0.20* 0.20* 0.08 0.07
(0.08) (0.09) (0.10) (0.10) (0.08) (0.08)
Sales, average week (RD$)/g 570 -1,138 -1,336 1,156 913 20 -215
(1,522) (1,540) (1,885) (1,847) (1,354) (1,320)
Sales, bad week (RD$)/g 551 -1,293 -1,284 2,045* 2,086* 357 382
(955) (967) (1,131) (1,123) (887) (900) /a Each coefficient reported in the table is the parameter estimate on the indicator for assignment to the treatment in a regression of the indicated outcome of the form described in equation (4) for columns 3, 5, and 7 and excluding covariates for columns 2, 4 and 6. Sample includes only those individuals with own business. * Denotes
significance at the 10%-level, ** at the 5%-level, and *** at the 1%-level. /b Indices are unweighted mean of z-scores of all component elements, scaled by control group
mean and standard deviation, as detailed in Section 4.3. /c Results reflect OLS regression of savings amount on treatment indicator, unconditional on any savings. /d Error
defined as reporting bad period revenues better than average or good period; average period revenues better than good; or average profits greater than good period revenues. /e Raw difference equals self-reported profits for period minus profits calculated for period using reported revenues minus expenses. Absolute value is of raw difference. /f
Variable winsorized at 1%.
Table 7: Impact of Training on Business Practices and Performance
Treatment on the Treated/a/b
Standard Accounting Rule-of-Thumb Any Treatment
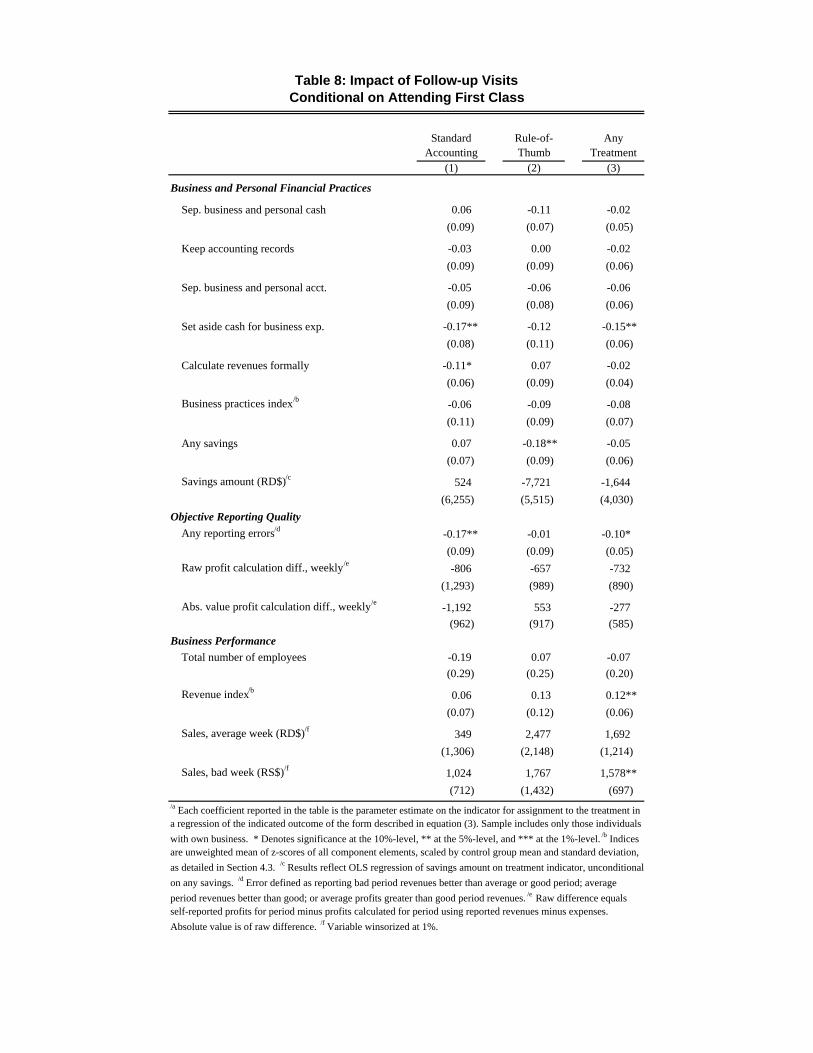
Standard Accounting
Rule-of-Thumb
Any Treatment
(1) (2) (3)
Business and Personal Financial Practices
Sep. business and personal cash 0.06 -0.11 -0.02
(0.09) (0.07) (0.05)
Keep accounting records -0.03 0.00 -0.02
(0.09) (0.09) (0.06)
Sep. business and personal acct. -0.05 -0.06 -0.06
(0.09) (0.08) (0.06)
Set aside cash for business exp. -0.17** -0.12 -0.15**
(0.08) (0.11) (0.06)
Calculate revenues formally -0.11* 0.07 -0.02
(0.06) (0.09) (0.04)
Business practices index/b-0.06 -0.09 -0.08
(0.11) (0.09) (0.07)
Any savings 0.07 -0.18** -0.05
(0.07) (0.09) (0.06)
Savings amount (RD$)/c524 -7,721 -1,644
(6,255) (5,515) (4,030)
Objective Reporting QualityAny reporting errors/d
-0.17** -0.01 -0.10*
(0.09) (0.09) (0.05)
Raw profit calculation diff., weekly/e-806 -657 -732
(1,293) (989) (890)
Abs. value profit calculation diff., weekly/e-1,192 553 -277
(962) (917) (585)
Business PerformanceTotal number of employees -0.19 0.07 -0.07
(0.29) (0.25) (0.20)
Revenue index/b0.06 0.13 0.12**
(0.07) (0.12) (0.06)
Sales, average week (RD$)/f349 2,477 1,692
(1,306) (2,148) (1,214)
Sales, bad week (RS$)/f1,024 1,767 1,578**
(712) (1,432) (697)
Table 8: Impact of Follow-up VisitsConditional on Attending First Class
/a Each coefficient reported in the table is the parameter estimate on the indicator for assignment to the treatment in a regression of the indicated outcome of the form described in equation (3). Sample includes only those individuals
with own business. * Denotes significance at the 10%-level, ** at the 5%-level, and *** at the 1%-level. /b Indices are unweighted mean of z-scores of all component elements, scaled by control group mean and standard deviation,
as detailed in Section 4.3. /c Results reflect OLS regression of savings amount on treatment indicator, unconditional
on any savings. /d Error defined as reporting bad period revenues better than average or good period; average
period revenues better than good; or average profits greater than good period revenues. /e Raw difference equals self-reported profits for period minus profits calculated for period using reported revenues minus expenses.
Absolute value is of raw difference. /f Variable winsorized at 1%.
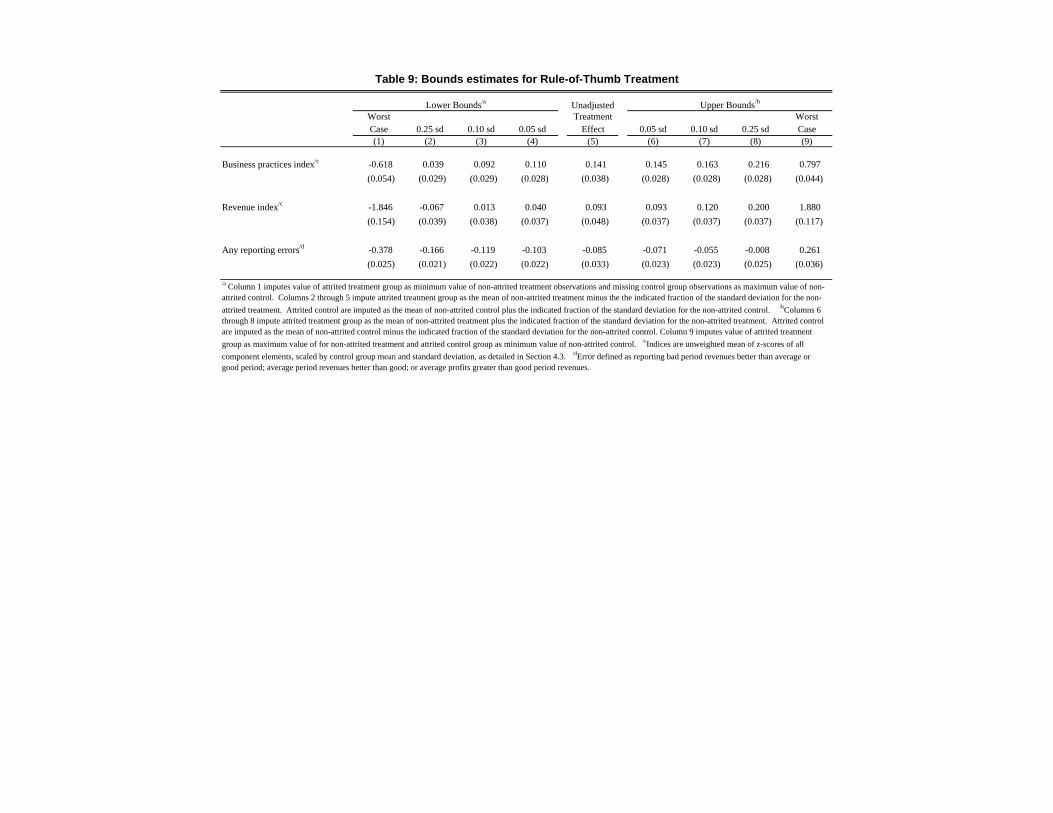
UnadjustedWorst Treatment WorstCase 0.25 sd 0.10 sd 0.05 sd Effect 0.05 sd 0.10 sd 0.25 sd Case(1) (2) (3) (4) (5) (6) (7) (8) (9)
Business practices index/c -0.618 0.039 0.092 0.110 0.141 0.145 0.163 0.216 0.797
(0.054) (0.029) (0.029) (0.028) (0.038) (0.028) (0.028) (0.028) (0.044)
Revenue index/c -1.846 -0.067 0.013 0.040 0.093 0.093 0.120 0.200 1.880
(0.154) (0.039) (0.038) (0.037) (0.048) (0.037) (0.037) (0.037) (0.117)
Any reporting errors/d -0.378 -0.166 -0.119 -0.103 -0.085 -0.071 -0.055 -0.008 0.261
(0.025) (0.021) (0.022) (0.022) (0.033) (0.023) (0.023) (0.025) (0.036)
Upper Bounds/b
Table 9: Bounds estimates for Rule-of-Thumb Treatment
Lower Bounds/a
/a Column 1 imputes value of attrited treatment group as minimum value of non-attrited treatment observations and missing control group observations as maximum value of non-attrited control. Columns 2 through 5 impute attrited treatment group as the mean of non-attrited treatment minus the the indicated fraction of the standard deviation for the non-
attrited treatment. Attrited control are imputed as the mean of non-attrited control plus the indicated fraction of the standard deviation for the non-attrited control. /bColumns 6 through 8 impute attrited treatment group as the mean of non-attrited treatment plus the indicated fraction of the standard deviation for the non-attrited treatment. Attrited control are imputed as the mean of non-attrited control minus the indicated fraction of the standard deviation for the non-attrited control. Column 9 imputes value of attrited treatment
group as maximum value of for non-attrited treatment and attrited control group as minimum value of non-attrited control. /cIndices are unweighted mean of z-scores of all
component elements, scaled by control group mean and standard deviation, as detailed in Section 4.3. /dError defined as reporting bad period revenues better than average or good period; average period revenues better than good; or average profits greater than good period revenues.
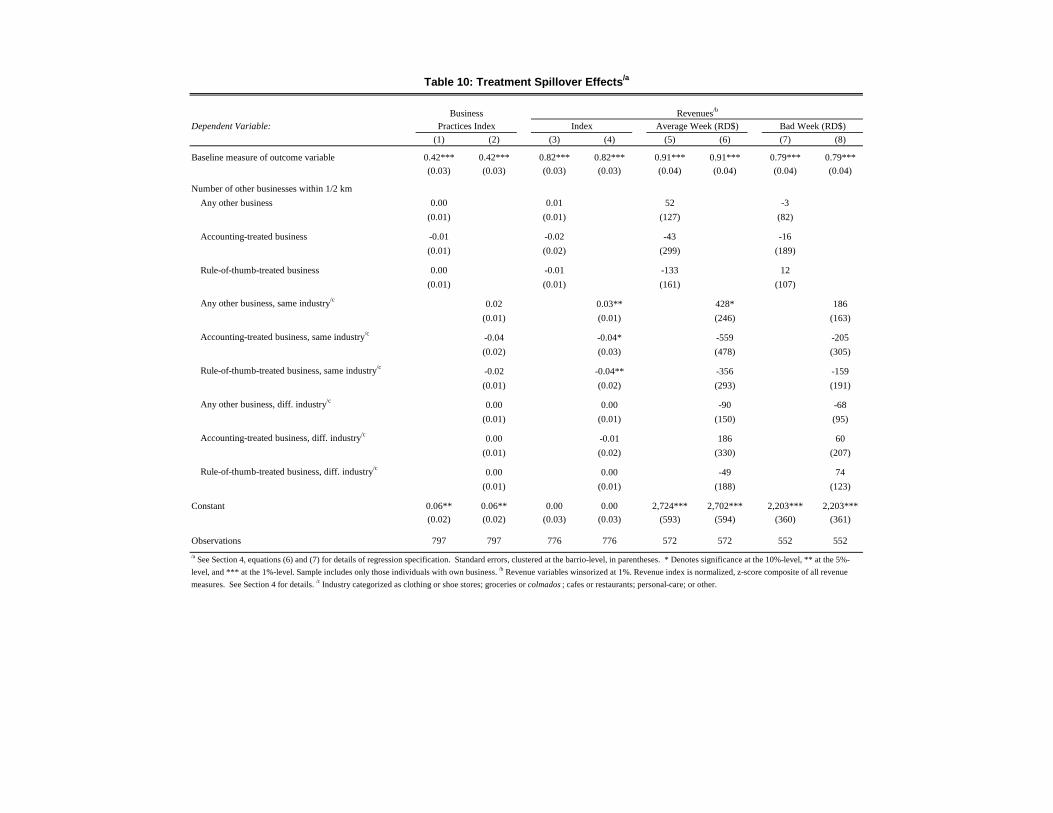
Dependent Variable:
(1) (2) (3) (4) (5) (6) (7) (8)
Baseline measure of outcome variable 0.42*** 0.42*** 0.82*** 0.82*** 0.91*** 0.91*** 0.79*** 0.79***
(0.03) (0.03) (0.03) (0.03) (0.04) (0.04) (0.04) (0.04)
Number of other businesses within 1/2 km
Any other business 0.00 0.01 52 -3
(0.01) (0.01) (127) (82)
Accounting-treated business -0.01 -0.02 -43 -16
(0.01) (0.02) (299) (189)
Rule-of-thumb-treated business 0.00 -0.01 -133 12
(0.01) (0.01) (161) (107)
Any other business, same industry/c0.02 0.03** 428* 186
(0.01) (0.01) (246) (163)
Accounting-treated business, same industry/c-0.04 -0.04* -559 -205
(0.02) (0.03) (478) (305)
Rule-of-thumb-treated business, same industry/c-0.02 -0.04** -356 -159
(0.01) (0.02) (293) (191)
Any other business, diff. industry/c0.00 0.00 -90 -68
(0.01) (0.01) (150) (95)
Accounting-treated business, diff. industry/c0.00 -0.01 186 60
(0.01) (0.02) (330) (207)
Rule-of-thumb-treated business, diff. industry/c0.00 0.00 -49 74
(0.01) (0.01) (188) (123)
Constant 0.06** 0.06** 0.00 0.00 2,724*** 2,702*** 2,203*** 2,203***
(0.02) (0.02) (0.03) (0.03) (593) (594) (360) (361)
Observations 797 797 776 776 572 572 552 552
/a See Section 4, equations (6) and (7) for details of regression specification. Standard errors, clustered at the barrio-level, in parentheses. * Denotes significance at the 10%-level, ** at the 5%-
level, and *** at the 1%-level. Sample includes only those individuals with own business. /b Revenue variables winsorized at 1%. Revenue index is normalized, z-score composite of all revenue
measures. See Section 4 for details. /c Industry categorized as clothing or shoe stores; groceries or colmados ; cafes or restaurants; personal-care; or other.
Table 10: Treatment Spillover Effects/a
Index Average Week (RD$) Bad Week (RD$)Revenues/bBusiness
Practices Index

Table A1: Summary of Training Programs
Rule of Thumb Accounting
Class 1 Savings ‐ Why we should save ‐ Set saving goals ‐ Save for emergencies ‐ Decide how to save ‐ Compare saving services ‐ Plan your future savings
Same
Class 2 Consumption ‐ Financial burden ‐ Study your income and expenses ‐ Plan your future expenses
Same
Class 3 Debt Management ‐ Why borrowing ‐ How much debt I can afford ‐ Default, what is it and how it happens ‐ Cost of default and excessive debt
Same
Class 4 Account Separation ‐ Why separate money for the household
from money for the business ‐ Separating house and business money ‐ Setting ourselves a salary ‐ How to keep records of flows between
business and household
Basic Accounting 1 ‐ Relevance of Accounting ‐ Estimating profits using itemized
records or cash accumulation
Class 5 Estimation Methods ‐ Estimate total monthly flow of money
between household and business ‐ Estimate increase/decrease of money
in the business between beginning and end of the month
‐ Estimating profits
Basic Accounting 2 ‐ Including personal income and
expenses into the business daily records
‐ Using daily records to estimate daily profit
‐ Review estimating profits using itemized records or cash accumulation
‐ How to include fixed costs into the profit calculations
Class 6 None Basic Accounting 3
‐ Aggregating daily records into monthly records
‐ Estimating monthly profit ‐ Accounts payable record keeping ‐ Accounts receivable record keeping
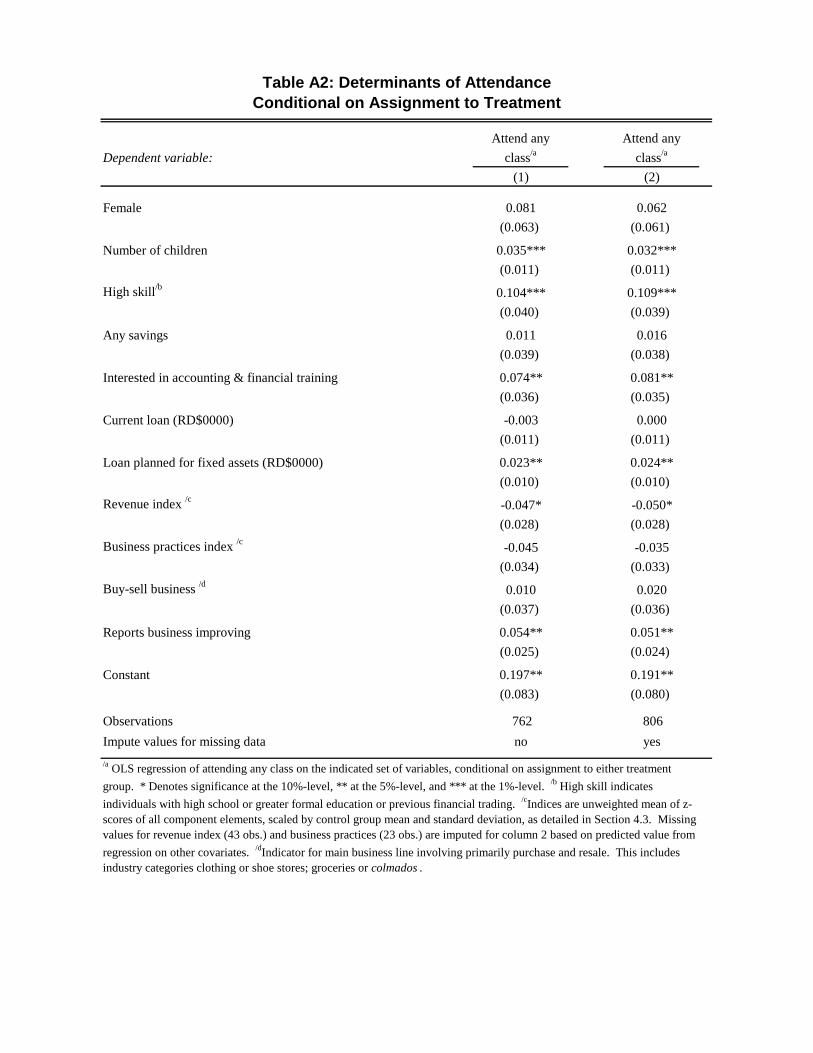
Dependent variable:
(1) (2)
Female 0.081 0.062
(0.063) (0.061)
Number of children 0.035*** 0.032***
(0.011) (0.011)
High skill/b0.104*** 0.109***
(0.040) (0.039)
Any savings 0.011 0.016
(0.039) (0.038)
Interested in accounting & financial training 0.074** 0.081**
(0.036) (0.035)
Current loan (RD$0000) -0.003 0.000
(0.011) (0.011)
Loan planned for fixed assets (RD$0000) 0.023** 0.024**
(0.010) (0.010)
Revenue index /c -0.047* -0.050*
(0.028) (0.028)
Business practices index /c -0.045 -0.035
(0.034) (0.033)
Buy-sell business /d 0.010 0.020
(0.037) (0.036)
Reports business improving 0.054** 0.051**
(0.025) (0.024)
Constant 0.197** 0.191**
(0.083) (0.080)
Observations 762 806
Impute values for missing data no yes
Attend any
class/a
Table A2: Determinants of AttendanceConditional on Assignment to Treatment
Attend any
class/a
/a OLS regression of attending any class on the indicated set of variables, conditional on assignment to either treatment
group. * Denotes significance at the 10%-level, ** at the 5%-level, and *** at the 1%-level. /b High skill indicates
individuals with high school or greater formal education or previous financial trading. /cIndices are unweighted mean of z-scores of all component elements, scaled by control group mean and standard deviation, as detailed in Section 4.3. Missing values for revenue index (43 obs.) and business practices (23 obs.) are imputed for column 2 based on predicted value from
regression on other covariates. /dIndicator for main business line involving primarily purchase and resale. This includes industry categories clothing or shoe stores; groceries or colmados .
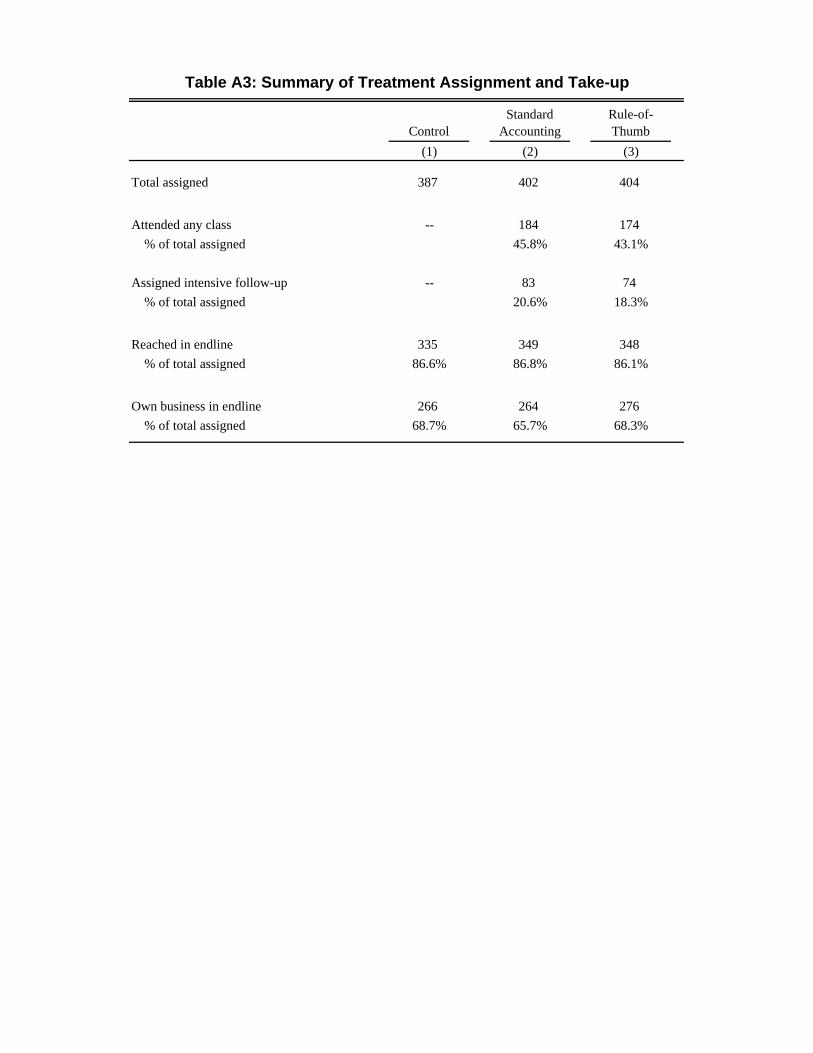
ControlStandard
AccountingRule-of-Thumb
(1) (2) (3)
Total assigned 387 402 404
Attended any class -- 184 174
% of total assigned 45.8% 43.1%
Assigned intensive follow-up -- 83 74
% of total assigned 20.6% 18.3%
Reached in endline 335 349 348
% of total assigned 86.6% 86.8% 86.1%
Own business in endline 266 264 276
% of total assigned 68.7% 65.7% 68.3%
Table A3: Summary of Treatment Assignment and Take-up
Recommended