[Cover]
Document to be filed: Annual Securities Report
Provision to base upon: Article 24, paragraph 1 of the Financial Instruments and Exchange Act
Filing to: Director-General of the Kanto Local Finance Bureau
Date of filing: June 27, 2014
Business year: 118th term (from April 1, 2013 to March 31, 2014)
Company name (Japanese): TDK Kabushiki-Kaisha
Company name (English): TDK CORPORATION
Title and name of representative: Takehiro Kamigama, President & Representative Director
Location of head office: 3-9-1, Shibaura, Minato-ku, Tokyo, Japan
Telephone number: +81-3-6852-7116
Contact person: Takakazu Momozuka, Corporate Officer
Place of contact: 3-9-1, Shibaura, Minato-ku, Tokyo, Japan
Telephone number: +81-3-6852-7116
Contact person: Takakazu Momozuka, Corporate Officer
Place where the document to be filed is available for public inspection
Tokyo Stock Exchange, Inc. (2-1, Nihonbashi-kabutocho, Chuo-ku, Tokyo, Japan)

A. COMPANY INFORMATION I. Overview of the Company 1. Trends in principal management benchmarks (1) Management benchmarks (consolidated)
Term 114th term 115th term 116th term 117th term 118th term
Accounting period From April 1, 2009 to March 31, 2010
From April 1, 2010 to March 31, 2011
From April 1, 2011 to March 31, 2012
From April 1, 2012 to March 31, 2013
From April 1, 2013 to March 31, 2014
Net sales (Millions of yen) 792,624 862,492 802,534 841,847 984,525
Income from continuing operations before income taxes (Millions of yen)
25,576 64,519 14,668 19,765 39,772
Net income (loss) attributable to TDK (Millions of yen)
13,520 45,264 (2,454) 1,195 16,288
Comprehensive income (loss) attributable to TDK (Millions of yen)
4,805 (623) (16,406) 73,028 87,439
TDK stockholders’ equity (Millions of yen) 543,756 534,273 498,159 561,169 635,327
Net assets (Millions of yen) 549,669 539,766 512,046 580,616 652,243
Total assets (Millions of yen) 1,091,458 1,060,853 1,072,829 1,169,642 1,239,589
TDK stockholders’ equity per share (Yen)
4,215.42 4,141.78 3,957.20 4,460.79 5,049.72
Net income (loss) attributable to TDK per share (Yen)
104.82 350.90 (19.06) 9.50 129.47
Diluted net income (loss) attributable to TDK per share (Yen)
104.74 350.57 (21.42) 5.36 120.97
Stockholders’ equity ratio (%) 49.8 50.4 46.4 48.0 51.3
Return on stockholders’ equity (%) 2.5 8.4 (0.5) 0.2 2.7
Price earnings ratio (PER) (Times) 59.3 14.0 - 344.2 33.3
Net cash provided by operating activities (Millions of yen)
118,247 101,879 55,334 108,942 127,308
Net cash used in investing activities (Millions of yen)
(105,963) (61,341) (29,898) (90,156) (55,438)
Net cash provided by (used in) financing activities (Millions of yen)
(38,369) (31,860) 12,929 4,395 (56,118)
Cash and cash equivalents at end of term (Millions of yen)
132,984 129,091 167,015 213,687 250,848
Number of employees (Person) 80,590 87,809 79,175 79,863 83,581
Notes: 1. Net sales do not include consumption taxes, etc. 2. Net assets per share, equity ratio and return on equity have been replaced with stockholders’ equity per share, stockholders’ equity ratio
and return on stockholders’ equity because TDK prepared consolidated financial statements based on U.S. GAAP. 3. In accordance with the provisions of the Financial Accounting Standards Board (“FASB”) Accounting Standards Codification (“ASC”) No.
205-20, “Presentation of Financial Statements-Discontinued Operations”, operating results relating to the data tape business and Blu-ray business are separately presented as discontinued operations in consolidated statements of operations for the 118th term. Also reclassifications are made to the consolidated statements of operations for the prior terms to conform to the presentation used for the current term.

(2) Filing company’s management benchmarks (non-consolidated)
Term 114th term 115th term 116th term 117th term 118th term
Accounting period From April 1, 2009 to March 31, 2010
From April 1, 2010 to March 31, 2011
From April 1, 2011 to March 31, 2012
From April 1, 2012 to March 31, 2013
From April 1, 2013 to March 31, 2014
Net sales (Millions of yen) 169,515 106,586 126,769 115,674 92,621
Current income (loss) (Millions of yen) 13,103 12,213 (2,558) (11,658) (12,064)
Net income (loss) (Millions of yen) 4,945 10,630 (8,580) 2,074 19,603
Capital stock (Millions of yen) 32,641 32,641 32,641 32,641 32,641
Total number of issued shares
(Thousands of shares) 129,591 129,591 129,591 129,591 129,591
Net assets (Millions of yen) 358,943 359,097 327,864 320,124 336,543
Total assets (Millions of yen) 659,884 650,028 678,971 711,749 742,758
Net assets per share (Yen) 2,774.67 2,774.05 2,593.15 2,534.28 2,664.93
Cash dividends per share (Yen) 60.00 80.00 80.00 70.00 70.00
[Interim dividends per share]
(Yen) [30.00] [40.00] [40.00] [40.00] [30.00]
Net income (loss) per share
(Yen) 38.34 82.42 (66.65) 16.49 155.82
Diluted net income per share
(Yen) 38.31 82.34 - 16.46 155.56
Equity ratio (%) 54.2 55.1 48.1 44.8 45.1
Return on equity (ROE) (%) 1.4 3.0 (2.5) 0.6 6.0
Price earnings ratio (PER) (Times) 162.2 59.6 - 198.3 27.7
Dividend payout ratio (%) 156.5 97.1 - 424.6 44.9
Number of employees (Person) 3,572 3,405 3,324 3,600 3,652
Notes: 1. The management benchmarks in the above table are based on Japanese Accounting Standards. 2. Net sales do not include consumption taxes, etc. 3. Diluted net income per share in the 116th term is not presented because, although there were potentially dilutive shares, net losses per
share were reported.

2. Description of business operations TDK Corporation prepares its consolidated financial statements according to U.S. generally accepted accounting principles (U.S. GAAP). It discloses information based on these consolidated financial statements pertaining to its subsidiaries and affiliates based on the definitions of U.S. GAAP. The same applies to “II. Review of operations” and “III. Facilities.”
As of March 31, 2014, the TDK Group (“TDK”) is comprised of TDK Corporation (the “Company”), 116 consolidated subsidiaries and 7 equity-method affiliates. Segment categories are manufacturing and sales of “Passive Components,” “Magnetic Application Products,” “Film Application Products” and “Other” (not included in the other three segments).
The following table presents a description of business operations and the respective placement of the Company and subsidiaries and affiliates with respect to these business operations.
Category Main products Major companies
Passive Components
Ceramic capacitors, Aluminum electrolytic capacitors, Film capacitors, Inductive devices (Coils/Ferrite cores/Transformers), High-frequency components, Piezoelectric materials and circuit protection components, and Sensors
The Company TDK-EPC Corporation EPCOS AG TDK Hong Kong Co., Ltd. TDK-MCC Corporation 66 other companies (Domestic: 4, Overseas: 62)
(Total: 71 companies)
Magnetic Application Products
Recording devices, Power supplies, Magnets
The Company SAE Magnetics (H.K.) Ltd. Magnecomp Precision Technology Public Co., Ltd. Headway Technologies, Inc. SAE Magnetics (Dongguan) Ltd. 39 other companies (Domestic: 5, Overseas: 34)
(Total: 44 companies)
Film Application Products
Energy devices (Rechargeable batteries), Applied films (previously Recording media)
The Company Amperex Technology Ltd. 17 other companies (Domestic: 1, Overseas: 16)
(Total: 19 companies)
Other
Mechatronics (production equipment), other
The Company TDK Corporation of America 27 other companies (Domestic: 9, Overseas: 18)
(Total: 29 companies)
Note: The data tape business and the Blu-ray business, both of which were classified as discontinued operations in fiscal 2014, have been included in applied films within Film Application Products.
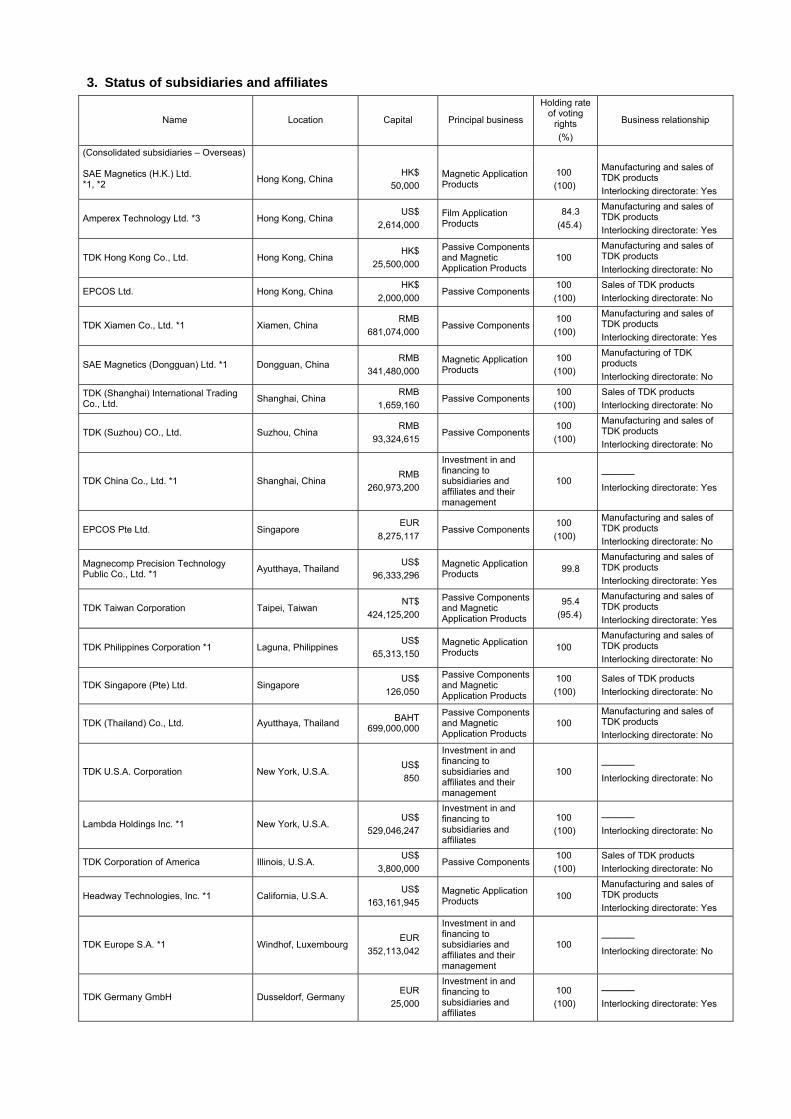
3. Status of subsidiaries and affiliates
Name Location Capital Principal business
Holding rate of voting
rights (%)
Business relationship
(Consolidated subsidiaries – Overseas)
SAE Magnetics (H.K.) Ltd. *1, *2 Hong Kong, China
HK$ 50,000
Magnetic Application Products
100 (100)
Manufacturing and sales of TDK products Interlocking directorate: Yes
Amperex Technology Ltd. *3 Hong Kong, China US$
2,614,000 Film Application Products
84.3 (45.4)
Manufacturing and sales of TDK products Interlocking directorate: Yes
TDK Hong Kong Co., Ltd. Hong Kong, China HK$
25,500,000
Passive Components and Magnetic Application Products
100 Manufacturing and sales of TDK products Interlocking directorate: No
EPCOS Ltd. Hong Kong, China HK$
2,000,000 Passive Components
100 (100)
Sales of TDK products Interlocking directorate: No
TDK Xiamen Co., Ltd. *1 Xiamen, China RMB
681,074,000 Passive Components
100 (100)
Manufacturing and sales of TDK products Interlocking directorate: Yes
SAE Magnetics (Dongguan) Ltd. *1 Dongguan, China RMB
341,480,000 Magnetic Application Products
100 (100)
Manufacturing of TDK products Interlocking directorate: No
TDK (Shanghai) International Trading Co., Ltd. Shanghai, China
RMB 1,659,160
Passive Components100 (100)
Sales of TDK products Interlocking directorate: No
TDK (Suzhou) CO., Ltd. Suzhou, China RMB
93,324,615 Passive Components
100 (100)
Manufacturing and sales of TDK products Interlocking directorate: No
TDK China Co., Ltd. *1 Shanghai, China RMB
260,973,200
Investment in and financing to subsidiaries and affiliates and their management
100 ───── Interlocking directorate: Yes
EPCOS Pte Ltd. Singapore EUR
8,275,117 Passive Components
100 (100)
Manufacturing and sales of TDK products Interlocking directorate: No
Magnecomp Precision Technology Public Co., Ltd. *1 Ayutthaya, Thailand
US$ 96,333,296
Magnetic Application Products 99.8
Manufacturing and sales of TDK products Interlocking directorate: Yes
TDK Taiwan Corporation Taipei, Taiwan NT$
424,125,200
Passive Components and Magnetic Application Products
95.4 (95.4)
Manufacturing and sales of TDK products Interlocking directorate: Yes
TDK Philippines Corporation *1 Laguna, Philippines US$
65,313,150 Magnetic Application Products 100
Manufacturing and sales of TDK products Interlocking directorate: No
TDK Singapore (Pte) Ltd. Singapore US$
126,050
Passive Components and Magnetic Application Products
100 (100)
Sales of TDK products Interlocking directorate: No
TDK (Thailand) Co., Ltd. Ayutthaya, Thailand BAHT 699,000,000
Passive Components and Magnetic Application Products
100 Manufacturing and sales of TDK products Interlocking directorate: No
TDK U.S.A. Corporation New York, U.S.A. US$ 850
Investment in and financing to subsidiaries and affiliates and their management
100 ───── Interlocking directorate: No
Lambda Holdings Inc. *1 New York, U.S.A. US$
529,046,247
Investment in and financing to subsidiaries and affiliates
100 (100)
───── Interlocking directorate: No
TDK Corporation of America Illinois, U.S.A. US$
3,800,000 Passive Components
100 (100)
Sales of TDK products Interlocking directorate: No
Headway Technologies, Inc. *1 California, U.S.A. US$
163,161,945 Magnetic Application Products 100
Manufacturing and sales of TDK products Interlocking directorate: Yes
TDK Europe S.A. *1 Windhof, LuxembourgEUR
352,113,042
Investment in and financing to subsidiaries and affiliates and their management
100 ───── Interlocking directorate: No
TDK Germany GmbH Dusseldorf, Germany EUR
25,000
Investment in and financing to subsidiaries and affiliates
100 (100)
───── Interlocking directorate: Yes

Name Location Capital Principal business
Holding rate of voting
rights (%)
Business relationship
EPCOS AG *1, *4 Munich, Germany EUR
66,682,270 Passive Components
100 (100)
Manufacturing and sales of TDK products Interlocking directorate: No
EPCOS OHG Deutschlandsberg, Austria
EUR 14,500,000
Passive Components100 (100)
Manufacturing and sales of TDK products Interlocking directorate: No
TDK Europe GmbH *1 Dusseldorf, Germany EUR
46,544,000 Passive Components
100 (100)
Sales of TDK products Interlocking directorate: No
EPCOS Electronic Parts Ltd. Szombathely, HungaryEUR
9,670,320 Passive Components
100 (100)
Manufacturing and sales of TDK products Interlocking directorate: No
(Consolidated subsidiaries – Domestic) (Millions of yen)
TDK-EPC Corporation *1 Minato-ku, Tokyo 2,000 Passive Components 100 Manufacturing and sales of TDK products Interlocking directorate: Yes
TDK-MCC Corporation Nikaho City, Akita Prefecture 1,000 Passive Components
100 (100)
Manufacturing of TDK products Interlocking directorate: No
TDK Shonai Corporation Tsuruoka City, Yamagata Prefecture 110
Passive Components and Magnetic Application Products
100 (100)
Manufacturing of TDK products Interlocking directorate: Yes
TDK-Lambda Corporation Minato-ku, Tokyo 2,976 Magnetic Application Products
100 (46.9)
Manufacturing and sales of TDK products Interlocking directorate: Yes
TDK Ugo Corporation Yurihonjo City, Akita Prefecture 106 Passive Components
100 (100)
Manufacturing of TDK products Interlocking directorate: No
Media Technology Corporation *1 Chuo City, Yamanashi Prefecture 5,000 Film Application
Products 70 Manufacturing of TDK products Interlocking directorate: No
TDK Service Corporation Ichikawa City, Chiba Prefecture 34 Insurance and real
estate agency 100
Consignment of insurance agency and property management for TDK Interlocking directorate: Yes
84 other companies (Equity-method affiliates)
Semiconductor Energy Laboratory Co., Ltd.
Atsugi City, Kanagawa Prefecture
(Millions of yen)4,348
Research and development of semiconductor products
30.4 Consignment of research and development Interlocking directorate: No
6 other companies
Notes:1. Descriptions in the “Principal business” column are names of business segments or other specific business activities. 2. Figures in parentheses in the “Holding rate of voting rights” column indicate indirect holding rates included in the figures outside the
parentheses. 3. *1:Applies to specific subsidiaries. 4. *2:Net sales of SAE Magnetics (H.K.) Ltd. exceeded 10% of the consolidated net sales.
The major items of income are as follows: i. Net sales ¥260,637 million ii. Income before income taxes ¥16,428 million iii. Net income ¥15,019 million iv. Net assets ¥183,759 million v. Total assets ¥220,399 million
5. *3:Net sales of Amperex Technology Ltd. exceeded 10% of the consolidated net sales. The major items of income are as follows:
i. Net sales ¥130,287 million ii. Income before income taxes ¥383 million iii. Net loss ¥182 million iv. Net assets ¥35,871 million v. Total assets ¥72,405 million

6. *4: Net sales of EPCOS AG exceeded 10% of the consolidated net sales. The major items of income (International Financial Reporting Standards) are as follows:
i. Net sales ¥184,846 million ii. Loss before income taxes ¥6,133 million iii. Net loss ¥7,520 million iv. Net assets ¥63,568 million v. Total assets ¥216,950 million
4. Status of employees (1) Status of consolidated companies
(As of March 31, 2014) Name of business segment Number of employees (Person)
Passive Components 44,238
Magnetic Application Products 22,372
Film Application Products 13,280
Other 2,081
Corporate (Common) 1,610
Total 83,581
(2) Status of filing company (TDK)
(As of March 31, 2014) Number of employees
(Person) Average age (Years old)
Average years of service (Years)
Average annual salary (Yen)
3,652 43.0 19.9 7,504,523
Name of business segment Number of employees (Person)
Magnetic Application Products 1,341
Film Application Products 260
Other 524
Corporate (Common) 1,527
Total 3,652
Notes: 1.The number of employees indicates the number of working employees.
2.Average annual salary includes bonuses and surplus wages. 3. The number of employees shown as Corporate (Common) is the number of employees who belong to the
administrative departments. (3) Status of labor union
The filing company and some of its subsidiaries have labor unions.

II. Review of operations 1. Overview of operating results (1) Operating results
Looking at the world economy in the consolidated fiscal year ended March 31, 2014 ("fiscal 2014"), the U.S. economy continued to grow, mainly supported by export expansion and firm personal spending. The European economy also saw an end to its recession caused by the sovereign debt problem, and began to show signs of a recovery. In emerging countries such as China and India, the overall picture is one of continuing growth with signs of recovery in exports to advanced countries, although some countries are seeing economic growth decline due to factors such as fiscal tightening to rein in inflation and a slowdown in infrastructure investment.
In Japan, a steady recovery continues, supported by expansion in demand, including growth in corporate earnings jump started by large-scale fiscal easing and the yen's depreciation, strong consumer spending due to a surge in demand ahead of the consumption tax hike, and a pick-up in housing investment activity.
Under these world economic conditions, the electronics market, which has a large bearing on the consolidated performance of TDK, saw production levels differ by finished product. Production of smartphones, for which demand is expanding, was much higher than in fiscal 2013, driven by the launch of new mobile handsets by major manufacturers. Production of tablet devices was much higher year on year. Production in the automobile market as a whole rose year on year, driven mainly by solid auto sales in the U.S. However, PC production was down overall year on year, mainly due to the impact of the growing tablet device market, although there was a slight rise in production due to the impact of a surge in demand ahead of the consumption tax hike in Japan. Production of hard disk drives (HDDs) was lower than the previous fiscal year, when there was temporary demand from the impact of major flooding in Thailand. This large drop in HDD production came despite demand for use in next-generation game consoles and higher demand for PCs spurred by the end of support for Windows XP.
Under these market conditions, TDK posted consolidated net sales of ¥984,525 million, up 16.9% from ¥841,847 million in fiscal 2013. TDK recorded operating income of ¥36,616 million, up 66.0% from ¥22,054 million in fiscal 2013. TDK also posted income from continuing operations before income taxes of ¥39,772 million, up 101.2% from ¥19,765 million in fiscal 2013. Furthermore, TDK recorded net income attributable to TDK of ¥16,288 million, an increase of 13.6 times compared to ¥1,195 million in fiscal 2013. Basic net income attributable to TDK per common share was ¥129.47, compared with ¥9.50 in fiscal 2013.
Note: In fiscal 2014, TDK has shown earnings related to the data tape business and the Blu-ray business as discontinued operations in the consolidated statements of income, in accordance with the provisions of Accounting Standards Codification 205-20, "Presentation of Financial Statements–Discontinued Operations," issued by the U.S. Financial Accounting Standards Board. Consequently, fiscal 2013 figures have been restated to match the presentation in fiscal 2014.
Average exchange rates for the U.S. dollar and euro during fiscal 2013 were ¥100.26 and ¥134.42, respectively, as the yen depreciated 20.8% versus the U.S. dollar and 25.6% against the euro year on year. This increased net sales by approximately ¥147.5 billion and operating income by approximately ¥24.3 billion.
TDK’s business segments are aggregated into three reportable segments, “Passive Components,” “Magnetic Application Products” and “Film Application Products,” and businesses not belonging to either of these segments are classified under “Other.”
The Passive Components segment is made up of: (1) capacitors business; (2) inductive devices business; and (3) other passive components. Segment consolidated net sales were ¥471,673 million, up 24.3% year on year from ¥379,614 million. The segment reported profit of ¥15,449 million, returning to profitability from a loss of ¥11,053 million in the previous fiscal year.
An overview of sales results by business for this segment is provided below.
The capacitors business is made up of ceramic capacitors, aluminum electrolytic capacitors, and film capacitors. Sales in the capacitors business were ¥139,615 million, up 18.3% year on year from ¥117,986 million. Sales of ceramic capacitors increased to the automotive market, and sales of aluminum electrolytic capacitors and film capacitors were higher in both the automotive and industrial equipment markets.
Sales of the inductive devices business increased 17.3% year on year from ¥119,570 million to ¥140,309 million. TDK recorded a strong increase in sales for use in automobiles.
Other passive components include high-frequency devices, piezoelectric material products, circuit protection components, and sensors. Sales of other passive components increased 35.0% year on year from ¥142,058 million to ¥191,749 million. Sales of high-frequency devices increased significantly to the communications equipment market and the home information appliances market. Sales of piezoelectric material products and circuit protection components increased to the communications equipment market and the automotive market. Sensor sales increased to the automotive market.
The Magnetic Application Products segment is made up of: (1) recording devices business; and (2) other magnetic application products. Segment consolidated net sales increased 7.8% year on year from ¥337,947 million to ¥364,291 million. Segment profit decreased 24.2% from ¥37,088 million in the previous fiscal year to ¥28,120 million.
An overview of sales results by business for this segment is provided below.

The recording devices business is comprised mainly of HDD heads and HDD suspension assemblies. It recorded sales of ¥256,703 million, up 9.9% year on year from ¥233,534 million. In HDD heads and HDD suspension assemblies, sales volumes declined due to the absence of temporary demand resulting from the impact of the major flooding in Thailand in the previous fiscal year and lackluster HDD production levels. However, the weaker yen against the U.S. dollar lifted sales in monetary terms.
Other magnetic application products include power supplies and magnets. Sales increased 3.0% year on year from ¥104,413 million to ¥107,588 million. Sales of power supplies increased to the industrial equipment market. On the other hand, sales of magnets decreased to the automotive market, partly due to the impact of lower prices.
The Film Application Products segment includes energy devices (rechargeable batteries) and applied films. Segment consolidated net sales increased 25.7% year on year from ¥102,893 million to ¥129,304 million. Segment profit increased 4.1% from ¥12,824 million in the previous fiscal year to ¥13,352 million.
An overview of sales results by business for this segment is provided below.
Sales of energy devices increased substantially to both the communications equipment market, particularly for smartphone and tablet devices, and the home information appliances market.
The Other segment, businesses which do not belong to any of the three reportable segments, is comprised of mechatronics (production equipment), among others. Net sales for the Other segment decreased 10.0% from the ¥21,393 million recorded in the previous fiscal year to ¥19,257 million, and the segment loss increased from ¥1,775 million to ¥3,196 million in fiscal 2014.
An overview of sales results by region is provided below.
In the Japan region, net sales decreased 11.2% year on year from ¥105,832 million to ¥94,005 million. Net sales for the Magnetic Application Products segment decreased.
In the Americas region, net sales increased 42.1% year on year from ¥58,368 million to ¥82,966 million. Net sales for the Passive Components segment and the Magnetic Application Products segment increased.
In the Europe region, net sales increased 27.3% year on year from ¥109,758 million to ¥139,716 million. Net sales for the Passive Components segment increased.
In the China region, net sales increased 39.3% year on year from ¥353,209 million to ¥491,975 million. Net sales for the Passive Components segment, the Magnetic Application Products segment and the Film Application Products segment all increased.
In the Asia and others region, net sales decreased 18.1% year on year from ¥214,680 million to ¥175,863 million. Net sales for the Magnetic Application Products segment decreased.
As a result, overseas sales increased 21.0% year on year from ¥736,015 million to ¥890,520 million. Overseas sales accounted for 90.5% of consolidated net sales, a 3.1 percentage point increase from 87.4% in fiscal 2013.
From fiscal 2014, the method of aggregating net sales by region has been partially changed. The figures for the previous fiscal year have therefore been restated accordingly.
(2) Cash flows An overview of cash flows is provided below.
Cash flows from operating activities
Operating activities provided net cash of ¥127,308 million, a year-on-year increase of ¥18,366 million. TDK recorded net income of ¥18,234 million, an increase of ¥13,704 year on year. Depreciation and amortization increased ¥5,171 million to ¥83,109 million. In changes in assets and liabilities, trade payables increased ¥18,881 million and trade receivables increased ¥10,138 million.
Cash flows from investing activities
Investing activities used net cash of ¥55,438 million, ¥34,718 million less year on year. There was a ¥17,000 million decrease in capital expenditures, mainly in the Magnetic Application Products segment, and a ¥9,481 million increase in proceeds from sale and maturity of short-term investments. On the other hand, there was a ¥5,736 million increase in payment for short-term investments.
Cash flows from financing activities
In fiscal 2014, financing activities used net cash, compared with providing net cash in fiscal 2013. The net change year on year was ¥60,513 million. In fiscal 2013 there were repayments of long-term debt of ¥37,710 million and proceeds from long-term debt of ¥40,416 million, which along with other financing activities provided net cash of ¥4,395 million. In fiscal 2014, proceeds from long-term debt were ¥33,747 million. On the other hand, there were repayments of long-term debt of ¥51,867 million, a net change in short-term debt of ¥16,634 million and acquisition of noncontrolling interests of ¥13,981 million. As a result of these and other factors, financing activities used net cash of ¥56,118 million.
As a result of adding in the effects of currency fluctuations, cash and cash equivalents at the end of fiscal 2014 was ¥250,848 million, ¥37,161 million higher than at the end of fiscal 2013.

2. Status of production, orders received and sales (1) Production results
A breakdown of production results by business segment for fiscal 2014 is given below.
(Millions of yen)
Name of business segment Production Results YoY Increase/ Decrease (%)
Passive Components 477,408 24.6
Magnetic Application Products 364,799 8.0
Film Application Products 126,996 18.2
Other 18,774 0.1
Total 987,977 16.6 Notes: 1. Amounts are calculated by the sales price.
2. Consumption taxes, etc. are not included in the above figures. 3. Figures for discontinued operations have been excluded. Consequently, in the calculation of comparisons with fiscal 2013,
figures for fiscal 2013 have been restated to match the presentation in fiscal 2014. (2) Status of orders received
A breakdown of orders received by business segment for fiscal 2014 is given below.
(Millions of yen)
Name of business segment
Amount of orders received
(Millions of yen)
YoY Increase/ Decrease (%)
Balance of orders received
(Millions of yen)
YoY Increase/ Decrease (%)
Passive Components 487,762 24.1 91,607 13.6
Magnetic Application Products 360,731 9.1 34,832 2.6
Film Application Products 156,285 30.6 20,474 (12.2)
Other 15,820 (1.1) 1,505 11.7
Total 1,020,598 18.7 148,418 6.6 Notes: 1. Amounts are calculated by the sales price. 2. Figures for discontinued operations have been excluded. Consequently, in the calculation of comparisons and
year-on-year comparisons with fiscal 2013, figures for fiscal 2013 have been restated to match the presentation in fiscal 2014.
(3) Sales results
A breakdown of sales results by business segment for fiscal 2014 is given below.
(Millions of yen)
Name of business segment Sales Results YoY Increase/ Decrease (%)
Passive Components 471,673 24.3
Magnetic Application Products 364,291 7.8
Film Application Products 129,304 25.7
Other 19,257 (10.0)
Total 984,525 16.9
Notes: 1. Consumption taxes, etc. are not included in the above figures. 2. Figures for discontinued operations have been excluded. Consequently, in the calculation of comparisons with fiscal 2013,
figures for fiscal 2013 have been restated to match the presentation in fiscal 2014.

3. Pressing issues TDK was founded in 1935 to commercialize the magnetic material called ferrite. Inspired by its founding spirit, “Contribute to culture and industry through creativity,” TDK has dynamically grown with its creativity and its ability to adapt speedily to various changes over the ensuing years.
In the global economy, some emerging countries saw lower economic growth rates surface, but there were also signs of a rebound, mainly in the U.S. economy, which showed signs of a gradual recovery centered on private-sector demand. Under these global economic circumstances, in the electronics market, production of smartphones and tablet devices rose sharply year on year. At the same time, production in the automobile market as a whole also rose, accompanying expanding demand in the U.S.
In the smartphone market, diffusion of smartphones is accelerating in emerging countries due to the introduction of low-priced models by Chinese manufacturers, and the demand for electronic components is noticeably increasing due to enhanced communication features. Looking at the HDD market, changes are occurring in TDK's operating environment. Demand for HDDs for PCs is waning in line with the greater uptake of cloud computing services and the drastic increase in communication data capacity. On the other hand, there is higher demand for highly reliable HDDs for use in data centers.
Following the consolidation of production sites in both Japan and overseas, in the fiscal year under review TDK completed its withdrawal from the data tape business and the Blu-ray business, thereby achieving one step in a series of large-scale restructuring measures. The fiscal year ending March 31, 2015 is the final year of the three-year medium-term management plan that started in the fiscal year ended March 31, 2013, and TDK will further accelerate its shift to a growth strategy. In the next-generation information and communications market and the energy-related market, TDK will strengthen initiatives for the automobile market, in which demand for electronic components is growing due to the increasing use of onboard electronics, and for the healthcare market, in which significant growth is anticipated.
In strengthening its initiatives in these markets, TDK has positioned the following as Priority Five Businesses: 1) Inductive Devices, 2) High Frequency Components, 3) Piezoelectric Material Products and Circuit Protection Components, 4) HDD Heads, and 5) Rechargeable Batteries. By concentrating management resources on these markets, TDK aims to raise earnings in the Passive Components, Magnetic Application Products, and Film Application Products segments and to shift to a balanced profit structure.
Moreover, to successfully implement TDK's growth strategy, it is essential to grasp market needs in a timely manner and to deliver value that can be recognized by customers grounded in manufacturing capabilities that emphasize product quality. Looking ahead, TDK will establish a sales system tied closely to key markets and customers. At the same time, TDK will make use of core technologies across the Group in order to implement speedy development activities as a group and to rebuild its manufacturing framework with an emphasis on product quality.
In reinforcing its businesses, TDK will also take into account the environment. Under TDK Environmental Action 2020, the Group's medium- to long-term plan for environmental activities, the Group will supply products that meet customer demands and that respond to social concerns such as energy conservation, legal and regulatory compliance, and safety, and also continue to reduce the environmental impact of its business activities by cutting CO2 emissions and other measures.
As a corporate citizen, the Group is also always aware of the importance of prospering together with society. Consequently, TDK will seek to strengthen its corporate governance by contributing to environmental conservation and through compliance with relevant laws and regulations in Japan and overseas.

4. Business risks Listed below are items that, among those relating to the review of operations and accounting, etc. stated in the Annual Securities Report, may significantly influence investor decisions. The following includes forward-looking statements based on judgments current as of the filing date of the Annual Securities Report on June 27, 2014.
(1) Risks concerning changes in economic trends The electronics industry, TDK’s field of operations, is highly susceptible to economic trends in the U.S., Europe, Asia, particularly China, and Japan, which are the main markets for end products. In addition, markets in these countries and regions are constantly exposed to various risk factors such as international issues and economic fluctuations. TDK monitors world economic trends and takes timely measures in response to them. However, if changes beyond our expectations occur in such business environments, such changes could significantly affect business results.
(2) Risks concerning fluctuations in currency exchange TDK conducts business activities globally. Indeed, more than 90% of net sales are accounted for by overseas sales, and many transactions are conducted in currencies other than the yen, such as the U.S. dollar or euro. A sudden appreciation of the yen against these currencies could affect earnings such as by reducing net sales and operating income. In order to mitigate these risks, TDK is working to purchase more raw materials in foreign currencies and increase the local procurement of supplies consumed overseas. Foreign currency fluctuations also give rise to conversion differences with respect to our investments in overseas assets and liabilities, which are converted into Japanese yen in our consolidated financial statements. Measures are taken against fluctuations in foreign currency exchange rates, including procuring foreign currency-denominated funds and concluding forward foreign exchange contracts; however, significant fluctuations in foreign currency exchange rates beyond our expectations could have a significant adverse effect on TDK's financial position and business results.
(3) Risks concerning overseas operations
TDK conducts operations globally and selects the most suitable locations in terms of market, product lineup, logistics and other standpoints. Overseas sales account for more than 90% of total sales on a consolidated basis.
In many of our target markets and emerging countries that are expected to see economic development going forward, TDK may be exposed to international political risks such as war, terrorism or other events, economic risks such as fluctuations in currency exchange or trade imbalance, and social risks including labor problems stemming from differences in cultures and customs, and diseases. Such risks may give rise to changes of a far greater magnitude than we anticipate. There may be unknown risks in building relationships with trading partners due to differences in commercial and business customs. If these risks materialize, they could reduce or halt manufacturing activities, force the stagnation of sales activities and in turn have a significant adverse effect on business results.
In particular, TDK has many manufacturing bases in China, which is a country in the midst of strong economic growth, and has established a system for supplying both customers and local companies that have been setting up operations in China. If unexpected events occur in China due to political factors (such as changes in laws and regulations), economic factors (such as the continuity of high growth and status of infrastructure development such as electric power supply) or social environment, there could be a significant effect on business results.
(4) Risks concerning price competition
TDK supplies electronic components in a broad range of fields in an electronics industry where competition is intensifying. These fields include next-generation information technology represented by fast-growing smartphones and tablet devices, the automobiles field, where use of onboard electronics is increasing, and energy related fields such as solar and wind power generation. Price is one of the main competitive factors differentiating us from other companies in the industry in which leading Japanese companies and Asian companies in South Korea, Taiwan and China have fueled intense price competition.
TDK is working to promote ongoing cost-cutting initiatives and increase profitability to counter this market competition. However, as downward pressure from the market on prices continues to intensify, in the event that the fall in prices far exceeds our expectations or becomes protracted, there could be a significant effect on business results.
(5) Risks concerning technological innovation and new product development
In TDK, the launch of new products imbuing value on a timely basis helps boost our profitability. We also believe ongoing new product development is key to our survival. The Group believes that our ability to increase sales by developing appealing, innovative products has an important role to play in our growth. We are therefore engaged in new product development as an important element of our management strategies. However, it is extremely

difficult to predict future demand in the rapidly changing electronics industry. TDK may fail to continue to develop and supply in a timely manner attractive, new products with innovative technologies for this industry and our markets. As one strategy to avoid these risks, the development divisions in TDK conduct development management to promote the prioritization of development themes. Nevertheless, there is a risk that a loss of sales opportunities could result in the loss of future markets, as well as existing markets. This may have a significant adverse effect on business results and growth prospects.
(6) Risks concerning product quality
TDK conducts quality control of various products at domestic and overseas manufacturing bases in accordance with ISO (International Organization for Standardization) quality management standards (ISO 9001) and the strict standards required by customers in the remarkably technologically innovative electronics industry. Furthermore, TDK utilizes proprietary quality technologies and past data concerning quality issues to create a quality assurance system for building in quality from the earliest development stage, so as to ensure that reliability and safety stand up to normal product use. This is achieved through design inspections, internal quality audits, supplier surveys and guidance, process management and in other ways at each product stage including planning, design, prototyping and manufacturing.
However, TDK cannot be fully certain that defects in quality (including cases where products contained restricted substances) and recalls due to those defects will not occur. Should a recall or a product liability claim against us occur, it could result in recall costs or damage claims and lower sales. Furthermore, it is assumed that a defect in quality in one of TDK’s name-bearing products would have a negative impact on our reputation and brand, and endanger the continued existence of the company. In such a way, a major quality problem could have a significant effect on business results.
(7) Risks concerning intellectual property
TDK is working hard to strengthen and use its patent portfolio by managing and acquiring patents, licenses and other intellectual property rights covering TDK’s products’ functions, designs and so forth (hereinafter “intellectual property rights”), as a strategic intellectual property activity that contributes to business earnings.
However, there are cases where our intellectual property rights cannot be fully protected in a particular region for reasons unique to that region. We may suffer damages resulting from the manufacture by a third party of similar products to our own with the unauthorized use of our intellectual property rights.
There may be cases where it is alleged that our products infringe on the intellectual property rights of third parties that may sue for damages as a result of such alleged infringement. This would require either legal processes or settlement negotiations. If our defenses against such claims are not accepted in such disputes, we may have to pay damages and royalties and suffer losses such as the loss of markets.
Significant disputes over intellectual property rights could have a significant effect on business development and business results.
(8) Risks concerning securing personnel and training personnel
TDK generates a high percentage of total sales overseas and overseas production also accounts for a high proportion of production. Furthermore, in recent years, we have accelerated the overseas relocation of design and production bases, and at the same time increased the number of employees globally as TDK Group companies have increased rapidly. In order to continuously develop business in the fast-changing electronics industry, we believe that we must continuously promote efforts to secure and develop personnel who possess various advanced technical skills, and personnel with excellent management capabilities, such as those necessary for formulating strategy and managing organizations.
TDK therefore actively hires university graduates and employs experienced people throughout the year in order to continuously develop its businesses. Moreover, we are working to retain and develop employees by putting in place frameworks for increasing their motivation. This includes enhancing fair evaluation and remuneration systems based on a target-based management system, improving and extending various training programs for developing employees that can act independently and globally, and passing on the “DNA” of our manufacturing.
However, competition to continuously recruit the necessary employees is intense. Moreover, in Japan, the employment environment is changing rapidly because of the falling birthrate, the aging population, and the declining workforce. A similar change is occurring at our overseas bases in China and other countries. The inability to recruit and train personnel as planned could have a significant effect on business development, business results and growth prospects from a long-term perspective.

(9) Risks concerning raw material procurement
TDK’s manufacturing system is premised on securing raw materials and other supplies in adequate quality and quantity in a timely manner from multiple external suppliers. However, for major raw materials, we may rely on a limited number of difficult-to-replace suppliers. Because of this, there may be cases where supplies of raw materials and other products to us are interrupted by a disaster, an accident or some other event at a supplier, supply is suspended due to quality or other issues, or there is a shortage of supply due to a rapid increase in demand for finished products. Moreover, there may be cases where local procurement necessitated by increased overseas production is affected by overseas circumstances. If any of these situations becomes protracted, it could have a significant, adverse effect on production and prevent us from fulfilling our responsibilities to supply products to our customers. If the supply-demand balance in the market is disrupted, it may considerably increase costs of manufacturing through steep run-ups in the prices we pay for raw materials and rises in fuel prices, including oil. We are implementing various measures to counter these risks, such as reviewing our suppliers on a timely basis. However, in cases where the situation is beyond our expectations, there could be a significant effect on business results.
(10) Risks concerning government regulations
TDK is subject to and required to comply with various regulations in Japan and other countries where we conduct business. These include approval for conducting business and making investments, the safety of electric and electronic products, national security between nations, and export/import-related, as well as commercial, antitrust, patent, product liability, environmental, consumer and taxation laws and regulations.
In the event that laws and regulations become more stringent in the future and our business development is significantly affected, we may incur various additional operating costs, and if we are unable to respond appropriately to these laws and regulations, we may be forced to partially withdraw from certain businesses or take other actions.
In this way, the strengthening of government laws and regulations in their various forms could have a significant adverse effect on business results.
(11) Risks concerning interest rate fluctuation
TDK has financial assets and liabilities that are exposed to the risk of interest rate fluctuation. Fluctuations in interest rates beyond our expectations could affect the interest income, interest expense and the value of financial assets, which could have a significant effect on TDK’s financial position and business results.
(12) Risks concerning business-to-business transactions
TDK is developing business-to-business transactions on a global scale, whereby we supply electronic components to customers in the electronics and automotive markets.
We work to reduce risk by conducting transactions with a variety of customers and take measures such as setting transactions terms and conditions based on our evaluation of a customer’s credit risk. However, our business may be significantly affected by various factors that are beyond our control, such as changes in each customer’s business results and management strategies. In addition, a decline in purchasing demand due to a customer`s poor business results, increase discounting pressure from customers due to changes in their purchasing policies and policies, the unexpected termination of contracts or other occurrences could result in excess inventory or a reduction in profit margins.
In the event that our customers go through reorganizations caused by mergers and acquisitions effected by enterprises of different business types or by competitors domestically or abroad, this situation could have a significant effect on TDK’s sales, including a marked decline in orders or the cancellation of all business transactions.
(13) Risks concerning natural disasters, electricity supply and pandemics
TDK has many production factories and research and development facilities in Japan and overseas. These facilities and plants have taken disaster-protection and infection-control measures and purchased their own power generation facilities to cope with electricity shortages in preparation for unexpected natural disasters and infection outbreaks. However, significant damage could be incurred at these facilities and plants due to a force majeure event beyond business continuity planning (BCP) assumptions, such as a large earthquake, tsunami, typhoon, flood or volcanic eruption; a large-scale blackout caused by a disaster or electricity shortages; or an outbreak of an unknown infectious disease such as a new strain of influenza. In the event of interruption to manufacturing, disruption of transportation routes, damage to or disconnection of information and communications infrastructure, impairment of central functions, or significant damage to our customers themselves due to the impact of such an occurrence, orders and supply could be affected for a long period of time. This situation could have a significant effect on business results.

(14) Risks concerning environmental regulations
With respect to specified hazardous chemical substances used in products, TDK is subject to various environmental laws and regulations with respect to industrial waste and emissions into the atmosphere and water from our production processes in Japan and overseas. Furthermore, from the perspective of global environmental conservation, as environmental regulations become more stringent in the future, our cost of compliance with such regulations could increase.
TDK has complied with environmental regulations prescribed by law and is engaged in a wide range of environmental conservation activities. If a situation occurs where we are forced to withdraw from certain business activities when the adoption of such laws and regulations exceeds our ability to respond or social trust in TDK is lost due to our delay in responding to such adoption, it could have a significant effect on business results.
(15) Risks concerning M&A
TDK basically believes that the necessary technologies and other elements for continuously increasing corporate value in the increasingly competitive electronics field should be cultivated internally. However, we conduct M&As as necessary if it is an effective means to accelerate business growth or major synergies can be expected in terms of establishing a competitive edge in the market in a short space of time.
When conducting M&As, we take sufficiently into account market trends, customer needs, the business results, financial position, technological advantage and market competitiveness of the target company, TDK’s business portfolio and other factors.
However, if there are tumultuous changes in the market and competitive environment, the acquired business fails to develop as planned, the investment cannot be recovered or additional expenses are incurred, TDK’s business results, growth prospects and business development among others could be significantly affected.
(16) Risks concerning information security
As part of its business operations, TDK holds confidential information and personal information relating to customers and trading partners as well as confidential information of the Group and personal information. We have constructed a group-wide control system to prevent this information from being leaked to outside parties, falsified or otherwise manipulated. Moreover, we execute measures to ensure thorough management and IT security, improved facility security and employee training. However, there is still a risk that such information could be leaked or falsified through negligence, theft, hacking or other causes.
In such an event, TDK could suffer a lowering of credibility and be liable for huge costs relating to the compensation payment to the parties suffering damage. It could also have a significant effect on business results.
5. Important operational contracts, etc. No items to report
6. Research and development activities In its R&D activities, TDK continues to work on strengthening and expanding development of new products that respond to diversification in the electronics field. In particular, the Group is concentrating on next-generation recording-related products, microelectronics modules for mobile communications-related applications, and energy-efficient, environmentally friendly devices for use in vehicles or next-generation infrastructure based on materials and design technologies. Furthermore, the Group is using its reservoir of technologies to conduct efficient R&D activities concentrating on the next-generation information and communications market, and the energy-related market.
In the Passive Components field, TDK has developed next-generation multilayer ceramic chip capacitors and inductors, commercialized EMC components such as EMC filters, composite magnetic sheet “Flexield,” and electromagnetic absorbers for anechoic chambers, and increased the functionality of radio wave anechoic chamber testing facilities. Moreover, TDK is strengthening its lineup of modules, including high-frequency modules.
In the Magnetic Application Products field, TDK is developing rare earth-free magnets, next-generation ferrite magnets and high recording density next-generation heads, and strengthening the development of devices for hybrid and electric vehicles. In particular, TDK has devoted efforts to the reduction of the amount of rare earth elements in the magnet and the development of magnets that do not contain rare earth elements. Through these efforts, TDK aims to develop highly efficient power supplies appropriate to the societal trend towards low energy consumption in the wake of the Great East Japan Earthquake, and to avoid sales price rises caused by soaring prices of raw materials for rare earth elements due to complications in the international situation.
In the Applied Film Products field, TDK is developing materials for next-generation lithium batteries and new functional films.

For TDK R&D framework, the Advanced Technology Development Center, of the corporate R&D center within the Technology HQ, develops advanced materials and process technologies, as well as new devices. Meanwhile, the technology development functions of each Business Group promote the development of new products and technologies in their respective areas of responsibility.
In terms of overseas R&D activities, TDK is advancing R&D activities through collaboration with leading universities in the U.S. and Europe, and overseas R&D subsidiaries are escalating their use of local technological resources. In China, where TDK is aiming to establish and develop an operating base, R&D activities are being carried out in the area of electronic components and materials. In addition, consolidated subsidiary Headway Technologies, Inc. is developing next-generation heads for HDD.
R&D expenses in fiscal 2014 increased 18.4% year on year to ¥63,385 million, 6.4% of net sales.

7. Analysis of financial position, operating results and cash flow position The forward looking statements in this report are based on judgment current as of the end of fiscal 2013.
(1) Significant accounting policies Significant accounting policies are those that require management’s most difficult, subjective or complex judgments, often as a result of the need to make estimates about the effect of matters that are inherently uncertain.
The following is not intended to be a comprehensive list of all of TDK’s accounting policies. TDK’s significant accounting policies are more fully described in Note 1 of the Notes to Consolidated Financial Statements. In many cases, the accounting treatment of a particular transaction is specifically dictated by U.S. generally accepted accounting principles, with no need for management’s judgment in their application. There are also areas in which management’s judgment in selecting an available alternative would not produce a materially different result.
TDK has identified the following as critical accounting policies: impairment of long-lived assets, valuation of inventories, accounting for business combinations, goodwill and other intangible assets, pension benefit costs, and deferred tax assets.
Impairment of long-lived assets
As of March 31, 2014 and 2013, the aggregate of TDK’s property, plant and equipment and amortized intangible assets was ¥420,787 million and ¥416,631 million, which accounted for 33.9% and 35.6% of total assets, respectively. TDK believes that impairment of long-lived assets is critical to TDK’s financial statements because the recoverability of the amounts or lack thereof, could significantly affect its results of operations.
TDK’s long-lived assets and certain identifiable intangibles with certain amortization periods are reviewed for impairment when events or changes in circumstances indicate that the carrying amount of an asset may not be recoverable. This review is performed using estimates of future cash flows. If the carrying amount of the asset is considered to be impaired, an impairment charge is recorded for the amount by which the carrying value of an asset exceeds its fair value. Management believes that the estimates of future cash flows and fair values are reasonable; however, changes in estimates resulting in lower future cash flows and fair value due to unforeseen changes in business assumptions could negatively affect the valuation of those long-lived assets and significantly affect TDK’s financial position and results of operations. TDK makes investments with due prudence, taking sufficiently into consideration the future profitability of products and the recoverability of investments.
Valuation of inventories
Inventories are stated at the lower of cost or market. The carrying value of inventory is reduced for estimated obsolescence by the difference between its cost and the estimated market value based upon assumptions about future demand. TDK evaluates the inventory carrying value for potential excess and obsolete inventory exposures by analyzing historical and anticipated demand. In addition, known and anticipated engineering change orders are evaluated against on-hand quantities for their potential obsolescence affects. As fluctuations in estimates, which become a standard in recognizing adjustments in the carrying values of inventory for expected obsolescence, are influential to business results of TDK, we conclude it as a significant accounting policy. If actual demand were to be substantially lower than estimated, additional inventory adjustments for excess or obsolete inventory may be required, which could have a material adverse effect on TDK’s business, financial condition and results of operations.
Regarding the appropriateness of estimates in the past, TDK does not use a method based on various scenarios, but a method to reconsider every quarter by comparing estimate and actual results. For example, in the operational management of product sectors with rapid development in technological innovation such as the recording devices sector, TDK revises the estimates of valuation of obsolete inventories arising from the timely response to customers’ demands for high-efficiency products on a quarterly basis.
Business combination
We account for acquired businesses by using the acquisition method of accounting which requires that the assets acquired and liabilities assumed be recorded at the date of acquisition at their respective fair values. The judgments made in determining the estimated fair value assigned to each class of assets acquired, as well as asset lives, can materially impact net income of the periods subsequent to the acquisition through depreciation and amortization, and in certain instances by impairment charges, if the asset becomes impaired in the future.
In determining the estimated fair value for intangible assets, we typically utilize the income approach, which employs discounting of the projected future net cash flow using an appropriate discount rate that reflects the risk factors associated with the cash flow streams.
Determining the useful life of an intangible asset also requires judgment as different types of intangible assets will have different useful lives and certain assets may even be considered to have indefinite useful lives. Intangible assets determined to have an indefinite useful life have been reassessed periodically based on the factors prescribed in FASB Accounting Standards Codification 350 including, but not limited to, the expected use of the asset by us, legal or contractual provisions that may affect the useful life or renewal or extension of the asset’s contractual life without substantial cost, and the effects of demand, competition and other economic factors.

Goodwill and other intangible assets
Goodwill and other intangible assets that are determined to have an indefinite life are not amortized but are tested for impairment on an annual basis and between annual tests if an event occurs or circumstances change that would more likely than not reduce the fair value of these assets below their carrying amount. Fair value for these assets is determined using a discounted cash flow analysis, which is based on an authorized business plan. Management believes that the estimates of future cash flows and fair value are reasonable; however, changes in estimates resulting in lower future cash flows and fair value due to unforeseen changes in business assumptions could negatively affect the valuations.
Pension benefit costs
Employee pension benefit costs and obligations are dependent on assumptions used by actuaries in calculating such amounts. These assumptions include discount rates, retirement rates and mortality rates which are based upon current statistical data, as well as salary growth, long-term return on plan assets and other factors. Actual results that differ from the assumptions are accumulated and amortized over future periods and, therefore, generally affect TDK’s recognized expense and recorded obligation in future periods. While TDK believes that its assumptions used are appropriate, differences in actual experience or changes in assumptions may affect TDK’s benefit obligations and future expense.
In preparing its financial statements for fiscal 2014, TDK established discount rates of 1.6% and 3.7% for domestic and overseas pension plans, respectively, and expected long-term rates of return of 2.2% and 5.9% on domestic and overseas plan assets, respectively. In estimating the discount rate, TDK uses available information about rates of return on long-term corporate bonds currently available and expected to be available during the period to the maturity of the pension benefits. TDK established the expected long-term rate of return on plan assets based on management’s expectations in respect of the long-term returns of the various plan asset categories in which it invests. Management developed expectations with respect to each plan asset category based on actual historical returns and its current expectations for future returns.
A decrease in the discount rate leads to an increase in actuarial pension benefit obligations that could lead to an increase in net periodic pension cost through amortization of unrecognized actuarial gain or losses.
An increase in the expected return on plan assets may decrease net periodic pension cost in the current year. However, the difference between the expected return and the actual return on those assets could negatively affect net income in future years.
Deferred tax assets
TDK has significant deferred tax assets, which are subject to realizability assessment. In assessing the realizability of deferred tax assets, TDK considers whether it is more likely than not that some portion or all of the deferred tax assets will not be realized. The ultimate realization of deferred tax assets is dependent upon the generation of future taxable income during the periods in which those temporary differences become deductible. TDK considers the planned reversal of deferred tax liabilities, projected future taxable income, and tax planning strategies in making this assessment. Based upon the level of historical taxable income and projections for future taxable income over the periods in which the deferred tax assets are deductible, TDK believes that it is more likely than not that all of the deferred tax assets less valuation allowance, will be realized. However, in the event future projections for income are not realized or are realized in lesser amounts, or in cases where TDK revises the assessment of the potential for realization of deferred tax assets based on other factors, deferred tax assets may be determined not to be realizable, which then would require TDK to increase a valuation allowance against the deferred tax assets resulting in additional income tax expenses.
(2) Analysis of business results for the fiscal year
Overview of consolidated operating results
In fiscal 2014, TDK posted consolidated net sales of ¥984,525 million, up 16.9% from fiscal 2013. TDK recorded operating income of ¥36,616 million, an increase of 66.0% year on year. TDK recorded net income attributable to TDK of ¥16,288 million, an increase of 13.6 times compared to fiscal 2013.
As already mentioned in this report, operating results relating to the data tape business and Blu-ray business are separately presented as discontinued operations in consolidated statements of operations for fiscal 2014, and the figures of fiscal 2013 have been restated to match the presentation in fiscal 2014.
The electronics market, which has a large bearing on the consolidated performance of TDK, saw production levels differ by finished product. Production of smartphones, for which demand is expanding, was much higher than in fiscal 2013, driven by the launch of new mobile handsets by major manufacturers. Production of tablet devices, for which demand is also expanding, was much higher year on year. Production in the automobile market as a whole rose year on year, driven mainly by solid auto sales in the U.S. However, PC production was down overall year on year, mainly due to the impact of the growing tablet device market, although there was a slight rise in production due to the impact of a surge in demand ahead of the consumption tax hike in Japan. Production of hard disk drives (HDDs) was lower than the previous fiscal year, when there was temporary demand from the impact of major

flooding in Thailand. This large drop in HDD production came despite demand for use in next-generation game consoles and higher demand for PCs spurred by the end of support for Windows XP.
As a result, orders increased for the automotive market and the information and communications technology (ICT) markets, mainly smartphones and tablet devices. Meanwhile in HDD heads and HDD suspension assemblies, the weaker yen against the U.S. dollar lifted sales in monetary terms although sales volumes declined due to the absence of the temporary demand resulting from the impact of the major flooding in Thailand in the previous fiscal year and lackluster HDD production levels.
Amid this business environment, we worked to promote further improvements in profitability. In addition to the structural reforms focused on passive components that we conducted in fiscal 2013, we took further steps in fiscal 2014 to establish a strong business base for growth. These included completing our initiative to optimize the business portfolio by withdrawing from the non-core data tape and Blu-ray businesses, and conducting a thorough revision of our cost structure including by integrating bases worldwide to optimize production sites.
Effect of foreign exchange fluctuations
In fiscal 2014, overseas sales accounted for 90.5% of consolidated net sales, an increase of 3.1 percentage points compared to fiscal 2013. During fiscal 2014, the yen’s value depreciated 20.8% versus the U.S. dollar, and 25.6% versus the euro, based on average exchange rates in markets. Overall, exchange rate fluctuations had the effect of increasing net sales by approximately ¥147.5 billion and operating income by approximately ¥24.3 billion in fiscal 2014.
By geographic area based on the location of TDK entities, foreign exchange fluctuations increased sales in Japan by approximately ¥29.9 billion, in Asia (excluding Japan) and Oceania by approximately ¥139.9 billion, in the Americas by approximately ¥14.7 billion, and in Europe by approximately ¥51.9 billion. The effect of foreign exchange fluctuations on consolidated net sales after the elimination of intersegment transactions between and among TDK Corporation and its consolidated subsidiaries was an approximate ¥147.5 billion increase.
As one method for reducing the impact of exchange rate fluctuation, TDK is increasing the share of business activities conducted overseas. Such overseas activities comprise not only manufacturing and sales but also R&D, design and procurement. The ratio of in-region production to in-region sales in fiscal 2014 was 101.4% in Asia (excluding Japan) and Oceania, 83.1% in the Americas and 79.8% in Europe. The ratio of overseas production to net sales increased from 81.8% in fiscal 2013 to 86.7% in fiscal 2014. The ratio of overseas production to overseas sales increased from 93.3% in fiscal 2013 to 95.8% in fiscal 2014.
TDK Corporation and certain overseas consolidated subsidiaries hedge exposure to foreign exchange fluctuations by entering into forward foreign exchange contracts and currency swap contracts. Foreign exchange risk arising from operating activities is hedged by using forward foreign exchange contracts. In principle, TDK’s policy is to hedge up to 50% of expected foreign currency-denominated accounts receivable for the next six months to follow. Due to the global nature of its operations, management realizes that currency fluctuations continue to have the potential to exert a material influence on consolidated performance.
Cost and net income
The cost of sales increased 14.3% to ¥7,636 billion in fiscal 2014 from ¥668.3 billion in fiscal 2013 due primarily to higher sales; however, the cost of sales ratio decreased 1.8 percentage points from 79.4% to 77.6% of net sales. Despite cost increases driven by higher labor costs in China and other emerging markets, and strong pressure for price discounts on products, the cost of sales ratio decreased due to contributions from improvements in productivity and discounts on the cost of raw materials, lower costs due to the effect of structural reforms, improvements to the product mix from terminating unprofitable product lines, and an increase in sales volumes. As a result, gross profit increased ¥47.4 billion (27.3%) year on year in fiscal 2014. The gross profit ratio was 22.4%.
Selling, general and administrative expenses increased by ¥32.8 billion from ¥151.5 billion in fiscal 2013 to ¥184.3 billion in fiscal 2014. Moreover, the ratio to net sales increased from 18.0% to 18.7%. The main factors in the increase in expenses include an increase of ¥23.9 billion due to the effects of an upturn in currency translation adjustments as a result of the yen’s depreciation and a significant decrease in insurance payouts for Thailand flood damage in fiscal 2012. Research and development expenses included in selling, general and administrative expenses for the fiscal year under review climbed 18.4% from ¥53.5 billion in the previous fiscal year to ¥63.4 billion. The change was mainly due to a ¥6.6 billion increase in expenses due to the effect of currency translation adjustments as a result of the yen’s depreciation. Efforts to improve development efficiency through the selection of development themes kept the ratio to net sales on par with the previous year at 6.4%.
Other income (deductions) improved ¥5.4 billion from fiscal 2013. Equity in earnings of affiliates improved by ¥3.8 billion from fiscal 2013, while net loss (gain) on securities improved ¥2.9 billion.
Net income attributable to noncontrolling interests was ¥1.9 billion, a decrease of ¥1.4 billion from ¥3.3 billion in fiscal 2013. This increase was mainly attributable to an increase in fiscal 2013 in the loss attributable to noncontrolling interests of a subsidiary associated with the withdrawal from the data tape business.
TDK posted net income attributable to TDK of ¥16.3 billion, resulting in diluted net income attributable to TDK per common share of ¥120.97. Return on equity improved from negative 0.2% to 2.7%.

Cash dividends per share paid during fiscal 2014 was ¥60. This dividend was the sum of the year-end dividend of ¥30 paid out in June 2013 and the interim dividend of ¥30 paid out in December 2013. Shareholders recorded in the shareholders’ registry as of March 31, 2014, will receive a cash dividend of ¥40 per share on June 30, 2014
(3) Financial position Total assets amounted to ¥1,239.6 billion as of March 31, 2014, a ¥70.0 billion increase from ¥1,169.6 billion at the end of fiscal 2013.
Liquidity increased ¥35.1 billion, with cash and cash equivalents increasing by ¥37.1 billion, while short-term investments decreased by ¥1.1 billion and marketable securities decreased by ¥0.9 billion. Net trade receivables increased ¥16.4 billion due to higher sales, and property, plant and equipment increased ¥8.16 billion.
Total liabilities decreased by ¥1.7 billion from ¥589.0 billion at March 31, 2013 to ¥587.3 billion at March 31, 2014.
Short-term debt and current installments of long-term debt together declined by ¥14.4 billion, while trade payables increased ¥10.7 billion, accrued salaries and wages increased ¥5.5 billion, and accrued expenses increased ¥4.5 billion.
Total TDK stockholders’ equity within net assets increased by ¥74.1 billion from ¥561.2 billion at the end of the previous fiscal year to ¥635.3 billion.
There was an improvement in foreign currency translation adjustments from March 31, 2013, as a result of a large depreciation in the yen during fiscal 2014. This resulted in a ¥71.9 billion increase in accumulated other comprehensive income (loss).
(4) Liquidity and fund resources
Demand for operating funds
TDK’s operating funds are primarily used for the purchase of raw materials and parts for use in the manufacture of its products, and this is recorded as manufacturing expenses. The payment of personnel costs and selling, general and administrative expenses such as marketing fees and distribution-related expenses related to sales promotion activities are also a significant disbursement of funds. Personnel expenses relating to R&D are also significant. The necessary funds for these disbursements are mainly provided from cash generated by operations.
Capital expenditures
For details of capital expenditures, please refer to “1. Outline of capital expenditures” under “III. Facilities.”
Procurement of funds
TDK regards cash and deposits with banks, etc. (cash, deposits with banks, short-term investments, short-term marketable securities) as liquid funds, and its policy has long been to maintain its liquidity level at 2.0 months or more of monthly consolidated sales. The balance of liquid funds amounted to ¥259.5 billion at the end of fiscal 2014, which was equal to approximately 3.2 average months of annual sales. TDK considers this level of liquidity sufficient for current needs.
Net cash of ¥55.4 billion was used in investing activities of the Group in the fiscal year under review. TDK held long-term debt in the sum of ¥82.4 billion excluding straight bonds and lease obligations, straight bonds in the sum of ¥61.0 billion and short-term debt in the sum of ¥146.6 billion as of the end of the previous fiscal year, however, long-term debt excluding straight bonds and lease obligations increased by ¥32.8 billion due to execution of new long-term borrowings and other factors during fiscal 2014. Meanwhile TDK reduced straight bonds and short-term debt by redeeming ¥48.0 billion in straight bonds and repaying ¥14.4 billion in short-term debt. For details of the debt of the Group, please refer to Notes to Consolidated Financial Statements, Note 6. Short-Term and Long-Term Debt.
Fund management
As a general rule, operating funds or funds for capital expenditure are provided from cash generated by operations. In order to improve capital efficiency, TDK has introduced a cash management system (CMS) in Japan, the U.S. and Europe to centrally manage funds from its Headquarters whenever it is possible to do so. When subsidiaries are unable to provide their operating funds or funds for capital expenditure, TDK utilizes funds from within the Group as much as possible. Moreover, TDK manages on-hand funds by placing priority on security and liquidity.

III. Facilities 1. Outline of capital expenditures In fiscal 2014, TDK spent ¥68,606 million on capital expenditures to accurately respond to the rapid technological innovation and the intensified sales competition in the electronics market to which TDK belongs.
Capital expenditures in the Passive Components segment totaled ¥32,499 million. Expenditures were mainly for the purpose of increasing the production capacity of high-frequency components and inductive devices.
Capital expenditures in the Magnetic Application Products segment totaled ¥14,821 million, mainly for the development and production of high-density next-generation heads for HDDs at SAE Magnetics (H.K.) Ltd.
Capital expenditures in the Film Application Products segment totaled ¥14,659 million, mainly to boost production of lithium-ion polymer batteries at Amperex Technology Ltd.
Capital expenditures in the Other totaled ¥1,162 million. Capital expenditures for the R&D divisions at the headquarters totaled ¥5,465 million mainly for investment in internal IT infrastructure construction and fundamental development research.
2. Main facilities Main facilities of TDK are as follows.
(1) Passive Components a. Filing company (TDK Corporation)
Name of facility (Location)
Description
Book value (Millions of yen) Number of employees (Person)
Buildings and structures
Machinery, equipment and vehicles
Land (thousand m2)
Lease assets
Construction in progress Total
Akita Plant (Nikaho City, Akita Pref.) 4 other plants in the Pref.
Manufacturing passive components
8,635 100 2,845
(511) - 76 11,658 -
Notes: 1. Tools, furniture and fixtures are included in the book value of “Machinery, equipment and vehicles.”
2. Akita Plant is mainly an asset leased to TDK-EPC Corporation.
b. Domestic subsidiaries
Name of company (Location)
Description
Book value (Millions of yen) Number of employees (Person) Buildings Machinery and
equipment Land (thousand m2)
Construction in progress Total
TDK-EPC Corporation (Minato-ku, Tokyo and other locations)
Manufacturing passive components
8,130 30,983 - 830 39,943 1,101
TDK Shonai Corporation (Tsuruoka City, Yamagata Pref. and other locations)
Manufacturing passive components
2,202 97 1,144
(98) 2 3,445 747
TDK Ugo Corporation (Yurihonjo City, Akita Pref. and other locations)
Manufacturing passive components
2,991 35 398
(89) 7 3,431 804
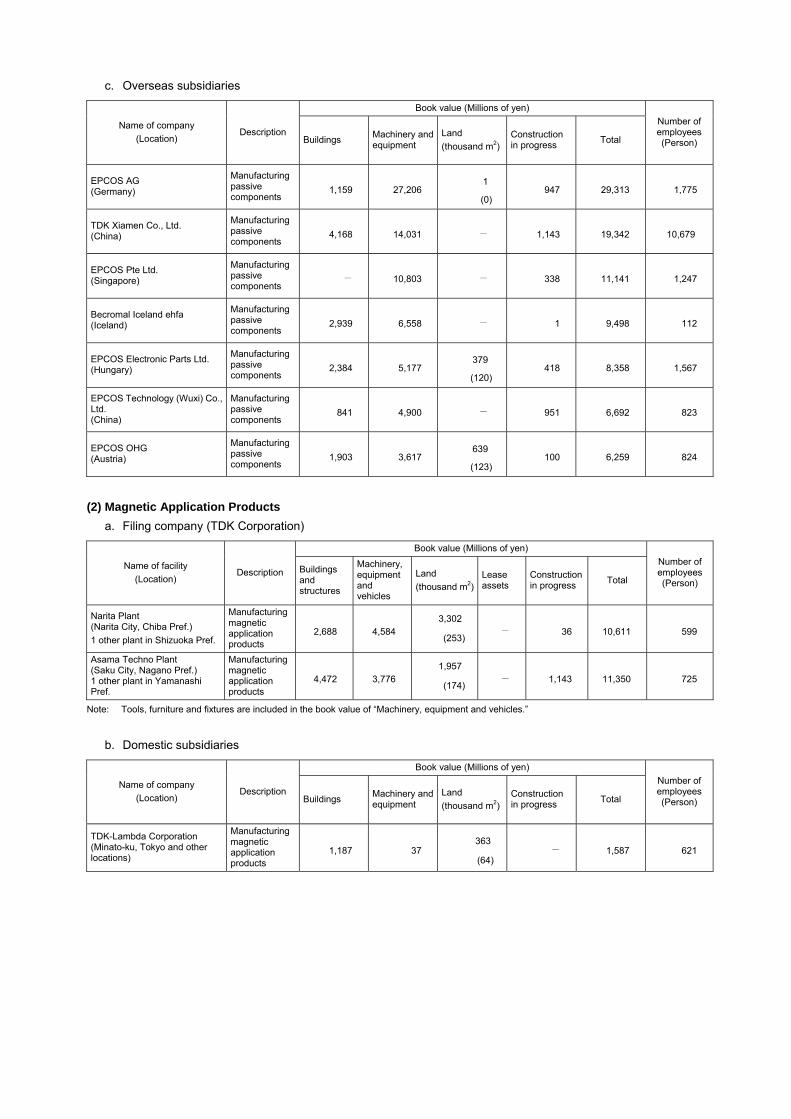
c. Overseas subsidiaries
Name of company (Location)
Description
Book value (Millions of yen) Number of employees (Person) Buildings Machinery and
equipment Land (thousand m2)
Construction in progress Total
EPCOS AG (Germany)
Manufacturing passive components
1,159 27,206 1
(0) 947 29,313 1,775
TDK Xiamen Co., Ltd. (China)
Manufacturing passive components
4,168 14,031 - 1,143 19,342 10,679
EPCOS Pte Ltd. (Singapore)
Manufacturing passive components
- 10,803 - 338 11,141 1,247
Becromal Iceland ehfa (Iceland)
Manufacturing passive components
2,939 6,558 - 1 9,498 112
EPCOS Electronic Parts Ltd. (Hungary)
Manufacturing passive components
2,384 5,177 379
(120) 418 8,358 1,567
EPCOS Technology (Wuxi) Co., Ltd. (China)
Manufacturing passive components
841 4,900 - 951 6,692 823
EPCOS OHG (Austria)
Manufacturing passive components
1,903 3,617 639
(123) 100 6,259 824
(2) Magnetic Application Products
a. Filing company (TDK Corporation)
Name of facility (Location)
Description
Book value (Millions of yen) Number of employees (Person)
Buildings and structures
Machinery, equipment and vehicles
Land (thousand m2)
Lease assets
Construction in progress Total
Narita Plant (Narita City, Chiba Pref.) 1 other plant in Shizuoka Pref.
Manufacturing magnetic application products
2,688 4,584 3,302
(253) - 36 10,611 599
Asama Techno Plant (Saku City, Nagano Pref.) 1 other plant in Yamanashi Pref.
Manufacturing magnetic application products
4,472 3,776 1,957
(174) - 1,143 11,350 725
Note: Tools, furniture and fixtures are included in the book value of “Machinery, equipment and vehicles.”
b. Domestic subsidiaries
Name of company (Location)
Description
Book value (Millions of yen) Number of employees (Person) Buildings Machinery and
equipment Land (thousand m2)
Construction in progress Total
TDK-Lambda Corporation (Minato-ku, Tokyo and other locations)
Manufacturing magnetic application products
1,187 37 363
(64) - 1,587 621

c. Overseas subsidiaries
Name of company (Location)
Description
Book value (Millions of yen) Number of employees (Person) Buildings Machinery and
equipment Land (thousand m2)
Construction in progress Total
Magnecomp Precision Technology Public Co., Ltd. (Thailand)
Manufacturing magnetic application products
3,184 8,297 437
(136) 379 12,297 7,340
SAE Magnetics (H.K.) Ltd. (China (Hong Kong))
Manufacturing magnetic application products
1,628 10,195 - 301 12,124 667
Headway Technologies, Inc. (U.S.A.)
Manufacturing magnetic application products
858 3,617 - 602 5,077 558
(3) Film Application Products
a. Filing company (TDK Corporation)
Name of facility (Location)
Description
Book value (Millions of yen) Number of employees (Person)
Buildings and structures
Machinery, equipment and vehicles
Land (thousand m2)
Lease assets
Construction in progress Total
Mikumagawa Plant (Hita City, Oita Pref.)
Manufacturing film application products
1,174 440 700
(101) - - 2,315 271
Note: Tools, furniture and fixtures are included in the book value of “Machinery, equipment and vehicles.”
b. Overseas subsidiaries
Name of company (Location)
Description
Book value (Millions of yen) Number of employees (Person) Buildings Machinery and
equipment Land (thousand m2)
Construction in progress Total
Ningde Amperex Technology Ltd. (China)
Manufacturing film application products
15,587 13,360 - 11,677 40,624 5,455
(4) Corporate (Common) and Other
a. Filing company (TDK Corporation)
Name of facility (Location)
Description
Book value (Millions of yen) Number of employees (Person)
Buildings and structures
Machinery, equipment and vehicles
Land (thousand m2)
Lease assets
Construction in progress Total
Technical Center (Ichikawa City, Chiba Pref.)
Corporate (Common) and Other
7,780 1,313 1,217
(93) 140 - 10,451 1,055
Notes: 1. Tools, furniture and fixtures are included in the book value of “Machinery, equipment and vehicles.” 2. Technical Center is mainly a corporate (common) facility, but it also includes business segments which are classified as Other. However,
due to difficulties in drawing such distinctions, it is displayed under “corporate (common) and other”.

3. Plan for installation and retirement, etc. of facilities TDK conducts a broad range of operations in Japan and overseas. At the end of fiscal 2014, plans of new constructions and expansions of facilities for these operations had not been decided for each individual project. For this reason, figures are disclosed by each business segment. Capital expenditure plans (new constructions and expansions) within the one year period following fiscal 2014 are ¥80,000 million and the breakdown by business segment is as follows.
Name of business segment
Projected amount at the end of fiscal
2014 (Millions of yen)
Main contents and objectives of facilities, etc. Capital resource
Passive Components 27,000 Production capacity increase and rationalization of inductive devices and high-frequency components
Own capital
Magnetic Application Products 17,000
Developing and manufacturing facilities of high-density next-generation heads for HDD, and production rationalization of magnet products
Own capital
Film Application Products 29,000 Production capacity increase of lithium-ion polymer batteries Own capital
Other 2,000 – Own capital
HQ/R&D divisions 5,000 Establishment of internal IT system and basic research and development Own capital
Total 80,000 – –
Notes: 1. Consumption taxes, etc. are not included. 2. There are no plans for retirement or sale of important facilities except for the regular retirement or sale related to updating
facilities.

IV. Filing company 1. Status of the Company (TDK Corporation)’s shares (1) Total number of shares authorized, etc.
a. Total number of shares authorized
Class Total number of shares authorized by TDK Corporation(Shares)
Common stock 480,000,000
Total 480,000,000
b. Number of shares issued
Class Number of
issued shares (As of March 31, 2014)
Number of issued shares
(As of the date of filing: June 27, 2014)
Name of financial instruments exchange where the stock of TDK Corporation is traded or the name of authorized financial instruments
firms association where TDK Corporation is registered
Details
Common stock 129,590,659 129,590,659 Tokyo Stock Exchange (First Section)
Share unit number 100 shares
Total 129,590,659 129,590,659 – –
Notes: The number of shares issued by exercise of stock acquisition rights (including exercise of conversion rights of convertible bonds and stock acquisition rights of bonds with stock acquisition rights issued pursuant to the former Japanese Commercial Code) between June 1, 2014 and the date of filing of this Annual Securities Report, is not included in “Number of shares issued (as of the date of filing: June 27, 2014)”.

(2) Status of stock acquisition rights Stock acquisition rights, etc., granted to the Company’s Directors and Company Auditors as of the end of the business year under review in consideration for the performance of their duties
a. Stock-linked compensation stock acquisition rights (As of March 31, 2014)
Issue Issue
resolution date
Number of stock
acquisition rights
Class and number of shares to be issued upon the exercise of stock acquisition rights
Amount to be paid for stock
acquisition rights (issue price)
Exercise period of stock acquisition rights
(both days inclusive)
Directors’ and Company Auditors’ holdings
Directors (excluding Outside
Directors)
Company Auditors
2005 June 29, 2005 34 3,400 shares of common stock Free of charge From July 1, 2005
to June 30, 2025 1 person, 26 rights -
2006 (Issued at Fair Value to
Directors) June 29, 2006 13 1,300 shares of
common stock ¥8,139
(fair value) From August 6, 2006
to August 5, 2026 - -
2006 (Issued Free of Charge to
Corporate Officers) June 29, 2006 12 1,200 shares of
common stock Free of charge From August 6, 2006 to August 5, 2026 - -
2007 (Issued at Fair Value to
Directors) May 15, 2007 28 2,800 shares of
common stock ¥11,014
(fair value) From July 8, 2007
to July 7, 2027 1 person, 7 rights -
2007 (Issued Free of Charge to
Corporate Officers) June 28, 2007 22 2,200 shares of
common stock Free of charge From July 8, 2007 to July 7, 2027 - -
2008 (Issued at Fair Value to
Directors) May 28, 2008 74 7,400 shares of
common stock ¥5,967
(fair value) From July 6, 2008
to July 5, 2028 1 person, 37 rights -
2008 (Issued Free of Charge to Corporate Officers)
June 27, 2008 71 7,100 shares of common stock Free of charge From July 6, 2008
to July 5, 2028 1 person, 9 rights -
2009 May 27, 2009 322 32,200 shares of common stock
¥4,021 (fair value)
From July 5, 2009 to July 4, 2029
3 people, 83 rights -
2010 May 26, 2010 296 29,600 shares of common stock
¥4,213 (fair value)
From July 4, 2010 to July 3, 2030
3 people, 93 rights -
2011 May 25, 2011 417 41,700 shares of common stock
¥3,925 (fair value)
From July 3, 2011 to July 2, 2031
4 people, 133 rights -
2012 June 21, 2012 394 39,400 shares of common stock
¥2,770 (fair value)
From July 8, 2012 to July 7, 2032
4 people, 176 rights -
2013 June 19, 2013 382 38,200 shares of common stock
¥3,112 (fair value)
From July 7, 2013 to July 6, 2033
4 people, 176 rights -
b. Stock acquisition rights (As of March 31, 2014)
Issue Issue resolution date
Number of stock
acquisition rights
Class and number of shares to be issued upon the exercise of
stock acquisition rights
Exercise price(per share)
Exercise period of stock acquisition rights
(both days inclusive)
Directors’ and Company Auditors’ holdings
Directors (excluding Outside
Directors) Company Auditors
7th July 31, 2008 706 70,600 shares of common stock
¥6,837 From August 1, 2010 to July 31, 2014
1 person, 8 rights
1 person,5 rights
8th July 30, 2009 688 68,800 shares of common stock
¥5,110 From August 1, 2011 to July 31, 2015 - 1 person,
5 rights
9th July 29, 2010 897 89,700 shares of common stock
¥5,292 From August 1, 2012 to July 31, 2016 - 1 person,
5 rights
10th July 28, 2011 871 87,100 shares of common stock
¥4,567 From August 1, 2013 to July 31, 2017 - -
11th July 31, 2012 1,176 117,600 shares of common stock
¥3,550 From August 1, 2014 to July 31, 2018 - -
12th July 31, 2013 1,193 119,300 shares of common stock
¥3,836 From August 1, 2015 to July 31, 2019 - -
Notes: 1. The exercise price of stock-linked compensation stock acquisition rights is ¥1 per share.
2. Stock acquisition rights are issued free of charge.
3. Stock acquisition rights held by Directors include stock acquisition rights granted when they were employees or Corporate Officers of the Company.
4. Stock acquisition rights held by Company Auditors were granted when employed at the Company.

(Reference) Stock acquisition rights, etc., held by Directors, Company Auditors, Corporate Officers and employees, etc., of the Company and its subsidiaries at March 31, 2014
Number of stock acquisition rights
Class and number of shares to be issued upon the exercise of
stock acquisition rights
Percentage of the number of stock acquisition rights in the total number
of the issued shares
Stock-Linked Compensation Stock
Acquisition Rights 2,065 206,500 shares of
common stock 0.16%
Stock Acquisition Rights 5,531 553,100 shares of common stock 0.43%
Total 7,596 759,600 shares of common stock 0.59%
(3) Details of rights plan
No items to report
(4) Trends in total number of issued shares, capital stock, etc.
Date
Fluctuation in the total number of issued shares
(shares)
Balance of total number of issued
shares (shares)
Fluctuation in capital stock
(Millions of yen)
Balance of capital stock
(Millions of yen)
Fluctuation in additional paid-in
capital (Millions of yen)
Balance of additional paid-in
capital (Millions of yen)
August 10, 2007
(Note) (3,599,000) 129,590,659 – 32,641 – 59,256
Note: Decrease due to cancellation of treasury stock.
(5) Shareholder composition
(As of March 31, 2014)
Category
Shareholder composition (Number of shares consisting one unit: 100)
Shares less than one unit
(Shares) Public sector
Financial institutions
Financial instruments
business operators
Other corporations
Foreign investors Individuals,
etc. Total Companies, etc. Individuals
Number of shareholders
(Person) – 84 64 305 528 27 26,421 27,429 –
Number of shares held
(Share units) – 463,863 88,294 20,777 557,562 93 164,789 1,295,378 52,859
Holding rate of shares (%) – 35.81 6.82 1.60 43.04 0.01 12.72 100.00 –
Notes: 1. In the “Other corporations” column, three share units in the name of Japan Securities Depository Center, Inc. are included.
2. 3,776,321 treasury shares of which 37,763 share units are included in “Individuals, etc.” and 21 shares are included in “Shares less than one unit.”
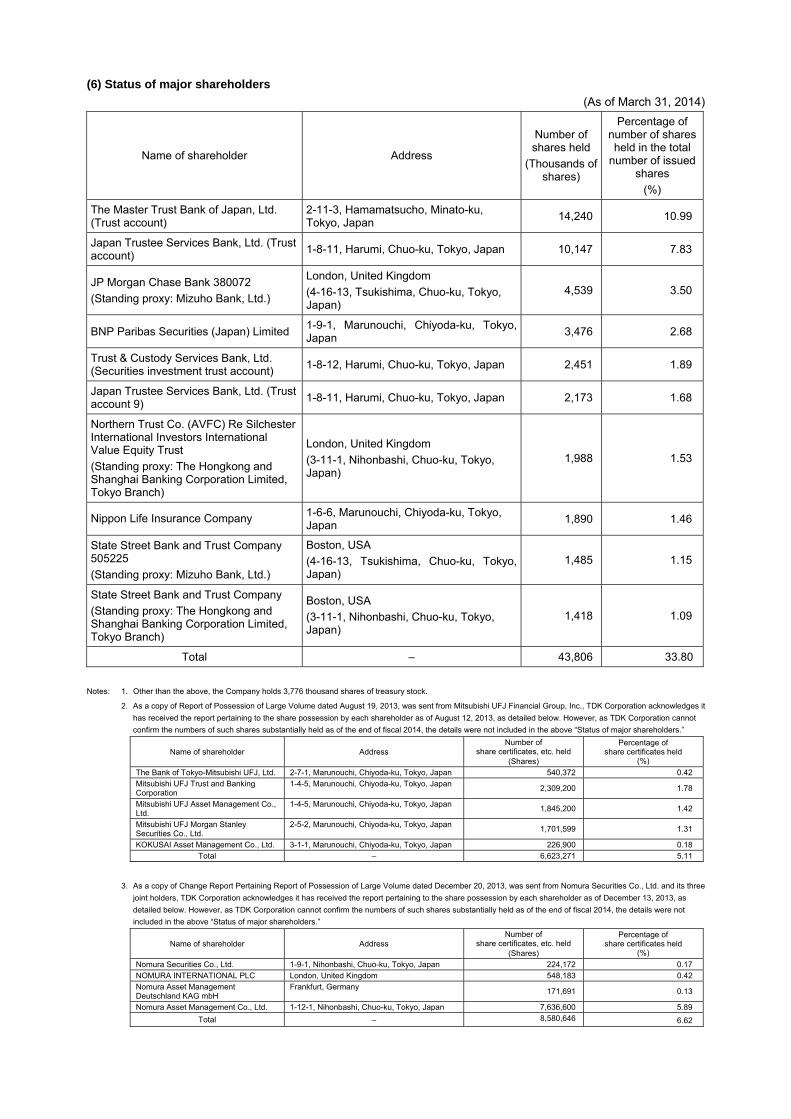
(6) Status of major shareholders (As of March 31, 2014)
Name of shareholder Address
Number of shares held
(Thousands of shares)
Percentage of number of shares held in the total
number of issued shares
(%)
The Master Trust Bank of Japan, Ltd. (Trust account)
2-11-3, Hamamatsucho, Minato-ku, Tokyo, Japan 14,240 10.99
Japan Trustee Services Bank, Ltd. (Trust account) 1-8-11, Harumi, Chuo-ku, Tokyo, Japan 10,147 7.83
JP Morgan Chase Bank 380072 (Standing proxy: Mizuho Bank, Ltd.)
London, United Kingdom (4-16-13, Tsukishima, Chuo-ku, Tokyo, Japan)
4,539 3.50
BNP Paribas Securities (Japan) Limited 1-9-1, Marunouchi, Chiyoda-ku, Tokyo, Japan 3,476 2.68
Trust & Custody Services Bank, Ltd. (Securities investment trust account) 1-8-12, Harumi, Chuo-ku, Tokyo, Japan 2,451 1.89
Japan Trustee Services Bank, Ltd. (Trust account 9) 1-8-11, Harumi, Chuo-ku, Tokyo, Japan 2,173 1.68
Northern Trust Co. (AVFC) Re Silchester International Investors International Value Equity Trust (Standing proxy: The Hongkong and Shanghai Banking Corporation Limited, Tokyo Branch)
London, United Kingdom (3-11-1, Nihonbashi, Chuo-ku, Tokyo, Japan)
1,988 1.53
Nippon Life Insurance Company 1-6-6, Marunouchi, Chiyoda-ku, Tokyo, Japan 1,890 1.46
State Street Bank and Trust Company 505225 (Standing proxy: Mizuho Bank, Ltd.)
Boston, USA (4-16-13, Tsukishima, Chuo-ku, Tokyo, Japan)
1,485 1.15
State Street Bank and Trust Company (Standing proxy: The Hongkong and Shanghai Banking Corporation Limited, Tokyo Branch)
Boston, USA (3-11-1, Nihonbashi, Chuo-ku, Tokyo, Japan)
1,418 1.09
Total – 43,806 33.80
Notes: 1. Other than the above, the Company holds 3,776 thousand shares of treasury stock.
2. As a copy of Report of Possession of Large Volume dated August 19, 2013, was sent from Mitsubishi UFJ Financial Group, Inc., TDK Corporation acknowledges it has received the report pertaining to the share possession by each shareholder as of August 12, 2013, as detailed below. However, as TDK Corporation cannot confirm the numbers of such shares substantially held as of the end of fiscal 2014, the details were not included in the above “Status of major shareholders.”
Name of shareholder Address Number of
share certificates, etc. held (Shares)
Percentage of share certificates held
(%) The Bank of Tokyo-Mitsubishi UFJ, Ltd. 2-7-1, Marunouchi, Chiyoda-ku, Tokyo, Japan 540,372 0.42 Mitsubishi UFJ Trust and Banking Corporation
1-4-5, Marunouchi, Chiyoda-ku, Tokyo, Japan 2,309,200 1.78
Mitsubishi UFJ Asset Management Co., Ltd.
1-4-5, Marunouchi, Chiyoda-ku, Tokyo, Japan 1,845,200 1.42
Mitsubishi UFJ Morgan Stanley Securities Co., Ltd.
2-5-2, Marunouchi, Chiyoda-ku, Tokyo, Japan 1,701,599 1.31
KOKUSAI Asset Management Co., Ltd. 3-1-1, Marunouchi, Chiyoda-ku, Tokyo, Japan 226,900 0.18 Total – 6,623,271 5.11
3. As a copy of Change Report Pertaining Report of Possession of Large Volume dated December 20, 2013, was sent from Nomura Securities Co., Ltd. and its three joint holders, TDK Corporation acknowledges it has received the report pertaining to the share possession by each shareholder as of December 13, 2013, as detailed below. However, as TDK Corporation cannot confirm the numbers of such shares substantially held as of the end of fiscal 2014, the details were not included in the above “Status of major shareholders.”
Name of shareholder Address Number of
share certificates, etc. held (Shares)
Percentage of share certificates held
(%) Nomura Securities Co., Ltd. 1-9-1, Nihonbashi, Chuo-ku, Tokyo, Japan 224,172 0.17 NOMURA INTERNATIONAL PLC London, United Kingdom 548,183 0.42 Nomura Asset Management Deutschland KAG mbH
Frankfurt, Germany 171,691 0.13
Nomura Asset Management Co., Ltd. 1-12-1, Nihonbashi, Chuo-ku, Tokyo, Japan 7,636,600 5.89 Total – 8,580,646 6.62

4. As a copy of Change Report dated January 9, 2014, was sent from Sumitomo Mitsui Trust Bank, Limited and its two joint holders, TDK Corporation acknowledges it has received the report pertaining to the share possession by each shareholder as of December 31, 2013, as detailed below. However, as TDK Corporation cannot confirm the numbers of such shares substantially held as of the end of fiscal 2014, the details were not included in the above “Status of major shareholders.”
Name of shareholder Address Number of
share certificates, etc. held (Shares)
Percentage of shares certificates held
(%) Sumitomo Mitsui Trust Bank, Limited 1-4-1, Marunouchi, Chiyoda-ku, Tokyo, Japan 4,066,200 3.14 Sumitomo Mitsui Trust Asset Management Co., Ltd.
3-33-1, Shiba, Minato-ku, Tokyo, Japan 407,200 0.31
Nikko Asset Management Co.., Ltd 9-7-1 Akasaka, Minato-ku, Tokyo, Japan 4,411,600 3.40 Total – 8,885,000 6.86
5. As a copy of Change Report dated January 10, 2014, was sent from Capital Research and Management Company and its two joint holders, TDK Corporation acknowledges it has received the report pertaining to the share possession by each shareholder as of December 31, 2013, as detailed below. However, as TDK corporation cannot confirm the numbers of such shares substantially held as of the end of fiscal 2014, the details were not included in the above “Status of major shareholders.”
Name of shareholder Address Number of
share certificates, etc. held (Shares)
Percentage of shares certificates held
(%) Capital Research and Management Company
Los Angeles, USA 6,980,400 5.39
Capital International Limited London, United Kingdom 169,300 0.13 The Capital Group Companies, Inc. 2-1-1 Marunouchi, Chiyoda-ku, Tokyo, Japan 208,900 0.16
Total – 7,358,600 5.68
6. As a copy of Change Report dated February 7, 2014, was sent from FIL Investments (Japan) Limited, TDK Corporation acknowledges it has received the report pertaining to the share possession by the shareholder as of January 31, 2014, as detailed below. However, as TDK Corporation cannot confirm the numbers of such shares substantially held as of the end of fiscal 2014, the details were not included in the above “Status of major shareholders.”
Name of shareholder Address Number of
share certificates, etc. held (Shares)
Percentage of shares certificates held
(%) FIL Investments (Japan) Limited 4-3-1, Toranomon, Minato-ku, Tokyo, Japan 4,439,286 3.43
Total – 4,439,286 3.43

(7) Status of voting rights a. Issued shares
(As of March 31, 2014)
Classification Number of shares
(Shares) Number of voting rights
(Units) Content
Shares without voting rights – – –
Shares with restricted voting rights (Treasury stock, etc.) – – –
Shares with restricted voting rights (Other) – – –
Shares with full voting rights (Treasury stock, etc.)
Common stock 3,776,300
– –
Shares with full voting rights (Other)
Common stock 125,761,500
1,257,615 –
Shares less than one unit Common stock
52,859 – –
Total number of issued shares 129,590,659 – –
Total number of voting rights – 1,257,615 –
Note: The number of “Shares with full voting rights (Other)” includes 300 shares in the name of Japan Securities Depository Center, Inc. “Number of voting rights” includes three units of voting rights related to shares with full voting rights in its name.
b. Treasury stock, etc.
(As of March 31, 2014)
Name of shareholder Address
Number of shares held under own
name (Shares)
Number of shares held
under the name of others (Shares)
Total number of shares held
(Shares)
Percentage of total number of shares held in
the total number of issued shares
(%)
TDK Corporation 3-9-1, Shibaura, Minato-ku, Tokyo, Japan 3,776,300 – 3,776,300 2.91
Total – 3,776,300 – 3,776,300 2.91
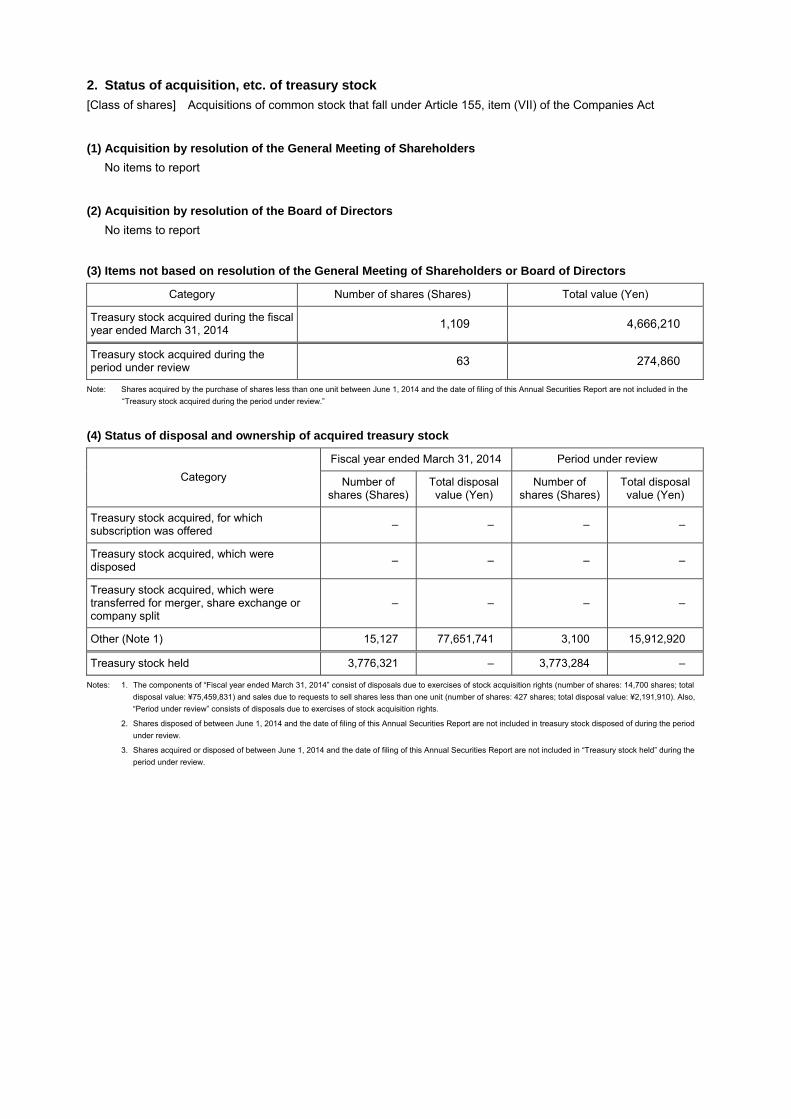
2. Status of acquisition, etc. of treasury stock [Class of shares] Acquisitions of common stock that fall under Article 155, item (VII) of the Companies Act
(1) Acquisition by resolution of the General Meeting of Shareholders No items to report
(2) Acquisition by resolution of the Board of Directors No items to report
(3) Items not based on resolution of the General Meeting of Shareholders or Board of Directors
Category Number of shares (Shares) Total value (Yen)
Treasury stock acquired during the fiscal year ended March 31, 2014 1,109 4,666,210
Treasury stock acquired during the period under review 63 274,860
Note: Shares acquired by the purchase of shares less than one unit between June 1, 2014 and the date of filing of this Annual Securities Report are not included in the “Treasury stock acquired during the period under review.”
(4) Status of disposal and ownership of acquired treasury stock
Category Fiscal year ended March 31, 2014 Period under review
Number of shares (Shares)
Total disposal value (Yen)
Number of shares (Shares)
Total disposal value (Yen)
Treasury stock acquired, for which subscription was offered – – – –
Treasury stock acquired, which were disposed – – – –
Treasury stock acquired, which were transferred for merger, share exchange or company split
– – – –
Other (Note 1) 15,127 77,651,741 3,100 15,912,920
Treasury stock held 3,776,321 – 3,773,284 –
Notes: 1. The components of “Fiscal year ended March 31, 2014” consist of disposals due to exercises of stock acquisition rights (number of shares: 14,700 shares; total disposal value: ¥75,459,831) and sales due to requests to sell shares less than one unit (number of shares: 427 shares; total disposal value: ¥2,191,910). Also, “Period under review” consists of disposals due to exercises of stock acquisition rights.
2. Shares disposed of between June 1, 2014 and the date of filing of this Annual Securities Report are not included in treasury stock disposed of during the period under review.
3. Shares acquired or disposed of between June 1, 2014 and the date of filing of this Annual Securities Report are not included in “Treasury stock held” during the period under review.

3. Dividend policy TDK Corporation recognizes that achieving growth in corporate value over long term ultimately translates into higher shareholder value. In line with this recognition, TDK Corporation’s fundamental policy is to work to consistently increase dividends through growth in earnings per share. By actively investing for growth, mainly in the development of new products and technologies in key fields so as to respond precisely to rapid technological innovation in the electronics industry, TDK Corporation is aiming to increase long-term corporate value. Accordingly, TDK Corporation actively reinvests its profits in business activities and sets its dividends taking into consideration comprehensive factors such as return on stockholders’ equity and dividends on stockholders’ equity on a consolidated basis, as well as changes in the business environment.
TDK Corporation’s basic policy is to pay dividends from surplus twice a year, at end of year and midterm, with the former determined by the Ordinary General Meeting of Shareholders and the latter by the Board of Directors.
The Articles of Incorporation of TDK Corporation prescribe “By resolution of the Board of Directors, the Company may pay interim dividends on September 30 of each year as a record date.”
Dividends from surplus for the 118th term are as follows.
Resolution date Total amount of dividends (Millions of yen)
Dividends per share (Yen)
The Board of Directors Meeting held on October 31, 2013 3,774 30
The General Meeting of Shareholders held on June 27, 2014 5,033 40
4. Trends in share price (1) Highest and lowest share prices for the most recent five years by term
Term 114th term 115th term 116th term 117th term 118th term
Accounting period
From April 1, 2009 to March 31, 2010
From April 1, 2010 to March 31, 2011
From April 1, 2011 to March 31, 2012
From April 1, 2012 to March 31, 2013
From April 1, 2013 to March 31, 2014
Highest (Yen) 6,290 6,590 4,990 4,840 5,360
Lowest (Yen) 3,550 4,225 2,404 2,719 3,095
Note: The above share prices were those recorded on the first section of the Tokyo Stock Exchange.
(2) Monthly highest and lowest share prices for the most recent six months
Month October 2013
November 2013
December 2013
January 2014
February 2014
March 2014
Highest (Yen) 4,300 4,855 5,100 5,360 4,490 4,615
Lowest (Yen) 3,600 3,945 4,625 4,630 4,130 4,180
Note: The above share prices were those recorded on the first section of the Tokyo Stock Exchange.

5. Status of Directors and Company Auditors
Title Post Name Date of birth Summary of career Term of office
Number of shares held
(Hundreds of shares)
Representative Director
President and CEO, and General Manager of Humidifier Countermeasures HQ
Takehiro Kamigama
Jan. 12, 1958
Apr. 1981: Entered the Company
Note: 3 73
Apr. 2001: General Manager in charge of strategic technology of Recording Device Business Group of the Company
Oct. 2001: General Manager of Head Business Group of the Company
Jun. 2002: Corporate Officer of the Company Jun. 2003: Senior Vice President of the
Company Jun. 2004: Director & Executive Vice President
of the Company Jun. 2006: President & Representative Director
of the Company (present post) Jun. 2012: General Manager of Electronic
Components Sales & Marketing Group of the Company
Apr. 2013: General Manager of Humidifier Countermeasures HQ of the Company (present post)
Director
In charge of Applied Films Business Division, Flash Memory Applied Device Business Division and EMC & RF Engineering Business Division, General Manager of Magnet Product Business Group, General Manager of Power Systems Business Group
Atsuo Kobayashi
Jan. 7, 1960
Nov. 1989: Entered the Company
Note: 3 10
Apr. 2004: General Manager of Japan Operation of the HDD Head Business Unit of the Head Business Group of the Company
Jul. 2006: Deputy General Manager of the Head Business Group of the Company
Apr. 2007: General Manager of the Head Business Group of the Company
Jun. 2008: Corporate Officer of the Company Sep. 2008: Vice Chairman of SAE Magnetics
(Hong Kong) Limited Jun. 2010: Senior Vice President of the
Company Jun. 2012: Director of the Company (present
post) Executive Vice President of the Company (present post) General Manager of Corporate Planning Group & General Manager of Corporate Planning Department of Corporate Planning Group of the Company
Apr. 2013: General Manager of Corporate Strategy HQ & Deputy General Manager of Humidifier Countermeasures HQ of the Company
Jun. 2013: In charge of Power Systems Business Group, Ferrite & Magnet Products Business Group, Data Storage & Thin Film Technology Components Business Group, Applied Films Business Division, Flash Memory Applied Device Business Division and EMC & RF Engineering Business Division
Jun. 2014: In charge of Applied Films Business Division, Flash Memory Applied Device Business Division, EMC & RF Engineering Business Division (present post) General Manager of Magnet Product Business Group (present post) General Manager of Power Systems Business Group (present post)

Title Post Name Date of birth Summary of career Term of office
Number of shares held
(Hundreds of shares)
Director
President & CEO of TDK-EPC Corporation, General Manager of the Ceramic Capacitors Business Group
Hiroyuki Uemura
Apr. 26, 1955
Apr. 1974: Entered the Company
Note: 3 37
Apr. 2004: Wire-Wound EMC General Manager of the Inductor Group of Circuit Device Business Group of the Company
Nov. 2008: Deputy General Manager of Magnetics Business Group of the Company
Apr 2009: General Manager of the Magnetics Business Group of the Company
Jun. 2009: Corporate Officer of the Company Jun. 2010: Senior Vice President of the
Company Nov. 2011: General Manager of the Ceramic
Capacitors Business Group of the Company (present post)
Jun. 2012: Director of the Company (present post) Executive Vice President of the Company (present post) President & CEO of TDK-EPC Corporation (present post)
Director
In charge of Corporate Systems Reformation, Human Resources, General Affairs, Legal, CSR Promotion
Junji Yoneyama
Mar. 16, 1955
Mar. 1984: Entered the Company
Note: 3 20
Jan. 2002: President & CEO of TDK Philippines Corporation
Jul. 2003: General Manager of the General Affairs Department of Ichikawa Technical Center of the Administration Group of the Company
Apr. 2005: President of TDK Taiwan Corporation
Oct. 2006: General Manager of the Human Resources Department of the Administration Group of the Company
Jun. 2008: Corporate Officer of the Company Jun. 2010: Director of the Company (present
post) General Manager of the Administration Group of the Company
Apr. 2013: General Manager of Administration HQ of the Company
Jun. 2013: Senior Vice President of the Company (present post)
Jun. 2014: In charge of Corporate Systems Reformation, Human Resources, General Affairs, Legal, CSR Promotion (present post)
Director Yukio Yanase Jun. 15,
1944
Apr. 1968: Entered the Saitama Bank (which became Asahi Bank in 1991 and is now Resona Bank)
Note: 3 30
Jun. 1996: Director of Asahi bank Oct. 2001: President of the said bank Nov. 2003: Executive advisor of ORIX
Corporation Jun. 2005: Director, Executive Officer & Deputy
President of the said company Jun. 2007: Outside Company Auditor of the
Company Jan. 2008: Director, Representative Executive
Officer, President and Group Chief Operating Officer of ORIX Corporation
Jun. 2009: Resigned Outside Company Auditor of the Company Outside Director of the Company (present post)
Sep. 2010: Outside Director of Ubiteq, INC. Jan. 2011: Director, Executive Officer & Vice
Chairman of ORIX Corporation Jun. 2011: Adviser to the said company Jul. 2013: Executive Advisor to the said
company (present post) May. 2014: President of OGI Holdings Co., Ltd.
(present post)

Title Post Name Date of birth Summary of career Term of office
Number of shares held
(Hundreds of shares)
Director Makoto Sumita
Jan. 6, 1954
Apr. 1980: Entered Nomura Research Institute, Ltd.
Note: 3 –
Jun. 1996: Director of INNOTECH CORPORATION
Apr. 2005: Executive Vice President & Representative Director of the said company
Jun. 2005: Director of IT Access Co., Ltd. (present post)
Apr. 2007: President & CEO of INNOTECH CORPORATION
Jun. 2011: Outside Company Auditor of the Company
Apr. 2013: Chairman & CEO of INNOTECH CORPORATION (present post)
Jun. 2013: Resigned Outside Company Auditor of the Company Outside Director of the Company (present post)
Director Kazumasa Yoshida
Aug. 20, 1958
Oct. 1984: Entered Intel Corporation
Note: 3 –
Oct. 1999: Manager of Technology/OEM Alliance Business Strategy of Enterprise Service Group of the said company
Mar. 2000: General Manager of Communication Product Group of Intel K.K.
May 2002: General Manager of Intel Architecture Business of the said Company
Jun. 2003: Representative Director and President of the said company
Dec. 2004: Vice President of Sales and Marketing Group of Intel Corporation
Jun. 2012: Outside Director of Onkyo Corporation (present post)
Feb. 2013: Outside Director of Gibson Brands, Inc. (present post)
Jun. 2013: Outside Director of CYBERDYNE Inc. (present post)
Oct. 2013: Advisor of Intel K.K. Jun. 2014: Outside Director of the Company
(present post)

Title Post Name Date of birth Summary of career Term of office
Number of shares held
(Hundreds of shares)
Full-time Company Auditor
Osamu Yotsui
Jan. 28, 1956
Apr. 1979: Entered the Company
Note: 4 19
May 1991: Accounting Manager of TDK Recording Media Europe S.A
Jul. 1999: Manager of Managerial Analysis Division of Finance and Accounting Department of the Company
Apr. 2008: General Manager of Management Review & Support Department of the Company
Jun. 2011: Full-time Company Auditor of the Company (present post)
Full-time Company Auditor
Noboru Hara Dec. 24, 1949
Apr. 1968: Entered the Company
Note: 4 15
Nov. 1995:
General Manager of Procurement Department of Recording Media & Systems Business Group of the Company
Oct. 2001:
General Manager of General Affairs Department of Administration Group of the Company
Jun. 2007: Full-time Company Auditor of the Company (present post)
Company Auditor Osamu
Nakamoto Apr. 8, 1942
Apr. 1974: Registered as lawyer
Note: 4 –
Mar. 1975: Joined the law firm of Hamada & Matsumoto
Apr. 1981: Partner of the said law firm Jun. 2000: Outside Company Auditor of the
Company Dec. 2002: Partner of the law firm of Mori
Hamada & Matsumoto Jun. 2004: Resigned as Outside Company
Auditor of the Company Jun. 2007: Outside Company Auditor of
Mitsui-Soko Co., Ltd. Jan. 2008: Representative of Nakamoto Law
Office (present post) Jun. 2008: Outside Company Auditor of Foster
Electric Company, Limited (present post)
Jun. 2009: Outside Company Auditor of the Company (present post)
Mar. 2012: Outside Company Auditor of ValueCommerce Co., Ltd. (present post)

Title Post Name Date of birth Summary of career Term of office
Number of shares held
(Hundreds of shares)
Company Auditor Koichi
Masuda Jan. 23,
1944
Nov. 1969: Registered as certified public accountant
Note: 4 –
Sep. 1978: Partner of Shinwa Audit Corporation Jul. 1992: Representative Partner of Asahi
Shinwa Audit Corporation Oct. 1993: Representative Partner of Asahi &
Co. due to a change of name from Asahi Shinwa Audit Corporation
Jan. 2004: Representative Partner of KPMG AZSA & Co.(currently KPMG AZSA LLC) due to the merger of Asahi & Co. and KPMG AZSA & Co.
Jun. 2007: Resigned from KPMG AZSA & Co. Jul. 2007: Chairman & President of the
Japanese Institute of Certified Public Accountants
Oct. 2009: Outside Company Auditor of Enterprise Turnaround Initiative Corporation of Japan (present post)
Apr. 2010: Outside Company Auditor of NKSJ Holdings, Inc.
Jun. 2010: Outside Director of Eisai Co., Ltd. Jul. 2010: Adviser to the Japanese Institute of
Certified Public Accountants (present post)
Jun. 2011: Outside Company Auditor of The Daishi Bank, Ltd. (present post) Outside Company Auditor of the Company (present post)
Jun. 2012: Outside Corporate Auditor of Tokai Rubber Industries, Ltd. (present post)
Jun. 2013: Governor of Tokyo Stock Exchange Regulation (currently Japan Exchange Regulation) (present post)
Company Auditor Kazunori Yagi Apr 1,
1949
Apr. 1972: Entered Yokogawa Electric Corporation
Note: 5 –
Oct. 1999: Vice President (Officer) and General Manager of Finance & Business Planning, in charge of Corporate Marketing of the said company
Apr. 2001: Senior Vice President and General Manager of Finance & Business Planning of the said company
Jun. 2001: Director, Senior Vice President and General Manager of Finance & Business Planning of the said company
Jul. 2002: Director, Executive Vice President and General Manager of Finance & Business Planning of the said company
Jul. 2005: Director, Executive Vice President and General Manager of Management Administration Headquarters of the said company
Jun. 2011: Advisor to the said company (present post), Outside Company Auditor of Yokogawa Bridge Holdings Corporation (present post)
Jun. 2012: Outside Director of JSR Corporation (present post)
Jun. 2013: Outside Company Auditor of the Company (present post)
Mar. 2014: Outside Director of OYO Corporation (present post)
Total 204
Notes: 1. Directors Yukio Yanase, Makoto Sumita and Kazumasa Yoshida are Outside Directors.
2. Company Auditors Osamu Nakamoto, Koichi Masuda and Kazunori Yagi are Outside Company Auditors.
3. One year from the closing date of the Ordinary General Meeting of Shareholders held on June 27, 2014.
4. Four years from the closing date of the Ordinary General Meeting of Shareholders held on June 29, 2011.
5. Two years from the closing date of the Ordinary General Meeting of Shareholders held on June 27, 2013.
6. TDK Corporation, aiming to boost execution of duties and improve management efficiency, has introduced a Corporate Officer System. TDK has 16 Corporate Officers.

6. Status of corporate governance, etc. (1) Status of corporate governance
Corporate governance system of the TDK is as follows:
1. Systems for ensuring the execution of duties by Directors complies with laws and regulations and the Articles of Incorporation:
TDK Corporation was established in 1935 as the world’s first company to commercialize a magnetic material called ferrite. In the ensuing years, TDK Corporation has unremittingly pursued originality and increased corporate value through provisions of products and services which have created new value, based on the founding spirit “Contribute to culture and industry through creativity” as its Corporate Motto. In addition, TDK will continue to build satisfaction, trust, and support among all stakeholders (shareholders, customers, suppliers, employees, and communities, among others), continue to be helpful by resolving social issues and contribute to the development of a more sustainable society. TDK clearly declares as its Corporate Charter of Business Behavior that TDK will continue to respect human rights, comply with relevant laws, regulations, and international rules and the spirit thereof, and carry out its social responsibility with a strong sense of ethics, domestically and overseas. All members of TDK seek to behave in strict compliance with the Corporate Standards of Business Conduct prescribed by the TDK Code of Conduct.
In addition, TDK aims to achieve its management targets and further improve corporate value through the creation of products by adhering to the Corporate Motto. At the same time, TDK strives to foster a sound corporate culture and sincerely conduct business activities, always aware of its place as a member of society. Moreover, TDK will be accountable to stakeholders through comprehensive, accurate, timely, and impartial disclosure of information.
As mentioned above, TDK sincerely and devotedly seeks to achieve its management philosophy, and to establish the following effective and orderly corporate governance systems to continue to ensure soundness, compliance, and transparency in its business operations.
① Adoption of the Company Auditor System and Strengthening of the Supervisory Function:
TDK Corporation has adopted the Company Auditor System pursuant to the Companies Act of Japan and has appointed three independent Outside Company Auditors (of the five Company Auditors) who are disinterested in TDK Corporation to strengthen the supervision of TDK Corporation’s management.
② Strengthening the Function of the Board of Directors and Increasing the Accountability of Directors:
TDK Corporation has a small number of Directors (seven) to expedite the management decision-making process. At the same time, TDK Corporation has appointed disinterested, independent Outside Directors (three) in order to enhance the supervision of TDK Corporation’s management. In addition, the Directors’ terms of office are set at one year to give shareholders an opportunity to cast votes of confidence regarding Directors’ performance every business year.
③ Adoption of a Corporate Officer System for Expeditious Business Execution:
TDK Corporation has adopted a Corporate Officer system that separates the management decision-making and Director supervisory functions of the Board of Directors from the execution of business. Corporate Officers are in charge of business execution and carrying out decisions made by the Board of Directors and thereby expeditiously execute business operations in accordance with management decisions.
④ Establishment of Advisory Bodies to the Board of Directors (Business Ethics & CSR Committee, Disclosure Advisory Committee, Compensation Advisory Committee, and Nomination Advisory Committee):
The aim of the Business Ethics & CSR Committee is to ensure compliance with the TDK Corporate Motto, understanding of corporate ethics, and improvement of awareness of corporate social responsibility (CSR). To achieve this aim, the Directors, Company Auditors, Corporate Officers and all other members of TDK are made fully aware of the TDK Code of Conduct, which stipulates concrete standards of business conduct in compliance with TDK’s management philosophy, including TDK Corporate Motto and Corporate Principle, and social norms, including relevant laws, regulations, and international rules and the spirit thereof.
The Disclosure Advisory Committee reviews and examines important corporate information and disclosure materials of TDK that are required for investment decisions by shareholders and investors, to ensure that TDK discloses appropriate information in a comprehensive, accurate, timely, and impartial manner, in accordance with various laws and regulations regarding securities transactions and the rules and regulations of the stock exchanges on which TDK Corporation’s shares are listed.
The Compensation Advisory Committee, which is chaired by an Outside Director of TDK Corporation and includes outside specialists as its members, examines the remuneration system and the level of remuneration pertaining to Directors and Corporate Officers, as well as presidents and qualifying officers of principal TDK Corporation’s subsidiaries. It also reviews the transparency of the remuneration decision-making process and verifies whether such remuneration is reasonable in light of corporate business performance, individual performance, and general industry standards.
The Nomination Advisory Committee, which is chaired by an Outside Director of TDK Corporation, reviews the conditions expected for the post of Director, Company Auditor, and Corporate Officer and makes nominations.

In this way, the Nomination Advisory Committee ensures the appropriate election of Directors, Company Auditors, and Corporate Officers, and provides transparency in the decision-making process.
Under the foregoing corporate systems, the Company Auditors in charge of supervising management, ensure soundness, compliance, and transparency in TDK’s business operations by executing their duties pursuant to the Regulations of the Board of Company Auditors and the Code of Company Auditors’ Auditing Standards, and by auditing whether the Directors’ performance is appropriately and reasonably in compliance with relevant laws and regulations and the Articles of Incorporation.
Similarly, Directors in charge of management decision-making and supervision of business execution ensure soundness, compliance, and transparency in TDK’s business operations by executing their duties pursuant to the Regulations of the Directors’ Business and the Regulations of the Board of Directors established in accordance with relevant laws and regulations and the Articles of Incorporation. In addition, Corporate Officers in charge of business execution ensure soundness, compliance, and transparency in TDK’s business operations by executing their duties pursuant to the Regulations of the Corporate Officers’ Business and the Executive Committee Regulations.
TDK has established the following system to ensure compliance with all applicable securities and exchange laws and other similar laws and regulations of all relevant countries, as well as the rules and regulations of each stock exchange on which TDK Corporation’s shares are listed (hereinafter collectively referred to as the “Securities Regulations”).
(i) TDK will collect, record, analyze, process, summarize, and report all information required to be disclosed under the Securities Regulations. TDK has established an internal control system and methods to warrant timely disclosures within the deadlines stipulated by the Securities Regulations.
(ii) TDK has established a system to ensure that TDK has procedures designed to obtain reasonable assurance that all the transactions that TDK conducts are properly authorized, that TDK’s assets are protected from unauthorized or improper use, and that all trading activities are appropriately recorded and reported for the purpose of enabling TDK to prepare financial statements in accordance with applicable accounting standards.
(iii) TDK will ensure that the above-mentioned management system is in compliance with the requirements of the Securities Regulations with respect to corporate governance systems.
2. System under which information regarding the execution of business by Directors shall be reserved and controlled:
The President, who is responsible for the business execution of TDK, has established Document Control Regulations, which are applicable to TDK and provide basic rules for the preservation and control of information.
3. Regulations and other systems for managing the risk of loss(es):
With respect to the company-wide treatment of factors that obstruct the achievement of the business targets and business operations of TDK, TDK has established the Enterprise Risk Management Committee under the direct control of the Executive Committee. The Enterprise Risk Management Committee is chaired by a Corporate Officer appointed by the President, and promotes enterprise risk management. Corporate regulations, bylaws, guidelines, and departmental guidelines in each department provide for operating rules for specific risks, including legal, financial, and IT-related risks. These risks are managed by managers in charge of the particular areas of operation. In addition, in order to prepare for unexpected situations such as natural disasters, TDK established the Crisis Management Committee, chaired by the President, which developed the Business Continuity Plan (BCP). Accordingly, if such an unexpected situation arises, TDK will assess the situation immediately and respond appropriately. The Company Auditors and Management Review & Support Department, an internal audit group, regularly confirm the management operations described above to ensure that a structure for receiving advice in relation to operating business execution effectively is in place. In addition, TDK will periodically seek advice from specialists, including outside legal counsel and other experts, regarding new factors that may hinder TDK.
4. System for ensuring Directors execute their duties efficiently:
TDK Corporation has a small number of Directors and has adopted the Corporate Officer system to facilitate the Directors’ ability to make quick and efficient management decisions. At the same time, policies and measures with respect to business execution, such as development, manufacturing, marketing, and financing of TDK, are deliberated upon by the Executive Committee, which consists of Corporate Officers in senior positions ranking at or above the level of Senior Vice President and other Corporate Officers designated by the President. All Corporate Officers perform their duties expeditiously pursuant to the decisions made by the Executive Committee. TDK ensures efficient management via proposals to the Board of Directors and regular reports from Corporate Officers to the Executive Committee. In addition, TDK establishes midterm management targets shared by all members of TDK and strives to inform all employees of such targets. TDK

also establishes systems that enable it to understand the targets and implementation plans of each department as well as the progress of each department in relation to such goals.
5. System for ensuring employees’ performance of duties is in compliance with laws and regulations and the Articles of Incorporation:
TDK strives to ensure that all Directors, Company Auditors, Corporate Officers, and employees are fully familiar with TDK’s management philosophy, Corporate Charter of Business Behavior, Corporate Ethical Philosophy and Corporate Standards of Business Conduct in order to ensure improved soundness, compliance, and transparency of management, as well as compliance with laws, regulations, and the Articles of Incorporation throughout TDK’s business operations. Furthermore, TDK has established a corporate ethics management system under the Business Ethics & CSR Committee, to regularly monitor TDK’s compliance with corporate ethics, including TDK Corporation’s subsidiaries worldwide. A consultation office (with help lines) also enables employees to directly report all relevant information and opinions concerning compliance within TDK.
6. System for ensuring proper business execution by the corporate group consisting of the relevant stock company, its parent company and subsidiaries:
Each Director, Corporate Officer and manager in charge of operations strives to achieve proper business operations by making decisions in accordance with the TDK Code of Conduct, and the Job Authority Regulations and applicable corporate regulations for entire TDK, in order to maintain soundness, compliance, and transparency in business operations, and to achieve business targets, of TDK Corporation and TDK. The Company Auditors audit, on a regular basis, the condition of the business operations of each department of TDK Corporation and TDK by researching the departments, examining important documents, and attending important meetings. In addition, the Management Review & Support Department audits and supports each department of TDK Corporation and TDK in order to promote consistency in relation to business operations and management policies, appropriateness regarding management efficiency, and compliance with relevant laws and regulations.
7. Matters relating to employees who support the duties of Company Auditors when Company Auditors request such employees:
The Company Auditors Office, consisting of designated full-time employees who do not perform any business execution duties, assists the Company Auditors.
8. Matters regarding the independence of employees from Directors in the preceding item:
The Company Auditors shall directly evaluate the performance of the employees who serve as members of the Company Auditors Office, and any transfer or discipline of these employees shall be determined pursuant to the operating rules of TDK subject to the consent of the Company Auditors. In addition, any employee who has been instructed or ordered by a Company Auditor in connection with audit duties shall not be subject to any Director’s instruction or order with respect to said Company Auditor’s instruction or order.
9. System for ensuring Directors or employees report to Company Auditors and for ensuring other reports to Company Auditors:
Minutes of Management Committee meetings and other meetings are submitted immediately to the Company Auditors, and information regarding business execution by Corporate Officers and the TDK’s approach to management policies and targets is also provided to them. Furthermore, Company Auditors attend important meetings, including meetings of Management Committees and the Business Plan Review Meeting, and may receive explanations directly from Corporate Officers and other personnel, as necessary. Moreover, management reports prepared by each business department executing business operations are submitted to Company Auditors, who also monitor the condition of the business operations throughout TDK. In addition, information regarding the activities of the Business Ethics & CSR Committee, the Enterprise Risk Management Committee, and other committees is provided to Company Auditors from time to time, enabling the Company Auditors to confirm the overall status of corporate activities.
10. System for ensuring Company Auditors conduct audits effectively:
The Company Auditors and the Board of Company Auditors meet with the Representative Directors on a regular basis to confirm management policies and exchange opinions on pressing issues and risks affecting TDK and other important matters from the perspective of the Company Auditors’ audits. These meetings also strengthen the mutual understanding between the Company Auditors and the Representative Directors. Furthermore, the Company Auditors and the Management Review & Support Department meet regularly and

also receive regular audit reports from the Accounting Auditor. Company Auditors conduct efficient audits by sharing information regarding initial audit plans and results.
11. Overview of current system and reason for adoption
TDK Corporation is a company with a board of company auditors and has implemented various measures to strengthen its corporate governance. In 2002, efforts to reform governance included the introduction of an executive officer system along with a significant reduction in the number of Directors for the purpose of clearly separating management’s monitoring and execution functions. In addition, to fortify the system for boosting shareholders’ confidence, we shortened the term of office of Directors from 2 years to 1 year and actively invited the participation of Outside Directors.
In addition, TDK Corporation has established 4 committees acting as subordinate organizations to the Board of Directors, namely the Business Ethics & CSR Committee and Compensation Advisory Committee formed in 2002, the Disclosure Advisory Committee formed in 2005 and the Nomination Advisory Committee formed in 2008) to exact our business ethics and fulfill our social responsibilities as well as strengthen our management supervision functions and framework for fulfilling our duty of explanation to our shareholders and investors.
In short, TDK Corporation has always believed it can realize a system to continuously ensure sound, compliant and transparent management through the introduction of a new framework that strengthens corporate governance based on its Company Auditor System.
12. Matters regarding Outside Directors and Outside Company Auditors
Appointment of Outside Directors and Outside Company Auditors
TDK is actively inviting Outside Directors to participate in our organization for the purpose of strengthening management supervision functions, and building a management conscious of our various stakeholders including shareholders and an effective and disciplined corporate governance framework. As a result, as of March 31, 2014 and the date of filing of this Annual Securities Report, three of the seven Directors are Outside Directors and three of the five Company Auditors are Outside Company Auditors, making Outside Directors and Outside Company Auditors represent 50% of the total number of Officers.
The Outside Directors confirm significant issues that have become evident with regards to the above policy (6. (1) paragraphs 3, 6 and 10, the same share apply hereafter) through reports from Corporate Officers and others in the Board of Directors and express their opinions as necessary to fulfill their supervisory function. Furthermore, the Outside Company Auditors confirm the details of the above policy through reports from the full-time Company Auditors and reports from the Accounting Auditors and discuss the details of such reports to fulfill their supervisory function.
Criteria for independence of Outside Directors and Outside Company Auditors
In order to secure the independence of the Outside Directors and Outside Company Auditors it invites, TDK Corporation has established “items to be verified regarding independence” with reference to such criteria as Rule 436-2 of the Securities Listing Regulation regarding securing independent directors/auditors and Rule III. 5. (3)-2 of Guidelines Concerning Listed Company Compliance, etc., both of which are stipulated by Tokyo Stock Exchange, Inc. The outline of these items is as follows.
(1) In cases where the relevant Outside Director/Company Auditor has a business relationship with TDK
An Outside Director/Company Auditor shall be judged not to be independent if they are at present, or have been during the past five years, a party with a business relationship with TDK as described in (i) below, or a person who executes business for such party, or if (ii) below applies to them.
(i) Where it is recognized, objectively and reasonably, that such business relationship is necessary for, or has a substantial influence on, the continued operation of TDK or the other party to such business relationship (where there is a high degree of dependence in the relationship, where the relationship is the source of 2% or more of consolidated sales, and where the other party to the relationship receives money or other assets from TDK other than remuneration for officers)
(ii) Where it is recognized within TDK that the relevant Outside Director/Company Auditor is involved in the business relationship with the other party to such relationship
(2) In cases where the relevant Outside Director/Company Auditor is a consultant, an accounting professional or a law professional
An Outside Officer shall be judged not to be independent if any of the following cases apply to such person at present or have applied to such person during the past five years.
(i) Where it is recognized, objectively and reasonably, that the relevant Outside Director/Company Auditor (including candidates for such position; the same shall apply hereinafter) cannot perform duties as an Independent Outside Director/Company Auditor because they receive money or other assets from TDK other than remuneration for officers (where there is a high degree of dependence)

(ii) Where it is recognized, objectively and reasonably, that the relevant Outside Director/Company Auditor cannot perform duties as an Independent Outside Director/Company Auditor because the organization to which such person belongs (hereinafter the “Relevant Organization”) receives money or other assets from the TDK other than remuneration for officers (where this income is equivalent to 2% or more of total annual remuneration)
(iii) Where TDK has a high degree of dependence on a professional or a Relevant Organization, such as a case where services, etc. rendered by such party are essential to the corporate management of TDK or it would be difficult to find an alternative provider of the same services, etc.
(iv) Where it is recognized within TDK that the relevant Outside Director/Company Auditor is involved with the services, etc. provided by the Relevant Organization
(3) In the case of a close relative of the relevant Outside Director/Company Auditor
An Outside Director/Company Auditor shall be judged not to be independent if either of the following cases apply to their close relative at present or have applied to them during the past five years.
(i) A person to whom (1) or (2) above applies (except persons without material significance)
(ii) A person who executes business for TDK Corporation or a subsidiary of TDK Corporation (except persons without material significance)
TDK Corporation has in place a Nomination Advisory Committee as an advisory body to the Board of Directors which is chaired by an Outside Director and of which more than half of the members are composed of Outside Directors. In accordance with the “items to be verified regarding independence” shown above, the committee investigates and deliberates over the independence of the candidates for Outside Directors and Outside Company Auditors (including cases where there is a change in an Outside Director/Company Auditor’s status of independence during their current term of office). After making a comprehensive judgment on the independence of candidates, the committee reports the results of its deliberations to the Board of Directors.
Taking into account the above, TDK Corporation has notified all of the Outside Directors and Outside Company Auditors to the Tokyo Stock Exchange as independent directors/auditors pursuant to Rule 436-2 of the Securities Listing Regulations of Tokyo Stock Exchange, Inc.
Activities during the fiscal year under review.
Attendance at meetings of the Board of Directors, etc. during the fiscal year under review is as follows.
Kenichi Mori (Outside Director): All 12 meetings of the Board of Directors, 2 meetings of the Nomination Advisory Committee, 2 meetings of the Compensation Advisory Committee
Yukio Yanase (Outside Director): All 12 meetings of the Board of Directors, 2 meetings of the Nomination Advisory Committee, 5 meetings of the Compensation Advisory Committee
Makoto Sumita (Outside Director): All 9 meetings of the Board of Directors, 3 meetings of the Compensation Advisory Committee (Appointed as Outside Director at the closing of the 117th Ordinary General Meeting of Shareholders on June 27, 2013)
Osamu Nakamoto (Outside Company Auditor): All 13 meetings of the Board of Company Auditors, all 12 meetings of the Board of Directors
Koichi Masuda (Outside Company Auditor): 12 of 13 meetings of the Board of Company Auditors, 11 of 12 meetings of the Board of Directors
Kazunori Yagi (Outside Company Auditor): 8 of 9 meetings of the Board of Company Auditors, 8 of 9 meetings of the Board of Directors (Appointed as Outside Company Auditor at the closing of the 117th Ordinary General Meeting of Shareholders on June 27, 2013)
Outside Directors participate as committee chairman and members of the Nomination Advisory Committee and Compensation Advisory Committee, which are advisory bodies to the Board of Directors, and in doing so, contribute to the transparency of the personnel and remuneration determination process and the adequacy of appointments and remunerations.
13. Appointment of Company Auditors with knowledge of finance and accounting
Full-time Company Auditor Osamu Yotsui has 22 total years of experience in financing and accounting of TDK and, thus, has considerable knowledge in this field.
Outside Company Auditor Koichi Masuda is a Certified Public Accountant and, thus, has considerable knowledge of financing and accounting.
Outside Company Auditor Kazunori Yagi has the experience of serving for many years in the fields of accounting and corporate planning at Yokogawa Electric Corporation, and thus possesses considerable knowledge as regards financing and accounting.
14. Limited liability agreements with Outside Directors and Outside Company Auditors
TDK Corporation entered into contracts with all of the Outside Directors and Outside Company Auditors pursuant to Article 427 paragraph 1 of the Companies Act to limit the liabilities of each such Outside Director/Outside Company Auditor to TDK Corporation under Article 423 paragraph 1 of the same act to the amount set forth in each such contact, which amount shall be equal to or greater than the amount provided for in Article 425 paragraph 1 of the same act. This is for the purpose of enabling Outside Directors and Outside Company Auditors to fulfill their roles sufficiently.
15. Overview of personal and capital relationships or other interests between TDK and its Outside Directors and Outside Company Auditors
Special interests between TDK and its Outside Directors and Outside Company Auditors
There are no special interests between TDK and any of its current Outside Directors and Outside Company Auditors (three Outside Directors and three Outside Company Auditors).
Business relationships between TDK and companies where Outside Directors and Outside Company Auditors serve or have served as officers
Business relationships between TDK and companies where Outside Directors and Outside Company Auditors have served as officers are as follows.
・ Outside Director Yukio Yanase served at The Asahi Bank, Ltd. (currently Resona Bank, Ltd.) from April 1968 to June 2003, and his final position at the bank was President. Resona Bank, Ltd. is a creditor of TDK, and the amount of TDK’s borrowings from the bank is ¥47,000 million as of March 31, 2014. Since eleven years have passed from the time of Mr. Yanase’s retirement from the bank to the filing date of this Annual Securities Report, there are no special interests between Mr. Yanase and the bank. Furthermore, as is the case with other banks, TDK’s borrowings from the bank occur purely as part of the normal transactions between a business corporation and a bank. Since Mr. Yanase has no power to exercise any influence on the relevant borrowings, he is sufficiently independent.
・ Regarding all other Outside Directors and Outside Company Auditors, they either have no business relationships with TDK or their relationships with TDK are immaterial in the light of TDK’s “Criteria for independence of Outside Directors and Outside Company Auditors” as mentioned above. As such, they are all sufficiently independent.
・
16. Number of Directors
TDK Corporation’s Articles of Incorporation stipulate that the number of Directors of TDK Corporation shall be ten or less.
17. Resolution requirements for election and dismissal of Directors
TDK Corporation’s Articles of Incorporation stipulate that resolutions of the General Meeting of Shareholders concerning the election or dismissal of Directors shall be adopted by an affirmative vote of a majority of the voting rights of shareholders present at the General Meeting of Shareholders, a quorum for which shall be the presence of shareholders with one-third (1/3) or more of the voting rights exercisable for such meeting.
18. Items for resolution by the General Meeting of Shareholders that can be approved by resolution by the Board of Directors
1) Acquisition of treasury stock
Pursuant to Article 165, paragraph 2 of the Companies Act, for the purpose of enabling the execution of flexible capital policy, TDK Corporation’s Articles of Incorporation provide for the acquisition of treasury stock to be possible by resolution at the Board of Directors meeting.

2) Interim dividend
TDK Corporation’s Articles of Incorporation provide that TDK Corporation may distribute an interim dividend with the record date of September 30 each year by resolution of the Board of Directors, pursuant to the provisions of Article 454, paragraph 5 of the Companies Act, to the effect that TDK Corporation may flexibly distribute profits to shareholders.
19. Requirements of special resolution of the General Meeting of Shareholders
TDK Corporation’s Articles of Incorporation stipulate that special resolutions of the General Meeting of Shareholders as provided for in Article 309, paragraph 2 of the Companies Act shall be adopted by an affirmative vote of two-thirds (2/3) or more of the voting rights of shareholders present at the General Meeting of Shareholders, a quorum for which shall be the presence of shareholders with one-third (1/3) or more of the voting rights exercisable for such meeting. This constitutes an easier quorum for special resolutions, which has been provided to facilitate the smooth conduct of General Meeting of Shareholders.
20. Details of Director and Company Auditor Remunerations
Remuneration and other payments to Directors and Company Auditors for the fiscal year under review are as follows.
Officer category
Total amount of remuneration
and other payments
(Millions of yen)
Total amount of remuneration and other payments by type
(Millions of yen) Number of eligible officers
Basic remuneration
Results-linked bonus
Stock-linked compensation stock options
Directors (Excluding Outside Directors)
311 175 81 55 4
Outside Directors 42 42 4
Company Auditors (Excluding Outside Company Auditors)
58 58 2
Outside Company Auditors 27 27 4
Although there were three Outside Directors and three Outside Company Auditors as of March 31, 2014, in the table above, the number of eligible officers, the total amount of remuneration and other payments and the basic remuneration in the breakdown thereof include remuneration and other payments paid to one Outside Director and one Outside Company Auditor who retired at the closing of the 117th Ordinary General Meeting of Shareholders held on June 27, 2013.
A breakdown of remuneration and other payments for individuals receiving a total of ¥100 million or more is provided below.
Name Officer category
Company category
Total amount of remuneration and other payments by type
(Millions of yen)
Total amount of
remuneration and other payments (Millions of
yen) Basic
remunerationResults-linked
bonus
Stock-linked compensation stock options
Takehiro Kamigama
Representative Director, President and CEO
Filing company 72 35 22 129
21. Policy and determination method regarding the amounts of remuneration and other payments for Directors and Company Auditors of the Company and its method of calculation
1) Policy on remuneration
(1) Purpose of remuneration system
TDK Corporation’s remuneration system is designed for the following purpose based on the consultation and deliberation of the Compensation Advisory Committee (see 2) Remuneration determination process below for the detail), an advisory body to the Board of Directors.
By constantly pursuing the formulation of a competitive remuneration system that focuses on linkage with short-term as well as mid- to long-term results, TDK promotes as much as possible behavior on the part of officers geared towards enhancing corporate results and stock value to constantly increase the corporate value of overall TDK.
(2) Remuneration level
TDK Corporation aims to set remuneration at levels enabling the maintenance of competitiveness compared with other companies in the same business category or of similar scale in different business categories. The adequacy of its level is examined by the Compensation Advisory Committee based on studies, etc. on corporate management remuneration by third parties effected periodically.
(3) Composition of remuneration
a. Remuneration for Directors who execute business
Composed of basic remuneration, results-linked bonus and stock-linked compensation stock options
b. Remuneration for Directors who do not execute business
Composed of basic remuneration and stock-linked compensation stock options
c. Remuneration for Outside Directors
Basic remuneration only
d. Remuneration for Company Auditors
Basic remuneration only
(4) Results linkage system
a. Short-term results linkage system (results-lined bonus)
A system whereby remuneration fluctuates depending on the single-year consolidated results (operating income, ROA, etc.) and degree of attainment of results of the position in charge.
b. Mid- to long-term results linkage system (stock-linked compensation stock options)
Stock-linked compensation stock options are granted with the number of shares calculated based on their value at the time of grant depending on the amount of stock option remuneration determined for each position. This is an effective stock option grant similar to the disbursement of actual TDK Corporation’s stock whereby recipients have the same advantage of a rising TDK Corporation’s stock value and the same risk of it falling as regular shareholders. The introduction of such a system is to further increase the ambition and morale of eligible Directors with respect to the enhancement of results and stock value. TDK Corporation has established Corporate Stock Ownership Guidelines. TDK Corporation makes an effort to ensure that eligible Directors hold at least a certain number of shares in TDK Corporation pursuant to their rank, including stock-linked compensation stock options.
2) Remuneration determination process (establishment and operation of the Compensation Advisory Committee)
In order to achieve the purpose of the aforementioned remuneration system, TDK Corporation has in place a “Compensation Advisory Committee” acting as an advisory body to the Board of Directors, composed of Outside Directors (among whom one is committee chairman), external experts and an officer in charge of personnel.
The Committee deliberates on the system and level of remuneration for TDK Corporation’s Directors and Executive Officers and examines the transparency of the remuneration determination process as well as the adequacy of individual remuneration from the perspective of corporate results, individual results and general public levels, among other factors.

22. Share ownership
1) Total number of issues and balance sheet amounts for investment stock whose holding purpose is other than for net investment
25 issues ¥15,868 million
2) Issues, number of shares, balance sheet amounts and holding purpose of investment stock whose holding purpose is other than for net investment
As of March 31, 2013
Specified investment stocks
Issue Number of
shares (Shares)
Balance sheet amounts
(Millions of yen)Holding purpose
TOSHIBA CORPORATION 3,839,000 1,812 Maintaining and Strengthening business to business transactions
Imation Corporation 4,812,390 1,728 Maintaining and Strengthening business to business transactions
Tabuchi Electric Co., Ltd. 8,000,000 1,544 Maintaining and Strengthening business to business transactions
Mabuchi Motor Co., Ltd. 300,000 1,527 Maintaining and Strengthening business to business transactions
Panasonic Corporation 2,000,000 1,308 Maintaining and Strengthening business to business transactions
ALPS LOGISTICS CO., LTD. 1,402,200 1,306 Maintaining and Strengthening business to
business transactions
BROTHER INDUSTRIES, LTD. 968,000 952 Maintaining and Strengthening business to
business transactions
Fukuda Denshi Co., Ltd. 269,100 914 Maintaining and Strengthening business to business transactions
NIKKO COMPANY 2,500,000 317 Maintaining and Strengthening business to business transactions
SIIX Corporation 26,822 38 Maintaining and Strengthening business to business transactions
IBIDEN CO., LTD. 8,992 13 Maintaining and Strengthening business to business transactions
FIDEA Holdings Co. Ltd. 32,541 7 Maintaining and Strengthening business to business transactions

Regarded as holding shares
Issue Number of
shares (Shares)
Balance sheet amounts
(Millions of yen)Holding purpose
DENSO CORPORATION 285,000 1,135 Maintaining and Strengthening business to business transactions
KYOCERA Corporation 105,000 925 Maintaining and Strengthening business to business transactions
OMRON Corporation 364,000 844 Maintaining and Strengthening business to business transactions
Foster Electric Company, Limited 587,000 755 Maintaining and Strengthening business to
business transactions
Panasonic Corporation 999,000 653 Maintaining and Strengthening business to business transactions
TODA KOGYO CORP. 1,994,000 636 Maintaining and Strengthening business to business transactions
Mitsubishi Electric Corporation 700,000 529 Maintaining and Strengthening business to
business transactions
Mitsubishi UFJ Financial Group, Inc. 817,000 455 Maintaining and Strengthening business to
business transactions
Sony Corporation 220,000 361 Maintaining and Strengthening business to business transactions
Tokio Marine Holdings, Inc. 129,500 343 Maintaining and Strengthening business to business transactions
Shinko Shoji Co., Ltd. 349,000 309 Maintaining and Strengthening business to business transactions
SUMIDA CORPORATION 329,500 167 Maintaining and Strengthening business to business transactions
ANRITSU CORPORATION 77,000 83 Maintaining and Strengthening business to business transactions
Ricoh Company, Ltd. 108,000 86 Maintaining and Strengthening business to business transactions
ADVANTEST CORPORATION 63,000 84 Maintaining and Strengthening business to
business transactions
Note: Specified investment stocks and regarded as holding shares are not combined when selecting the top issues by balance sheet amount.

As of March 31, 2014
Specified investment stocks
Issue Number of
shares (Shares)
Balance sheet amounts
(Millions of yen)Holding purpose
Tabuchi Electric Co., Ltd. 8,000,000 5,768 Maintaining and Strengthening business to business transactions
Imation Corporation 4,812,390 2,858 Maintaining and Strengthening business to business transactions
Mabuchi Motor Co., Ltd. 300,000 2,028 Maintaining and Strengthening business to business transactions
TOSHIBA CORPORATION 3,839,000 1,677 Maintaining and Strengthening business to business transactions
ALPS LOGISTICS CO., LTD. 1,402,200 1,458
Maintaining and Strengthening business to business transactions
Fukuda Denshi Co., Ltd. 269,100 1,225 Maintaining and Strengthening business to business transactions
NIKKO COMPANY 2,500,000 312 Maintaining and Strengthening business to business transactions
SIIX Corporation 30,082 50 Maintaining and Strengthening business to business transactions
IBIDEN CO., LTD. 11,288 22 Maintaining and Strengthening business to business transactions
FIDEA Holdings Co. Ltd. 32,541 6 Maintaining and Strengthening business to business transactions

Regarded as holding shares
Issue Number of
shares (Shares)
Balance sheet amounts
(Millions of yen)Holding purpose
OMRON Corporation 364,000 1,550 Maintaining and Strengthening business to business transactions
KYOCERA Corporation 210,000 977 Maintaining and Strengthening business to business transactions
Mitsubishi Electric Corporation 700,000 813
Maintaining and Strengthening business to business transactions
Foster Electric Company, Limited 587,000 737
Maintaining and Strengthening business to business transactions
TODA KOGYO CORP. 1,994,000 516 Maintaining and Strengthening business to business transactions
Sony Corporation 220,000 433 Maintaining and Strengthening business to business transactions
Tokio Marine Holdings, Inc. 129,500 401 Maintaining and Strengthening business to business transactions
Shinko Shoji Co., Ltd. 349,000 328 Maintaining and Strengthening business to business transactions
SUMIDA CORPORATION 329,500 188 Maintaining and Strengthening business to business transactions
Mitsubishi UFJ Financial Group, Inc. 260,000 147
Maintaining and Strengthening business to business transactions
Ricoh Company, Ltd. 108,000 128 Maintaining and Strengthening business to business transactions
ANRITSU CORPORATION 77,000 91 Maintaining and Strengthening business to business transactions
ADVANTEST CORPORATION 63,000 70
Maintaining and Strengthening business to business transactions
DENKYOSHA CO., LTD. 111,000 63 Maintaining and Strengthening business to business transactions
CASIO COMPUTER CO., LTD. 50,000 61
Maintaining and Strengthening business to business transactions
Sumitomo Mitsui Trust Holdings, Inc. 103,000 47
Maintaining and Strengthening business to business transactions
MITSUMI ELECTRIC CO., LTD. 52,000 38
Maintaining and Strengthening business to business transactions
PIONEER CORPORATION 162,000 35 Maintaining and Strengthening business to business transactions
Resona Holdings, Inc. 61,300 30 Maintaining and Strengthening business to business transactions
Hitachi Kokusai Electric Inc. 12,000 14
Maintaining and Strengthening business to business transactions
Note: Specified investment stocks and regarded as holding shares are not combined when selecting the top issues by balance sheet amount.
23. Circumstances of accounting audit and details of remunerations for auditing
TDK has an auditing agreement with KPMG AZSA LLC for this company to conduct the accounting audit of TDK.
The three certified public accountants who conducted the accounting audit of TDK were Hiroyuki Sakai, Junichi Obi and Masahiro Sasaki, and all were Designated Limited Liability Partners and Engagement Partners affiliated with KPMG AZSA LLC. The number of years of continued audits is seven years or less.
In addition, working to assist the above accountants in conducting the accounting audit of TDK were 11 certified public accountants, 9 assistant certified public accountants, and 18 other people.

(2) Audit fees, etc. a. Details of fees to auditors
(Millions of yen)
Category FY2013 FY2014
Audit fees Fees for non-attest service Audit fees Fees for non-attest
service
Filing company 309 – 295 –
Consolidated subsidiaries 152 – 141 –
Total 461 – 436 –
b. Details of other material fees
In fiscal 2013 and fiscal 2014, principal overseas consolidated subsidiaries of TDK pay audit fees to member firms of KPMG to which KPMG AZSA LLC, TDK’s auditors, belong.
c. Details of non-attest service rendered by auditors to the filing company
No items to report
d. Policy of deciding audit fees
TDK carefully considers the independence of auditors and decides the audit fees by resolution of the Board of Directors.

V. Consolidated Financial Statements and Notes to Consolidated Financial Statements
Consolidated statements of operations U.S. DollarsFor the years ended March 31, 2014, 2013 and 2012 Yen (Thousands)
(Millions) (Note 2)2014 2013 2012 2014
Net sales ¥ 984,525 841,847 802,534 $ 9,558,495Cost of sales 763,572 668,258 624,271 7,413,320
Gross profit 220,953 173,589 178,263 2,145,175Selling, general and administrative expenses 184,337 149,974 157,886 1,789,680Production realignment costs (Note 24) - 1,561 6,570 - Realignment-related gain; Sale of properties (Note 24) - - (6,732) -
Operating income 36,616 22,054 20,539 355,495Other income (deductions):
Interest and dividend income 3,365 2,893 1,986 32,670Interest expense (3,457) (2,842) (2,977) (33,563)Gain (loss) on securities, net (Note 3) 2,136 (714) (4,236) 20,738Equity in earnings of affiliates (Note 4) 1,444 (2,388) (557) 14,019Foreign exchange gain (loss) (1,302) (136) (787) (12,641)Other - net 970 898 700 9,418
3,156 (2,289) (5,871) 30,641Income from continuing operations before income taxes 39,772 19,765 14,668 386,136
Income taxes (Note 7) 17,936 14,616 11,970 174,136Income from continuing operations 21,836 5,149 2,698 212,000
Discontinued operations (Note 22):Loss from discontinued operations (5,580) (907) (5,788) (54,175)Income taxes (1,978) (288) (1,389) (19,204)
Loss from discontinued operations (3,602) (619) (4,399) (34,971)Net income (loss) 18,234 4,530 (1,701) 177,029
Less: Net income (loss) attributable to noncontrolling interests 1,946 3,335 753 18,893Net income (loss) attributable to TDK ¥ 16,288 1,195 (2,454) $ 158,136
Amounts per share: Yen U.S. Dollars(Note 2)
Income (loss) from continuing operationsattributable to TDK (Note 20):
Basic ¥ 150.55 14.48 10.13 $ 1.46 Diluted 142.01 10.33 7.77 1.38Loss from discontinued operations
attributable to TDK (Note 20): Basic (21.08) (4.98) (29.19) (0.20) Diluted (21.08) (4.98) (29.19) (0.20)Net income (loss) attributable to TDK (Note 20): Basic ¥ 129.47 9.50 (19.06) $ 1.26 Diluted 120.97 5.36 (21.42) 1.17
Cash dividends paid during the year (Note 9) ¥ 60.00 80.00 80.00 $ 0.58
Consolidated statements of comprehensive income U.S. DollarsFor the years ended March 31, 2014, 2013 and 2012 Yen (Thousands)
(Millions) (Note 2)2014 2013 2012 2014
Net income (loss) ¥ 18,234 4,530 (1,701) $ 177,029Other comprehensive income (loss), net of taxes:
Foreign currencies translation adjustments 60,544 76,712 (5,653) 587,806Pension liability adjustments 7,187 (1,957) (8,327) 69,777Net unrealized gains (losses) on securities 4,722 (557) 840 45,844
Total other comprehensive income (loss) 72,453 74,198 (13,140) 703,427Comprehensive income (loss) 90,687 78,728 (14,841) 880,456Comprehensive income (loss) attributable to noncontrolling interests 3,248 5,700 1,565 31,534Comprehensive income (loss) attributable to TDK ¥ 87,439 73,028 (16,406) $ 848,922See accompanying notes to consolidated financial statements.
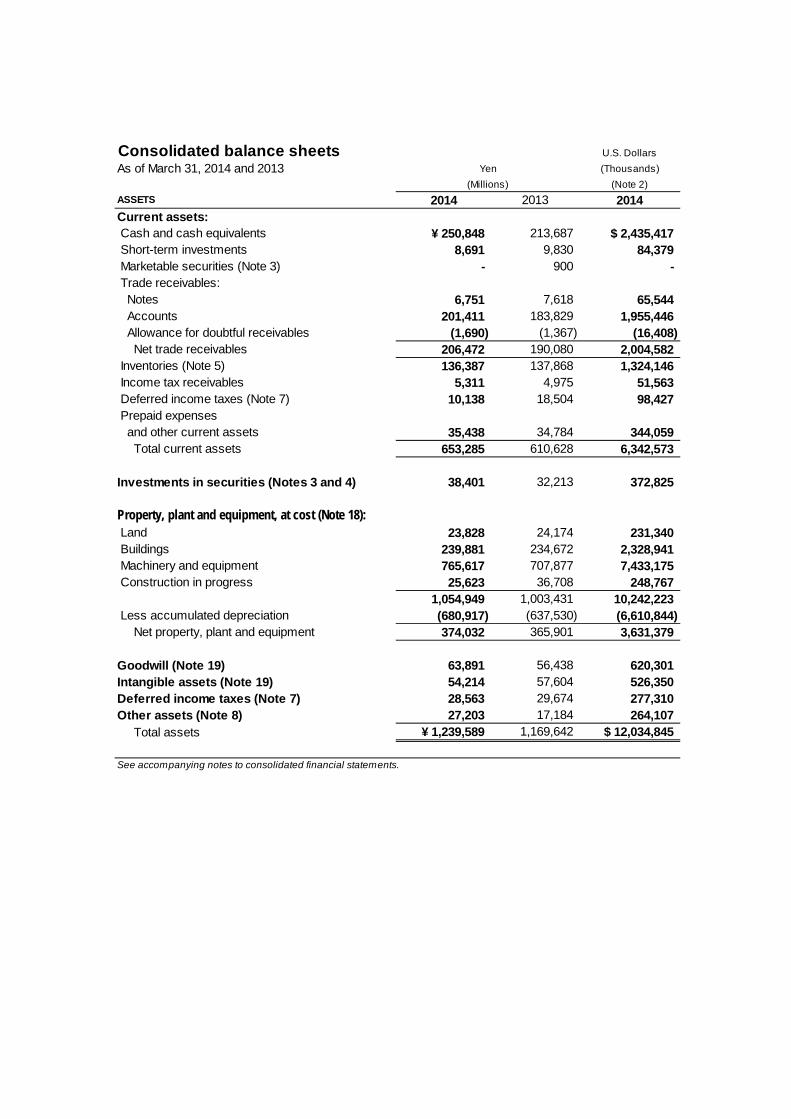
Consolidated balance sheets U.S. DollarsAs of March 31, 2014 and 2013 (Thousands)
(Note 2)ASSETS 2014 2013 2014Current assets: Cash and cash equivalents ¥ 250,848 213,687 $ 2,435,417 Short-term investments 8,691 9,830 84,379 Marketable securities (Note 3) - 900 - Trade receivables: Notes 6,751 7,618 65,544 Accounts 201,411 183,829 1,955,446 Allowance for doubtful receivables (1,690) (1,367) (16,408) Net trade receivables 206,472 190,080 2,004,582 Inventories (Note 5) 136,387 137,868 1,324,146 Income tax receivables 5,311 4,975 51,563 Deferred income taxes (Note 7) 10,138 18,504 98,427 Prepaid expenses and other current assets 35,438 34,784 344,059 Total current assets 653,285 610,628 6,342,573
Investments in securities (Notes 3 and 4) 38,401 32,213 372,825
Property, plant and equipment, at cost (Note 18): Land 23,828 24,174 231,340 Buildings 239,881 234,672 2,328,941 Machinery and equipment 765,617 707,877 7,433,175 Construction in progress 25,623 36,708 248,767
1,054,949 1,003,431 10,242,223 Less accumulated depreciation (680,917) (637,530) (6,610,844) Net property, plant and equipment 374,032 365,901 3,631,379
Goodwill (Note 19) 63,891 56,438 620,301Intangible assets (Note 19) 54,214 57,604 526,350Deferred income taxes (Note 7) 28,563 29,674 277,310Other assets (Note 8) 27,203 17,184 264,107 Total assets ¥ 1,239,589 1,169,642 $ 12,034,845
See accompanying notes to consolidated financial statements.
Yen(Millions)

U.S. Dollars(Thousands)
(Note 2)LIABILITIES AND EQUITY 2014 2013 2014Current liabilities: Short-term debt (Note 6) ¥ 132,237 146,624 $ 1,283,854 Current installments of long-term debt (Note 6) 37,147 51,515 360,651 Trade payables: Notes 19,643 15,813 190,709 Accounts 76,045 69,202 738,301 Accrued salaries and wages 42,299 36,779 410,670 Accrued expenses (Note 8) 44,365 39,870 430,728 Income taxes payables (Note 7) 7,922 4,110 76,913 Other current liabilities (Note 7) 14,123 14,022 137,116 Total current liabilities 373,781 377,935 3,628,942
Long-term debt, excluding current installments (Note 6) 97,623 97,481 947,796
Retirement and severance benefits (Note 8) 93,777 94,521 910,457
Deferred income taxes (Note 7) 5,202 4,808 50,505
Other noncurrent liabilities (Note 7) 16,963 14,281 164,689 Total liabilities 587,346 589,026 5,702,389
Commitments and contingent liabilities (Notes 13 and 14)
TDK stockholders’ equity: Common stock Authorized 480,000,000 shares; issued 129,590,659 shares in 2014 and 2013; outstanding 125,814,338 shares in 2014 and 125,800,320 shares in 2013 32,641 32,641 316,903 Additional paid-in capital (Note 11) 57,635 64,199 559,563 Legal reserve (Note 9) 26,651 25,426 258,747 Retained earnings (Note 9) 624,919 617,377 6,067,175 Accumulated other comprehensive income (loss) (Note 12) (87,134) (159,016) (845,961) Treasury stock at cost; 3,776,321 shares in 2014
and 3,790,339 shares in 2013 (19,385) (19,458) (188,204) Total TDK stockholders’ equity 635,327 561,169 6,168,223Noncontrolling interests 16,916 19,447 164,233 Total equity 652,243 580,616 6,332,456 Total liabilities and equity ¥ 1,239,589 1,169,642 $ 12,034,845
Yen(Millions)
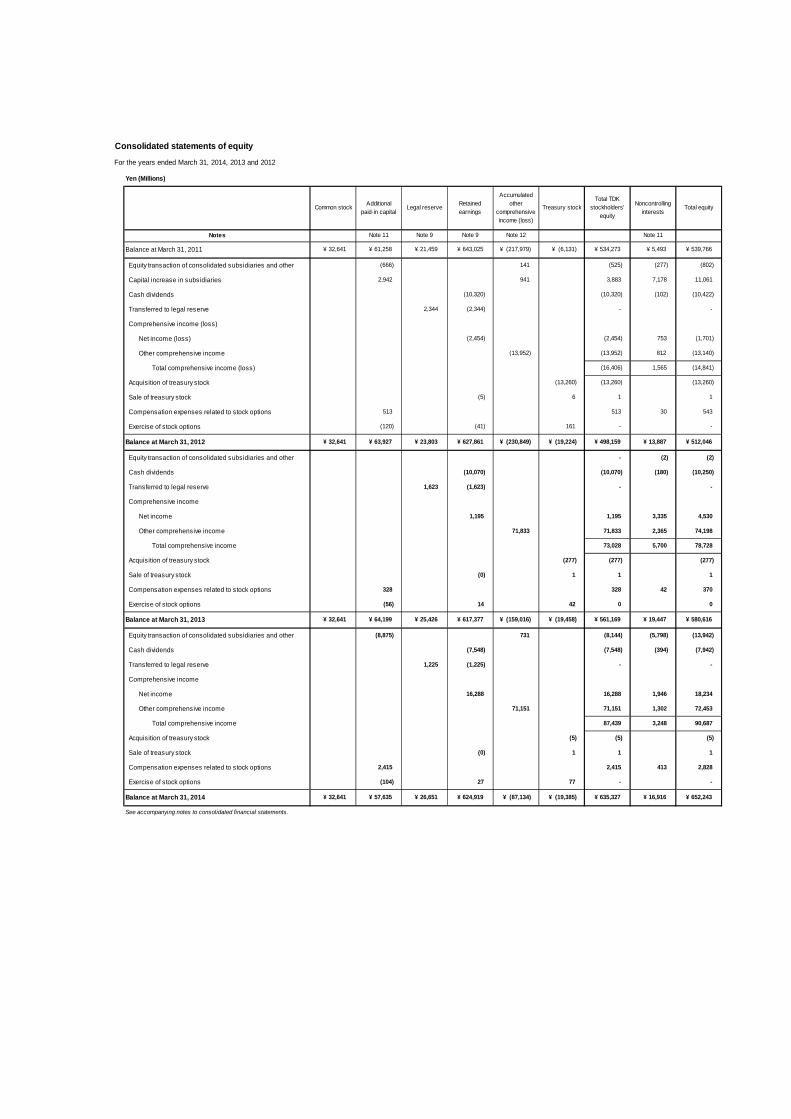
For the years ended March 31, 2014, 2013 and 2012
Yen (Millions)
Balance at March 31, 2011
Equity transaction of consolidated subsidiaries and other
Capital increase in subsidiaries
Cash dividends
Transferred to legal reserve
Comprehensive income (loss)
Net income (loss)
Other comprehensive income
Total comprehensive income (loss)
Acquisition of treasury stock
Sale of treasury stock
Compensation expenses related to stock options
Exercise of stock options
Balance at March 31, 2012
Equity transaction of consolidated subsidiaries and other
Cash dividends
Transferred to legal reserve
Comprehensive income
Net income
Other comprehensive income
Total comprehensive income
Acquisition of treasury stock
Sale of treasury stock
Compensation expenses related to stock options
Exercise of stock options
Balance at March 31, 2013
Equity transaction of consolidated subsidiaries and other
Cash dividends
Transferred to legal reserve
Comprehensive income
Net income
Other comprehensive income
Total comprehensive income
Acquisition of treasury stock
Sale of treasury stock
Compensation expenses related to stock options
Exercise of stock options
Balance at March 31, 2014
See accompanying notes to consolidated financial statements.
Total equity
Notes Note 11 Note 9 Note 9 Note 12 Note 11
Retainedearnings
Accumulatedother
comprehensiveincome (loss)
Treasury stockTotal TDK
stockholders'equity
Common stock Additionalpaid-in capital
Legal reserve Noncontrollinginterests
(2,454)
(13,952)
(16,406)
(2,454)
(13,952)
Consolidated statements of equity
¥ 512,046
1
543
753 (1,701)
30
¥ 539,766
-
(10,422)
(13,260)
-
(13,140)
(14,841)
812
1,565
¥ 32,641 ¥ 61,258 ¥ 21,459 ¥ 643,025 ¥ (217,979) ¥ (6,131) ¥ 534,273 ¥ 5,493
(525) (277) (802)
2,942 941 3,883
(666) 141
7,178 11,061
(13,260)
¥ 13,887
(13,260)
513
-
(10,320) (102) (10,320)
1
¥ (230,849) ¥ (19,224)¥ 23,803 ¥ 627,861 ¥ 498,159
(2,344) - 2,344
513
¥ 32,641 ¥ 63,927
(5) 6
(120) (41) 161
(2) - (2)
(10,070) (10,070) (180) (10,250)
1,623 (1,623)
3,335 4,530
- -
1,195 1,195
71,833 2,365 74,198
73,028
71,833
5,700 78,728
(277) (277) (277)
(0) 1 1 1
328 42 370
(56) 14 42 0
328
0
¥ 32,641 ¥ 64,199 ¥ 25,426 ¥ 617,377 ¥ (159,016) ¥ (19,458) ¥ 561,169 ¥ 19,447 ¥ 580,616
90,687 3,248 87,439
2,828 413 2,415
¥ 624,919¥ 26,651¥ 57,635¥ 32,641
- - 77 27 (104)
¥ 652,243¥ 16,916¥ 635,327¥ (19,385)¥ (87,134)
2,415
1 1 1 (0)
72,453 1,302 71,151 71,151
(5) (5) (5)
- - (1,225) 1,225
18,234 1,946 16,288 16,288
(8,875) (13,942) (5,798) (8,144) 731
(7,942) (394) (7,548) (7,548)
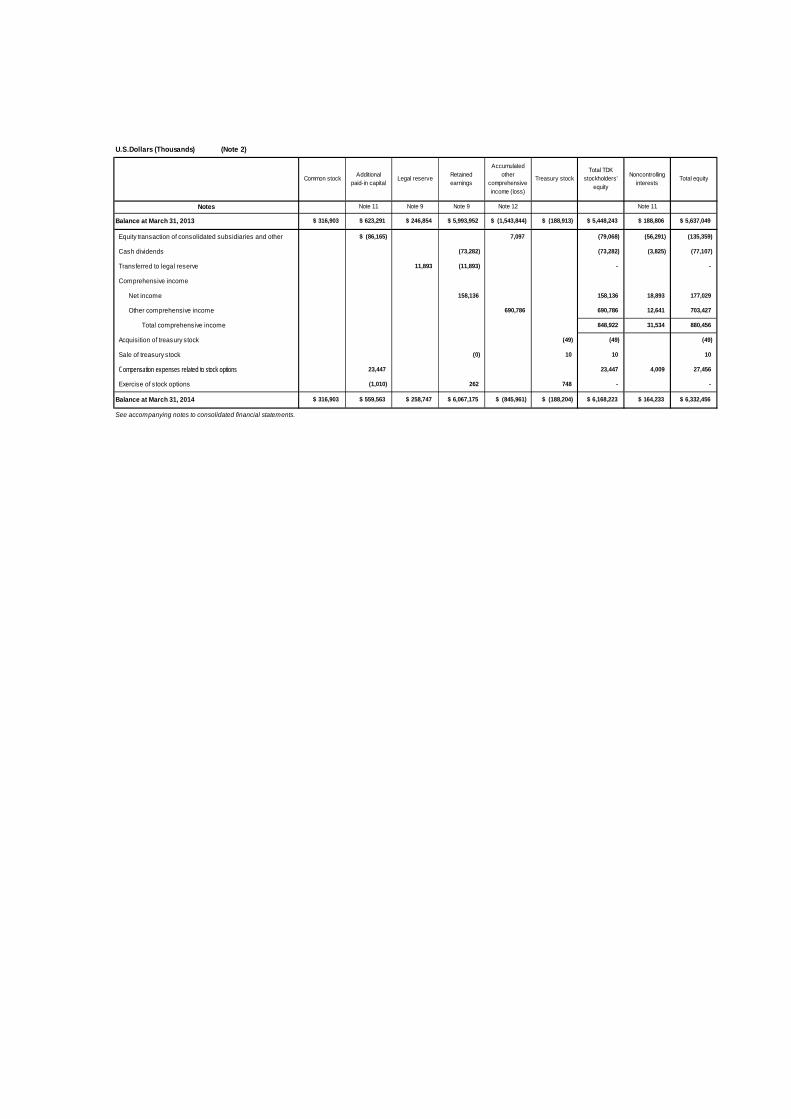
U.S.Dollars (Thousands) (Note 2)
Balance at March 31, 2013
Equity transaction of consolidated subsidiaries and other
Cash dividends
Transferred to legal reserve
Comprehensive income
Net income
Other comprehensive income
Total comprehensive income
Acquisition of treasury stock
Sale of treasury stock
Compensation expenses related to stock options
Exercise of stock options
Balance at March 31, 2014
See accompanying notes to consolidated financial statements.
$ 6,332,456
4,009 27,456
-
Notes Note 11 Note 9 Note 9
880,456
(49)
12,641 703,427
Note 12
177,029
(3,825)
-
18,893
$ (188,204)
(77,107)
Noncontrollinginterests
Total equity
$ 188,806
(56,291)
Note 11
$ 5,637,049
(135,359)
$ 6,168,223 $ 164,233$ 316,903 $ 559,563
$ (86,165)
31,534
Treasury stockTotal TDK
stockholders'equity
$ (188,913) $ 5,448,243
-
Common stock Additionalpaid-in capital
Legal reserve Retainedearnings
Accumulatedother
comprehensiveincome (loss)
$ 258,747 $ 6,067,175 $ (845,961)
(11,893)
$ 316,903 $ 623,291 $ 246,854 $ 5,993,952
158,136 158,136
11,893
690,786
848,922
690,786
748 - (1,010) 262
(49)
23,447 23,447
(49)
10 10 (0) 10
7,097 (79,068)
(73,282) (73,282)
$ (1,543,844)

Consolidated statements of cash flowsFor the years ended March 31, 2014, 2013 and 2012 U.S. Dollars
(Thousands)
(Note 2)
2014 2013 2012 2014Cash flows from operating activities: Net income (loss) ¥ 18,234 4,530 (1,701) $ 177,029 Adjustments to reconcile net income (loss) to net cash provided
by operating activities:
Depreciation and amortization 83,109 77,938 80,197 806,884 Loss (gain) on sale or disposal of property, plant and equipment (1,519) 1,203 (5,396) (14,747) Impairment loss on long-lived assets 6,149 1,275 5,124 59,699 Deferred income taxes (1,215) 5,110 2,092 (11,796) Loss (gain) on securities, net (2,136) 714 4,236 (20,738) Equity in earnings of aff iliates, net of dividends received (1,424) 2,393 650 (13,825) Changes in assets and liabilities:
Decrease (increase) in trade receivables 4,349 14,487 (14,805) 42,223 Decrease (increase) in inventories 13,011 13,493 (18,075) 126,320 Decrease (increase) in other current assets 1,965 12,596 (5,882) 19,077 Increase (decrease) in trade payables (1,446) (20,327) 4,784 (14,039) Increase (decrease) in accrued expenses 3,589 1,264 (103) 34,845 Increase (decrease) in income taxes payables, net 2,967 (1,081) (977) 28,806 Increase (decrease) in other current liabilities (569) (1,775) 2,152 (5,524) Increase (decrease) in retirement and severance benefits, net 2,053 (202) 2,201 19,932 Other - net 191 (2,676) 837 1,854Net cash provided by operating activities 127,308 108,942 55,334 1,236,000
Cash flows from investing activities: Capital expenditures (68,606) (85,606) (99,653) (666,078) Proceeds from sale and maturity of short-term investments 21,844 12,363 55,951 212,078 Payment for purchase of short-term investments (20,232) (14,496) (12,705) (196,427) Proceeds from sale and maturity of securities 5,269 2,335 19,576 51,155 Payment for purchase of securities (1,746) (748) (3,535) (16,952) Proceeds from sales of tangible and intangible assets 5,206 4,246 12,029 50,544 Acquisition of subsidiaries, net of cash acquired (922) (5,633) (545) (8,951) Other - net 3,749 (2,617) (1,016) 36,398Net cash used in investing activities (55,438) (90,156) (29,898) (538,233)
Cash flows from financing activities: Proceeds from long-term debt 33,747 40,416 50,306 327,641 Repayment of long-term debt (51,867) (37,710) (56,046) (503,563) Increase (decrease) in short-term debt, net (16,634) 12,124 32,487 (161,495) Cash paid to acquire treasury stock (5) (277) (13,260) (49) Dividends paid (7,554) (10,070) (10,321) (73,340) Acquisition of noncontrolling interests (13,981) - (1,201) (135,738) Proceed from noncontrolling interest shareholders 550 - 11,061 5,340 Other - net (374) (88) (97) (3,631)Net cash provided by (used in) f inancing activities (56,118) 4,395 12,929 (544,835)
Effect of exchange rate changes on cash and cash equivalents 21,409 23,491 (441) 207,854 Net increase in cash and cash equivalents 37,161 46,672 37,924 360,786 Cash and cash equivalents, beginning of year 213,687 167,015 129,091 2,074,631
Cash and cash equivalents, end of year ¥ 250,848 213,687 167,015 $ 2,435,417
See accompanying notes to consolidated financial statements.
Yen
(Millions)

Notes to Consolidated Financial Statements
1. Nature of Operations and Summary of Significant Accounting Policies
(1) Nature of Operations
TDK Corporation, a Tokyo-based company founded in 1935 to accomplish the world’s first commercialization of a magnetic material called ferrite, and its subsidiaries (collectively “TDK”) have always been a multinational developer, manufacturer and distributor of unique and diverse products, including ferrite cores, inductive devices, ceramic capacitors, magnetic heads, magnets and other items created by pursuing core technologies.
TDK’s three basic reportable segments, Passive Components, Magnetic Application Products and Film Application Products, and the “Other” unrelated to the aforementioned three segments, accounted for 47.9%, 37.0%, 13.1%, and 2.0% of net sales, respectively, for the year ended March 31, 2014.
These three segments and the Other consist of the following businesses:
(i) Passive Components: Ceramic capacitors, Aluminum electrolytic capacitors, Film capacitors, Inductive devices (Coils/Ferrite cores/Transformers), High-frequency components, Piezoelectric materials and circuit protection components, Sensors
(ii) Magnetic Application Products: Recording devices, Power supplies, Magnets
(iii) Film Application Products: Energy devices (Rechargeable batteries), Applied films
(iv) Other: Mechatronics (Production equipment), other
(2) Basis of Presentation
TDK Corporation and most of its domestic subsidiaries maintain their books of account in conformity with the generally accepted accounting principles in Japan, and its foreign subsidiaries mainly in conformity with those of the countries of their domicile.
The consolidated financial statements presented herein reflect certain adjustments, not recorded in the primary books of TDK Corporation and its subsidiaries, to present the financial position, results of operations and cash flows in conformity with U.S. generally accepted accounting principles (“U.S. GAAP”).
(3) Consolidation Policy
The consolidated financial statements include the accounts of TDK Corporation, its subsidiaries and those variable interest entities where TDK is the primary beneficiary as defined under U.S. GAAP. All significant intercompany balances and transactions have been eliminated in consolidation.
The investments in affiliates in which TDK’s ownership is 20 percent to 50 percent and where TDK exercises significant influence over their operating and financial policies are accounted for by the equity method of accounting. All significant intercompany profits from these affiliates have been eliminated.
(4) Cash Equivalents and Short-term Investments
Cash equivalents include all highly liquid investments with an original maturity of three months or less. All other highly liquid investments not considered to be cash equivalents are classified as short-term investments. TDK determines the appropriate classification of its investments at the time of purchase.
(5) Allowance for Doubtful Receivables
The allowance for doubtful receivables is TDK’s best estimate of the amount of probable credit losses in TDK’s existing trade receivables. An additional reserve for individual receivables is recorded when TDK becomes aware of a customer’s inability to meet its financial obligations, such as in the case of bankruptcy filings or deterioration in a customer’s operating results or financial position. If customer circumstances change, estimates of the recoverability of receivables would be further adjusted.

(6) Investments in Securities
TDK classifies its debt and equity securities into one of the three categories: trading, available-for-sale, or held-to-maturity. Trading securities are acquired and held principally for the purpose of selling them in the near future. Held-to-maturity securities are those securities in which TDK has the ability and intent to hold the security until maturity. All securities not included in trading or held-to-maturity are classified as available-for-sale.
Trading and available-for-sale securities are recorded at fair value. Held-to-maturity securities are recorded at amortized cost, adjusted for the amortization or accretion of premiums or discounts. Unrealized holding gains and losses on trading securities are included in earnings. Unrealized holding gains and losses, net of the related tax effect, on available-for-sale securities are excluded from earnings and are reported as a separate component of accumulated other comprehensive income (loss) until realized. As of March 31, 2014 and 2013, TDK did not hold any trading or held-to-maturity securities. Available-for-sale securities, which mature or are expected to be sold in less than one year, are classified as marketable securities.
If a decline in the fair value below the cost basis of an equity security which is an available-for-sale security is deemed to be other-than-temporary, a decline in the fair value below amortized cost basis of an debt security which is available for sale but not expected to be sold is deemed to be other-than-temporary and represents a credit loss, and a decline in the fair value of a debt security which is an available-for-sale security and expected to be sold before recovery of its amortized cost basis exists, an impairment is recognized in earnings and the fair value becomes the new cost basis of the security. To determine whether an impairment is other-than-temporary, TDK periodically reviews the fair value of available-for-sale securities for possible impairment by taking into consideration the financial and operating conditions of the issuer, general market conditions in the issuer’s industry, degree and period of the decline in fair value and other relevant factors.
Nonmarketable securities are recorded at cost. TDK periodically evaluates whether an event or change in circumstances may have a significant adverse effect on the fair value of the investment. Factors considered in assessing whether an indication of impairment exists include the financial and operating conditions of the issuer, general market conditions in the issuer’s industry and other relevant factors. If an indication of impairment is present, TDK estimates the fair value of nonmarketable securities. If the fair value is less than cost and the impairment is determined to be other-than-temporary, a nonmarketable security is written down to its impaired value through a charge to earnings.
(7) Inventories
Inventories are stated at the lower of cost or market. Cost is determined principally by the average cost method.
The cost elements for finished goods and work in process include direct costs for materials such as primary materials and purchased semi-finished products, direct labor costs such as basic salaries, bonuses, and legal welfare expenses, direct costs such as expenses paid to subcontractors, and indirect manufacturing costs comprising material costs, labor costs and other overhead costs.
(8) Property, Plant and Equipment
Depreciation of property, plant and equipment is principally calculated using the straight-line method as described later in (22) Accounting Policy Changes over the following estimated useful lives:
Buildings .............................................................. 2 to 60 years
Machinery and equipment .................................... 2 to 22 years
(9) Income Taxes
Income taxes are accounted for under the asset and liability method. Deferred tax assets and liabilities are recognized for the estimated future tax consequences attributable to differences between the financial statement carrying amounts of existing assets and liabilities and their respective tax bases and operating loss and tax credit carryforwards.
Deferred tax assets and liabilities are measured using enacted tax rates expected to apply to taxable income in the years in which those temporary differences are expected to be recovered or settled.
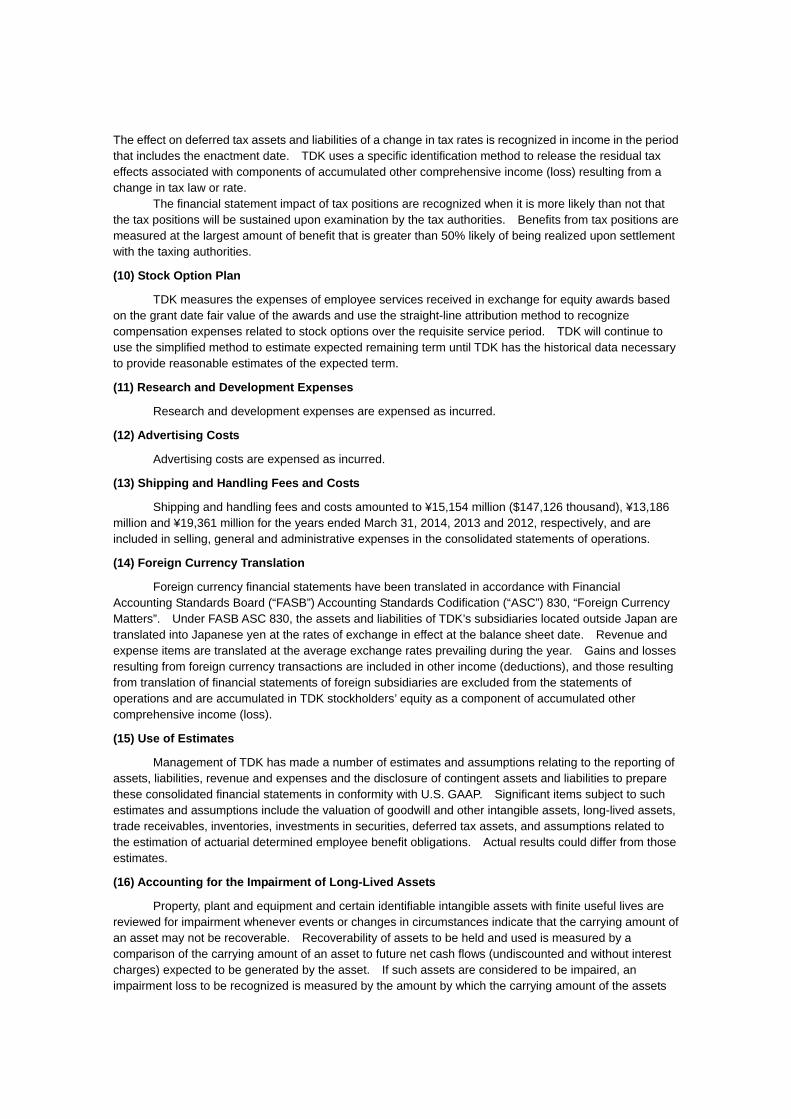
The effect on deferred tax assets and liabilities of a change in tax rates is recognized in income in the period that includes the enactment date. TDK uses a specific identification method to release the residual tax effects associated with components of accumulated other comprehensive income (loss) resulting from a change in tax law or rate.
The financial statement impact of tax positions are recognized when it is more likely than not that the tax positions will be sustained upon examination by the tax authorities. Benefits from tax positions are measured at the largest amount of benefit that is greater than 50% likely of being realized upon settlement with the taxing authorities.
(10) Stock Option Plan
TDK measures the expenses of employee services received in exchange for equity awards based on the grant date fair value of the awards and use the straight-line attribution method to recognize compensation expenses related to stock options over the requisite service period. TDK will continue to use the simplified method to estimate expected remaining term until TDK has the historical data necessary to provide reasonable estimates of the expected term.
(11) Research and Development Expenses
Research and development expenses are expensed as incurred.
(12) Advertising Costs
Advertising costs are expensed as incurred.
(13) Shipping and Handling Fees and Costs
Shipping and handling fees and costs amounted to ¥15,154 million ($147,126 thousand), ¥13,186 million and ¥19,361 million for the years ended March 31, 2014, 2013 and 2012, respectively, and are included in selling, general and administrative expenses in the consolidated statements of operations.
(14) Foreign Currency Translation
Foreign currency financial statements have been translated in accordance with Financial Accounting Standards Board (“FASB”) Accounting Standards Codification (“ASC”) 830, “Foreign Currency Matters”. Under FASB ASC 830, the assets and liabilities of TDK’s subsidiaries located outside Japan are translated into Japanese yen at the rates of exchange in effect at the balance sheet date. Revenue and expense items are translated at the average exchange rates prevailing during the year. Gains and losses resulting from foreign currency transactions are included in other income (deductions), and those resulting from translation of financial statements of foreign subsidiaries are excluded from the statements of operations and are accumulated in TDK stockholders’ equity as a component of accumulated other comprehensive income (loss).
(15) Use of Estimates
Management of TDK has made a number of estimates and assumptions relating to the reporting of assets, liabilities, revenue and expenses and the disclosure of contingent assets and liabilities to prepare these consolidated financial statements in conformity with U.S. GAAP. Significant items subject to such estimates and assumptions include the valuation of goodwill and other intangible assets, long-lived assets, trade receivables, inventories, investments in securities, deferred tax assets, and assumptions related to the estimation of actuarial determined employee benefit obligations. Actual results could differ from those estimates.
(16) Accounting for the Impairment of Long-Lived Assets
Property, plant and equipment and certain identifiable intangible assets with finite useful lives are reviewed for impairment whenever events or changes in circumstances indicate that the carrying amount of an asset may not be recoverable. Recoverability of assets to be held and used is measured by a comparison of the carrying amount of an asset to future net cash flows (undiscounted and without interest charges) expected to be generated by the asset. If such assets are considered to be impaired, an impairment loss to be recognized is measured by the amount by which the carrying amount of the assets

exceed the fair value of the assets. Assets to be disposed of by sale are reported at the lower of the carrying amount or fair value less costs to sell.
(17) Goodwill and Other Intangible Assets
Goodwill is not amortized, but instead is tested for impairment at least annually, except for a case in which it is not more likely than not that the fair value of a reporting unit is less than its carrying amount. The test is conducted more frequently if certain indicators arise.
Intangible assets with finite useful lives are amortized over their respective estimated useful lives.
Intangible assets determined to have indefinite useful lives are not amortized, but instead are tested for impairment annually or more frequently if certain indicators arise until the useful life is determined to no longer be indefinite except TDK determines that it is not more likely than not that the fair value of an indefinite-lived intangible asset is less than its carrying amount.
(18) Derivative Financial Instruments
TDK has elected not to apply hedge accounting. Accordingly, changes in the fair value of derivatives are recognized in earnings in the period of the changes.
The required disclosures in accordance with FASB ASC 815 “Derivatives and Hedging” are presented in Note 15 of the Notes to Consolidated Financial Statements.
(19) Net Income attributable to TDK per Share
Basic net income attributable to TDK per share has been computed by dividing net income attributable to TDK available to common stockholders by the weighted average number of common shares outstanding for each year. Diluted net income attributable to TDK per share reflects the potential dilution that could occur if securities or other contracts to issue common stock were exercised or converted into common stock or resulted in the issuance of common stock of TDK.
(20) Revenue Recognition
TDK generates revenue principally through the sale of products under separate contractual arrangements. TDK recognizes revenue when persuasive evidence of an arrangement exists, delivery has occurred and title and risk of loss have been transferred to the customer, the sales price is fixed or determinable, and collectability is probable.
In principle, revenue from sales of products is recognized when the products are received by customers based on the free on board destination sales term. With regards to sales of products, TDK’s policy is not to accept product returns unless the products are defective. TDK reduces revenue for estimated future returns based upon historical experience at the time the related revenue is recorded. The conditions of acceptance are governed by the terms of the contract or customer arrangement and those not meeting the predetermined specification are not recorded as revenue.
Warranties offered on TDK’s products are insignificant.
(21) Adoption of New Accounting Standards
Reporting of Amounts Reclassified Out of Accumulated Other Comprehensive Income In February 2013, FASB issued Accounting Standards Update (“ASU”) 2013-02 “Reporting of
Amounts Reclassified Out of Accumulated Other Comprehensive Income”. This amendment requires an entity to provide information about the amounts reclassified out of
accumulated other comprehensive income by component. TDK adopted FASB ASU 2013-02 on April 1, 2013. The disclosure required by the amendment is presented in Note 12 of the Notes to Consolidated Financial Statements.
The adoption of FASB ASU 2013-02 did not have a material impact on TDK’s financial position or results of operations.

(22) Accounting Policy Changes
Change in Depreciation Method
Previously, TDK used the declining-balance method for calculating the depreciation of property, plant and equipment located in Japan and certain foreign entities. As a result of change in operation structure, TDK revisited the depreciation method and considered that the straight-line method better reflected the pattern of consumption of estimated future benefits to be derived from those assets being depreciated and provided a better matching of cost and revenues over the assets’ estimated useful lives. As such, TDK changed the depreciation method to the straight-line method with effective from April 1, 2013. Concurrently, estimated useful lives for certain assets were also changed. The effect of change in depreciation method is recognized prospectively as a change in accounting estimate in accordance with the provisions of FASB ASC 250 “Accounting Changes and Error Corrections”. As a result of the change, income from continuing operations before income taxes for the year ended March 31, 2014 increased by ¥1,197 million ($11,621 thousand). Net income attribute to TDK and Basic net income attribute to TDK per common share for the year ended March 31, 2014 increased by ¥745 million ($7,233 thousand) and ¥5.92 ($0.06) respectively.
(23) Subsequent Events
TDK has evaluated the subsequent events through July 22, 2014, the date on which the consolidated financial statements are available to be issued.
(24) Reclassifications
Certain reclassifications have been made to the prior years’ consolidated financial statements to conform to the presentation used for the year ended March 31, 2014.
Additionally, results of discontinued operations are separately presented under discontinued operations in the consolidated statements of operations. Except for otherwise mentioned, figures pertaining to discontinued operations are excluded from the figures disclosed in the Notes to Consolidated Financial Statements.

2. Financial Statement Translation The consolidated financial statements are expressed in Japanese yen, the functional currency of
TDK. Supplementally, the Japanese yen amounts as of and for the year ended March 31, 2014, have also been translated into U.S. dollar amounts, solely for the convenience of the reader, at the rate of ¥103=U.S.$1, the approximate exchange rate on the Tokyo Foreign Exchange Market on March 31, 2014. This translation should not be construed as a representation that the amounts shown could be converted into U.S. dollars at such rate.
3. Marketable Securities and Investments in Securities
Marketable securities and investments in securities at March 31, 2014 and 2013 are as follows:
Yen (Millions) U.S. Dollars (Thousands)
2014 2013 2014 Marketable securities ¥ - 900 $ - Investments in securities:
Long-term marketable securities 20,335 14,456 197,427 Nonmarketable securities 1,449 1,098 14,068 Investments in affiliates (Note 4) 16,617 16,659 161,330
Total investments in securities 38,401 32,213 372,825 Total ¥ 38,401 33,113 $ 372,825
Marketable securities and investments in securities include available-for-sale securities.
Information with respect to such securities at March 31, 2014 and 2013 is as follows:
As of March 31, 2014
Yen (Millions):
Cost
Gross Unrealized Holding Gains
Gross Unrealized Holding Losses
Fair Value
Investments (Debt securities): Government bonds ¥ 1,302 - 0 1,302 Commercial papers 64 61 - 125 Public-utility bonds 3 - - 3
Investments (Equity securities): Manufacturing companies 8,391 7,728 12 16,107 Other 1,166 348 - 1,514
Investments (Mutual funds) 1,155 129 - 1,284 Total ¥ 12,081 8,266 12 20,335
As of March 31, 2013
Yen (Millions):
Cost
Gross Unrealized Holding Gains
Gross Unrealized Holding Losses
Fair Value
Marketable securities (Debt securities): Government bonds ¥ 899 1 - 900
Investments (Debt securities): Commercial papers 57 40 - 97 Public-utility bonds 2 - - 2
Investments (Equity securities): Manufacturing companies 10,205 2,738 957 11,986 Other 1,163 183 - 1,346
Investments (Mutual funds) 961 64 - 1,025 Total ¥ 13,287 3,026 957 15,356

As of March 31, 2014
U.S. Dollars (Thousands):
Cost
Gross Unrealized Holding Gains
Gross Unrealized Holding Losses
Fair Value
Investments (Debt securities): Government bonds $ 12,641 - 0 12,641 Commercial papers 621 593 - 1,214 Public-utility bonds 29 - - 29
Investments (Equity securities): Manufacturing companies 81,466 75,029 117 156,378 Other 11,320 3,379 - 14,699
Investments (Mutual funds) 11,214 1,252 - 12,466 Total $ 117,291 80,253 117 197,427
Debt securities classified as available-for-sale at March 31, 2014 have a weighted average
remaining term of 1.8 year. The proceeds from sale and maturity of available-for-sale securities are ¥5,269 million ($51,155
thousand), ¥2,335 million and ¥19,576 million for the years ended March 31, 2014, 2013 and 2012, respectively. The gross realized gains on the sale and settlement of available-for-sale securities are ¥2,583 million ($25,078 thousand), ¥476 million and ¥1,137 million for the years ended March 31, 2014, 2013 and 2012, respectively. The cost of available-for-sale securities sold was determined on average cost basis. TDK recorded an impairment of ¥447 million ($4,340 thousand) on certain available-for-sale securities representing other-than-temporary declines in the fair value for the year ended March 31, 2014. TDK recorded an impairment of ¥1,190 million and ¥5,373 million on certain available-for-sale securities and nonmarketable securities representing other-than-temporary declines in the fair value for the years ended March 31, 2013 and 2012, respectively.
At March 31, 2014, all of the available-for-sale securities with unrealized losses were in a continuous unrealized loss position for less than 12 months.
The aggregate cost of nonmarketable securities accounted for under the cost method at March 31, 2014 and 2013 totaled ¥1,449 million ($14,068 thousand) and ¥1,098 million, respectively. As of March 31, 2013, a part of those securities were not evaluated for impairment because (a) TDK did not estimate the fair value of those investments as it was not practicable to estimate the fair value of the investments and (b) TDK did not identify any events or changes in circumstances that might have had significant adverse effect on the fair value of those investments.
As of March 31, 2014 and 2013, certain debt securities in the amount of ¥1,302 million ($12,641 thousand) and ¥900 million, respectively, were pledged as collateral for extended custom duty payments to Tokyo Customs and other customs.

4. Investments in Affiliates
As of March 31, 2014, investments in affiliates accounted for by the equity method consist of 30.4 percent of the common stock of Semiconductor Energy Laboratory Co., Ltd., a research and development company, 34.0 percent of the common stock of Toppan TDK Label Co., Ltd., a magnetic products manufacturing company, and five other affiliated companies, collectively, which are not significant, at March 31, 2014 and 2013. As of March 31, 2014 and 2013, the difference between TDK’s carrying value of investments in affiliates and its share of the underlying net equity in such affiliates substantially consists of unamortized amounts of equity method goodwill of ¥980 million ($9,515 thousand) and ¥980 million, respectively.
5. Inventories
Inventories at March 31, 2014 and 2013, are summarized as follows:
Yen (Millions)
U.S. Dollars (Thousands)
2014 2013 2014 Finished goods ¥59,746 60,141 $ 580,058 Work in process 31,434 31,016 305,185 Raw materials 45,207 46,711 438,903 ¥ 136,387 137,868 $ 1,324,146
6. Short-Term and Long-Term Debt
Short-term debt and weighted average interest rates at March 31, 2014 and 2013 are as follows: 2014 2013 2014
Yen (Millions)
Weighted average
Yen (Millions)
Weighted average U.S. Dollars
(Thousands) interest rate interest rate Short-term bank loans -
unsecured
¥ 132,237
0.57%
146,624
0.42%
$ 1,283,854
Long-term debt at March 31, 2014 and 2013 are set forth below: Yen
(Millions) U.S. Dollars (Thousands)
2014 2013 2014 Loans from banks, unsecured (weighted average: 2014-0.57%, 2013-0.60%)
¥ 115,185
82,438
$ 1,118,301
Unsecured Bonds due 2014-1.413% - 48,000 - Unsecured Bonds due 2019-2.038% 13,000 13,000 126,214 Lease obligation (weighted average: 2014-10.66%, 2013-11.40%)
6,585
5,558
63,932
134,770 148,996 1,308,447 Less current installments 37,147 51,515 360,651 ¥ 97,623 97,481 $ 947,796

The aggregate annual maturities of long-term debt outstanding at March 31, 2014 are as follows:
Yen (Millions)
U.S. Dollars (Thousands)
Year ending March 31, 2015 ¥ 36,777 $ 357,058 2016 317 3,078 2017 34,565 335,582 2018 36,428 353,670 2019 20,059 194,748 2020 and thereafter 39 379 ¥ 128,185 $ 1,244,515
The aggregate annual maturities of long-term debt outstanding at March 31, 2014 do not include lease obligation. A schedule by years of future minimum lease payments is presented in Note 13 of the Notes to Consolidated Financial Statements.
Short-term and long-term debt from banks were made under general agreements in which security and guarantees for present and future indebtedness will be given upon request of the banks, and that the banks shall have the rights, as the obligations become due, or in the event of default, to offset cash deposits against such obligations due to the banks.
As of March 31, 2014 and 2013, property, plant and equipment having a net book value of ¥2,349 million ($22,806 thousand) and ¥2,073 million, respectively, were pledged as collateral for lease obligation.
There were no debt covenants or cross-default provisions under TDK’s financing arrangements. Furthermore, there were no subsidiary level dividend restrictions under the financing arrangements.
TDK enters into the contracts with financial institutions regarding lines of credit and overdrafts. As of March 31, 2014 and 2013, unused lines of credit and overdrafts amounted to ¥187,748 million ($1,822,796 thousand) and ¥169,294 million, respectively.

7. Income Taxes
TDK Corporation and certain domestic subsidiaries obtained an approval for the consolidated tax return system during the year ended March 31, 2011 and adopted the consolidated tax return system in Japan effective from the year ended March 31, 2012.
TDK Corporation and its domestic subsidiaries are subject to a national corporate tax of 28.05 percent, an inhabitants tax of between 4.4 percent and 5.3 percent and a deductible enterprise tax of between 7.7 percent and 8.0 percent, which in the aggregate resulted in a statutory rate of approximately 37.8 percent for the years ended March 31, 2014 and 2013, and a national corporate tax of 30 percent, an inhabitants tax of between 5.2 percent and 6.2 percent and a deductible enterprise tax of between 7.7 percent and 8.0 percent, which in the aggregate resulted in statutory rate of approximately 40.4 percent for the year ended March 31, 2012.
The effective tax rates of TDK for the years ended March 31, 2014, 2013 and 2012, are reconciled with the Japanese statutory tax rate in the following table: 2014 2013 2012 Japanese statutory tax rate for income from
continuing operations, before income taxes
37.8%
37.8%
40.4% Expenses not deductible for tax purposes
17.1
28.0
6.2 Nontaxable income (3.0) (9.7) (7.5) Difference in statutory tax rates of foreign
subsidiaries
(25.3)
(43.6)
(72.2) Change in valuation allowance 21.3 36.7 118.0 Investment tax credit (7.1) (16.3) (12.7) Research and development tax credit (4.7) (2.1) (0.7) Prior-year tax adjustments 3.0 (1.7) (16.7) Undistributed earnings of subsidiaries and
affiliates
5.5
45.0
3.4 Unrealized gains (losses) on subsidiaries’ and
affiliates’ securities
1.2
-
- Impact of change in Japanese statutory tax
rate
-
-
23.5 Other (0.7) (0.2) (0.1)
Effective tax rate of continuing operations
45.1%
73.9%
81.6%

Total income taxes for the years ended March 31, 2014, 2013 and 2012 are allocated as follows: Yen U.S. Dollars (Millions) (Thousands) 2014 2013 2012 2014 Income from continuing operations, before income
taxes attributable to TDK
¥ 17,936
14,616
11,970
$ 174,136 Loss from discontinued operations attributable to
TDK TDK stockholders’ equity, accumulated other
comprehensive income (loss):
(1,978)
(288)
(1,389)
(19,204)
Foreign currency translation adjustments Pension liability adjustments
0
2,951
0
89
0
87
0
28,651 Net unrealized gains (losses) on securities
1,457
(29)
203
14,145 Total income taxes ¥ 20,366 14,388 10,871 $ 197,728
The tax effects of temporary differences that give rise to significant portions of the deferred tax
assets and deferred tax liabilities at March 31, 2014 and 2013 are as follows:
Yen (Millions)
U.S. Dollars (Thousands)
2014 2013 2014 Deferred tax assets:
Inventories ¥ 2,952 2,673 $ 28,660 Accrued expenses 8,144 7,196 79,068 Retirement and severance benefits 36,822 38,409 357,495 Net operating loss carryforwards 60,746 64,586 589,767 Tax credit carryforwards 5,681 5,190 55,155 Property, plant and equipment, and
Intangible assets
9,178
6,746
89,107 Other 5,075 4,389 49,272
Total gross deferred tax assets 129,598 129,189 1,248,524 Less valuation allowance (78,626) (64,269) (763,359) Net deferred tax assets ¥ 49,972 64,920 $ 485,165
Deferred tax liabilities: Marketable securities and investments
adjustments
¥ (4,507)
(3,372)
$ (43,757) Undistributed earnings of foreign
subsidiaries and affiliated companies (4,872) (11,041) (47,301) Acquired intangible assets (5,804) (6,087) (56,350) Other (3,181) (3,151) (30,883)
Total gross deferred tax liabilities (18,364)
(23,651)
(178,291)
Net deferred tax assets ¥ 31,608 41,269 $ 306,874

The net changes in total valuation allowance were an increase of ¥14,357 million ($139,388 thousand) for the year ended March 31, 2014 and an increase of ¥11,977 million for the year ended March 31, 2013. Major components of the increase in valuation allowance for the years ended March 31, 2014 and 2013 were the additional valuation allowances recorded on deferred tax assets for net operating loss carryforwards at certain subsidiaries.
In assessing the realizability of deferred tax assets, TDK considers whether it is more likely than not that some portion or all of the deferred tax assets will not be realized. The ultimate realization of deferred tax assets is dependent upon the generation of future taxable income during the periods in which those temporary differences become deductible and tax carryforwards are utilized. TDK considers the scheduled reversal of deferred tax liabilities, projected future taxable income, and tax planning in making this assessment. Based upon the level of historical taxable income and projections for future taxable income over the periods which the deferred tax assets are deductible, TDK believes it is more likely than not that TDK will realize the benefits of these deductible differences and tax carryforwards, net of the existing valuation allowance at March 31, 2014.
At March 31, 2014, TDK Corporation and its subsidiaries have net operating loss carryforwards for
income tax purposes of ¥187,397 million ($1,819,388 thousand) which are available to offset future taxable income, if any.
Periods available to offset future taxable income vary in each tax jurisdiction and range from one
year to an indefinite period as follows:
Yen (Millions) U.S. Dollars (Thousands)
Within 1 year ¥ 433 $ 4,204 1 to 5 years 27,403 266,049 5 to 20 years 55,689 540,670 Indefinite periods 103,872 1,008,465 ¥ 187,397 $ 1,819,388
At March 31, 2014, TDK Corporation and its subsidiaries have tax credit carryforwards for income tax purposes of ¥5,681 million ($55,155 thousand) which are available to reduce future income taxes, if any. Approximately ¥2,847 million ($27,641 thousand) of the tax credit carryforwards will expire through 2033, while the remainder has an indefinite carryforward period.
Net deferred income tax assets and liabilities at March 31, 2014 and 2013 are reflected in the
accompanying consolidated balance sheets under the following captions: Yen
(Millions) U.S. Dollars (Thousands)
2014 2013 2014 Deferred income taxes (current assets) ¥ 10,138 18,504 $ 98,427 Deferred income taxes (noncurrent assets) 28,563 29,674 277,310 Other current liabilities (1,891) (2,101) (18,358)Deferred income taxes (noncurrent liabilities) (5,202) (4,808) (50,505) ¥ 31,608 41,269 $ 306,874

As of March 31, 2014 and 2013, TDK did not recognize deferred tax liabilities of approximately ¥13,534 million ($131,398 thousand) and ¥11,850 million, respectively, for certain portions of undistributed earnings of foreign subsidiaries because TDK currently does not expect those unremitted earnings to reverse and become taxable to TDK in the foreseeable future.
A deferred tax liability will be recognized when TDK expects that it will recover those undistributed earnings in a taxable manner, such as through receipt of dividends or sale of the investments. As of March 31, 2014 and 2013, the undistributed earnings of these subsidiaries are approximately ¥412,108 million ($4,001,049 thousand) and ¥410,153 million, respectively.
A reconciliation of the beginning and ending amount of gross unrecognized tax benefits for the years ended March 31, 2014 and 2013 are as follows:
Yen
(Millions) U.S. Dollars (Thousands)
2014 2013 2014 Balance at beginning of year ¥ 6,888 6,768 $ 66,874 Additions for tax positions of the current year 267 207 2,592 Additions for tax positions of prior years 37 74 359 Reductions for tax positions of prior years (169) (325) (1,641) Settlements with taxing authorities during the period - (495) - Other 465 659 4,515 Balance at end of year ¥ 7,488 6,888 $ 72,699
The total amount of unrecognized tax benefits that, if recognized, would reduce the effective tax
rate as of March 31, 2014 and 2013 are ¥5,498 million ($53,379 thousand) and ¥5,176 million, respectively. Although TDK believes its estimates and assumptions used to identify unrecognized tax benefits
are reasonable, there is an uncertainty about the final determination of tax audit settlements and any related litigation which could affect the effective tax rate in the future periods. As of March 31, 2014, TDK is not aware of any significant changes in its unrecognized tax benefits over the next 12 months.
TDK classifies interest and penalties related to unrecognized tax benefits as interest expense and
other deductions-other, respectively, in the consolidated statements of operations. Interest and penalties accrued which are recorded in other current liabilities as of March 31, 2014 as well as interest and penalties recorded in interest expense and other deductions-other for the year then ended are not material.
TDK files income tax returns in Japan and various foreign tax jurisdictions. In Japan, TDK is no
longer subject to regular income tax examinations by the tax authority for years ended on or before March 31, 2007. While there has been no specific indication by the tax authority that TDK will be subject to a transfer pricing examination in the near future, the tax authority could conduct a transfer pricing examination for years ended on or after March 31, 2005. In other major foreign tax jurisdictions, including the U.S. and Hong Kong, TDK is no longer subject to income tax examinations by tax authorities for years ended on or before March 31, 2002 with few exceptions. The tax authorities are currently conducting income tax examinations of TDK’s income tax returns for certain years ended on or after March 31, 2003 in major foreign tax jurisdictions.

8. Retirement and Severance Benefits
1. Defined Benefit Pension Plans TDK sponsors contributory and noncontributory retirement and severance plans that provide for
pension or lump-sum benefit payments, based on length of service, employee salary and certain other factors, to substantially all employees who retire or terminate their employment for reasons other than dismissal for cause. These pension plans are recognized in accordance with FASB ASC 715 “Compensation-Retirement Benefits”.
On April 1, 2011, TDK Corporation and certain domestic subsidiaries amended its pension plans
and introduced defined contribution plans to fund a portion of its pension benefits. As a result, primarily due to the change in the method of payment of pension benefits for future years, benefit obligations and plan assets decreased by ¥19,206 million and ¥17,232 million, respectively.
Reconciliations of beginning and ending balances of the benefit obligations and the fair value of the
plan assets are as follows: Yen (Millions) 2014 2013 Japanese
plans Foreign plans
Japanese plans
Foreign plans
Change in benefit obligations: Benefit obligations at beginning of period ¥187,485 55,416 177,418 46,756 Service cost 5,284 1,786 4,991 1,390 Interest cost 2,608 2,326 3,158 1,872 Actuarial (gain) loss (3,581) 1,481 9,020 1,957 Benefits paid (7,424) (2,315) (7,228) (2,048)Curtailment/settlement - (575) - (11)Others - 39 126 - Translation adjustment - 7,959 - 5,500 Benefit obligations at end of period 184,372 66,117 187,485 55,416
Change in plan assets: Fair value of plan assets at beginning of period 133,512 14,254 123,370 11,394 Actual return on plan assets 7,190 1,282 9,013 1,004 Employer contributions 5,911 2,214 8,357 2,336 Benefits paid (7,424) (2,315) (7,228) (2,048)Curtailment/settlement - (601) - - Translation adjustment - 1,363 - 1,568 Fair value of plan assets at end of period 139,189 16,197 133,512 14,254
Funded status ¥(45,183) (49,920) (53,973) (41,162)
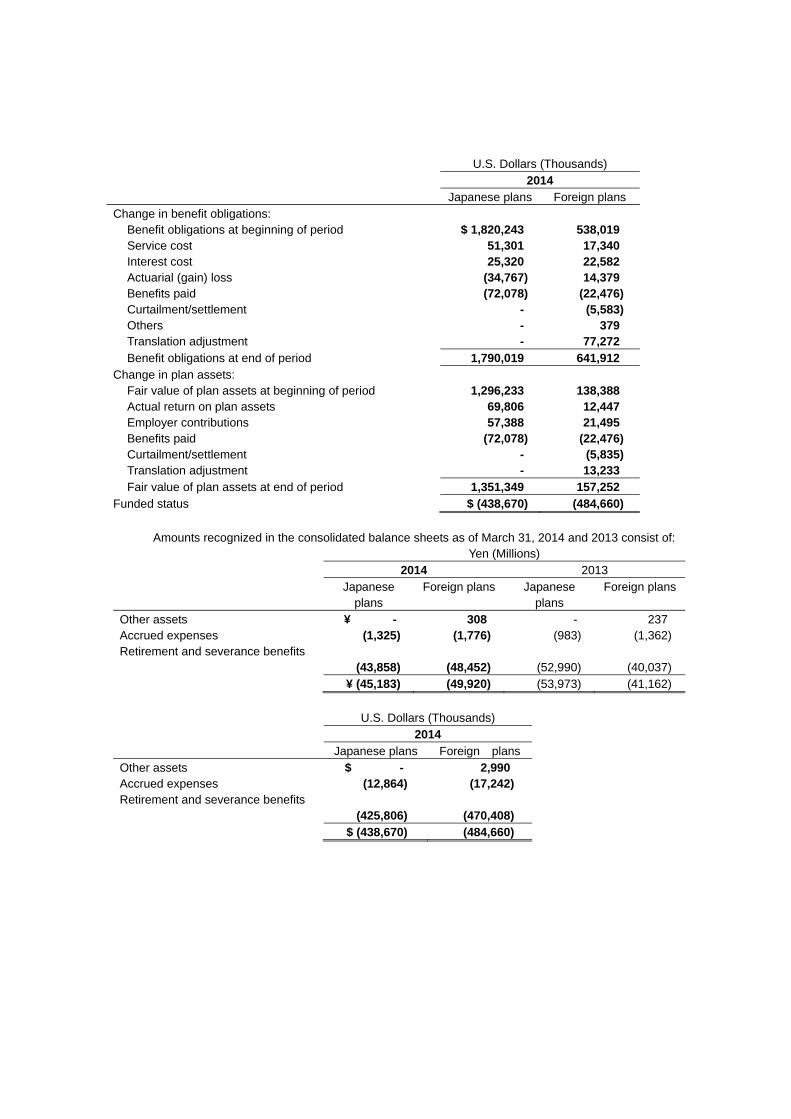
U.S. Dollars (Thousands) 2014 Japanese plans Foreign plans Change in benefit obligations:
Benefit obligations at beginning of period $ 1,820,243 538,019 Service cost 51,301 17,340 Interest cost 25,320 22,582 Actuarial (gain) loss (34,767) 14,379 Benefits paid (72,078) (22,476) Curtailment/settlement - (5,583) Others - 379 Translation adjustment - 77,272 Benefit obligations at end of period 1,790,019 641,912
Change in plan assets: Fair value of plan assets at beginning of period 1,296,233 138,388 Actual return on plan assets 69,806 12,447 Employer contributions 57,388 21,495 Benefits paid (72,078) (22,476) Curtailment/settlement - (5,835) Translation adjustment - 13,233 Fair value of plan assets at end of period 1,351,349 157,252
Funded status $ (438,670) (484,660)
Amounts recognized in the consolidated balance sheets as of March 31, 2014 and 2013 consist of: Yen (Millions) 2014 2013 Japanese
plans Foreign plans Japanese
plans Foreign plans
Other assets ¥ - 308 - 237 Accrued expenses (1,325) (1,776) (983) (1,362) Retirement and severance benefits
(43,858)
(48,452)
(52,990)
(40,037) ¥ (45,183) (49,920) (53,973) (41,162)
U.S. Dollars (Thousands) 2014 Japanese plans Foreign plansOther assets $ - 2,990 Accrued expenses (12,864) (17,242) Retirement and severance benefits
(425,806)
(470,408) $ (438,670) (484,660)

Amounts recognized in accumulated other comprehensive income (loss) as of March 31, 2014 and 2013 consist of: Yen (Millions) 2014 2013 Japanese
plans Foreign plans Japanese
plans Foreign plans
Net actuarial loss ¥ 57,250 14,247 68,852 14,518 Prior service cost (benefit) (9,355) 28 (11,384) 49 ¥ 47,895 14,275 57,468 14,567
U.S. Dollars (Thousands) 2014 Japanese plans Foreign plans Net actuarial loss $ 555,825 138,320 Prior service cost (benefit) (90,825) 272 $ 465,000 138,592
Accumulated benefit obligations for all defined benefit plans are as follows:
Yen (Millions) 2014 2013 Japanese
plans Foreign plans Japanese
plans Foreign plans
Accumulated benefit obligations ¥ 177,461 60,092 178,453 50,584 U.S. Dollars (Thousands) 2014 Japanese plans Foreign plans Accumulated benefit obligations $ 1,722,922 583,417
The projected benefit obligations and the fair value of plan assets for the pension plans with
projected benefit obligations in excess of plan assets, and the accumulated benefit obligations and the fair value of plan assets for the pension plans with accumulated benefit obligations in excess of plan assets are as follows:
Yen (Millions) 2014 2013 Japanese
plans Foreign plans Japanese
plans Foreign plans
Plans with projected benefit obligations in excess of plan assets:
Projected benefit obligations ¥ 184,372 65,429 187,485 54,099 Fair value of plan assets 139,189 15,201 133,512 12,700
Plans with accumulated benefit obligations in excess of plan assets:
Accumulated benefit obligations ¥ 177,461 59,440 178,453 49,332 Fair value of plan assets 139,189 15,201 133,512 12,700

U.S. Dollars (Thousands) 2014 Japanese plans Foreign plans Plans with projected benefit obligations in excess of plan assets:
Projected benefit obligations $ 1,790,019 635,233 Fair value of plan assets 1,351,349 147,583
Plans with accumulated benefit obligations in excess of plan assets:
Accumulated benefit obligations $ 1,722,922 577,087 Fair value of plan assets 1,351,349 147,583
Net periodic benefit cost (including discontinued operations) for TDK’s employee retirement and
severance defined benefit plans for the years ended March 31, 2014, 2013 and 2012 consist of the following components. Prior service cost (benefit) is amortized by the straight-line method over the average remaining service period of current employees.
Yen (Millions) 2014 2013 2012 Japanese
plans Foreign plans
Japanese plans
Foreign plans
Japanese plans
Foreign plans
Service cost-benefits earned during the year ¥ 5,284 1,786 4,991 1,390 4,826 1,237
Interest cost on projected benefit obligation 2,608 2,326 3,158 1,872 3,381 1,885
Expected return on plan assets (2,664) (878) (2,786) (726) (2,750) (680)Amortization of actuarial loss 3,495 1,203 3,821 961 3,752 427Amortization of prior service cost
(benefit) (2,029) 60 (2,030) 9 (2,042) 10Curtailment/settlement loss - 235 - 3 3,208 522 Net periodic benefit cost ¥ 6,694 4,732 7,154 3,509 10,375 3,401 U.S. Dollars (Thousands) 2014 Japanese plans Foreign plans Service cost-benefits earned during the year $ 51,301 17,340 Interest cost on projected benefit obligation 25,321 22,582 Expected return on plan assets (25,864) (8,524) Amortization of actuarial loss 33,932 11,680 Amortization of prior service cost (benefit) (19,699) 583 Curtailment/settlement loss - 2,281 Net periodic benefit cost $ 64,991 45,942

Amounts recognized in pension liability adjustment that is a part of other comprehensive income (loss) mainly as changes in plan assets and benefit obligations for the years ended March 31, 2014, 2013 and 2012 are summarized as follows: Yen (Millions) 2014 2013 2012 Japanese
plans Foreign plans
Japanese plans
Foreign plans
Japanese plans
Foreign plans
Net actuarial loss (gain) ¥ (8,107) 1,077 2,793 1,679 8,508 6,533 Prior service cost (benefit) - 39 126 - (14) - Amortization of actuarial loss
(3,495)
(1,203)
(3,821)
(961)
(3,752)
(427)Amortization of prior service cost
(benefit)
2,029
(60)
2,030
(9)
2,042
(10)Curtailment/settlement loss - (145) - (11) (5,182) (226) Amount recognized in
other comprehensive income (loss)
(9,573)
(292)
1,128
698
1,602
5,870 Total of net periodic benefit cost
and amount recognized in other comprehensive income (loss)
¥ (2,879)
4,440
8,282
4,207
11,977
9,271 U.S. Dollars (Thousands) 2014 Japanese plans Foreign plans Net actuarial loss (gain) $ (78,709) 10,456 Prior service cost (benefit) - 379 Amortization of actuarial loss (33,932) (11,680) Amortization of prior service cost (benefit) 19,699 (583) Curtailment/settlement loss - (1,407) Amount recognized in
Other comprehensive income (loss)
(92,942)
(2,835) Total of net periodic benefit cost and amount
recognized in other comprehensive income (loss)
$ (27,951)
43,107 The estimated net actuarial loss and prior service cost (benefit) for the defined benefit pension plans
that will be amortized from accumulated other comprehensive income (loss) into net periodic benefit cost over the next year are summarized as follows: Yen (Millions) U.S. Dollars (Thousands) Japanese
plans Foreign plans Japanese
plans Foreign plans
Amortization of actuarial loss ¥ 2,697 1,282 $ 26,184 12,447 Amortization of prior service cost (benefit) (2,028) 10 (19,689) 97

Assumptions
Weighted average assumptions used to determine benefit obligations at March 31: 2014 2013 Japanese
plans Foreign plans
Japanese plans
Foreign plans
Discount rate 1.6% 3.7% 1.4% 3.9% Assumed rate of increase in future compensation
levels 3.1% 2.9% 3.1% 2.9% Weighted average assumptions used to determine net periodic benefit cost for the years ended
March 31: 2014 2013 2012 Japanese
plans Foreign plans
Japanese plans
Foreign plans
Japanese plans
Foreign plans
Discount rate 1.4% 3.9% 1.8% 4.2% 2.0% 5.1% Assumed rate of increase in future
compensation levels 3.1% 2.9% 3.0% 2.9% 3.0% 2.9% Expected long-term rate of return
on plan assets 2.2% 5.9% 2.5% 6.3% 2.5% 6.5%
TDK determines the expected long-term rate of return based on the expected long-term return of the various asset categories in which it invests. TDK considers the current expectations for future returns and the actual historical returns of each plan asset category.
Plan assets
TDK’s investment policies are designed to ensure adequate plan assets are available to provide future payments of pension benefits to eligible participants. Taking into account the expected long-term rate of return on plan assets, TDK formulates a “model” portfolio comprised of the optimal combination of equity securities and debt securities. Plan assets are invested in individual equity and debt securities using the guidelines of the “model” portfolio in order to produce a total return that will match the expected return on a mid-term to long-term basis. TDK evaluates the gap between expected return and actual return of invested plan assets on an annual basis to determine if such differences necessitate a revision in the formulation of the “model” portfolio. TDK revises the “model” portfolio when and to the extent considered necessary to achieve the expected long-term rate of return on plan assets.
As of March 31, 2014, the asset portfolio of TDK’s Japanese plans is divided into three main asset categories with approximately 31% consisting of debt securities, approximately 27% of equity securities and approximately 42% of other assets such as cash and cash equivalents. The asset portfolio of TDK’s foreign plans is also divided into three main asset categories with approximately 47% consisting of equity securities, approximately 38% of debt securities and approximately 15% of other assets such as cash and cash equivalents. As of March 31, 2014, there is no significant deviation between the target allocations and actual results.
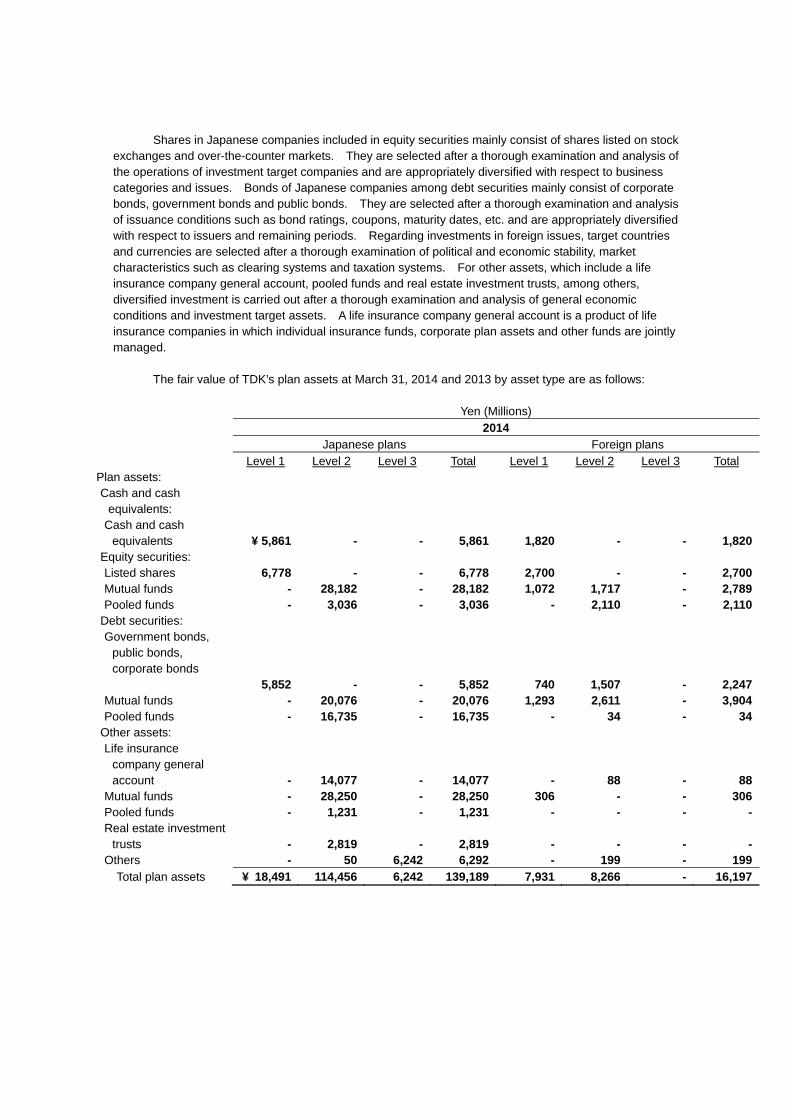
Shares in Japanese companies included in equity securities mainly consist of shares listed on stock exchanges and over-the-counter markets. They are selected after a thorough examination and analysis of the operations of investment target companies and are appropriately diversified with respect to business categories and issues. Bonds of Japanese companies among debt securities mainly consist of corporate bonds, government bonds and public bonds. They are selected after a thorough examination and analysis of issuance conditions such as bond ratings, coupons, maturity dates, etc. and are appropriately diversified with respect to issuers and remaining periods. Regarding investments in foreign issues, target countries and currencies are selected after a thorough examination of political and economic stability, market characteristics such as clearing systems and taxation systems. For other assets, which include a life insurance company general account, pooled funds and real estate investment trusts, among others, diversified investment is carried out after a thorough examination and analysis of general economic conditions and investment target assets. A life insurance company general account is a product of life insurance companies in which individual insurance funds, corporate plan assets and other funds are jointly managed.
The fair value of TDK’s plan assets at March 31, 2014 and 2013 by asset type are as follows:
Yen (Millions) 2014 Japanese plans Foreign plans
Level 1 Level 2 Level 3 Total Level 1 Level 2 Level 3 Total Plan assets: Cash and cash
equivalents:
Cash and cash equivalents
¥ 5,861 - - 5,861 1,820
- - 1,820
Equity securities: Listed shares 6,778 - - 6,778 2,700 - - 2,700Mutual funds - 28,182 - 28,182 1,072 1,717 - 2,789Pooled funds - 3,036 - 3,036 - 2,110 - 2,110
Debt securities: Government bonds,
public bonds, corporate bonds
5,852 - - 5,852 740
1,507 - 2,247Mutual funds - 20,076 - 20,076 1,293 2,611 - 3,904Pooled funds - 16,735 - 16,735 - 34 - 34
Other assets: Life insurance
company general account
- 14,077 - 14,077 -
88 - 88Mutual funds - 28,250 - 28,250 306 - - 306Pooled funds - 1,231 - 1,231 - - - -Real estate investment
trusts
- 2,819 - 2,819 -
- - -Others - 50 6,242 6,292 - 199 - 199
Total plan assets ¥ 18,491 114,456 6,242 139,189 7,931 8,266 - 16,197

Yen (Millions) 2013 Japanese plans Foreign plans
Level 1 Level 2 Level 3 Total Level 1 Level 2 Level 3 Total Plan assets: Cash and cash
equivalents:
Cash and cash equivalents
¥ 16,063 - - 16,063 1,737
12 - 1,749
Equity securities: Listed shares 7,834 - - 7,834 2,155 - - 2,155Mutual funds - 24,993 - 24,993 809 2,228 - 3,037Pooled funds - 398 - 398 - 1,905 - 1,905
Debt securities: Government bonds,
public bonds, corporate bonds
5,969 - - 5,969 574
1,303 - 1,877Mutual funds - 16,675 - 16,675 1,111 1,633 - 2,744Pooled funds - 13,479 - 13,479 - 265 - 265
Other assets: Life insurance
company general account
- 13,624 - 13,624 -
84 - 84Mutual funds - 23,115 - 23,115 - - - -Pooled funds - 3,945 - 3,945 - - - -Real estate investment
trusts
- 3,489 - 3,489 -
135 - 135Others - 31 3,897 3,928 - 303 - 303
Total plan assets ¥ 29,866 99,749 3,897 133,512 6,386 7,868 - 14,254

U.S. Dollars (Thousands) 2014 Japanese plans Foreign plans
Level 1 Level 2 Level 3 Total Level 1 Level 2 Level 3 Total Plan assets: Cash and cash
equivalents:
Cash and cash equivalents
$ 56,903 - - 56,903 17,670
- - 17,670
Equity securities: Listed shares 65,806 - - 65,806 26,214 - - 26,214Mutual funds - 273,612 - 273,612 10,408 16,670 - 27,078Pooled funds - 29,476 - 29,476 - 20,485 - 20,485
Debt securities: Government bonds,
public bonds, corporate bonds
56,815 - - 56,815 7,184
14,631 - 21,815Mutual funds - 194,912 - 194,912 12,553 25,350 - 37,903Pooled funds - 162,476 - 162,476 - 330 - 330
Other assets: Life insurance
company general account
- 136,670 - 136,670 -
854 - 854Mutual funds - 274,272 - 274,272 2,971 - - 2,971Pooled funds - 11,951 - 11,951 - - - -Real estate investment
trusts
- 27,369 - 27,369 -
- - -Others - 485 60,602 61,087 - 1,932 - 1,932
Total plan assets $ 179,524 1,111,223 60,602 1,351,349 77,000 80,252 - 157,252 Level 1 assets are mainly equity securities and debt securities that are valued using unadjusted
quoted prices in active markets in which transactions occur with sufficient frequency and volume. Level 2 assets include mainly mutual funds and pooled funds that invest in equity securities and debt securities. They are valued based on quoted prices obtained from asset management agencies and are verified using observable market inputs. Level 3 assets are insurance products that are valued based on unobservable inputs regarding the assets and the relevant liabilities.

Change in TDK’s plan assets that are classified as Level 3 assets for the years ended March 31, 2014 and 2013 are as follows:
Yen (Millions)
2014 2013
Insurance products
Balance at beginning of year ¥ 3,897 3,633 Net change due to purchase, sale, etc. 2,000 - Gain (loss) on assets held at end of year 345 264 Balance at end of year ¥ 6,242 3,897
U.S. Dollars (Thousands)
2014
Insurance products
Balance at beginning of year $ 37,835 Net change due to purchase, sale, etc. 19,417 Gain (loss) on assets held at end of year 3,350 Balance at end of year $ 60,602
Contributions
TDK expects to contribute ¥5,450 million ($52,913 thousand) to its Japanese defined benefit plans
and ¥1,167 million ($11,330 thousand) to its foreign defined benefit plans for the year ending March 31, 2015.
Estimated future benefit payments
The benefits are expected to be paid from the pension plans in each year 2015 through 2024 are as follows: Yen (Millions) U.S. Dollars (Thousands) Japanese plans Foreign plans Japanese plans Foreign plans Year ending March 31,
2015 ¥ 6,903 2,153 $ 67,019 20,903 2016 7,367 2,224 71,524 21,592 2017 6,983 2,390 67,796 23,204 2018 6,975 2,545 67,718 24,709 2019 7,631 2,651 74,087 25,738 2020 - 2024 total 40,494 16,151 393,146 156,806

2. Deferred Compensation Plans
Certain subsidiaries of TDK Corporation have deferred compensation plans under which employees place a portion of their compensation in a pension fund and contributions can be received with interest at the time of retirement. Estimated future benefit payments to retirees are determined by actuarial calculation. Liabilities relating to these plans are recorded as either the market value of plan assets or the present value of estimated future benefit payments, whichever is greater. As of March 31, 2014 and 2013, the amount of ¥1,467 million ($14,243 thousand) and ¥1,494 million are recorded as retirement and severance benefits, respectively.
Amount recognized in pension liability adjustment that is a part of other comprehensive income (loss) mainly as changes in plan assets and benefit obligations for the years ended March 31, 2014 and 2013 are summarized as follows:
Yen (Millions) 2014 2013 Japanese
plans Foreign plans
Japanese plans
Foreign plans
Net actuarial loss (gain) ¥ - (49) - 49 Prior service cost (benefit) - (212) - - Amortization of actuarial loss
-
(12)
-
(5) Amortization of prior service cost
(benefit)
-
-
-
(2) Amount recognized in
other comprehensive income (loss)
¥ -
(273)
-
42
U.S. Dollars (Thousands) 2014 Japanese plans Foreign plans Net actuarial loss (gain) $ - (476) Prior service cost (benefit) - (2,058) Amortization of actuarial loss - (117) Amortization of prior service cost (benefit) - - Amount recognized in
Other comprehensive income (loss)
$ -
(2,651)
3. Defined Contribution Pension Plans
Expenses for defined contribution pension plan recognized by TDK Corporation and certain subsidiaries for the years ended March 31, 2014, 2013 and 2012 were ¥1,811 million ($17,583 thousand),¥1,138 million and ¥1,051 million, respectively.

9. Legal Reserve and Dividends
The Japanese Companies Act provides that an amount equal to 10 percent of cash dividends and other distributions from retained earnings paid by TDK Corporation and its Japanese subsidiaries be appropriated as a legal reserve. No further appropriations are required when the total amount of the additional paid-in capital and the legal reserve equals 25 percent of their respective stated capital. The Japanese Companies Act also provides that additional paid-in capital and the legal reserve are available for appropriations by the resolution of the shareholders. Certain foreign subsidiaries are also required to appropriate their earnings to legal reserves under the laws of the respective countries. Cash dividends and appropriations to the legal reserve charged to retained earnings in accordance with Japanese Companies Act for the years ended March 31, 2014, 2013 and 2012 represent dividends paid out during those years and the related appropriations to the legal reserve. The accompanying consolidated financial statements do not include any provision for the dividend taken up at the Ordinary General Meeting of Shareholders of ¥40 ($0.39) per share aggregating ¥5,033 million ($48,864 thousand) in respect of the year ended March 31, 2014.
Cash dividends per common share are computed based on dividends paid for the year.
10. Stock Option Plan
Compensation expenses related to stock options that TDK Corporation and one of its subsidiaries recognized for the years ended March 31, 2014, 2013 and 2012 were ¥2,828 million ($27,456 thousand), ¥370 million and ¥543 million, respectively.
Moreover, compensation expenses for the year ended March 31, 2014 includes additional compensation expenses of ¥2,712 million ($26,330 thousand) arising from the below-mentioned modification of the stock option plans at a subsidiary.
The tax benefits related to these compensation expenses for the years ended March 31, 2014, 2013 and 2012 were ¥42 million ($408 thousand), ¥39 million and ¥58 million, respectively. The tax benefits realized from stock options exercised for the years ended March 31, 2014, 2013 and 2012 were ¥34 million ($330 thousand), ¥13 million and ¥33 million, respectively.
1. TDK Corporation Stock Option Plans
TDK Corporation has two types of stock option plans, the Ordinary-Type Stock Options and the Share-based Compensation Type Stock Options. Under the Ordinary-Type Stock Options, stock options, each representing a right to purchase 100 shares of common stock of TDK Corporation, are granted to the senior executives of TDK Corporation and to the directors and senior executives of its subsidiaries. The stock options are vested based on 2 years of continuous service after the grant date and have the exercise period of 4 years. The exercise price of the stock options is equal to or greater than the fair market value of TDK Corporation’s common stock on the grant date.
Under the Share-based Compensation Type Stock Options, stock options, each representing a right to purchase 100 shares of common stock of TDK Corporation, are granted to the directors and corporate officers of TDK Corporation. The stock options are fully vested on the grant date and have the exercise period of 20 years. The amount to be paid by qualified persons upon the exercise of the stock options is set at ¥1 ($0.01) per share of common stock.
A summary of the status of TDK Corporation’s stock options as of March 31, 2014, 2013 and 2012, and of the activity for the years ended on those dates, is as follows:

Number of
shares
Weighted average exercise
price
Weighted average
remaining contractual
term
Aggregate intrinsic value
(1)
Yen Years Yen
(Millions) 2014
Outstanding at beginning of year 716,200 ¥ 4,402 Granted 159,100 2,915 Exercised 14,700 1 Forfeited or Expired 101,000 10,245 Outstanding at end of year 759,600 3,399 6.9 1,036 Exercisable at end of year 522,700 3,266 7.8 890 Expected to vest after end of year 236,900 3,694 4.8 146 2013
Outstanding at beginning of year 666,800 ¥ 5,406 Granted 159,800 2,675 Exercised 8,300 1 Forfeited or Expired 102,100 8,612
Outstanding at end of year 716,200 4,402 6.7 598 Exercisable at end of year 507,700 4,573 7.4 598 Expected to vest after end of year 208,500 3,987 4.9 - 2012
Outstanding at beginning of year 643,300 ¥ 6,184 Granted 133,600 3,142 Exercised 16,600 1 Forfeited or Expired 93,500 8,484
Outstanding at end of year 666,800 5,406 6.3 723 Exercisable at end of year 475,300 5,592 6.9 712 Expected to vest after end of year 191,500 4,944 4.8 11
(1) The aggregate intrinsic value is calculated as the difference between the exercise price of the underlying awards and the closing stock price of ¥4,310 ($41.84) of common stock on March 31, 2014, ¥3,270 on March 31, 2013 and ¥4,690 on March 31, 2012.

Number of
shares
Weighted average exercise
price
Weighted average
remaining contractual
term
Aggregate intrinsic value
U.S. Dollars Years U.S. Dollars (Thousands)
2014
Outstanding at beginning of year 716,200 $ 42.74 Granted 159,100 28.30 Exercised 14,700 0.01 Forfeited or Expired 101,000 99.47 Outstanding at end of year 759,600 33.00 6.9 10,058 Exercisable at end of year 522,700 31.71 7.8 8,641 Expected to vest after end of year 236,900 35.86 4.8 1,417
As of March 31, 2014, all outstanding stock options were vested or expected to be vested. The total intrinsic value of stock options exercised for the years ended March 31, 2014, 2013 and 2012 was ¥60 million ($583 thousand), ¥27 million and ¥63 million, respectively. Cash received from stock options exercised for the years ended March 31, 2014, 2013 and 2012 was ¥0 million ($0 thousand).
Information about stock options outstanding as of March 31, 2014 is as follows:
Options Outstanding Weighted Range of exercise prices
Number outstanding at
average remaining
Weighted average
March 31, 2014 contractual term exercise price Yen (years) Yen U.S. Dollars
1 206,500 16.9 1 0.01 3,550 117,600 4.3 3,550 34.47 3,836 119,300 5.3 3,836 37.24 4,567 87,100 3.3 4,567 44.34 5,110 68,800 1.3 5,110 49.61 5,292 89,700 2.3 5,292 51.38 6,837 70,600 0.3 6,837 66.38
1 to 6,837 759,600 6.9 3,399 33.00
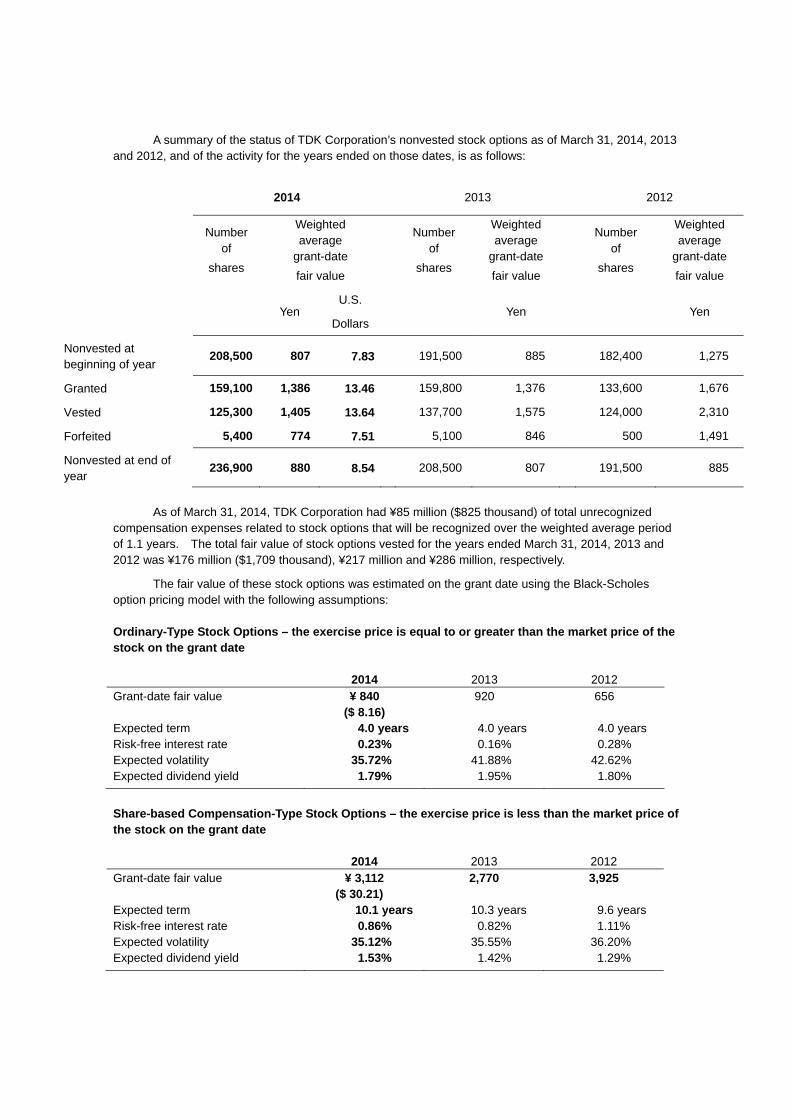
A summary of the status of TDK Corporation’s nonvested stock options as of March 31, 2014, 2013 and 2012, and of the activity for the years ended on those dates, is as follows:
2014 2013 2012
Number
of shares
Weighted average
grant-date fair value
Number of
shares
Weighted average
grant-date fair value
Number of
shares
Weighted average
grant-date fair value
Yen U.S.
Dollars
Yen Yen
Nonvested at beginning of year
208,500 807 7.83 191,500 885 182,400 1,275
Granted 159,100 1,386 13.46 159,800 1,376 133,600 1,676
Vested 125,300 1,405 13.64 137,700 1,575 124,000 2,310
Forfeited 5,400 774 7.51 5,100 846 500 1,491
Nonvested at end of year
236,900 880 8.54 208,500 807 191,500 885
As of March 31, 2014, TDK Corporation had ¥85 million ($825 thousand) of total unrecognized
compensation expenses related to stock options that will be recognized over the weighted average period of 1.1 years. The total fair value of stock options vested for the years ended March 31, 2014, 2013 and 2012 was ¥176 million ($1,709 thousand), ¥217 million and ¥286 million, respectively.
The fair value of these stock options was estimated on the grant date using the Black-Scholes option pricing model with the following assumptions: Ordinary-Type Stock Options – the exercise price is equal to or greater than the market price of the stock on the grant date 2014 2013 2012 Grant-date fair value ¥ 840
($ 8.16) 920 656
Expected term 4.0 years 4.0 years 4.0 years Risk-free interest rate 0.23% 0.16% 0.28% Expected volatility 35.72% 41.88% 42.62% Expected dividend yield 1.79% 1.95% 1.80%
Share-based Compensation-Type Stock Options – the exercise price is less than the market price of the stock on the grant date 2014 2013 2012 Grant-date fair value ¥ 3,112 2,770 3,925
($ 30.21) Expected term 10.1 years 10.3 years 9.6 years Risk-free interest rate 0.86% 0.82% 1.11% Expected volatility 35.12% 35.55% 36.20% Expected dividend yield 1.53% 1.42% 1.29%

2. Subsidiary Stock Option Plans
One of TDK Corporation’s subsidiaries has two types of stock option plans. Under the plans, stock options, each representing a right to purchase one share of common stock of the subsidiary, are granted to the directors and senior executives of the subsidiary and its affiliates. Under one of the plans (Class A), the stock options are gradually vested over 5 years after the grant date. Under the other (Class B), 50% of the stock options are vested when a certain performance condition is achieved and the remaining 50% are gradually vested over 3 years after the date of achievement.
Compensation expenses related to Class B were not recognized and the disclosure is omitted for the years ended March 31, 2014, 2013 and 2012, as it was not considered probable as of March 31, 2014, 2013 and 2012 that the performance condition would be achieved. These stock options have the exercise period of 8 years after the grant date, and will become exercisable when a certain performance condition is achieved.
In September 2013, the subsidiary modified its stock option plans. For Class A that vested prior to March 31, 2013, these options were cancelled and new graded-vesting options which would be vested and become exercisable through May 2014 were concurrently granted. Class A that has not been vested as of March 31, 2013 was not modified and the original vesting conditions of Class A still apply. With regard to Class B, 2/5 of the options were modified to service condition with graded-vesting schedule through May 2014. The modified options are exercisable upon vesting. The remaining 3/5 of Class B were not modified. Stock options subsequent to these changes of conditions are referred to as “Class A (modified)” and “Class B (modified)”, respectively, and have an exercise period until December 31, 2014. These modifications affect 537 directors and senior executives of the subsidiary and its affiliates.
The subsidiary shall issue new shares upon stock option exercised. As the subsidiary is a nonpublic company, the fair value is estimated based on valuation techniques
using assumptions.

A summary of the status of the subsidiary’s stock options as of March 31, 2014, 2013 and 2012, and of the activity for the years ended on those dates is as follows:
Number of
shares
Weighted average exercise
price
Weighted average
remaining contractual
term
Aggregate intrinsic value
U.S. Dollars Years U.S. Dollars (Thousands)
2014 Outstanding at beginning of year 144,000,000 0.00128 Granted - - Exercised - - Forfeited or Expired - - Modified 57,600,000 0.00128 Outstanding at end of year 86,400,000 0.00128 4.8 86,661 Exercisable at end of year - - - - Vested at end of year 28,800,000 0.00128 4.8 28,887 Expected to be vested after end of year 57,600,000 0.00128 4.8 57,774
2013 Outstanding at beginning of year 144,000,000 0.00128 Granted - - Exercised - - Forfeited or Expired - -
Outstanding at end of year 144,000,000 0.00128 5.8 78,152 Exercisable at end of year - - - - Vested at end of year 57,600,000 0.00128 5.8 31,261 Expected to be vested after end of year 86,400,000 0.00128 5.8 46,891
2012 Outstanding at beginning of year - - Granted 144,000,000 0.00128 Exercised - - Forfeited or Expired - -
Outstanding at end of year 144,000,000 0.00128 6.8 33,958 Exercisable at end of year - - - - Vested at end of year 28,800,000 0.00128 6.8 6,792 Expected to be vested after end of year 115,200,000 0.00128 6.8 27,166

A summary of the status of the subsdiary’s nonvested stock options for the years ended March 31, 2014, 2013 and 2012, and of the activity for the years ended on those dates, is as follows:
2014 2013 2012
Number
of shares
Weighted average
grant-date fair value
Number of
shares
Weighted average
grant-date fair value
Number
of shares
Weighted average
grant-date fair value
Thousands U.S. Dollars Thousands U.S. Dollars Thousands U.S. Dollars
Nonvested at beginning of year
86,400 0.06204 115,200 0.06204 - -
Granted - - - - 144,000 0.06204
Vested 28,800 0.06204 28,800 0.06204 28,800 0.06204
Forfeited - - - - - -
Nonvested at end of year
57,600 0.06204 86,400 0.06204 115,200 0.06204
As of March 31, 2014, the subsidiary had $3,294 thousand of total unrecognized compensation
expenses related to Class A plan that will be recognized over the weighted average period of 1.8 years. The total fair value of stock options vested for the years ended March 31, 2014, 2013 and 2012 were $1,787 thousand.
The fair value of Class A plan was estimated on the grant date using the Binomial model with the
following assumptions: 2012 Grant-date fair value $ 0.06204 Expected term 5.95 years Risk-free interest rate 2.48% Expected volatility 50.00%

A summary of the status of the subsidiary’s stock options “Class A (modified)” as of March 31, 2014, and of the activity for the year ended on that date is as follows:
Number of
shares
Weighted average exercise
price
Weighted average
remaining contractual
term
Aggregate intrinsic value
U.S. Dollars Years U.S. Dollars (Thousands)
2014 Outstanding at beginning of year - - Granted - - Exercised - - Forfeited or Expired - - Modified 57,600,000 0.00128 Outstanding at end of year 57,600,000 0.00128 0.75 57,774 Exercisable at end of year 40,320,000 0.00128 0.75 40,442 Vested at end of year 40,320,000 0.00128 0.75 40,442 Expected to be vested after end of year 17,280,000 0.00128 0.75 17,332
A summary of the status of the subsidiary’s stock options “Class B (modified)” as of March 31, 2014, and of the activity for the year ended on that date is as follows:
Number of
shares
Weighted average exercise
price
Weighted average
remaining contractual
term
Aggregate intrinsic value
H.K. Dollars Years H.K. Dollars (Thousands)
2014 Outstanding at beginning of year - - Granted - - Exercised - - Forfeited or Expired - - Modified 103,535,200 1.36035 Outstanding at end of year 103,535,200 1.36035 0.75 665,612 Exercisable at end of year 72,474,640 1.36035 0.75 465,928 Vested at end of year 72,474,640 1.36035 0.75 465,928 Expected to be vested after end of year 31,060,560 1.36035 0.75 199,684

A summary of the status of the subsdiary’s nonvested stock options “Class A (modified)” and “Class B (modified)” for the year ended March 31, 2014, and of the activity for the year ended on that date, is as follows:
2014
Class A (modified) Class B (modified)
Number
of shares
Weighted average
grant-date fair value
Number of
shares
Weighted average
grant-date fair value
U.S. Dollars H.K. Dollars
Nonvested at beginning of year
- - - -
Modification 57,600,000 0.37584 103,535,200 1.57591
Vested 40,320,000 0.37584 72,474,640 1.57591
Forfeited - - - -
Nonvested at end of year
17,280,000 0.37584 31,060,560 1.57591
As of March 31, 2014, the unrecognized compensation expenses at the subsidiary relating to unvested “Class A (modified)” and “Class B (modified)” stock options were $5,196 thousand and HK$48,948 thousand, respectively. The unrecognized compensation expenses are scheduled to be recognized by May 31, 2014. The total fair values of “Class A (modified)” and “Class B (modified)” stock options vested in the year ended March 31, 2014 were $15,154 thousand and HK$114,214 thousand, respectively.
The fair values of “Class A (modified)” and “Class B (modified)” stock options at the time of changing
of the condition were estimated using the Black-Scholes option pricing model based on the following assumptions.
2014 Class A (modified) Class B (modified) Modify-date fair value $ 0.37584 HK$ 1.57591 Expected term 0.81 years 0.81 years Risk-free interest rate 0.279% 0.279% Expected volatility 35.00% 35.00%

11. Equity
Net income (loss) attributable to TDK and transfers (to) from noncontrolling interest for the years ended March 31, 2014, 2013 and 2012 are as follows:
Yen (Millions) U.S. Dollars (Thousands)
2014 2013 2012 2014
Net income (loss) attributable to TDK ¥ 16,288 1,195 (2,454) $ 158,136
Decrease in TDK’s additional paid-in capital for purchase of Becromal Iceland ehf common shares from third parties (1,125) - - (10,922)
Decrease in TDK’s additional paid-in capital for purchase of Amperex Technology Ltd. common shares from third parties (7,758) - - (75,321)
Increase in TDK’s additional paid-in capital for allocation of Amperex Technology Ltd. new common shares to third parties - - 2,942 -
Decrease in TDK’s additional paid-in capital for purchase of EPCOS (Anhui) Feida Electronics Co., Ltd. common shares - - (367) -
Decrease in TDK’s additional paid-in capital for purchase of TDK-NITTO (Shanghai) Electro-Energy Co., Ltd. common shares - - (299) -
Net transfers (to) from noncontrolling interest (8,883) - 2,276 (86,243)
Change from net income (loss) attributable to TDK and transfers (to) from noncontrolling interest ¥ 7,405 1,195 (178) $ 71,893

12. Other Comprehensive Income (Loss)
Change in accumulated other comprehensive income (loss) for the years ended March 31, 2014, 2013 and 2012 are as follows:
2014 Yen (Millions)
Foreign currency translation
adjustments
Pension liability adjustments
Net unrealized gains (losses) on
securities Total
March 31, 2013 ¥ (114,027) (46,707) 1,718 ¥ (159,016)Equity transaction of
consolidated subsidiaries and other
731
-
- 731Other comprehensive income
before reclassifications
60,535
5,005
6,249 71,789Amounts reclassified from
accumulated other comprehensive income (loss)
9
2,182
(1,527) 664Other comprehensive income 60,544 7,187 4,722 72,453
Other comprehensive income (loss) attributable to noncontrolling interests 1,294 8 (0) 1,302
March 31, 2014 ¥ (54,046) (39,528) 6,440 ¥ (87,134)
2013 Yen (Millions)
Foreign currency translation
adjustments
Pension liability adjustments
Net unrealized gains (losses) on
securities Total
March 31, 2012 ¥ (188,379) (44,745) 2,275 ¥ (230,849)Other comprehensive income
(loss) before reclassifications
76,660
(3,998)
(999) 71,663Amounts reclassified from
accumulated other comprehensive income (loss)
52
2,041
442 2,535Other comprehensive income (loss)
76,712 (1,957) (557) 74,198
Other comprehensive income (loss) attributable to noncontrolling interests 2,360 5 (0) 2,365
March 31, 2013 ¥ (114,027) (46,707) 1,718 ¥ (159,016)

2012 Yen (Millions)
Foreign currency translation
adjustments
Pension liability adjustments
Net unrealized gains (losses) on
securities Total
March 31, 2011 ¥ (183,005) (36,409) 1,435 ¥ (217,979)Equity transaction of
consolidated subsidiaries and other
1,082
-
- 1,082Other comprehensive income
(loss) before reclassifications
(5,999)
(13,060)
(1,839) (20,898)Amounts reclassified from
accumulated other comprehensive income (loss)
346
4,733
2,679 7,758Other comprehensive income (loss)
(5,653) (8,327) 840 (13,140)
Other comprehensive income attributable to noncontrolling interests 803 9 0 812
March 31, 2012 ¥ (188,379) (44,745) 2,275 ¥ (230,849)
2014 U.S. Dollars (Thousands)
Foreign currency translation
adjustments
Pension liability adjustments
Net unrealized gains (losses) on
securities Total
March 31, 2013 $ (1,107,058) (453,466) 16,680 $ (1,543,844) Equity transaction of
consolidated subsidiaries and other
7,097
-
-
7,097 Other comprehensive income
before reclassifications
587,719
48,592
60,669
696,980 Amounts reclassified from
accumulated other comprehensive income (loss)
87
21,185
(14,825)
6,447 Other comprehensive income 587,806 69,777 45,844 703,427
Other comprehensive income (loss) attributable to noncontrolling interests 12,563 78 (0) 12,641
March 31, 2014 $ (524,718) (383,767) 62,524 $ (845,961)

The reclassifications out of accumulated other comprehensive income (loss) for the year ended March 31, 2014 are as follows:
2014 Amount reclassified from accumulated other comprehensive income (loss) *1
Affected line items in consolidated statements of operations
Yen (Millions) U.S. Dollars (Thousand)
Foreign currency translation adjustments:
¥ (57) $ (553)Selling, general and administrative expenses
48 466 Equity in earnings of affiliates
- - Tax (expense) or benefit
(9) (87) Net of tax
Pension liability adjustments: (2,886) (28,020) *2
704 6,835 Tax (expense) or benefit
(2,182) (21,185) Net of tax
Net unrealized gains (losses) on securities:
2,122 20,602 Gain (loss) on securities, net Others
(595) (5,777) Tax (expense) or benefit
1,527 14,825 Net of tax
Total amount reclassified, net of tax ¥ (664) $ (6,447)
*1 Amounts in parentheses indicate losses in consolidated statements of operations.
*2 This accumulated other comprehensive income (loss) component is included in the computation of net periodic benefit cost that is presented in Note 8 of the Notes to Consolidated Financial Statements.

Tax effects allocated to each component of other comprehensive income (loss) and reclassification adjustments for the years ended March 31, 2014, 2013 and 2012, are as follows:
Yen (Millions) Before tax Tax (expense) Net-of-tax Amount or benefit amount 2014
Foreign currency translation adjustments: Amount arising during the year from investments in foreign
entities
¥ 60,535
0
60,535 Reclassification adjustments for the portion of gains and
losses realized upon sale or liquidation of investments in foreign entities
9
-
9 Net foreign currency translation adjustments 60,544 0 60,544
Pension liability adjustments: Amount arising during the year 7,252 (2,247) 5,005 Reclassification adjustments for amortization and curtailment/settlement
2,886 (704) 2,182
Net pension liability adjustments 10,138 (2,951) 7,187 Unrealized gains (losses) on securities:
Unrealized holding gains (losses) arising for period 8,301 (2,052) 6,249 Reclassification adjustments for (gains) losses realized in net
income
(2,122)
595
(1,527)Net unrealized gains (losses) 6,179 (1,457) 4,722
Other comprehensive income (loss) ¥ 76,861 (4,408) 72,453 2013
Foreign currency translation adjustments: Amount arising during the year from investments in foreign
entities
¥ 76,660
0
76,660 Reclassification adjustments for the portion of gains and
losses realized upon sale or liquidation of investments in foreign entities
52
-
52 Net foreign currency translation adjustments 76,712 0 76,712
Pension liability adjustments: Amount arising during the year (4,647) 649 (3,998)Reclassification adjustments for amortization and curtailment/settlement
2,779 (738) 2,041
Net pension liability adjustments (1,868) (89) (1,957)Unrealized gains (losses) on securities:
Unrealized holding gains (losses) arising for period (1,178) 179 (999)Reclassification adjustments for (gains) losses realized in net
income
592
(150)
442 Net unrealized gains (losses) (586) 29 (557)
Other comprehensive income (loss) ¥ 74,258 (60) 74,198

Yen (Millions) Before tax Tax (expense) Net-of-tax Amount or benefit amount 2012
Foreign currency translation adjustments: Amount arising during the year from investments in foreign
entities
¥ (5,999)
0
(5,999)Reclassification adjustments for the portion of gains and
losses realized upon sale or liquidation of investments in foreign entities
346
-
346 Net foreign currency translation adjustments (5,653) 0 (5,653)
Pension liability adjustments: Amount arising during the year (15,794) 2,734 (13,060)Reclassification adjustments for amortization and curtailment/settlement
7,556 (2,823) 4,733
Net pension liability adjustments (8,238) (89) (8,327)Unrealized gains (losses) on securities:
Unrealized holding gains (losses) arising for period (3,012) 1,173 (1,839)Reclassification adjustments for (gains) losses realized in net
income (loss)
4,055
(1,376)
2,679 Net unrealized gains (losses) 1,043 (203) 840
Other comprehensive income (loss) ¥ (12,848) (292) (13,140)
U.S. Dollars (Thousands) Before tax Tax (expense) Net-of-tax amount or benefit Amount 2014
Foreign currency translation adjustments: Amount arising during the year from investments in foreign
entities
$ 587,719
0 587,719Reclassification adjustments for the portion of gains and
losses realized upon sale or liquidation of investments in foreign entities
87
- 87Net foreign currency translation adjustments 587,806 0 587,806
Pension liability adjustments: Amount arising during the year 70,408 (21,816) 48,592Reclassification adjustments for amortization and curtailment/settlement
28,019 (6,835) 21,184
Net pension liability adjustments 98,427 (28,651) 69,776Unrealized gains (losses) on securities:
Unrealized holding gains (losses) arising for period 80,592 (19,922) 60,670Reclassification adjustments for (gains) losses realized in
net income
(20,602)
5,777 (14,825)Net unrealized gains (losses) 59,990 (14,145) 45,845
Other comprehensive income (loss) $ 746,223 (42,796) 703,427
Non controlling interests are included. The prior years’ figures also include non controlling interests
to conform to the presentation used for the year ended March 31, 2014.

13. Leases
TDK occupies offices and other facilities under various cancellable lease agreements expiring in 2015 through 2016.
The amount of assets under capital leases and the related accumulated depreciation included in property, plant and equipment on the consolidated balance sheets as of March 31, 2014 and 2013 are as follows: Yen
(Millions) U.S. Dollars (Thousands)
2014 2013 2014 Buildings -cost ¥ 5,596 4,682 $ 54,330 Machinery and equipment - cost 2,069 1,338 20,087 Accumulated depreciation (1,893) (1,424) (18,378) Net leased assets ¥ 5,772 4,596 $ 56,039
The depreciation expense for assets under capital leases is included in cost of sales and selling,
general and administrative expenses of the consolidated statements of operations. Operating leases expenses are ¥7,139 million ($69,311 thousand), ¥7,362 million and ¥7,016
million for the fiscal years ended March 31, 2014, 2013 and 2012, respectively. The following is a schedule by year of future minimum lease payments required under capital leases
and operating leases that have initial or remaining noncancellable lease terms in excess of one year as of March 31, 2014:
Yen
(Millions) U.S. Dollars (Thousands)
Capital leases Operating leases
Capital leases Operating leases
Year ending March 31, 2015 ¥ 1,024 ¥ 5,719 $ 9,942 $ 55,524 2016 1,454 4,294 14,116 41,689 2017 1,036 2,924 10,058 28,388 2018 846 1,748 8,214 16,971 2019 844 878 8,194 8,524 Later years 11,752 2,069 114,097 20,088
Total minimum lease payments ¥ 16,956
¥ 17,632
$ 164,621
$ 171,184
Amounts representing interest 10,371
100,689
Present value of net minimum lease payments
6,585
63,932
Current portion 370 3,592 Long-term lease obligations (Excluding current portion)
¥ 6,215
$ 60,340
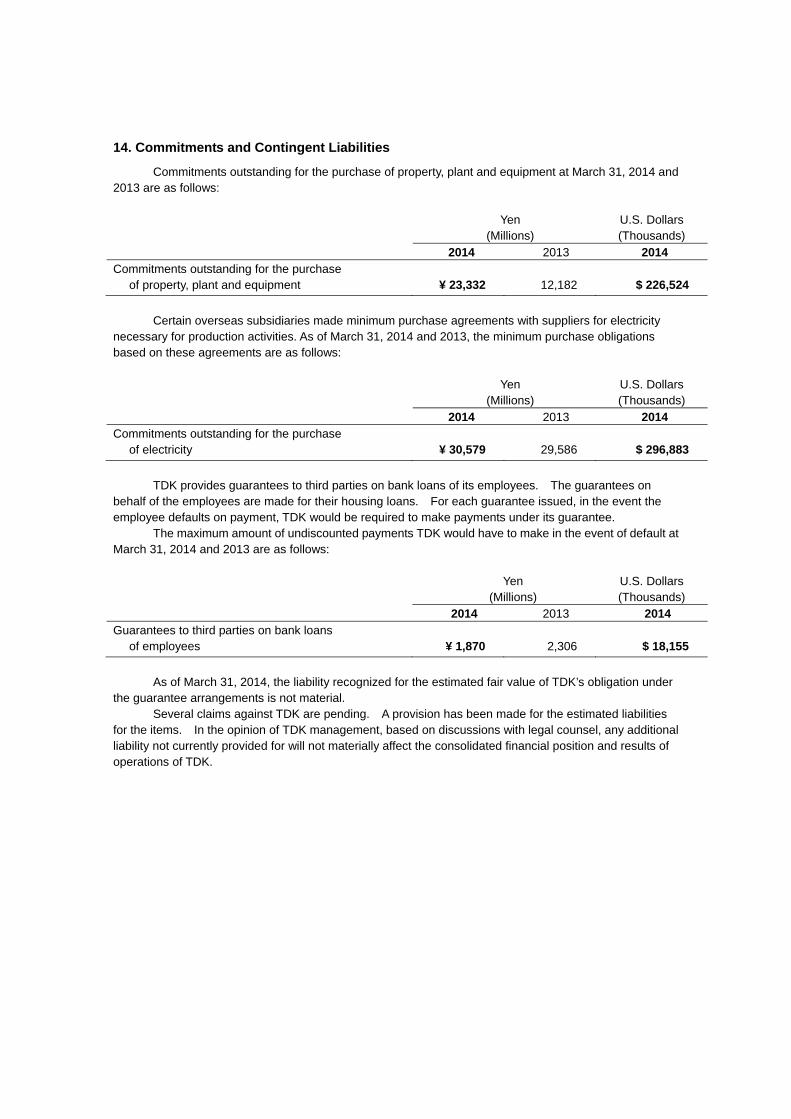
14. Commitments and Contingent Liabilities
Commitments outstanding for the purchase of property, plant and equipment at March 31, 2014 and 2013 are as follows: Yen
(Millions) U.S. Dollars (Thousands)
2014 2013 2014 Commitments outstanding for the purchase
of property, plant and equipment
¥ 23,332
12,182
$ 226,524
Certain overseas subsidiaries made minimum purchase agreements with suppliers for electricity necessary for production activities. As of March 31, 2014 and 2013, the minimum purchase obligations based on these agreements are as follows:
Yen
(Millions) U.S. Dollars (Thousands)
2014 2013 2014 Commitments outstanding for the purchase
of electricity
¥ 30,579
29,586
$ 296,883 TDK provides guarantees to third parties on bank loans of its employees. The guarantees on
behalf of the employees are made for their housing loans. For each guarantee issued, in the event the employee defaults on payment, TDK would be required to make payments under its guarantee.
The maximum amount of undiscounted payments TDK would have to make in the event of default at March 31, 2014 and 2013 are as follows: Yen
(Millions) U.S. Dollars (Thousands)
2014 2013 2014 Guarantees to third parties on bank loans
of employees
¥ 1,870
2,306
$ 18,155
As of March 31, 2014, the liability recognized for the estimated fair value of TDK’s obligation under the guarantee arrangements is not material.
Several claims against TDK are pending. A provision has been made for the estimated liabilities for the items. In the opinion of TDK management, based on discussions with legal counsel, any additional liability not currently provided for will not materially affect the consolidated financial position and results of operations of TDK.

15. Risk Management Activities and Derivative Financial Instruments
TDK operates internationally and is exposed to the risk of changes in foreign exchange rates as well as changes in raw material prices. TDK assesses these risks by continuously monitoring changes in the exchange rates and raw material prices and by evaluating hedging opportunities. Derivative financial instruments are utilized to reduce these risks. TDK does not hold or issue derivative financial instruments for trading purposes. TDK is exposed to credit related losses in the event of nonperformance by the counterparties to those derivative financial instruments, but does not expect any counterparties to fail to meet their obligations given their high credit ratings. The credit exposure of those financial instruments is represented by the fair values of contracts. The fair values of the contracts are calculated based on the quotes presented by financial institutions.
TDK uses forward foreign exchange contracts and currency swaps in order to offset foreign exchange gain (loss) mainly arising from foreign-currency denominated assets and liabilities and forecasted transactions. Also, TDK uses commodity forward transactions in order to control the fluctuation risk of raw material prices. Although these contracts are not designated as hedges, which is required to apply hedge accountings, TDK considers they are effective as hedges from an economic viewpoint. The fair values of these undesignated contracts are recognized as income or expenses as incurred.
Notional amounts of derivative financial instruments at March 31, 2014 and 2013 are as follows:
Yen (Millions) U.S. Dollars (Thousands)
2014 2013 2014 Forward foreign exchange contracts ¥ 94,707 60,877 $ 919,485 Currency swaps 34,022 32,130 330,311 Commodity forward transactions 1,297 - 12,592 ¥ 130,026 93,007 $ 1,262,388
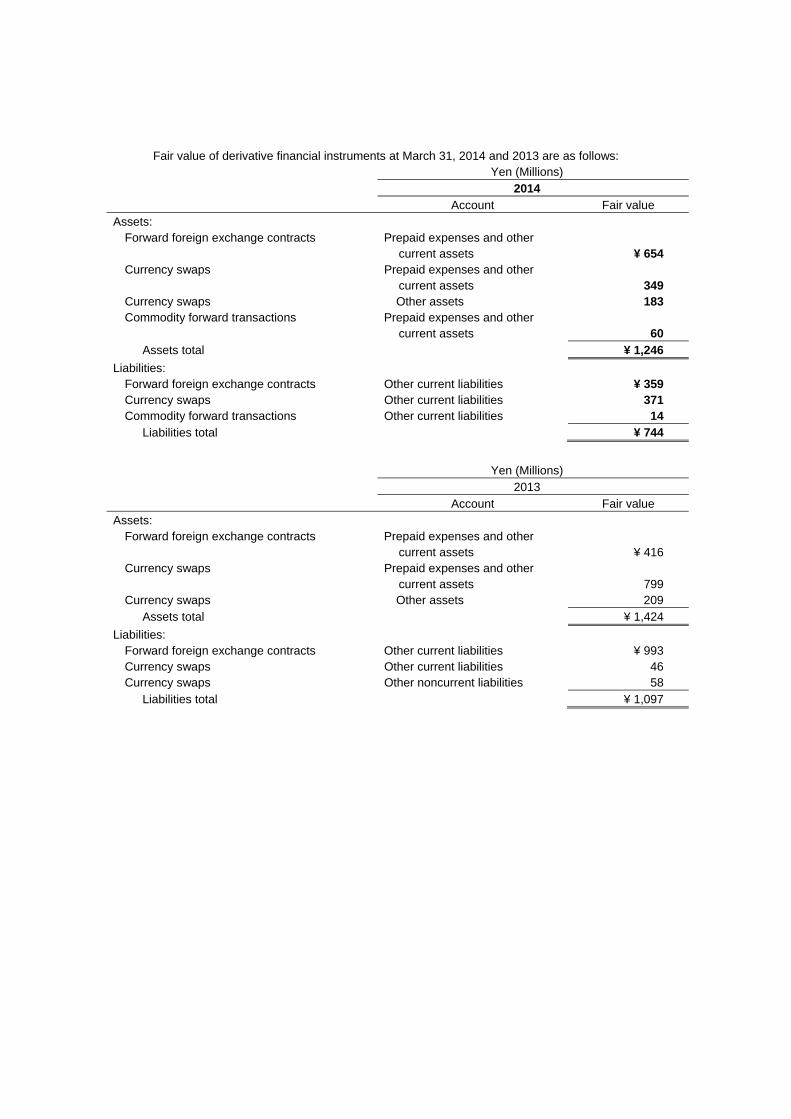
Fair value of derivative financial instruments at March 31, 2014 and 2013 are as follows:
Yen (Millions) 2014
Account Fair value Assets:
Forward foreign exchange contracts Prepaid expenses and other current assets
¥ 654
Currency swaps Prepaid expenses and other current assets
349
Currency swaps Other assets 183 Commodity forward transactions Prepaid expenses and other
current assets
60 Assets total ¥ 1,246
Liabilities: Forward foreign exchange contracts Other current liabilities ¥ 359 Currency swaps Other current liabilities 371 Commodity forward transactions Other current liabilities 14
Liabilities total ¥ 744
Yen (Millions)
2013 Account Fair value
Assets: Forward foreign exchange contracts Prepaid expenses and other
current assets
¥ 416 Currency swaps Prepaid expenses and other
current assets
799 Currency swaps Other assets 209
Assets total ¥ 1,424 Liabilities:
Forward foreign exchange contracts Other current liabilities ¥ 993 Currency swaps Other current liabilities 46 Currency swaps Other noncurrent liabilities 58
Liabilities total ¥ 1,097

U.S. Dollars (Thousands) 2014
Account Fair value Assets:
Forward foreign exchange contracts Prepaid expenses and other current assets
$ 6,349
Currency swaps Prepaid expenses and other current assets
3,388
Currency swaps Other assets 1,777 Commodity forward transactions Prepaid expenses and other
current assets
583 Assets total $ 12,097
Liabilities: Forward foreign exchange contracts Other current liabilities $ 3,485 Currency swaps Other current liabilities 3,602 Commodity forward transactions Other current liabilities 136
Liabilities total $ 7,223
The effect of derivative financial instruments on the consolidated statements of operations for the
years ended March 31, 2014, 2013 and 2012 are as follows:
Yen
(Millions) U.S. Dollars (Thousands)
Account 2014 2013 2012 2014 Forward foreign exchange
contracts Foreign exchange gain
(loss)
¥ (3,078)
(973)
(358)
$ (29,883) Currency swaps Foreign exchange gain
(loss)
(1,232)
4,278
1,831
(11,961) Commodity forward
transactions Cost of sales
60
-
-
582 ¥ (4,250) 3,305 1,473 $ (41,262)
16. Fair Value of Financial Instruments
The following methods and assumptions were used to estimate the fair value of financial instruments in cases for which it is practicable:
(a) Cash and cash equivalents, Short-term investments, Trade receivables, Income tax receivables, Prepaid expenses and other current assets, Short-term debt, Trade payables, Accrued salaries and wages, Accrued expenses, Income taxes payables and Other current liabilities
Except for derivative financial instruments, the carrying amount approximates fair value because of the short maturity of these instruments.
(b) Marketable securities and Investments in securities
The fair values of marketable securities and investments in securities are primarily estimated based on quoted market prices for these instruments.
(c) Long-term debt
The fair value of TDK’s long-term debt is estimated based on the amount of future cash flows associated with the instrument discounted using TDK’s current borrowing rate for similar debt of comparable maturity, or based on the quoted market prices for the same or similar issues. The long-term

debt is classified as Level 2, one of the three levels of fair value hierarchy that is discussed in Note 17 of the Notes to Consolidated Financial Statements.
The carrying amounts and estimated fair values of TDK’s financial instruments at March 31, 2014 and 2013 are summarized as follows:
As of March 31, 2014 Yen (Millions) Carrying amount Estimated fair value
Assets: Investments in securities and other assets for which it is:
Practicable to estimate fair value ¥ 34,519 34,519 Liability:
Long-term debt, including current portion (Excluding lease obligation)
(128,185)
(129,382)
As of March 31, 2013 Yen (Millions)
Carrying amount Estimated fair value Assets:
Marketable securities for which it is: Practicable to estimate fair value ¥ 900 900
Investments in securities and other assets for which it is:
Practicable to estimate fair value 27,582 27,582 Not practicable to estimate fair value 1,099 -
Liability: Long-term debt, including current portion (Excluding lease obligation)
(143,438)
(142,965)
As of March 31, 2014 U.S. Dollars (Thousands) Carrying amount Estimated fair value
Assets: Investments in securities and other assets for which it is:
Practicable to estimate fair value $ 335,136 335,136 Liability:
Long-term debt, including current portion (Excluding lease obligation)
(1,244,515)
(1,256,136)
Lease obligation is excluded from Long-term debt, including current portion. Prior year’s lease
obligation is also excluded to conform to the presentation used for as of March 31, 2014. Derivative financial instruments are presented in Note 15 of the Notes to Consolidated Financial Statements. Limitations
Fair value estimates are made at a specific point in time, based on relevant market information and information about the financial instruments. These estimates are subjective in nature and involve uncertainties and matters of significant judgment and therefore cannot be determined with precision. Changes in assumptions could significantly affect the estimates.
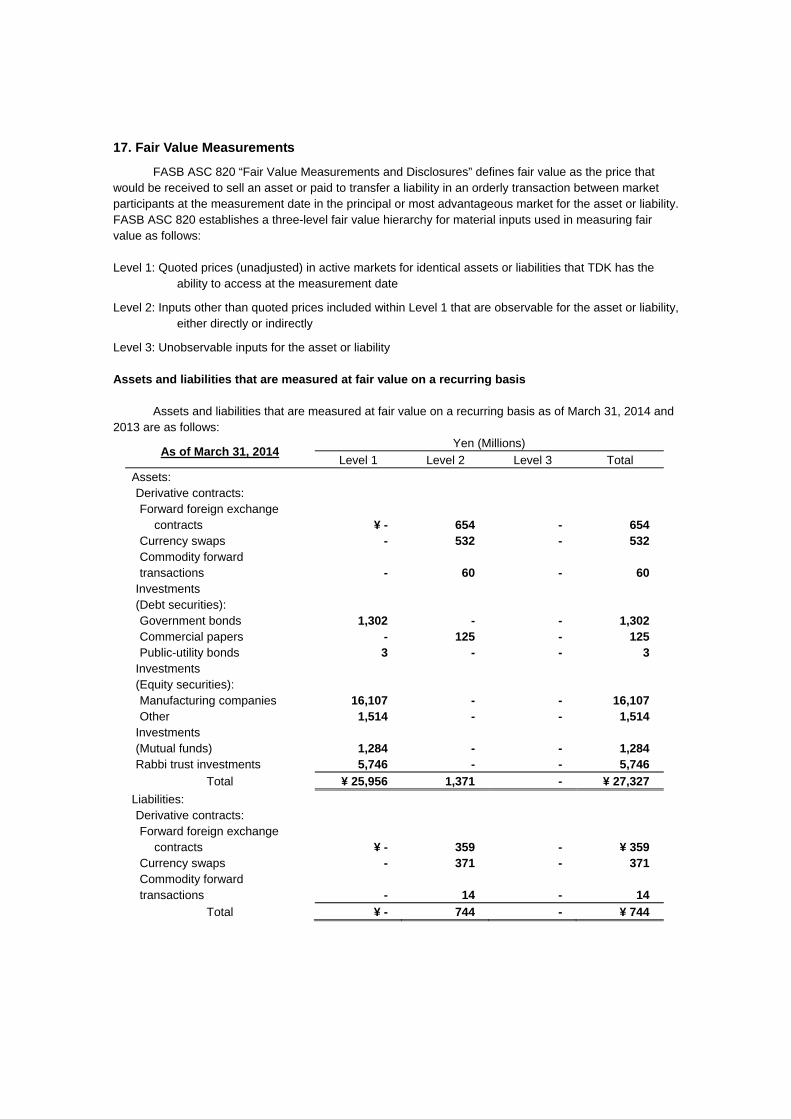
17. Fair Value Measurements
FASB ASC 820 “Fair Value Measurements and Disclosures” defines fair value as the price that would be received to sell an asset or paid to transfer a liability in an orderly transaction between market participants at the measurement date in the principal or most advantageous market for the asset or liability. FASB ASC 820 establishes a three-level fair value hierarchy for material inputs used in measuring fair value as follows:
Level 1: Quoted prices (unadjusted) in active markets for identical assets or liabilities that TDK has the
ability to access at the measurement date
Level 2: Inputs other than quoted prices included within Level 1 that are observable for the asset or liability, either directly or indirectly
Level 3: Unobservable inputs for the asset or liability
Assets and liabilities that are measured at fair value on a recurring basis Assets and liabilities that are measured at fair value on a recurring basis as of March 31, 2014 and
2013 are as follows:
As of March 31, 2014 Yen (Millions)
Level 1 Level 2 Level 3 Total Assets: Derivative contracts: Forward foreign exchange
contracts
¥ -
654
-
654 Currency swaps - 532 - 532 Commodity forward transactions
-
60
-
60
Investments (Debt securities):
Government bonds 1,302 - - 1,302 Commercial papers - 125 - 125 Public-utility bonds 3 - - 3
Investments (Equity securities):
Manufacturing companies 16,107 - - 16,107 Other 1,514 - - 1,514
Investments (Mutual funds)
1,284
-
-
1,284
Rabbi trust investments 5,746 - - 5,746 Total ¥ 25,956 1,371 - ¥ 27,327
Liabilities: Derivative contracts: Forward foreign exchange
contracts
¥ -
359
-
¥ 359 Currency swaps - 371 - 371 Commodity forward transactions
-
14
-
14
Total ¥ - 744 - ¥ 744

As of March 31, 2013 Yen (Millions)
Level 1 Level 2 Level 3 Total Assets: Marketable securities (Debt
securities):
Government bonds ¥ 900 - - ¥ 900 Derivative contracts: Forward foreign exchange
contracts
-
416
-
416 Currency swaps - 1,008 - 1,008
Investments (Debt securities):
Commercial papers - 97 - 97 Public-utility bonds 2 - - 2
Investments (Equity securities):
Manufacturing companies 11,986 - - 11,986 Other 1,346 - - 1,346
Investments (Mutual funds)
1,025
-
-
1,025
Rabbi trust investments 4,813 - - 4,813 Total ¥ 20,072 1,521 - ¥ 21,593
Liabilities: Derivative contracts: Forward foreign exchange
contracts
¥ -
993
-
¥ 993 Currency swaps - 104 - 104
Total ¥ - 1,097 - ¥ 1,097

As of March 31, 2014 U.S. Dollars (Thousands)
Level 1 Level 2 Level 3 Total Assets: Derivative contracts: Forward foreign exchange
contracts
$ -
6,349
-
$ 6,349 Currency swaps - 5,165 - 5,165 Commodity forward transactions
-
583
-
583
Investments (Debt securities): Government bonds 12,641 - - 12,641 Commercial papers - 1,214 - 1,214 Public-utility bonds 29 - - 29
Investments (Equity securities):
Manufacturing companies 156,378 - - 156,378 Other 14,699 - - 14,699
Investments (Mutual funds)
12,466
-
-
12,466
Rabbi trust investments 55,787 - - 55,787 Total $ 252,000 13,311 - $ 265,311
Liabilities: Derivative contracts: Forward foreign exchange
contracts
$ -
3,485
-
$ 3,485 Currency swaps - 3,602 - 3,602 Commodity forward transactions
-
136
-
136
Total $ - 7,223 - $ 7,223
Level 1 marketable securities and investments are valued using unadjusted quoted prices in active markets in which transactions occur with sufficient frequency and volume. Rabbi trusts investments included in other assets in which a part of the employees’ salary is deposited is valued using unadjusted quoted prices in active markets.
Level 2 derivative contracts include forward foreign exchange contracts, currency swaps and commodity forward transactions that are valued based on quotes obtained from counterparties and are verified using observable market inputs, such as foreign currency exchange rates and raw material prices. Investments consist of commercial papers and the fair values thereof are based on third-party assessments using observable market data.

Assets and liabilities that are measured at fair value on a nonrecurring basis The fair values measured on a nonrecurring basis for the years ended March 31, 2014 and 2013 are
as follows:
2014
Yen (Millions) Total gains (losses) for
2014 Level 1 Level 2 Level 3
Assets: Long-lived assets ¥ (4,441) - - 2,257
2013
Yen (Millions) Total gains (losses) for
2013 Level 1 Level 2 Level 3
Assets: Investments (Equity securities) ¥ (123) - - -
Long-lived assets (1,275) - - 5
Intangible assets (Trademark) (823) - - 3,000
2014
U.S. Dollars (Thousands) Total gains (losses) for
2014 Level 1 Level 2 Level 3
Assets: Long-lived assets $ (43,117) - - 21,913
For the year ended March 31, 2014, mainly based on the discounted future cash flows expected
from the use of each of the assets, the book value of long-lived assets, which were made up of property, plant and equipment and amortized intangible assets, of ¥6,698 million ($65,030 thousand) was written down to its fair value of ¥2,257 million ($21,913 thousand) due to impairment. Because unobservable inputs were used to determine each respective fair value, this is classified as Level 3.
As a result of the above, impairment loss of ¥4,441 million ($43,117 thousand) caused by other-than-temporary declines in fair values during the year ended March 31, 2014 was included in the consolidated statements of operations.

For the year ended March 31, 2013, investments which consist of nonmarketable securities valued using the cost method with the book value of ¥123 million was fully written down due to impairment. These nonmarketable securities are classified as Level 3 because their fair value was calculated using unobservable inputs. Mainly based on the discounted future cash flows expected from the use of each of the assets, the book value of long-lived assets, which were made up of property, plant and equipment and amortized intangible assets, of ¥1,280 million was written down to its fair value of ¥5 million, and according to the relief from royalty method, the book value of intangible assets (trademark) of ¥3,823 million was written down to its fair value of ¥3,000 million due to impairment. Because unobservable inputs were used to determine each respective fair value, these are classified as Level 3.
As a result of the above, impairment loss of ¥2,221 million caused by other-than-temporary declines in fair values during the year ended March 31, 2013 was included in the consolidated statements of operations.
18. Impairment of Long-Lived Assets
For the years ended March 31, 2014, 2013 and 2012, impairment losses of ¥4,441 million ($43,117 thousand), ¥1,275 million and ¥4,699 million, respectively, were recorded. These are the result of a reduction of the carrying value of the long-lived assets to the fair value because of a reduction in profitability derived from lower demand.
Impairment loss is mainly included in selling, general and administrative expenses in the consolidated statements of operations.
For the year ended March 31, 2014, the impairment loss includes ¥843 million ($8,184 thousand) for the Passive Components segment, ¥1,227 million ($11,913 thousand) for the Magnetic Application Product segment, ¥2,335 million ($22,670 thousand) for the Film Application Product segment and ¥36 million ($350 thousand) for the Other.
For the year ended March 31, 2013, the impairment loss includes ¥483 million for the Passive Components segment and ¥792 million for the Magnetic Application Product segment.
For the year ended March 31, 2012, the impairment loss includes ¥2,507 million for the Passive Components segment, ¥22 million for the Magnetic Application Products segment, ¥1,305 million for the Film Application Products segment, ¥859 million for the Other and ¥6 million for the head office function section included in Corporate.
The figures for discontinued operations are excluded from the above. The above figures for the years ended March 31, 2014 and 2012 include impairment loss of ¥158
million ($1,534 thousand) and ¥1,719 million that is a part of production realignment costs. Refer to Note 24 “Production realignment costs and Realignment-related gain; Sale of properties” for more details.

19. Goodwill and Other Intangible Assets
The components of acquired intangible assets excluding goodwill at March 31, 2014 and 2013 are as follows:
Yen (Millions) 2014 Gross Carrying
Amount Accumulated Amortization
Net Amount
Amortized intangible assets: Patent ¥ 40,887 26,087 14,800 Customer relationships 25,862 18,550 7,312 Software 27,306 14,022 13,284 Unpatented technologies 34,234 28,252 5,982 Other 6,839 1,462 5,377
Total 135,128 88,373 46,755
Unamortized intangible assets
Trademark 7,216 7,216
Other 243 243
Total ¥ 7,459 7,459
Yen (Millions) 2013 Gross Carrying
Amount Accumulated Amortization
Net Amount
Amortized intangible assets: Patent ¥ 41,721 23,218 18,503 Customer relationships 22,621 15,628 6,993 Software 23,055 11,414 11,641 Unpatented technologies 32,030 23,066 8,964 Other 5,762 1,133 4,629
Total 125,189 74,459 50,730
Unamortized intangible assets
Trademark 6,622 6,622
Other 252 252
Total ¥ 6,874 6,874

U.S. Dollars (Thousands) 2014 Gross Carrying
Amount Accumulated Amortization
Net Amount
Amortized intangible assets: Patent $ 396,961 253,272 143,689 Customer relationships 251,087 180,097 70,990 Software 265,107 136,136 128,971 Unpatented technologies 332,369 274,291 58,078 Other 66,398 14,194 52,204
Total 1,311,922 857,990 453,932
Unamortized intangible assets
Trademark 70,059 70,059
Other 2,359 2,359
Total $ 72,418 72,418 No significant intangible assets other than goodwill were acquired in the years ended March 31,
2014, 2013 and 2012.
Intangible assets subject to amortization are amortized using the straight-line method over their estimated useful lives to their estimated residual value of zero. The useful lives are 3 to 18 years for Patent, 4 to 17 years for Customer relationships, 2 to 10 years for Internal-use Software, 3 to 20 years for Unpatented technologies and 2 to 7 years for Other intangible assets.
Aggregate amortization expenses for the years ended March 31, 2014, 2013 and 2012 were
¥11,130 million ($108,058 thousand), ¥10,998 million and ¥12,231 million, respectively. Estimated amortization expense for the next five years is: ¥10,268 million in 2015, ¥7,364 million in 2016, ¥6,191 million in 2017, ¥4,696 million in 2018 and ¥4,064 million in 2019.
For the year ended March 31, 2013, an impairment loss of ¥823 million on trademark was
recognized due to a reduction in profitability resulting from a sluggish market and other factors. The trademark was included in the Magnetic Application Products segment and the fair value was measured according to the relief from royalty method. The impairment loss is included in selling, general and administrative expenses in the consolidated statements of operations.

The changes in the carrying amount of goodwill by segment for the years ended March 31, 2014
and 2013 are as follows:
Yen (Millions)
Passive
Components
Magnetic Application Products
Film Application Products
Other Total
March 31 , 2012 Goodwill ¥ 24,285 20,927 3,442 529 49,183 Accumulated impairment losses
-
(1,341)
-
(529)
(1,870) 24,285 19,586 3,442 - 47,313 Acquisitions - - 3,878 - 3,878 Impairments - - - - - Others - - (289) - (289) Translation adjustment 2,399 2,004 1,133 - 5,536 March 31 , 2013 Goodwill 26,684 23,125 8,164 606 58,579 Accumulated impairment losses
-
(1,535)
-
(606)
(2,141) 26,684 21,590 8,164 - 56,438 Acquisitions - 711 - - 711 Impairments - - - - - Others - - - - - Translation adjustment 4,449 1,507 786 - 6,742 March 31 , 2014 Goodwill 31,133 25,488 8,950 663 66,234 Accumulated impairment losses
-
(1,680)
-
(663)
(2,343) ¥ 31,133 23,808 8,950 - 63,891
U.S. Dollars (Thousands)
Passive Components
Magnetic Application Products
Film Application Products
Other Total
March 31 , 2013 Goodwill $ 259,068 224,515 79,262 5,883 568,728 Accumulated impairment losses
-
(14,903)
-
(5,883)
(20,786) 259,068 209,612 79,262 - 547,942 Acquisitions - 6,903 - - 6,903 Impairments - - - - - Others - - - - - Translation adjustment 43,194 14,631 7,631 - 65,456 March 31 , 2014 Goodwill 302,262 247,457 86,893 6,437 643,049 Accumulated impairment losses
-
(16,311)
-
(6,437)
(22,748) $ 302,262 231,146 86,893 - 620,301

Goodwill acquisitions for the year ended March 31, 2013 represent the excess of purchase price over the fair value of assets acquired and liabilities assumed in connection with the acquisition of Navitasys Technology Limited and its subsidiary which run an energy devices business.
20. Net Income (Loss) attributable to TDK per Share
A reconciliation of the numerators and denominators of the basic and diluted net income (loss) attributable to TDK per share computations is as follows:
Yen (Millions)
2014 2013 2012 Basic Diluted Basic Diluted Basic Diluted
Income (loss) from continuing operations attributable to TDK
¥ 18,940
17,896
1,822
1,302
1,304
1,000
Loss from discontinued operations attributable to TDK
(2,652)
(2,652)
(627)
(627)
(3,758)
(3,758)
Net income (loss) attributable to TDK 16,288
15,244
1,195
675
(2,454)
(2,758)
Number of shares (Thousands)
Weighted average common shares outstanding
125,808
125,808
125,852
125,852
128,747
128,747
Incremental shares arising from the exercise of stock option
-
207
-
178
-
-
Weighted average common shares outstanding - Total
125,808
126,015
125,852
126,030
128,747
128,747
Yen
Per common share : Income (loss) from continuing operations attributable to TDK
¥ 150.55
142.01
14.48
10.33
10.13
7.77
Loss from discontinued operations attributable to TDK
(21.08)
(21.08)
(4.98)
(4.98)
(29.19)
(29.19)
Net income (loss) attributable to TDK 129.47
120.97
9.50
5.36
(19.06)
(21.42)

U.S. Dollars (Thousands)
2014 Basic Diluted
Income (loss) from continuing operations attributable to TDK
$ 183,884
173,748
Loss from discontinued operations attributable to TDK
(25,748)
(25,748)
Net income (loss) attributable to TDK 158,136
148,000
Number of shares (Thousands)
Weighted average common shares outstanding
125,808
125,808
Incremental shares arising from the exercise of stock option
-
207
Weighted average common shares outstanding - Total
125,808
126,015
U.S. Dollars
Per common share : Income (loss) from continuing operations attributable to TDK
$ 1.46
1.38
Loss from discontinued operations attributable to TDK
(0.20)
(0.20)
Net income (loss) attributable to TDK 1.26
1.17
For the years ended March 31, 2014 and 2013, incremental 207,000 shares and 178,000 shares
arising from the exercise of stock options were excluded from the per share calculation of diluted loss from discontinued operations attributable to TDK as the effect would have been antidilutive.
The decline of income (loss) from continuing operations attributable to TDK and net income (loss) attributable to TDK for the years ended March 31, 2014, 2013 and 2012 were caused by a dilutive effect of stock options issued by a subsidiary of TDK Corporation.
Per common share data are calculated separately for income (loss) from continuing operations attributable to TDK, loss from discontinued operations attributable to TDK and net income (loss) attributable to TDK. Consequently diluted net income (loss) attributable to TDK per share for the years ended March 31, 2014 and 2013 were not equal to the sum of diluted income (loss) from continuing operations attributable to TDK per share and loss from discontinued operations attributable to TDK per share.
For the years ended March 31, 2014, 2013 and 2012, certain stock options issued by TDK Corporation were excluded from the diluted per share calculation of income (loss) from continuing operations attributable to TDK, loss from discontinued operations attributable to TDK, and net income (loss) attributable to TDK as the effect would have been antidilutive. The stock options issued by a subsidiary that are vested when a certain performance condition is achieved were also excluded from the diluted per share calculation of income (loss) from continuing operations attributable to TDK and net income (loss) attributable to TDK for the years ended March 31, 2014, 2013 and 2012 as it was not probable that the performance condition would be achieved as of March 31, 2014, 2013 and 2012.

21. Related Party Transaction
Receivables and payables include the following balances with affiliated companies at March 31, 2014 and 2013:
Yen (Millions) U.S. Dollars (Thousands)
2014 2013 2014 Due from ¥ 4,672 3,433 $ 45,359 Due to 1,798 3,373 17,456
Payables at March 31, 2013 included lease obligation of ¥2,826 million .
Purchases, research and development expenses, patent fee, advertising costs, interest expense, and sales transactions with affiliated companies for the years ended March 31, 2014, 2013 and 2012 are as follows:
Yen (Millions) U.S. Dollars (Thousands)
2014 2013 2012 2014 Gross purchase ¥ 9,111 6,320 17,851 $ 88,456 Less raw materials sold with no
mark-up
(5,234)
(2,709)
(9,940)
(50,815) Net purchases 3,877 3,611 7,911 37,641 Research and development
expenses and patent fee
1,346
1,425
1,250
13,068 Advertising costs 325 - - 3,155 Interest expenses 107 338 399 1,039 Sales 2,290 1,116 116 22,233

22. Discontinued Operations
As a part of reviewing the entire group portfolio and concentration in core competence, TDK withdrew from the data tape business and the blu-ray business, both of which belong to the Film Application Products segment, during the year ended March 31, 2014.
As a part of concentration in core competence, TDK withdrew from the display business after termination of the capital and business alliance with Futaba Corporation in the display business, which started on October 1, 2009. Accordingly, TDK sold all its shares in TDK Micro Device Corporation, TDK Corporation’s subsidiary engaged in development and manufacturing of displays, to Futaba Corporation on April 1, 2012.
In accordance with the provisions of FASB ASC 205-20, “Presentation of Financial Statements-Discontinued Operations”, profit and loss pertaining to the data tape business, the blu-ray business and the display business are presented under discontinued operations in the consolidated statements of operations.
The selected financial information for the discontinued operations for the years ended March 31,
2014, 2013 and 2012 are as follows:
Yen (Millions) U.S. Dollars (Thousands)
2014 2013 2012 2014
Net sales ¥ 6,409 9,728 13,755 $ 62,223 Cost of sales and expenses (includes
impairment loss ¥2,102 million in 2012 and ¥1,708 million ($16,583 thousand) in 2014)
11,989
10,635
19,543
116,398
Loss from discontinued operations (5,580)
(907)
(5,788)
(54,175)
Income taxes (1,978) (288) (1,389) (19,204) Net loss from discontinued
operations
(3,602)
(619)
(4,399)
(34,971) Net gain (loss) from discontinued
operations attributable to noncontrolling interests
(950)
8
(641)
(9,223) Net loss from discontinued
operations attributable to TDK
¥ (2,652)
(627)
(3,758)
$ (25,748)
23. Impact of the Damage from the Flood in Thailand on TDK Group’s Consolidated Performance
The Rojana plant and Wangnoi plant of TDK subsidiaries were directly affected by the major Thai floods that occurred in the year ended March 31, 2012. Their facilities and buildings were submerged, and their operations were forced to stop. TDK booked an insurance payout of ¥6,663 million that covers the damage as operating income for the year ended March 31, 2013.
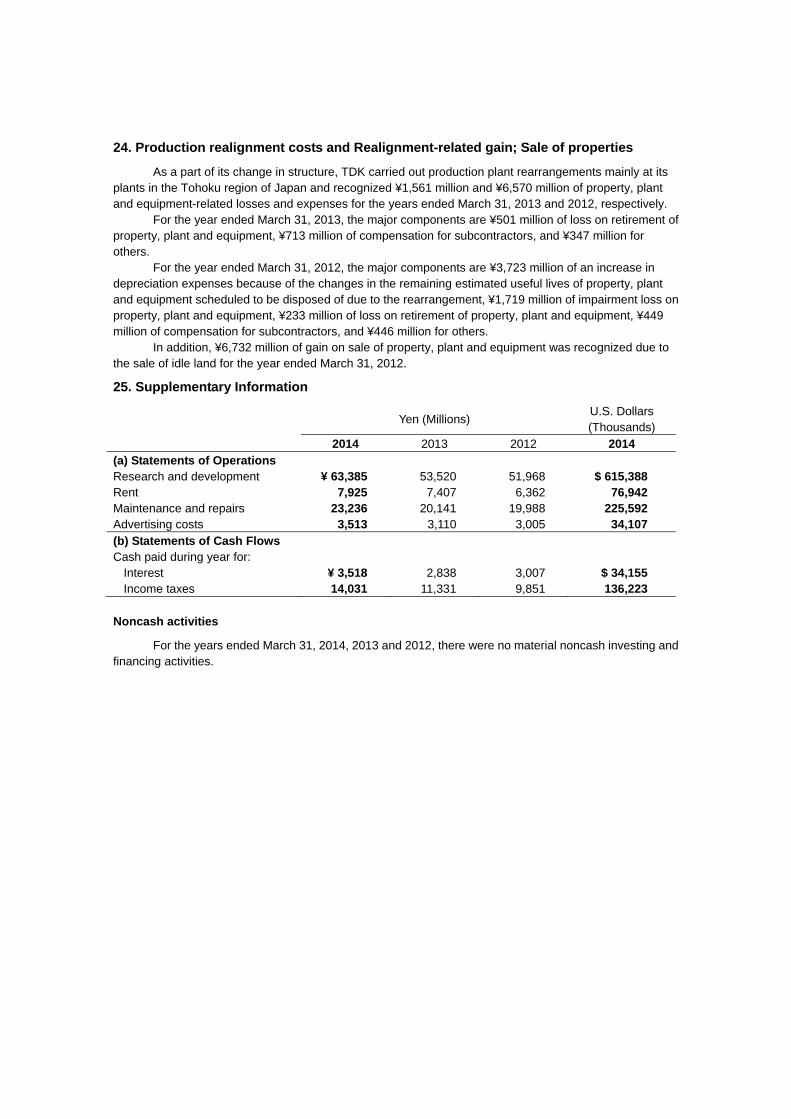
24. Production realignment costs and Realignment-related gain; Sale of properties
As a part of its change in structure, TDK carried out production plant rearrangements mainly at its plants in the Tohoku region of Japan and recognized ¥1,561 million and ¥6,570 million of property, plant and equipment-related losses and expenses for the years ended March 31, 2013 and 2012, respectively.
For the year ended March 31, 2013, the major components are ¥501 million of loss on retirement of property, plant and equipment, ¥713 million of compensation for subcontractors, and ¥347 million for others.
For the year ended March 31, 2012, the major components are ¥3,723 million of an increase in depreciation expenses because of the changes in the remaining estimated useful lives of property, plant and equipment scheduled to be disposed of due to the rearrangement, ¥1,719 million of impairment loss on property, plant and equipment, ¥233 million of loss on retirement of property, plant and equipment, ¥449 million of compensation for subcontractors, and ¥446 million for others.
In addition, ¥6,732 million of gain on sale of property, plant and equipment was recognized due to the sale of idle land for the year ended March 31, 2012.
25. Supplementary Information
Yen (Millions)
U.S. Dollars (Thousands) 2014 2013 2012 2014 (a) Statements of Operations Research and development ¥ 63,385 53,520 51,968 $ 615,388 Rent 7,925 7,407 6,362 76,942 Maintenance and repairs 23,236 20,141 19,988 225,592 Advertising costs 3,513 3,110 3,005 34,107 (b) Statements of Cash Flows Cash paid during year for:
Interest ¥ 3,518 2,838 3,007 $ 34,155 Income taxes 14,031 11,331 9,851 136,223
Noncash activities
For the years ended March 31, 2014, 2013 and 2012, there were no material noncash investing and financing activities.

26. Segment Information
Business Segment Information
Operating segments are components of TDK for which discrete financial information is available and whose operating results are regularly reviewed by management to make decisions about resources to be allocated to the segment and assess its performance.
Multiple operating segments that have similarities, including type and nature of products, production process, market and so on, are aggregated into the Passive Components segment, the Magnetic Application Products segment and the Film Application Products segment. Operating segments which are not reportable segments are included in Other.
The data tape business and the blu-ray business, both of which have become as discontinued operations from the year ended March 31, 2014, were included in the Film Application Products segment in prior years’ financial statements.
Principal businesses of each segment are as follows:
Segment Principal businesses
Passive Components
Ceramic capacitors, Aluminum electrolytic capacitors, Film capacitors, Inductive devices (Coils, Ferrite cores and Transformers), High-frequency components, Piezoelectric materials and circuit protection components, Sensors
Magnetic Application Products
Recording devices, Power supplies, Magnets
Film Application Products Energy devices (Rechargeable batteries), Applied films
Other Mechatronics (Production equipments), other
Intersegment transactions in operating segments are based on arm’s-length prices.

The business segment information for the years ended March 31, 2014, 2013 and 2012 are as follows.
Net sales and Segment profit (loss) related to discontinued operations are excluded for the years ended March 31, 2014, 2013 and 2012.
Net sales Yen
(Millions) U.S. Dollars
(Thousands) 2014 2013 2012 2014 Passive Components:
External customers ¥ 471,673 379,614 381,576 $ 4,579,350 Intersegment 3,038 3,272 2,664 29,495
Total 474,711 382,886 384,240 4,608,845 Magnetic Application Products:
External customers 364,291 337,947 316,402 3,536,806 Intersegment 356 277 335 3,456
Total 364,647 338,224 316,737 3,540,262 Film Application Products:
External customers 129,304 102,893 80,764 1,255,378 Intersegment 2,913 2,869 4,186 28,282 Total 132,217 105,762 84,950 1,283,660
Other:
External customers 19,257 21,393 23,792 186,961 Intersegment 8,112 16,478 20,998 78,757
Total 27,369 37,871 44,790 265,718 Intersegment eliminations (14,419) (22,896) (28,183) (139,990)
Total ¥ 984,525 841,847 802,534 $ 9,558,495
Segment profit (loss)
Yen (Millions)
U.S. Dollars (Thousands)
2014 2013 2012 2014 Passive Components ¥ 15,449 (11,053) (6,610) $ 149,990 Magnetic Application Products
28,120
37,088
39,028
273,010 Film Application Products 13,352 12,824 8,107 129,631 Other (3,196) (1,755) (4,839) (31,029)
Sub total 53,725 37,084 35,686 521,602 Corporate and Eliminations
(17,109)
(15,030)
(15,147)
(166,107)
Operating income 36,616 22,054 20,539 355,495 Other income (deductions), net
3,156
(2,289)
(5,871)
30,641 Income from continuing
operations before income taxes ¥ 39,772 19,765 14,668 $ 386,136

Segment profit (loss) consists of net sales less cost of sales and selling, general and administrative expenses except for those attribute to Corporate.
Corporate mainly includes expenses associated with head office functions that are not allocated to
operating segments. Assets Yen
(Millions) U.S. Dollars
(Thousands) 2014 2013 2014 Passive Components ¥ 555,734 510,163 $ 5,395,476 Magnetic Application Products 503,112 466,050 4,884,583 Film Application Products 158,107 128,380 1,535,019 Other 19,477 21,441 189,097 Corporate and Eliminations 3,159 43,608 30,670
Total ¥ 1,239,589 1,169,642 $ 12,034,845
Corporate mainly includes cash and cash equivalents and property, plant and equipment that are for general corporate use, deferred tax assets that are not allocated to operating segments, investments, and assets related to discontinued operations.
Figures related to discontinued operations are included in Corporate and Eliminations as of March 31, 2014 and 2013.
Depreciation and amortization (including Intangible assets other than Goodwill) Yen
(Millions) U.S. Dollars
(Thousands) 2014 2013 2012 2014 Passive Components ¥ 36,579 36,485 41,589 $ 355,136 Magnetic Application Products
32,073
30,225
27,865
311,388 Film Application Products 9,143 5,731 3,853 88,767 Other 546 600 684 5,301 Corporate and Eliminations
4,552
4,328
4,501
44,194 Total ¥ 82,893 77,369 78,492 $ 804,786
Figures related to discontinued operations are excluded for the years ended March 31, 2014, 2013
and 2012. Capital expenditure Yen
(Millions) U.S. Dollars
(Thousands) 2014 2013 2012 2014 Passive Components ¥ 32,499 36,789 49,869 $ 315,524 Magnetic Application Products 14,821 29,328 25,033 143,893 Film Application Products 14,659 13,742 16,725 142,321 Other 1,162 291 1,528 11,282 Corporate and Eliminations 5,465 5,456 6,498 53,058
Total ¥ 68,606 85,606 99,653 $ 666,078
Capital expenditures of discontinued operations are included in Corporate and Eliminations for all

periods presented. The prior year’s capital expenditures of discontinued operations are also reclassified to Corporate
and Eliminations to conform to the presentation used for the year ended March 31, 2014.
Geographic Segment Information
The geographic segment information for the years ended March 31, 2014, 2013 and 2012 are as follows.
The figures for the years ended March 31, 2013 and 2012 are restated based on current calculation method for sales by region.
Net sales related to discontinued operations are excluded for the years ended March 31, 2014, 2013 and 2012.
Net sales Yen
(Millions) U.S. Dollars
(Thousands) 2014 2013 2012 2014 Japan ¥ 94,005 105,832 110,572 $ 912,670 Americas 82,966 58,368 52,429 805,495 Europe 139,716 109,758 120,915 1,356,466 China 491,975 353,209 277,409 4,776,456 Asia and others 175,863 214,680 241,209 1,707,408
Total ¥ 984,525 841,847 802,534 $ 9,558,495
Net sales are based on the location of the customers.
Major countries in each geographic area : (1) Americas ...................... United States of America, Mexico (2) Europe ......................... Germany, France, Hungary (3) Asia and others ............ Thailand, Korea, Taiwan, Malaysia, Philippines
Property, plant and equipment Yen
(Millions) U.S. Dollars
(Thousands) 2014 2013 2014 Japan ¥ 112,618 130,326 $ 1,093,379 Americas 13,305 13,279 129,175 Europe 71,144 56,915 690,718 China 131,471 122,001 1,276,418 Asia and others 45,494 43,380 441,689
Total ¥ 374,032 365,901 $ 3,631,379
Major countries in each geographic area : (1) Americas ...................... United States of America (2) Europe ......................... Germany, Iceland, Hungary (3) Asia and others ............ Thailand, Singapore

Sales to major customers
For the years ended March 31, 2014 and 2013, there were two customer groups, and one customer group, respectively, that accounted for more than 10% of consolidated net sales. The net sales to one customer group for the year ended March 31, 2014 were approximately ¥107.0 billion ($1,038.8 million). The net sales to the other customer group for the years ended March 31, 2014 and 2013 were approximately ¥105.8 billion ($1,027.2 million) and ¥98.2 billion respectively.
The net sales to these customer groups were included mainly in the Magnetic Application Products segment.
For the year ended March 31, 2012, there was no customer group that accounted for more than 10% of consolidated net sales.

VI. Outline of filing company’s business concerning shares
Business year From April 1 to March 31
Ordinary General Meeting of Shareholders June
Record date March 31
Record dates for dividends from surplus
September 30 March 31
Number of shares consisting one unit 100 shares
Purchase demands or additional purchase requests of shares less than one unit:
Office for handling business
(Special Account) Stock Transfer Agency Business Planning Dept., Sumitomo Mitsui Trust Bank, Limited. 1-4-1 Marunouchi, Chiyoda-ku, Tokyo, Japan
Administrator of shareholder registry
(Special Account) Sumitomo Mitsui Trust Bank, Limited. 1-4-1 Marunouchi, Chiyoda-ku, Tokyo, Japan
Forwarding office –
Handling charge for purchase Free of charge
Method of public notice
Electronic public notice will be made. However, if TDK is unable to make an electronic public notice due to an incident or any other compelling reason, it will make an alternative public notice in “The Nikkei” newspaper. The electronic public notice will be notified on TDK’s website (http://www.tdk.co.jp).
Special benefits for shareholders None
Notes: Pursuant to the provisions of TDK Corporation’s Articles of Incorporation, the rights of holders of shares less than one unit are limited to the following: (i) rights listed in the items of Article 189, paragraph 2 of the Companies Act, (ii) rights to request to TDK Corporation in accordance with the provisions of Article 166, paragraph 1 of the same Act, (iii) rights to receive the allotment of the shares for subscription and the stock acquisition rights for subscription in accordance with the number of shares they hold, and (iv) rights to request to TDK Corporation to sell shares less than one unit.

VII. Reference information on filing company
1. Information on filing company’s parent company
TDK Corporation does not have a parent company.
B. INFORMATION ON GUARANTEE COMPANIES, ETC. OF FILING COMPANY No items to report

Management’s Annual Report on Internal Control over Financial Reporting
1. Matters relating to the basic framework for internal control over
financial reporting
President & Representative Director Takehiro Kamigama, and Chief Financial Officer Takakazu Momozuka of TDK Corporation are responsible for designing and operating effective internal control over financial reporting of TDK and have designed and operated internal control over financial reporting in accordance with the basic framework for internal control set forth in “On the Revision of the Standards and Practice Standards for Management Assessment and Audit concerning Internal Control Over Financial Reporting (Council Opinions)” released by the Business Accounting Council.
The internal control is designed to achieve its objectives to the extent reasonable through the effective function and combination of its basic elements. Therefore, there is a possibility that misstatements may not be completely prevented or detected by internal control over financial reporting.
2. Matters relating to the scope of assessment, the basis date of
assessment and the assessment procedures
The assessment of internal control over financial reporting was performed as of March 31, 2014, which is the end of the current fiscal year. The assessment was performed in accordance with assessment standards for internal control over financial reporting generally accepted in Japan.
In conducting this assessment, we evaluated internal controls which may have a material effect on our entire financial reporting on a consolidation basis (“company-level controls”) and based on the results of this evaluation, we selected business processes to be tested. In assessing the business processes, we analyzed these selected business processes, identified key controls that may have a material impact on the reliability of TDK’s financial reporting, and assessed the design and operation of these key controls. These procedures have allowed us to evaluate the effectiveness of the internal controls of TDK.
We determined the scope of assessment of internal control over financial reporting, covering TDK Corporation, consolidated subsidiaries and equity-method affiliates and deemed necessary from the perspective of the materiality that may affect the reliability of their financial reporting. The materiality that may affect the reliability of the financial reporting is determined taking into account the materiality of quantitative and qualitative impacts on financial reporting. In light of the results of assessment of company-level controls covering all locations and business units except for consolidated subsidiaries and equity-method affiliates whose materiality of such impacts were deemed immaterial, we reasonably determined the scope of assessment of internal controls over business processes.

Regarding the scope of assessment of internal control over business processes, we selected locations and/or business units to be tested in descending order of sales for the previous fiscal year, and the locations and/or business units whose combined sales volume reaches approximately two thirds of consolidated sales amount were selected as “significant locations and/or business units.” We included in the scope of assessment, at the selected significant locations and/or business units, business processes leading to sales, accounts receivable and inventories as significant accounts that may have a material impact on the business objectives of TDK. Further, in addition to selected significant locations and/or business units, we also selected for testing, as business processes having greater materiality, business processes relating to (i) greater likelihood of material misstatements and/or (ii) significant accounts involving estimates and the management’s judgment and/or (iii) a business or operation dealing with high-risk transactions, taking into account their impact on the financial reporting.
3. Matters relating to the results of the assessment
As a result of the assessment described above, as of the end of the current fiscal year, we concluded that TDK’s internal control over financial reporting was effectively maintained.
4. Additional notes
Not applicable.
5. Special notes
Not applicable.
Recommended