Stock Tales are concise, holistic stock reports across wider spectrum of sectors. Updates will not be periodical but based on significant events or change in price.
Stock_____
TALES
June 11, 2021

ICIC
I S
ecurit
ies –
Retail E
quit
y R
esearch
Stock T
ale
s
June 11, 2021
CMP: | 967 Target: | 1200 (24%) Target Period: 12 months
Just Dial Ltd (JUSDIA)
BUY
Key beneficiary of changing digital trend…
Just Dial (JDL) began operations in 1996 by offering local search services
under the Justdial brand. The company generates revenues from advertisers
who list themselves with JDL on various subscription and fee-based
packages. They pay fixed monthly or annual fees and can select from
premium and non-premium packages. We believe the company will be a key
beneficiary of a shift of advertising to the digital medium. This, coupled with
the company’s launch of B2B platform will be a key revenue driver for JDL
in the long run. This is expected to make the company a formidable player
in the B2B, B2C segments leading to revenue, PAT CAGR of 22%, 21%,
respectively, in FY21-23E.
B2B next growth engine
India’s MSME segment is digitally under penetrated. However, we expect
this scenario to change led by Covid-19. There is now increased need for a
digital medium to boost business growth. Further, although the B2B online
market has seen an influx of players, the paid subscribers as a percentage
of total MSME is just 1.3%. This represents tremendous scope for existing
and new players to grow. We believe JDL’s B2B platform JD Mart has
potential to become a significant player in this segment, going forward. The
company has shown a strong commitment to the new platform, by
committing to spend | 100-110 crore for branding & awareness, free leads
and hiring leaders. JDL also plans to provide end-to-end solutions like
logistics, financing, insurance & payment facilities to improve customer
stickiness. This will also enable the company to have two revenue streams
in the long run viz. subscription revenues and transaction-linked revenues.
Apart from these initiatives, JDL currently has 7-8 million listings in the B2B
segment. We believe the company can leverage this for cross sell and upsell.
This, coupled with the JDL’s large sales force (~8000) makes it well poised
to capture the burgeoning B2B market and become a significant player in
this segment.
B2C to improve with easing of lockdowns
We expect revenues to improve with easing of lockdowns and increase in
digital penetration. In addition, the company is also promoting download of
the JD app by providing JD cash against download & referrals. We believe
these initiatives, coupled with an improvement in realisation & increase in
digitisation will drive B2C business in the longer run.
Valuation & Outlook
Covid and changing consumer behaviour have led to increase in
virtualisation of business. Enterprises now have an omni channel presence
(in physical & digital world). JDL’s B2B and B2C platforms are well placed to
capture this burgeoning demand. Hence, we have a BUY recommendation
on the stock with a target price of | 1,200 (24x FY23E EPS).
Key Financial Summary s
Key Financials FY19 FY20 FY21 FY22E FY23E CAGR (FY21-23E)
Net Sales 892 953 675 773 997 21.5%
EBITDA 229 273 155 124 279 34.3%
EBITDA Margins (%) 25.7 28.6 22.9 16.0 28.0
Net Profit 207 272 214 175 311 20.5%
EPS (|) 31.9 42.0 33.0 28.3 50.3
P/E 30.3 23.0 29.3 34.2 19.2
RoNW (%) 20.7 21.1 16.9 12.9 20.6
RoCE (%) 27.4 25.7 19.0 14.9 24.2
Source: Company, ICICI Direct Research
Particulars
Particular Amount
Market Cap (| Crore) 5,981.9
Total Debt (| Crore) -
Cash and Invests (| Crore) 1,572.8
EV (| Crore) 4,409.0
52 week H/L 1063/33
Equity capital 61.9
Face value 10.0
Price Performance
0
500
1,000
1,500
5,000
7,000
9,000
11,000
13,000
15,000
17,000
19,000
Jun-18
Sep-1
8
Dec-18
Mar-19
Jun-19
Sep-1
9
Dec-19
Mar-20
Jun-20
Sep-2
0
Dec-20
Mar-21
Jun-21
Nifty (L.H.S) Price (R.H.S)
Key Risk
Inability of the company to make
significant inroads into B2B market
will adversely impact its growth
prospects
Inability to improve margins will
impact its profitability
Research Analyst
Devang Bhatt
ICICI Securities | Retail Research 2
ICICI Direct Research
Stock Tales | Just Dial Ltd
Company Background
Just Dial began its operations in 1996 by offering local search services under
the Just Dial brand. The website was launched in 2007. The main revenue
generation for JD comes from the advertisers who list themselves with the
company on various subscription and fee-based packages. They pay fixed
monthly or annual fees and can select from premium and non-premium
packages. Based on the package, the customer gets priority listing. The
pricing varies as per location, city and listing placement.
Apart from listing services, the company provides, search plus (which helps
in booking tickets, flight tickets, hotel booking, etc), website service (it helps
SMES in developing websites, mobile ready app & payment capability), JD
pay (which helps in payment transaction), ratings (helping SMEs get rating
& reviews) and JD social (a social media platform with social media type
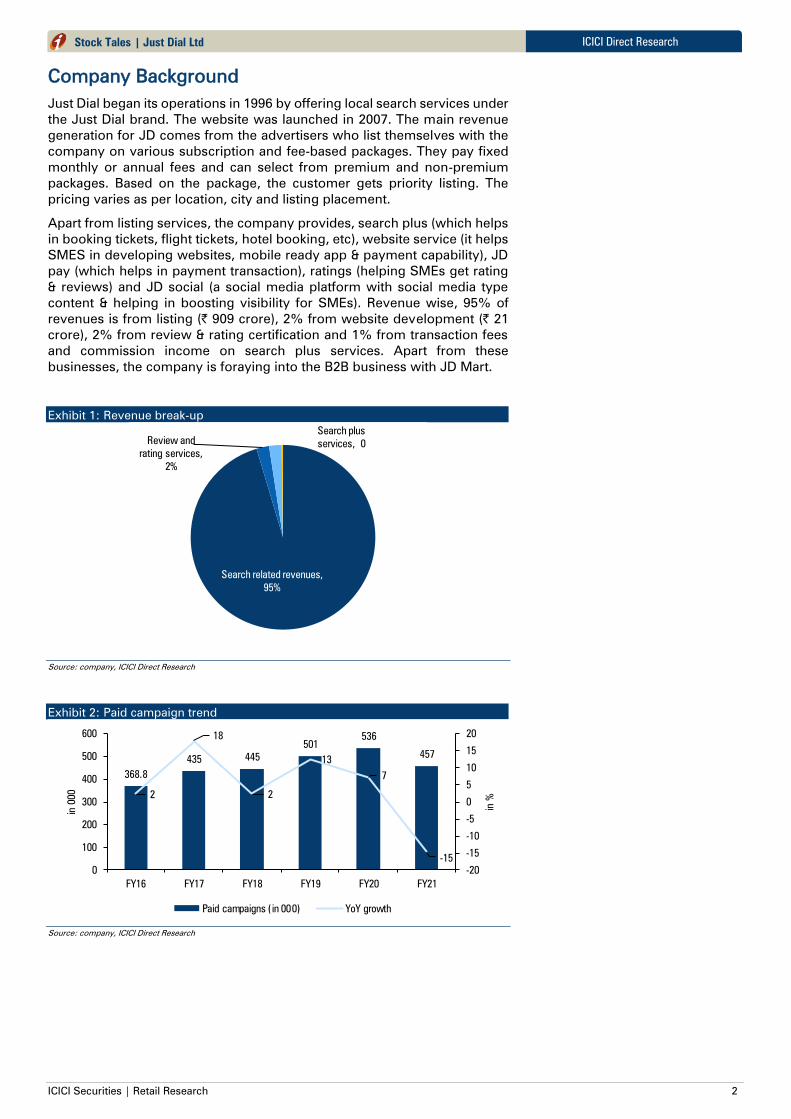
content & helping in boosting visibility for SMEs). Revenue wise, 95% of
revenues is from listing (| 909 crore), 2% from website development (| 21
crore), 2% from review & rating certification and 1% from transaction fees
and commission income on search plus services. Apart from these
businesses, the company is foraying into the B2B business with JD Mart.
Exhibit 1: Revenue break-up
Search related revenues,
95%
Software and
website …
Review and
rating services,
2%
Search plus
services, 0
Source: company, ICICI Direct Research
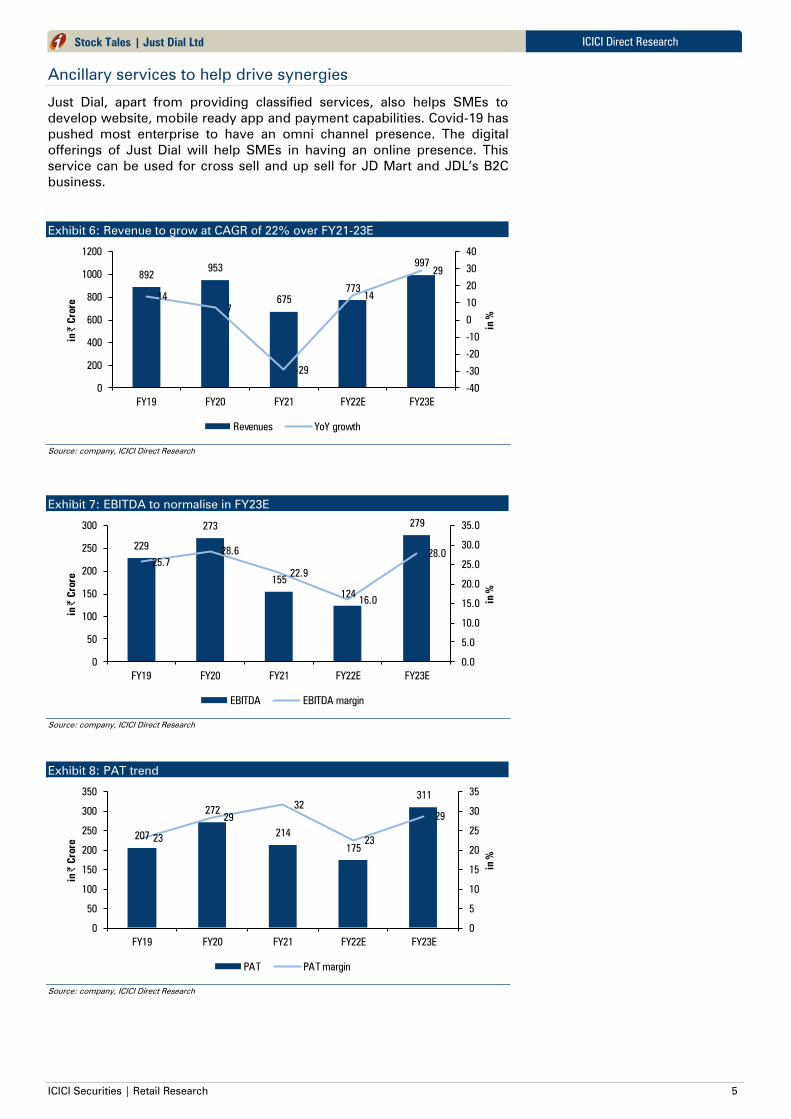
Exhibit 2: Paid campaign trend
368.8
435 445
501
536
457
2
18
2
13
7
-15
-20
-15
-10
-5
0
5
10
15
20
0
100
200
300
400
500
600
FY16 FY17 FY18 FY19 FY20 FY21
in %
in 000
Paid campaigns (in 000) YoY growth
Source: company, ICICI Direct Research

ICICI Securities | Retail Research 3
ICICI Direct Research
Stock Tales | Just Dial Ltd
Exhibit 3: Deferred revenue trend
211
274
332
405
336 330
0.5
30
21 22
-17
-2
-20
-10
0
10
20
30
40
0
50
100
150
200
250
300
350
400
450
FY16 FY17 FY18 FY19 FY20 FY21
in %
in | crore
Deffered revenues YoY growth
Source: company, ICICI Direct Research
Exhibit 4: Employee strength
3464
1298
3531
0
1000
2000
3000
4000
5000
6000
7000
8000
9000
FY21
Tele Sales Feet on street (marketing) Feet on street (JDA)
Source: company, ICICI Direct Research
Exhibit 5: Unique visit split (in %)
Mobile, 82%
Web, 13%
Voice, 5%
Source: company, ICICI Direct Research

ICICI Securities | Retail Research 4
ICICI Direct Research
Stock Tales | Just Dial Ltd
Investment Rationale
B2B platform long term growth driver
Out of the ~20 million MSMEs in India, just 32% were digitally connected in
2017 and 17% used the internet for business purposes. On the other hand,
54% of small businesses in the US used e-mail for business in 2017 while
51% had their own website. However, we expect this scenario to change
with growth in internet penetration throughout India along with increased
accessibility and affordability of smartphones. In addition, Covid 19 is
expected to further boost digitisation of MSMEs. In addition, a B2B digital
platform not only helps buyer & sellers with more opportunities but also
helps them in reducing cost like distributor margins and other commissions.
This represents tremendous scope for an online B2B player like JD Mart.
Although IndiaMart is a leader in the B2B segment with ~1,52,000 paid
subscribers, the overall market of paid subscribers as a percentage of total
MSME is just ~1.3%. This represents tremendous scope for existing and
new players to grow.
JDL, currently, is in its initial phase of branding and making JD Mart
remunerative. Hence, the company is planning to spend ~ | 100-110 crore
(of which ~| 50 crore was spent on IPL) on JD Mart. The aim is to push for
higher downloads and brand awareness. Once the download is done (either
proactively or via salesforce), the company plans to give free leads worth
~| 20,000-30,000 for 30-60 days and free catalogues to boost the network
effect.
Further, in order to make the app monetisable the company is planning to
provide logistics service (with 10-11 logistic players), payment facility,
working capital financing and insurance services. This will help in providing
end-to-end solution to customers and also help in increasing stickiness of
customers. In addition, JDL will have two revenue streams in the long run
viz. subscription revenues and transaction-linked revenues.
Apart from advertisement, the company currently has 7-8 million listings
(out of 30 million listings) in the B2B segment. We believe the company can
leverage this for cross sell as well as upsell. This, coupled with the
company’s large sales force (~8000) will further help drive new sales in JD
Mart. In addition, JDL has on-boarded a sales & marketing head for its B2B
business and identified a 500-600 member dedicated sales team for B2B with
focus on metros and tier-1 cities like Delhi NCR, Mumbai, Ahmedabad, Surat,
Rajkot, Jaipur, Pune. We expect JD Mart to generate revenues from FY23E
onwards. However, meaningful contribution to topline is expected to be
seen in subsequent years.
B2C business to improve in H2FY22E
In the near term, we expect revenues to be impacted due to a decline in new
sales (led by lockdown). In addition, we expect margins to be impacted by
increase in advertising expenses (| 50 crore to promote JD Mart). However,
we expect revenues to improve with easing of lockdown and increase in
digital penetration. In addition, JDL is also promoting download of JD app
by providing JD cash against download & referrals. JD Cash is like virtual
cash, which can be used for buying online tickets and against restaurants,
spas & various other establishments once lockdown eases. We believe these
initiatives, coupled with improvement in realisation & improvement in
digitisation will drive the B2C business in the longer run.
ICICI Securities | Retail Research 5
ICICI Direct Research
Stock Tales | Just Dial Ltd
Ancillary services to help drive synergies
Just Dial, apart from providing classified services, also helps SMEs to
develop website, mobile ready app and payment capabilities. Covid-19 has
pushed most enterprise to have an omni channel presence. The digital
offerings of Just Dial will help SMEs in having an online presence. This
service can be used for cross sell and up sell for JD Mart and JDL’s B2C
business.
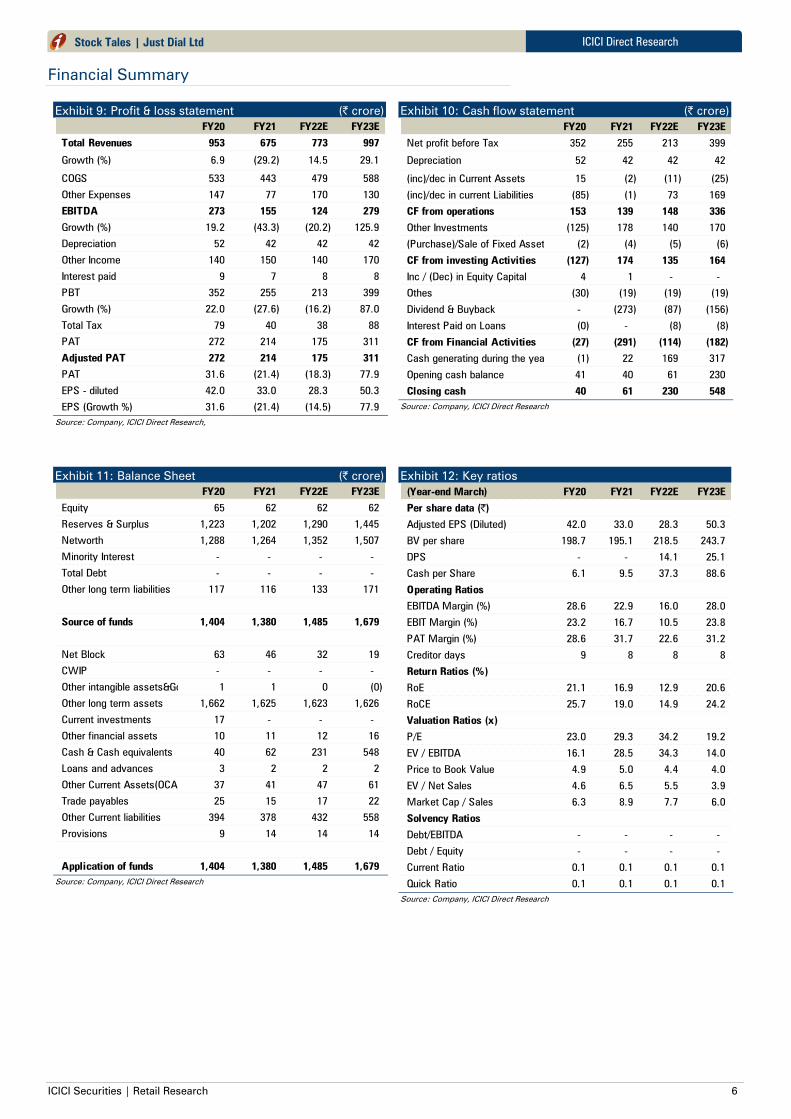
Exhibit 6: Revenue to grow at CAGR of 22% over FY21-23E
892953
675
773
997
14
7
-29
14
29
-40
-30
-20
-10
0
10
20
30
40
0
200
400
600
800
1000
1200
FY19 FY20 FY21 FY22E FY23E
in %
in |
C
rore
Revenues YoY growth
Source: company, ICICI Direct Research
Exhibit 7: EBITDA to normalise in FY23E
229
273
155
124
279
25.7
28.6
22.9
16.0
28.0
0.0
5.0
10.0
15.0
20.0
25.0
30.0
35.0
0
50
100
150
200
250
300
FY19 FY20 FY21 FY22E FY23E
in %
in |
C
rore
EBITDA EBITDA margin
Source: company, ICICI Direct Research
Exhibit 8: PAT trend
207
272
214
175
311
23
29
32
23
29
0
5
10
15
20
25
30
35
0
50
100
150
200
250
300
350
FY19 FY20 FY21 FY22E FY23E
in %
in |
C
rore
PAT PAT margin
Source: company, ICICI Direct Research
ICICI Securities | Retail Research 6
ICICI Direct Research
Stock Tales | Just Dial Ltd
Financial Summary
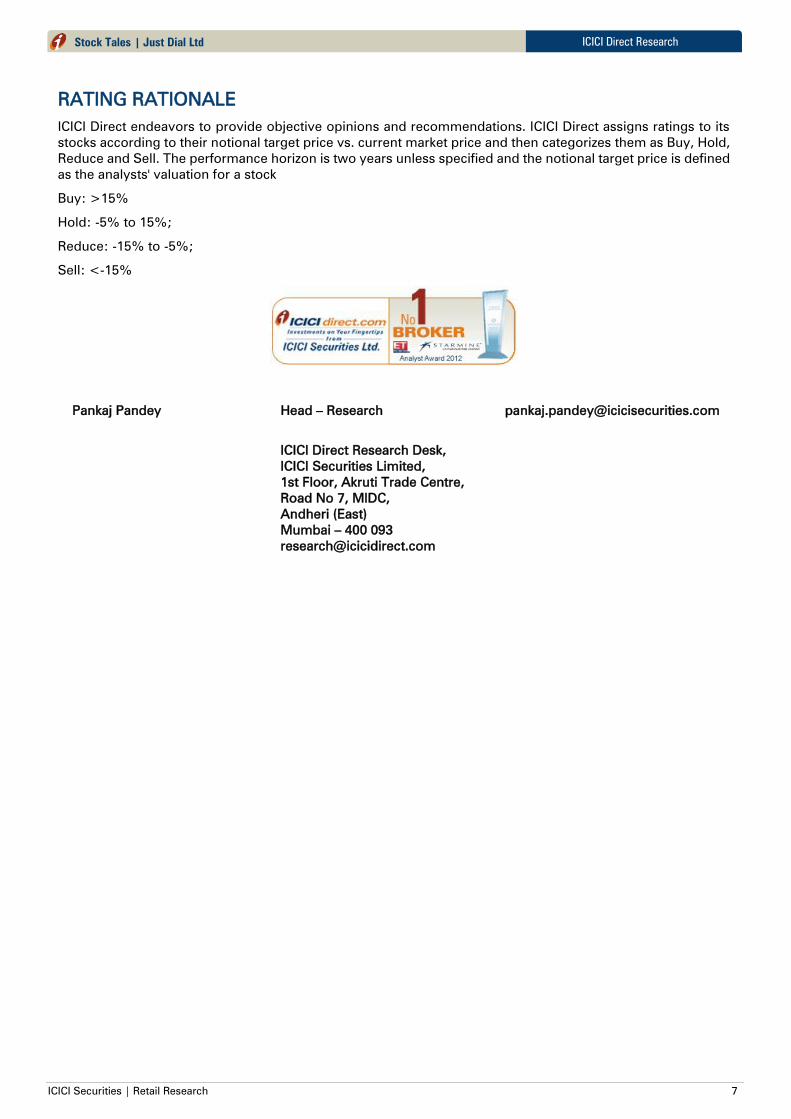
Exhibit 9: Profit & loss statement (| crore)
FY20 FY21 FY22E FY23E
Total Revenues 953 675 773 997
Growth (%) 6.9 (29.2) 14.5 29.1
COGS 533 443 479 588
Other Expenses 147 77 170 130
EBITDA 273 155 124 279
Growth (%) 19.2 (43.3) (20.2) 125.9
Depreciation 52 42 42 42
Other Income 140 150 140 170
Interest paid 9 7 8 8
PBT 352 255 213 399
Growth (%) 22.0 (27.6) (16.2) 87.0
Total Tax 79 40 38 88
PAT 272 214 175 311
Adjusted PAT 272 214 175 311
PAT 31.6 (21.4) (18.3) 77.9
EPS - diluted 42.0 33.0 28.3 50.3
EPS (Growth %) 31.6 (21.4) (14.5) 77.9
Source: Company, ICICI Direct Research,
Exhibit 10: Cash flow statement (| crore)
FY20 FY21 FY22E FY23E
Net profit before Tax 352 255 213 399
Depreciation 52 42 42 42
(inc)/dec in Current Assets 15 (2) (11) (25)
(inc)/dec in current Liabilities (85) (1) 73 169
CF from operations 153 139 148 336
Other Investments (125) 178 140 170
(Purchase)/Sale of Fixed Assets (2) (4) (5) (6)
CF from investing Activities (127) 174 135 164
Inc / (Dec) in Equity Capital 4 1 - -
Othes (30) (19) (19) (19)
Dividend & Buyback - (273) (87) (156)
Interest Paid on Loans (0) - (8) (8)
CF from Financial Activities (27) (291) (114) (182)
Cash generating during the year (1) 22 169 317
Opening cash balance 41 40 61 230
Closing cash 40 61 230 548
Source: Company, ICICI Direct Research
Exhibit 11: Balance Sheet (| crore)
FY20 FY21 FY22E FY23E
Equity 65 62 62 62
Reserves & Surplus 1,223 1,202 1,290 1,445
Networth 1,288 1,264 1,352 1,507
Minority Interest - - - -
Total Debt - - - -
Other long term liabilities 117 116 133 171
Source of funds 1,404 1,380 1,485 1,679
Net Block 63 46 32 19
CWIP - - - -
Other intangible assets&Goodwill 1 1 0 (0)
Other long term assets 1,662 1,625 1,623 1,626
Current investments 17 - - -
Other financial assets 10 11 12 16
Cash & Cash equivalents 40 62 231 548
Loans and advances 3 2 2 2
Other Current Assets(OCA) 37 41 47 61
Trade payables 25 15 17 22
Other Current liabilities 394 378 432 558
Provisions 9 14 14 14
Application of funds 1,404 1,380 1,485 1,679
Source: Company, ICICI Direct Research
Exhibit 12: Key ratios
(Year-end March) FY20 FY21 FY22E FY23E
Per share data (|)
Adjusted EPS (Diluted) 42.0 33.0 28.3 50.3
BV per share 198.7 195.1 218.5 243.7
DPS - - 14.1 25.1
Cash per Share 6.1 9.5 37.3 88.6
Operating Ratios
EBITDA Margin (%) 28.6 22.9 16.0 28.0
EBIT Margin (%) 23.2 16.7 10.5 23.8
PAT Margin (%) 28.6 31.7 22.6 31.2
Creditor days 9 8 8 8
Return Ratios (%)
RoE 21.1 16.9 12.9 20.6
RoCE 25.7 19.0 14.9 24.2
Valuation Ratios (x)
P/E 23.0 29.3 34.2 19.2
EV / EBITDA 16.1 28.5 34.3 14.0
Price to Book Value 4.9 5.0 4.4 4.0
EV / Net Sales 4.6 6.5 5.5 3.9
Market Cap / Sales 6.3 8.9 7.7 6.0
Solvency Ratios
Debt/EBITDA - - - -
Debt / Equity - - - -
Current Ratio 0.1 0.1 0.1 0.1
Quick Ratio 0.1 0.1 0.1 0.1
Source: Company, ICICI Direct Research
ICICI Securities | Retail Research 7
ICICI Direct Research
Stock Tales | Just Dial Ltd
RATING RATIONALE
ICICI Direct endeavors to provide objective opinions and recommendations. ICICI Direct assigns ratings to its
stocks according to their notional target price vs. current market price and then categorizes them as Buy, Hold,
Reduce and Sell. The performance horizon is two years unless specified and the notional target price is defined
as the analysts' valuation for a stock
Buy: >15%
Hold: -5% to 15%;
Reduce: -15% to -5%;
Sell: <-15%
Pankaj Pandey Head – Research [email protected]
ICICI Direct Research Desk,
ICICI Securities Limited,
1st Floor, Akruti Trade Centre,
Road No 7, MIDC,
Andheri (East)
Mumbai – 400 093
ICICI Securities | Retail Research 8
ICICI Direct Research
Stock Tales | Just Dial Ltd
ANALYST CERTIFICATION
I/We, Devang Bhatt, PGDBM, authors and the names subscribed to this report, hereby certify that all of the views expressed in this research report accurately reflect our views about the subject issuer(s) or securities. We also certify
that no part of our compensation was, is, or will be directly or indirectly related to the specific recommendation(s) or view(s) in this report. It is also confirmed that above mentioned Analysts of this report have not received any
compensation from the companies mentioned in the report in the preceding twelve months and do not serve as an officer, director or employee of the companies mentioned in the report.
Terms & conditions and other disclosures:
ICICI Securities Limited (ICICI Securities) is a full-service, integrated investment banking and is, inter alia, engaged in the business of stock brokering and distribution of financial products.
ICICI Securities is Sebi registered stock broker, merchant banker, investment adviser, portfolio manager and Research Analyst. ICICI Securities is registered with Insurance Regulatory Development Authority of India Limited (IRDAI)
as a composite corporate agent and with PFRDA as a Point of Presence. ICICI Securities Limited Research Analyst SEBI Registration Number – INH000000990. ICICI Securities Limited SEBI Registration is INZ000183631 for stock
broker. ICICI Securities is a subsidiary of ICICI Bank which is India’s largest private sector bank and has its various subsidiaries engaged in businesses of housing finance, asset management, life insurance, general insurance, venture
capital fund management, etc. (“associates”), the details in respect of which are available on www.icicibank.com.
ICICI Securities is one of the leading merchant bankers/ underwriters of securities and participate in virtually all securities trading markets in India. We and our associates might have investment banking and other business relationship
with a significant percentage of companies covered by our Investment Research Department. ICICI Securities and its analysts, persons reporting to analysts and their relatives are generally prohibited from maintaining a financial
interest in the securities or derivatives of any companies that the analysts cover.
Recommendation in reports based on technical and derivative analysis centre on studying charts of a stock's price movement, outstanding positions, trading volume etc as opposed to focusing on a company's fundamentals and, as
such, may not match with the recommendation in fundamental reports. Investors may visit icicidirect.com to view the Fundamental and Technical Research Reports.
Our proprietary trading and investment businesses may make investment decisions that are inconsistent with the recommendations expressed herein.
ICICI Securities Limited has two independent equity research groups: Institutional Research and Retail Research. This report has been prepared by the Retail Research. The views and opinions expressed in this document may or may
not match or may be contrary with the views, estimates, rating, and target price of the Institutional Research.
The information and opinions in this report have been prepared by ICICI Securities and are subject to change without any notice. The report and information contained herein is strictly confidential and meant solely for the selected
recipient and may not be altered in any way, transmitted to, copied or distributed, in part or in whole, to any other person or to the media or reproduced in any form, without prior written consent of ICICI Securities. While we would
endeavour to update the information herein on a reasonable basis, ICICI Securities is under no obligation to update or keep the information current. Also, there may be regulatory, compliance or other reasons that may prevent ICICI
Securities from doing so. Non-rated securities indicate that rating on a particular security has been suspended temporarily and such suspension is in compliance with applicable regulations and/or ICICI Securities policies, in
circumstances where ICICI Securities might be acting in an advisory capacity to this company, or in certain other circumstances.
This report is based on information obtained from public sources and sources believed to be reliable, but no independent verification has been made nor is its accuracy or completeness guaranteed. This report and information herein
is solely for informational purpose and shall not be used or considered as an offer document or solicitation of offer to buy or sell or subscribe for securities or other financial instruments. Though disseminated to all the customers
simultaneously, not all customers may receive this report at the same time. ICICI Securities will not treat recipients as customers by virtue of their receiving this report. Nothing in this report constitutes investment, legal, accounting
and tax advice or a representation that any investment or strategy is suitable or appropriate to your specific circumstances. The securities discussed and opinions expressed in this report may not be suitable for all investors, who
must make their own investment decisions, based on their own investment objectives, financial positions and needs of specific recipient. This may not be taken in substitution for the exercise of independent judgment by any recipient.
The recipient should independently evaluate the investment risks. The value and return on investment may vary because of changes in interest rates, foreign exchange rates or any other reason. ICICI Securities accepts no liabilities
whatsoever for any loss or damage of any kind arising out of the use of this report. Past performance is not necessarily a guide to future performance. Investors are advised to see Risk Disclosure Document to understand the risks
associated before investing in the securities markets. Actual results may differ materially from those set forth in projections. Forward-looking statements are not predictions and may be subject to change without notice.
ICICI Securities or its associates might have managed or co-managed public offering of securities for the subject company or might have been mandated by the subject company for any other assignment in the past twelve months.
ICICI Securities or its associates might have received any compensation from the companies mentioned in the report during the period preceding twelve months from the date of this report for services in respect of managing or co-
managing public offerings, corporate finance, investment banking or merchant banking, brokerage services or other advisory service in a merger or specific transaction.
ICICI Securities encourages independence in research report preparation and strives to minimize conflict in preparation of research report. ICICI Securities or its associates or its analysts did not receive any compensation or other
benefits from the companies mentioned in the report or third party in connection with preparation of the research report. Accordingly, neither ICICI Securities nor Research Analysts and their relatives have any material conflict of
interest at the time of publication of this report.
Compensation of our Research Analysts is not based on any specific merchant banking, investment banking or brokerage service transactions.
ICICI Securities or its subsidiaries collectively or Research Analysts or their relatives do not own 1% or more of the equity securities of the Company mentioned in the report as of the last day of the month preceding the publication of
the research report.
Since associates of ICICI Securities and ICICI Securities as a entity are engaged in various financial service businesses, they might have financial interests or beneficial ownership in various companies including the subject
company/companies mentioned in this report.
ICICI Securities may have issued other reports that are inconsistent with and reach different conclusion from the information presented in this report.
Neither the Research Analysts nor ICICI Securities have been engaged in market making activity for the companies mentioned in the report.
We submit that no material disciplinary action has been taken on ICICI Securities by any Regulatory Authority impacting Equity Research Analysis activities.
This report is not directed or intended for distribution to, or use by, any person or entity who is a citizen or resident of or located in any locality, state, country or other jurisdiction, where such distribution, publication, availability or
use would be contrary to law, regulation or which would subject ICICI Securities and affiliates to any registration or licensing requirement within such jurisdiction. The securities described herein may or may not be eligible for sale in
all jurisdictions or to certain category of investors. Persons in whose possession this document may come are required to inform themselves of and to observe such restriction.
Recommended