Julian Hodge Bank Limited
Annual report and financial
statements
31 October 2016
Registered number 743437
Julian Hodge Bank Limited Registered number 743437
Annual report and financial statements 31 October 2016
Officers and professional advisers
Directors Keith James O.B.E., M.A. Chairman
Jonathan Hodge Deputy Chairman
David Austin LL.B., A.C.A. Managing Director
David Landen B.Sc., F.C.C.A. Finance Director
Alun Bowen M.A., F.C.A.
Adrian Piper B.A., M.Sc., M.C.I.P.D., M.C.I.M.
Helen Molyneux LLD (Hons)
Company Secretary Rhian Yates B.Sc., F.C.C.A.
Registered Office One Central Square
Cardiff
CF10 1FS
Auditor Ernst & Young LLP
Bristol
Principal bankers Lloyds Bank Plc
London
Barclays Bank Plc
Cardiff
Economic adviser Professor Patrick Minford
Cardiff Business School
Julian Hodge Bank Limited Registered number 743437
Annual report and financial statements 31 October 2016
Contents
Chairman’s statement 1
Strategic report 5
Directors’ report 12
Directors' responsibilities statement 14
Independent auditor's report 15
Income Statement 18
Balance Sheet 19
Statement of Changes in Equity 20
Notes 21
Julian Hodge Bank Limited Registered number 743437
Annual report and financial statements
31 October 2016
Julian Hodge Bank Limited
1
Chairman’s statement
I am pleased to present the Bank’s results for the year ended 31 October 2016.
The Bank has enjoyed an exceptional year, making a pre-tax profit of £22.8 million (2015:
£1.6 million). The results for this year reflect the transition to FRS101 and the prior year
figures have been restated to be comparable.
FRS 101 creates much greater volatility within the Bank’s income statement as it is now
required to fair value certain assets previously held at amortised cost, as well as bringing
hedging instruments on to the balance sheet.
Accordingly, to arrive at an assessment of operating performance which is better aligned to
the Bank’s key performance indicators, it is necessary to eliminate from the profit before
tax, those items which distort year on year comparisons and arise primarily from changes in
asset values, which have a tendency to fluctuate, particularly in the current environment.
Adjusted net operating income, which is explained in more detail in note 3 to the financial
statements, is a more meaningful measure against which to assess the Bank’s performance
and it is this measure on which we now concentrate.
In this respect, performance for the year has been particularly gratifying, with a marked
improvement in this measure.
Highlights
Adjusted net operating income has increased by 86%.
Tier 1 capital ratio of 19.1%.
Increase in loans and advances to customers of 13%.
Increase in deposits (customer accounts) of 17%.
Economic Environment
The economic environment during 2016 can be characterised by general concerns over
global growth, interspersed by two major events, namely Brexit and the outcome of the US
presidential election, neither of which was foreseen by financial markets. Furthermore,
markets were wrong-footed in their expectations of the consequences.
With respect to Brexit, dire predictions were made as to the likely effect on stock markets,
interest rates, exchange rates and GDP growth and whilst there have been some marked
fluctuations, only the devaluation of sterling has yet come to pass.
In similar vein, Donald Trump was seen as both unpredictable and an advocate for
protectionist policies which could have adverse consequences for global growth. Yet US
stock markets have reached record levels and the dollar has strengthened markedly against
the yen and euro.
What is evident however is that both events are seen by financial markets as creating more
uncertainty at a time when confidence is fragile.
Whilst the Bank’s activities are UK-based, it is not immune to market factors, influenced by
global events. This is particularly so in the case of interest rates, which plumbed record lows
in August, albeit, there has been a significant rally since.
Julian Hodge Bank Limited Registered number 743437
Annual report and financial statements
31 October 2016
Julian Hodge Bank Limited
2
Chairman’s statement (continued)
The market consensus is that Brexit will be inflationary, driven primarily by the drop in
sterling’s trade-weighted index, which will increase the cost of imports. Donald Trump’s
election has also increased inflation expectations in the US; with his plans for significant
infrastructure spending.
After many false starts the Federal Reserve raised interest rates in December, which allied
to the inflationary pressures referred to above, might be the catalyst for a “normalisation”
of interest rates over the next few years.
If this is the case, the Bank is well-placed to benefit significantly from such a move,
provided it is not so extreme as to impact adversely on commercial and real estate
residential values, which underpin the bulk of the Bank’s lending.
Financial Performance
Setting aside the impact of the adoption of FRS101, the Bank’s underlying performance has
been positive with a strong performance within Commercial Lending and solid growth within
Hodge Lifetime, which has expanded its product range
Net interest income has seen a marked improvement, increasing by 97% on our core
lending products, reflecting a combination of growth in our loan book and margin
improvement.
Administrative expenses have increased due to substantial investment in people, premises
and systems to enable us to carry out our plans to grow the business over the coming
years.
This investment has already started to bear fruit. This trend will be more evident as we
increase the breadth of our services, expand our product range and develop our digital
offering to provide our customers with more ways to engage with us.
Five Year Summary
FRS101 UK GAAP
2016 2015 2014 2013 2012
£m £m £m £m £m
Profit before tax 22.8 1.6 4.3 3.5 3.1
Adjusted net income or
operating profit
14.3 7.7 0.2 (4.6) (3.9)
Total assets 1,316.8 1,108.9 784.7 726.5 802.5
Loans and advances to
customers
706.9 624.8 440.8 384.0 358.8
Customer deposits 991.7 848.6 633.2 583.6 658.9
Shareholder’s funds 146.3 133.3 132.0 128.2 125.6
Commercial Lending
Our Commercial Lending business has made excellent progress this year, writing over £100
million of new business, materially improving operating margins, generating recurring fee
income of £3m and delivering a substantial increase in operating profit.
Impairment has been well-controlled, a testimony to our focus on risk management and the
quality of lending.
Julian Hodge Bank Limited Registered number 743437
Annual report and financial statements
31 October 2016
Julian Hodge Bank Limited
3
Chairman’s statement (continued)
It is pleasing to note that these results were achieved with a relatively minor increase in overheads, justifying our investment in this business in recent years.
Our strategy is to be highly selective in our asset origination approach, focussing on the
quality of clients and proposals, rather than a volume-led lending target. We provide
bespoke and specialist real estate funding for a client base of proven and experienced
property investors and developers. Our specialist, private bank proposition resonates well in
this market and a significant amount of our business comes from existing client referrals.
As our business grows we continue to invest in risk systems and processes to maintain our
emphasis on quality. Our client base is predominantly spread across the southern part of
the UK across a mix of real estate categories, which provides diversification both geographically and in type of lending.
We have a proven strategy and see no reason to change this over the coming year.
Hodge Lifetime
Hodge Lifetime is the group’s brand covering the retirement market. Our core products are
pension annuities and “later life lending”. Some of the business is conducted by the Bank
with the rest being conducted by our subsidiary, Hodge Life Assurance Company Limited.
This market offers significant growth potential, underpinned by strong demographic trends.
Over the past two years, we have added to our range of ‘later life lending’ services with two
new products – a Retirement Mortgage (a hybrid lifetime mortgage) and 55+ Mortgage (a
standard residential mortgage). These products are offered by the Bank and are expected to
be an area of significant growth in future.
This strategic development means that Hodge Lifetime is the only business currently
offering a full range of later life mortgage lending products, and puts us in a strong position
to capitalise on this growing market.
We are also very pleased to have agreed an external funding arrangement, which allows us
to increase the level of equity release lending we undertake, over and above our own
requirements.
As at 31 October 2016 the Bank had £758 million of equity release mortgage assets under
management including £447 million for other financial institutions.
Treasury and Funding
We implemented a new banking system during the year, which will enable us to develop our
on-line capability to complement our existing telephone and postal operations.
We anticipate being able to provide our first on-line products in the second half of 2017.
This will be a major new initiative for the Bank and our aim will be to provide the same first-
class service to our customers, regardless of how they choose to do business with us.
Even without the option of an on-line service we were able to grow our deposit book by
17% to just under £1 billion at the end of the year. We now have over 33,000 customers,
an increase of over 10% on the prior year.
Julian Hodge Bank Limited Registered number 743437
Annual report and financial statements
31 October 2016
Julian Hodge Bank Limited
4
Chairman’s statement (continued)
This is a tremendous performance given that interest rates have been at record lows for
much of the year which creates a massive disincentive to save. However, interest rates
have started to rise in recent weeks and it may be that 2017 will at last provide some relief
for savers.
For our part, the Bank remains committed to developing its product range and the channels
through which it serves its customers so that it can offer them a range of products to suit
their particular needs.
Our People
To support our business growth we now have 142 staff, an increase of 25% over the
financial year. As anticipated last year, the increase in staff complement has necessitated a
move to new premises, in the heart of Cardiff’s newest and most vibrant business location.
The Board believes that the Bank, as a key contributor to the burgeoning financial services
sector in Cardiff, now has the right accommodation to attract the additional staff that it
needs to build on its success in recent years.
I must again commend our staff for the commitment and enthusiasm they have displayed
during what has been a year of substantial change for the Bank. We have implemented a
new banking system and relocated our business whilst at the same time navigating a
turbulent economic environment, culminating with Brexit and its aftermath.
The Outlook
The economic environment continues to be uncertain, with Brexit, the US presidential
election and the Italian referendum all contributing to a climate of uncertainty, which shows
little sign of abating.
Uncertainty is anathema to financial markets and whilst the Bank can control to some
extent its own destiny, it is in thrall to the markets with respect to those factors which most
affect its business, namely interest rates and residential and commercial real estate prices.
This has been heightened by the requirement for the Bank to adopt FRS101, which has the
effect of generating much greater volatility within its reported results.
However, I have no doubt that the Bank has the resources to deal with these issues and the
appropriate strategy to generate good returns for its shareholders.
Keith James
Chairman
15 December 2016
Julian Hodge Bank Limited Registered number 743437
Annual report and financial statements
31 October 2016
Julian Hodge Bank Limited
5
Strategic Report
Principal activities
The Bank is principally engaged in the business of banking and “later life lending.” Details
of the principal subsidiary and its activities are set out in note 18 to the accounts.
The Bank is an Authorised Institution under the Financial Services and Markets Act 2000.
Corporate strategy
The Board has adopted a prudent strategic plan with the long term aim of achieving stable
returns and modest capital growth in accordance with the requirements of its Shareholders.
At the heart of the Bank’s philosophy is a wish to protect its capital base for the benefit of
its depositors and Shareholder by conducting business in those areas where it has the
greatest expertise and experience and best understands the risks which it is taking.
A rolling five-year strategy is approved by the Board annually, complemented by a detailed
business plan for the forthcoming financial year. The Board sets aside specific time during
the year to review its strategy and to gauge progress towards its achievement. The current
strategy is based on a continuing involvement in (a) commercial property, primarily through
the Bank’s commercial lending business and (b) residential property through its “later life
lending” activities, both of which it believes will enable it to achieve its strategic objectives.
Risk appetite
On an annual basis, in the context of the Board’s review of its strategy, the Board
establishes a risk appetite with appropriate key risk indicators and risk limits for executive
management to operate within. The Board monitors adherence to the risk appetite on a
regular basis.
Business review and future developments
A review of business and future developments is included in the Chairman’s statement on
pages 1 to 4.
Results and dividends
The profit for the year after taxation amounted to £17.6m (2015: £1.0m). No dividend was
paid during the year (2015: £nil) leaving a surplus for the year of £17.6m (2015: £1.0m) to
be taken to reserves.
Employees
The Bank has an equal opportunities employment policy, and it is the Board’s policy to
employ disabled persons whenever suitable vacancies arise and to provide for such
employees the appropriate level of training and career progression within the Bank.
The directors recognise the importance of communication with employees and they make it
their policy to be accessible to them.
Corporate governance
This statement explains the extent to which the Bank has applied the principles of good
governance contained in The UK Corporate Governance Code for the year ended 31 October
2016.
Julian Hodge Bank Limited Registered number 743437
Annual report and financial statements
31 October 2016
Julian Hodge Bank Limited
6
Strategic Report (continued)
Corporate governance (continued)
The Board of the Bank comprises two executive and five non-executive directors. The roles
of Chairman and Chief Executive are separate to ensure that neither can exercise unfettered
powers of decision-making on matters of material importance to the Bank.
The Board has sought to ensure that directors are properly briefed on issues arising at
Board meetings by:
distributing papers sufficiently in advance of meetings;
considering the adequacy of the information provided before making decisions; and
deferring decisions when directors have concerns about the quality of information.
The Board is ultimately responsible for the Bank’s system of internal control and for
reviewing its effectiveness. The system of control is designed to manage rather than
eliminate risks which are inherent in the Bank’s business and can provide only reasonable
and not absolute assurance against material misstatement or loss.
The Bank’s system of internal financial control includes appropriate levels of authorisation,
segregation of duties and limits for each aspect of the business. There are established
procedures and information systems for regular budgeting and reporting of financial
information. Financial reports are presented to the Board monthly detailing the results and
other performance data.
There is a well-established internal audit function within the Bank that is provided by PwC
on an outsourced basis. Its role is primarily to review the effectiveness of controls and
procedures established to manage risk. An audit programme is agreed annually in advance
with the audit committee and the head of internal audit attends each meeting of the
committee to present a summary of audit reports completed during the period and to
provide any explanations required by the committee.
The audit committee has reviewed the effectiveness of the Bank’s system of internal
financial control during the year and determined it was satisfactory.
Governance framework
The following is a summary of the framework for corporate governance adopted by the
Bank.
The Board
The Board has ultimate responsibility for the proper stewardship of the Bank in all its
undertakings. It meets regularly throughout the year to discharge its responsibilities for all
important aspects of the Bank’s affairs, including monitoring performance, considering
major strategic issues, approving budgets and business plans and reporting to the
shareholder.
A board control manual has been adopted which describes the high-level policy and
decision-making arrangements within the Bank. The manual includes a schedule of matters
reserved to the Board together with those items delegated to directors and Board and
executive committees.
Julian Hodge Bank Limited Registered number 743437
Annual report and financial statements
31 October 2016
Julian Hodge Bank Limited
7
Strategic Report (continued)
Board Committees
The Board has established the following standing committees:
Audit committee: Adrian Piper (Chairman), Keith James, Jonathan Hodge, Helen
Molyneux and Alun Bowen.
All members of the audit committee are non-executive. Executive members of the Board
and other senior executives attend as required by the Chairman.
The function of the audit committee is to review the work of the internal audit function,
to consider the adequacy of internal control systems, to review the relationship with the
external auditors, to review the statutory accounts including the key estimates and
judgements used in the statutory accounts and to consider compliance issues.
The committee meets at least four times a year.
Risk and conduct committee: Alun Bowen (Chairman), Keith James, Jonathan Hodge,
Helen Molyneux and Adrian Piper.
All members of the risk and conduct committee are non-executive. Executive members of
the Board and other senior executives attend as required by the Chairman.
The function of the risk and conduct committee is to oversee the management of risk and
the conduct of business on behalf of the Board to ensure that significant risks are
identified, understood, assessed and managed and that good customer outcomes are
achieved. It is responsible for the second line of defence of the business, ensuring that
the level of assurance available to the Board is sufficient and appropriate.
The committee meets at least four times a year.
Remuneration committee: Helen Molyneux (Chairwoman), Keith James, Alun Bowen,
Jonathan Hodge and Adrian Piper.
All members of the remuneration committee are non-executive. Executive members of
the Board and other senior executives attend as required by the Chairwoman.
The function of the remuneration committee is to consider remuneration policy and
specifically to determine the remuneration and other terms of service of executive
directors and senior managers. The executive directors decide fees payable to non-
executive directors.
The committee meets as required.
Nomination committee: Jonathan Hodge (Chairman), Keith James, Alun Bowen, Helen
Molyneux and Adrian Piper.
All members of the nomination committee are non-executive. Executive members of the
Board and other senior executives attend as required by the Chairman.
The function of the committee is to recommend the appointment of directors to the Board
and Board committees and to ensure that the Bank has an appropriate succession plan
for executive and senior management positions.
The committee meets as required.
Julian Hodge Bank Limited Registered number 743437
Annual report and financial statements
31 October 2016
Julian Hodge Bank Limited
8
Strategic Report (continued)
Executive Committees
Executive management has primary responsibility for the operation of the Bank’s internal
financial control framework. It monitors credit risk, liquidity risk, house price risk, interest
rate risk, conduct risk and operational risk by means of relevant committees as described
below. The Bank’s policy on risk management is set out on the following page.
Group management board
Chaired by the Managing Director the committee consists of executive management and
is responsible for the formulation and execution of the Bank’s strategy, and the day-to-
day management of the Bank, subject to specific limitations and constraints imposed by
the Board and is also responsible for formulating the IT strategy and policy and monitors
and authorises IT activities throughout the Bank.
The committee meets as required, but as a minimum will meet six times per year.
Executive risk committee
Chaired by the Managing Director, the committee meets quarterly and monitors the
Bank’s risk management framework. It also monitors and co-ordinates the activities of
compliance, risk assurance and internal audit throughout the Bank.
Assets and liabilities committee
Chaired by the Managing Director, the committee implements the policies of the Board
with respect to liquidity and interest rate risk management and provides
recommendations to the Board on strategies for managing these risks. It also monitors
and controls treasury counterparty risk arising from deposits with other banks and
institutions which are usually unsecured together with debt securities acquired as
investments. The committee meets weekly.
Retail credit committee
Chaired by the Managing Director, the committee's principal responsibility is to monitor
and control retail credit risk throughout the Group and ensure risk underwriting is
appropriate. The primary credit risk arises from loans to customers through the Hodge
Lifetime division.
The Committee meets as required, but as a minimum will meet four times a year.
Commercial credit committee
Chaired by the Managing Director, the committee's principal responsibility is the
implementation and maintenance of the overall risk management framework relating to
commercial credit risk. The Committee is also responsible for reviewing, challenging and
if appropriate, approving credit proposals for new commercial lending deals that are
within its remit as set by the Board.
The Committee meets as required, but as a minimum will meet four times a year.
Julian Hodge Bank Limited Registered number 743437
Annual report and financial statements
31 October 2016
Julian Hodge Bank Limited
9
Strategic Report (continued)
Actuarial committee
The committee is responsible for monitoring the insurance risk exposure of the company
including longevity risk, liquidity risk, house price risk and interest rate risks. It also
monitors and provides input to the methods and assumptions used to undertake actuarial
valuations of the Company’s assets and liabilities.
The Committee meets as required, but as a minimum will meet four times per annum.
Risk Management
The Bank regards the monitoring and controlling of risk as a fundamental part of the
management of the business and accordingly involves its most senior people in developing
risk policy and monitoring its application. The Board has agreed a risk management policy
and a risk management framework.
The Bank operates a three lines of defence model for risk management and oversight. This
structure defines the roles and responsibilities of risk management, risk oversight and risk
assurance separately from those of commercial and operational activities undertaken by the
Bank. This model comprises the following elements:
First line of defence has responsibility for implementation of the Bank’s strategy and for
the management of risk across the organisation and comprises executive committees,
management and staff.
Second line of defence relates to risk oversight and independent challenge of the first line
of defence. The board has delegated oversight of risk management to the risk and conduct
committee. An internal assurance team is responsible for undertaking a monitoring
programme to enable the risk and conduct committee to assess whether the first line of
defence is operating effectively.
The third line of defence provides objective assurance on the effectiveness of the Bank’s
governance and risk management processes and controls. This assurance is obtained via
the use of internal audit services provided by PwC. The Board retains ultimate responsibility
for risk management in the Bank.
In the normal course of its business, the Bank is exposed to credit risk, liquidity risk, house
price risk, interest rate risk, conduct risk and operational risk.
Credit risk is the risk that a counterparty will be unable or unwilling to meet a commitment
that it has entered into with the Bank. The Bank manages its credit risk through the retail
credit committee, commercial credit committee and the assets and liabilities committee.
Regular credit exposure reports are produced which include information on credit and
property underwriting, large exposures, asset concentrations, industry exposure and levels
of bad debt provisioning.
Liquidity risk is the risk that the Bank will encounter difficulty in realising assets or
otherwise raising funds to meet commitments as they fall due. The Bank manages its
liquidity risk through its assets and liabilities committee, and monitors its liquidity position
on a daily basis and has adopted a policy to ensure that it has adequate resources to enable
it to conduct its normal business activities without interruption. The maturity analysis of
assets and liabilities is disclosed in the notes to the financial statements.
The customer deposit base represents a stable source of funding due to the number and
range of depositors. Liquidity is further managed through dealings in the money markets.
Julian Hodge Bank Limited Registered number 743437
Annual report and financial statements
31 October 2016
Julian Hodge Bank Limited
10
Strategic Report (continued)
House price risk is the risk that arises when there is an adverse mismatch between actual
house prices and those implicit in the costing of the Bank’s lending into retirement products,
such that the ultimate realisation of the property would not yield the expected return to the
Bank and could, in certain circumstances, result in a capital loss.
Interest rate risk is the risk that arises when there is an imbalance between the maturity
dates of rate sensitive assets, liabilities and off-balance sheet items. The Bank manages its
interest rate risk through its assets and liabilities committee. The Bank’s policy is to
maintain interest rate risk at a controlled level within limits set by the Board.
The table in note 33 shows an estimate of the interest rate sensitivity gap as at 31 October
2016. Assets and liabilities are included in the table at the earliest date at which the
applicable interest rate can change.
The Bank enters into derivative transactions, normally interest rate swaps. The purpose of
such transactions is to manage the interest rate and other risks arising from the Bank’s
operations and other resultant positions. The Bank’s interest rate risk management policy
defines the type of derivative transactions that can be undertaken. Further information is
given in note 33 to the accounts.
Conduct risk is the risk that the Bank’s behaviour results in poor outcomes for customers.
The Bank is exposed to this risk by virtue of the markets in which it chooses to operate.
Operational risk is the risk of economic loss from control failures or external events, which
result in unexpected or indirect loss to the Bank.
The evaluation of the various risks and the setting of policy is carried out through the
Bank’s executive risk committee and reports to the risk and conduct committee, which
ensures adherence to the Bank’s risk management policy and framework.
The Company is also exposed to pension risk through its defined benefit scheme.
Julian Hodge Bank Limited Registered number 743437
Annual report and financial statements
31 October 2016
Julian Hodge Bank Limited
11
Strategic Report (continued)
Going concern
The Bank’s business activities, together with the factors likely to affect its future
development, its financial position, financial risk management objectives, and its exposures
to credit and liquidity risk are described above.
The Bank’s forecasts and projections include scenario testing undertaken in accordance with
the Internal Capital Adequacy Process (ICAAP) and Individual Liquidity Adequacy
Assessment Process (ILAAP), which are required by the Prudential Regulation Authority to
demonstrate appropriate levels of capital and liquidity respectively under stressed
conditions. The directors consider that the overall level of capital, including Tier 1 capital, of
£130.3m (19.1% as a percentage of risk weighted assets) and liquidity, including liquid
assets (Gilts, central bank reserves and wholesale cash deposits), of £286m (29% of total
deposits) are adequate. Accordingly, the directors confirm that they are satisfied that the
Bank has adequate resources to continue in business for the foreseeable future. For this
reason, they continue to adopt the going concern basis in the preparation of the financial
statements.
David Landen
One Central Square
Director Cardiff
CF10 1FS
15 December 2016
Julian Hodge Bank Limited Registered number 743437
Annual report and financial statements
31 October 2016
Julian Hodge Bank Limited
12
Directors’ report
The directors present their report together with the audited financial statements for the year
ended 31 October 2016.
Certain disclosures are given in the Strategic Report and are incorporated here by cross-
reference. Specifically, these incorporate the following disclosures:
Future developments - page 5
Dividends - page 5
Going concern - page 11
Financial risk management policies - pages 9 to 10
Directors and their interests
The directors who held office during the year are listed below:
D. K. M. James* - Chairman
J. J. Hodge* - Deputy Chairman
D. M. Austin - Managing Director
D. J. Landen - Finance Director
A. N. Piper*
D. A. Bowen*
H. Molyneux*
* Non-executive
No contract was entered into by the Bank in which a director had a material interest.
Jonathan Hodge’s interests in the shares of Group undertakings are shown in the Directors’
Report of the ultimate UK parent undertaking, The Carlyle Trust Limited.
None of the other directors held any interest in the shares of Group undertakings.
Political contributions
The Bank made no political contributions during the year.
Post Balance Sheet events
There are no post Balance Sheet events to disclose.
Disclosure of information to the auditor
The directors who held office at the date of approval of this directors’ report confirm that, so
far as they are each aware, there is no relevant audit information of which the Bank’s
auditor is unaware; and each director has taken all the steps that he ought to have taken as
a director to make himself aware of any relevant audit information and to establish that the
Bank’s auditor is aware of that information.
Qualifying third-party indemnity provisions
The Company has granted an indemnity to one or more of its directors against liability in
respect of proceedings brought by third parties, subject to the conditions set out in the
Companies’ Act 2006. Such qualifying party indemnity provisions remain in force as at the
date of approving the director’s report
Julian Hodge Bank Limited Registered number 743437
Annual report and financial statements
31 October 2016
Julian Hodge Bank Limited
13
Auditor
In anticipation of the implementation of the EU audit reforms which became effective on 17
June 2016, which require public interest entities to change audit firms who have audited a
relevant entity for over twenty years, the Audit Committee on behalf of the Board carried
out a full audit tender, and following the conclusion of that process, Ernst & Young LLP was
appointed to replace KPMG LLP.
A resolution for the re-appointment of Ernst & Young LLP as auditor of the company and
authorising the Audit Committee to determine its remuneration is to be proposed at the
forthcoming Annual General Meeting.
By order of the Board
David Landen One Central Square
Director
Cardiff
CF10 1FS
15 December 2016
Julian Hodge Bank Limited Registered number 743437
Annual report and financial statements
31 October 2016
Julian Hodge Bank Limited
14
Directors’ Responsibilities Statement
The directors are responsible for preparing the Strategic Report, the Directors' report and
the financial statements in accordance with applicable law and regulations.
Company law requires the directors to prepare financial statements for each financial year.
Under that law they have elected to prepare the financial statements in accordance with UK
Accounting Standards and applicable law (UK Generally Accepted Accounting Practice)
including Financial Reporting Standard 101 Reduced Disclosure Framework (FRS 101).
Under company law the directors must not approve the financial statements unless they are
satisfied that they give a true and fair view of the state of affairs of the company and of the
profit or loss of the company for that period. In preparing these financial statements, the
directors are required to:
• select suitable accounting policies and then apply them consistently;
• make judgements and estimates that are reasonable and prudent;
• state whether applicable UK Accounting Standards have been followed, subject to any
material departures disclosed and explained in the financial statements; and
• prepare the financial statements on the going concern basis unless it is inappropriate to
presume that the company will continue in business.
The directors are responsible for keeping adequate accounting records that are sufficient to
show and explain the company's transactions, and disclose with reasonable accuracy at any
time the financial position of the company and enable them to ensure that the financial
statements comply with the Companies Act 2006. They have general responsibility for
taking such steps as are reasonably open to them to safeguard the assets of the company
and to prevent and detect fraud and other irregularities.
The directors are responsible for the maintenance and integrity of the corporate and
financial information included on the company's website. Legislation in the UK governing the
preparation and dissemination of financial statements may differ from legislation in other
jurisdictions.
Julian Hodge Bank Limited Registered number 743437
Annual report and financial statements
31 October 2016
Julian Hodge Bank Limited
15
Independent auditor’s report to the member of Julian Hodge
Bank Limited
We have audited the financial statements of Julian Hodge Bank Limited for the year ended
31 October 2016, which comprise the Income Statement, the Statement of Other
Comprehensive Income, the Balance Sheet, the Statement of Changes in Equity and the
related notes 1 to 37. The financial reporting framework that has been applied in their
preparation is applicable law and United Kingdom Accounting Standards (United Kingdom
Generally Accepted Accounting Practice), including Financial Reporting Standard 101
‘Reduced Disclosure Framework’, applicable in the UK and Republic of Ireland.
This report is made solely to the company’s members, as a body, in accordance with
Chapter 3 of Part 16 of the Companies Act 2006. Our audit work has been undertaken so
that we might state to the company’s members those matters we are required to state to
them in an auditor’s report and for no other purpose. To the fullest extent permitted by law,
we do not accept or assume responsibility to anyone other than the company and the
company’s members as a body, for our audit work, for this report, or for the opinions we
have formed.
Respective responsibilities of directors and auditor
As explained more fully in the Directors’ Responsibilities Statement set out on page 14 the
directors are responsible for the preparation of the financial statements and for being
satisfied that they give a true and fair view. Our responsibility is to audit and express an
opinion on the financial statements in accordance with applicable law and International
Standards on Auditing (UK and Ireland). Those standards require us to comply with the
Auditing Practices Board’s Ethical Standards for Auditors.
Scope of the audit of the financial statements
An audit involves obtaining evidence about the amounts and disclosures in the financial
statements sufficient to give reasonable assurance that the financial statements are free
from material misstatement, whether caused by fraud or error. This includes an assessment
of: whether the accounting policies are appropriate to the company’s circumstances and
have been consistently applied and adequately disclosed; the reasonableness of significant
accounting estimates made by the directors; and the overall presentation of the financial
statements. In addition, we read all the financial and non-financial information in the
Strategic Report and Directors’ Report to identify material inconsistencies with the audited
financial statements and to identify any information that is apparently materially incorrect
based on, or materially inconsistent with, the knowledge acquired by us in the course of
performing the audit. If we become aware of any apparent material misstatements or
inconsistencies we consider the implications for our report.
Opinion on financial statements
In our opinion the financial statements:
give a true and fair view of the state of the company’s affairs as at 31 October 2016
and of its profit for the year then ended;
have been properly prepared in accordance with United Kingdom Generally
Accepted Accounting Practice, including Financial Reporting Standard 101 ‘Reduced
Disclosure Framework’ applicable in the UK and Republic of Ireland and
have been prepared in accordance with the requirements of the Companies Act
2006.
Julian Hodge Bank Limited Registered number 743437
Annual report and financial statements
31 October 2016
Julian Hodge Bank Limited
16
Opinion on other matter prescribed by the Companies Act 2006
In our opinion the information given in the Strategic Report and the Directors’ Report for the
financial year for which the financial statements are prepared is consistent with the financial
statements.
Matters on which we are required to report by exception
We have nothing to report in respect of the following matters where the Companies Act
2006 requires us to report to you if, in our opinion:
adequate accounting records have not been kept, or returns adequate for our audit
have not been received from branches not visited by us; or
the financial statements are not in agreement with the accounting records and
returns; or
certain disclosures of directors’ remuneration specified by law are not made; or
we have not received all the information and explanations we require for our audit.
Andrew Blackmore (Senior statutory auditor)
for and on behalf of Ernst & Young LLP, Statutory Auditor
Bristol
16 December 2016
Notes:
1. The maintenance and integrity of Julian Hodge Bank Limited’s web site is the
responsibility of the directors; the work carried out by the auditors does not involve
consideration of these matters and, accordingly, the auditors accept no responsibility for
any changes that may have occurred to the financial statements since they were initially
presented on the web site.
2. Legislation in the United Kingdom governing the preparation and dissemination of
financial statements may differ from legislation in other jurisdictions.
Income statement For the year ended 31 October 2016
Financial Statements Registered number 743437
Julian Hodge Bank Limited
18
Notes 2016 2015
£m £m
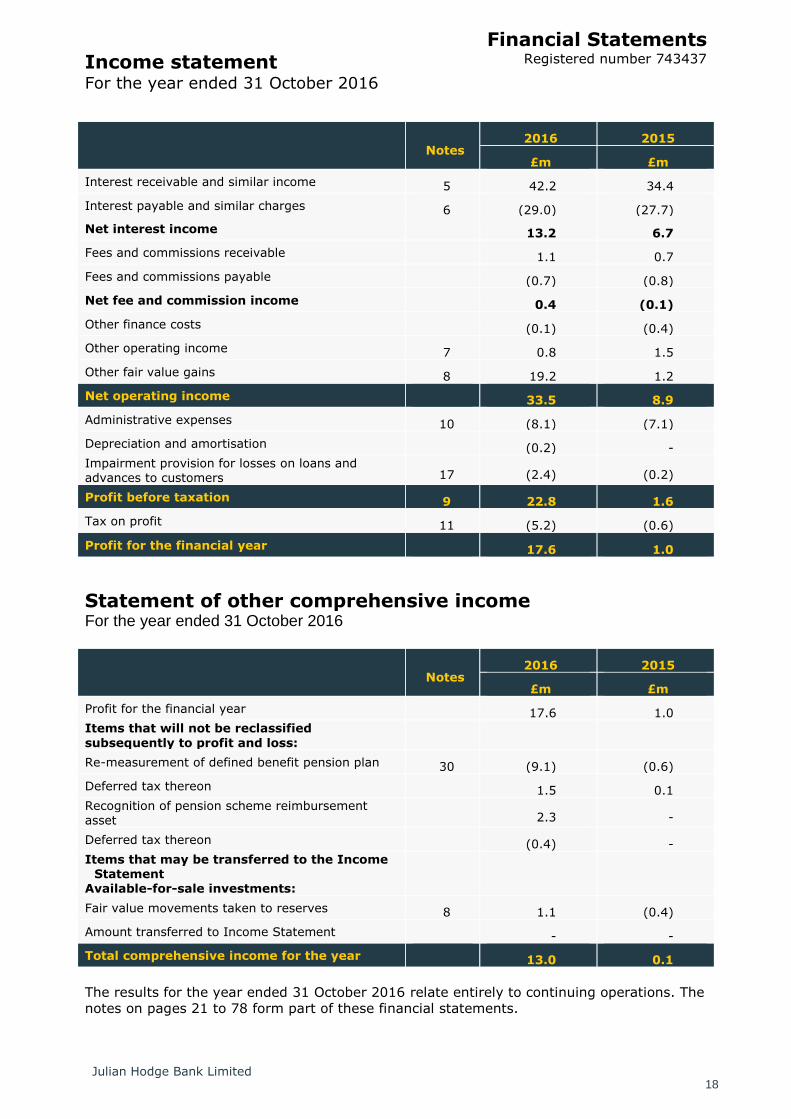
Interest receivable and similar income 5 42.2 34.4
Interest payable and similar charges 6 (29.0) (27.7)
Net interest income 13.2 6.7
Fees and commissions receivable 1.1 0.7
Fees and commissions payable (0.7) (0.8)
Net fee and commission income 0.4 (0.1)
Other finance costs (0.1) (0.4)
Other operating income 7 0.8 1.5
Other fair value gains 8 19.2 1.2
Net operating income 33.5 8.9
Administrative expenses 10 (8.1) (7.1)
Depreciation and amortisation (0.2) -
Impairment provision for losses on loans and advances to customers 17 (2.4) (0.2)
Profit before taxation 9 22.8 1.6
Tax on profit 11 (5.2) (0.6)
Profit for the financial year 17.6 1.0
Statement of other comprehensive income For the year ended 31 October 2016
Notes 2016 2015
£m £m
Profit for the financial year 17.6 1.0
Items that will not be reclassified
subsequently to profit and loss:
Re-measurement of defined benefit pension plan 30 (9.1) (0.6)
Deferred tax thereon 1.5 0.1
Recognition of pension scheme reimbursement asset 2.3 -
Deferred tax thereon (0.4) -
Items that may be transferred to the Income Statement
Available-for-sale investments:
Fair value movements taken to reserves 8 1.1 (0.4)
Amount transferred to Income Statement - -
Total comprehensive income for the year 13.0 0.1
The results for the year ended 31 October 2016 relate entirely to continuing operations. The
notes on pages 21 to 78 form part of these financial statements.
Balance sheet As at 31 October 2016
Financial Statements Registered number 743437
Julian Hodge Bank Limited
19
Notes 2016 2015
£m £m
Assets
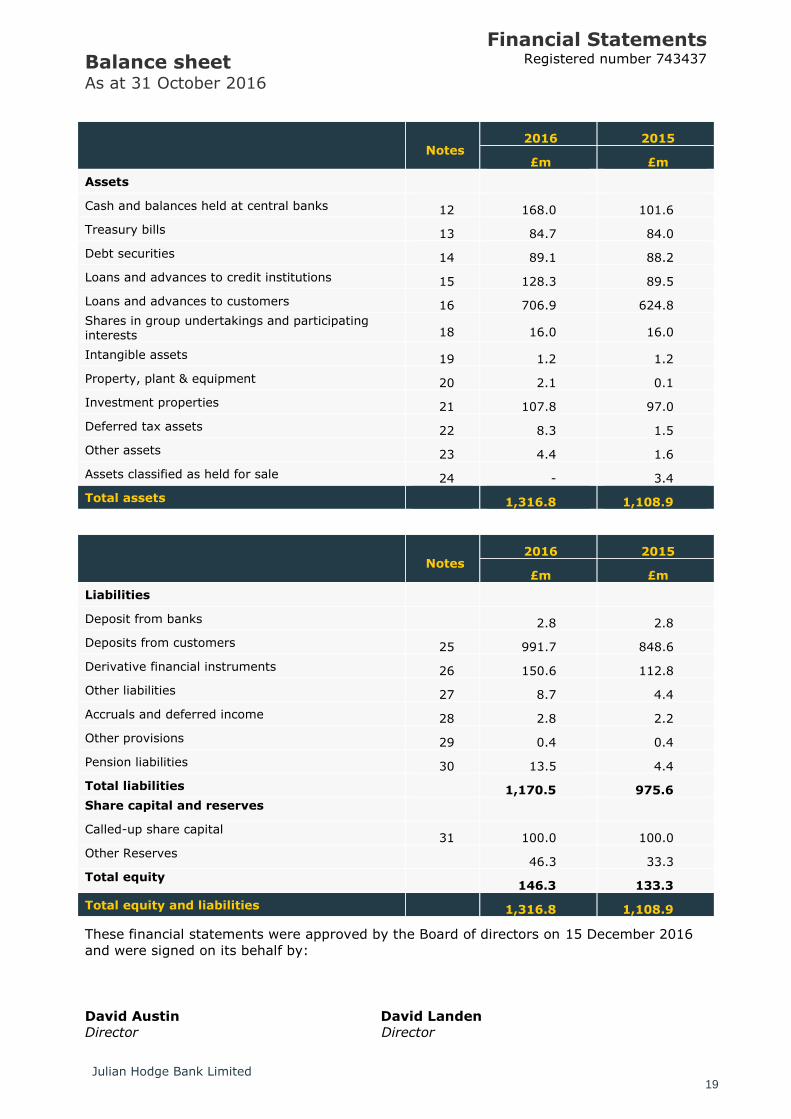
Cash and balances held at central banks 12 168.0 101.6
Treasury bills 13 84.7 84.0
Debt securities 14 89.1 88.2
Loans and advances to credit institutions 15 128.3 89.5
Loans and advances to customers 16 706.9 624.8
Shares in group undertakings and participating interests 18 16.0 16.0
Intangible assets 19 1.2 1.2
Property, plant & equipment 20 2.1 0.1
Investment properties 21 107.8 97.0
Deferred tax assets 22 8.3 1.5
Other assets 23 4.4 1.6
Assets classified as held for sale 24 - 3.4
Total assets 1,316.8 1,108.9
Notes 2016 2015
£m £m
Liabilities
Deposit from banks 2.8 2.8
Deposits from customers 25 991.7 848.6
Derivative financial instruments 26 150.6 112.8
Other liabilities 27 8.7 4.4
Accruals and deferred income 28 2.8 2.2
Other provisions 29 0.4 0.4
Pension liabilities 30 13.5 4.4
Total liabilities 1,170.5 975.6
Share capital and reserves
Called-up share capital 31 100.0 100.0
Other Reserves 46.3 33.3
Total equity 146.3 133.3
Total equity and liabilities 1,316.8 1,108.9
These financial statements were approved by the Board of directors on 15 December 2016
and were signed on its behalf by:
David Austin David Landen
Director Director
Statement of changes in equity For the year ended 31 October 2016
Financial Statements Registered number 743437
Julian Hodge Bank Limited
20
Called up Share Capital
Profit and loss
account
Available-for-sale reserve
Pension reserve
Total
£m £m £m £m £m
2016
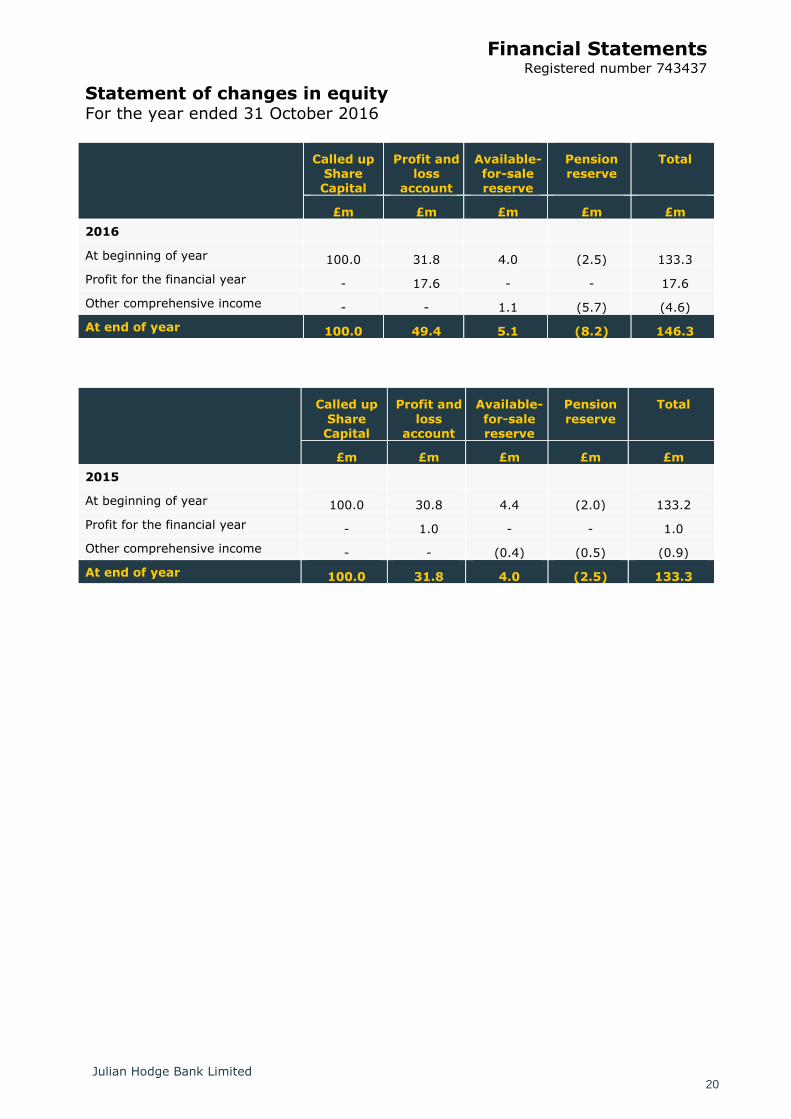
At beginning of year 100.0 31.8 4.0 (2.5) 133.3
Profit for the financial year - 17.6 - - 17.6
Other comprehensive income - - 1.1 (5.7) (4.6)
At end of year 100.0 49.4 5.1 (8.2) 146.3
Called up
Share Capital
Profit and
loss account
Available-
for-sale reserve
Pension
reserve
Total
£m £m £m £m £m
2015
At beginning of year 100.0 30.8 4.4 (2.0) 133.2
Profit for the financial year - 1.0 - - 1.0
Other comprehensive income - - (0.4) (0.5) (0.9)
At end of year 100.0 31.8 4.0 (2.5) 133.3
Notes to the accounts For the year ended 31 October 2016
Financial Statements Registered number 743437
Julian Hodge Bank Limited
21
1 Accounting policies
Basis of preparation
These financial statements were prepared in accordance with Financial Reporting Standard
101 Reduced Disclosure Framework (“FRS 101”). The amendments to FRS 101 (2014/15
Cycle) issued in July 2015 and effective immediately have been applied.
In preparing these financial statements, the Company applies the recognition, measurement
and disclosure requirements of International Financial Reporting Standards as adopted by
the EU (“adopted IFRSs”), but makes amendments where necessary in order to comply with
Companies Act 2006 applicable to companies reporting under IFRS (Schedule 2 of the
Regulation) and has set out below where advantage of the FRS 101 disclosure exemptions
has been taken.
In the transition to FRS 101, the Company has applied IFRS 1 whilst ensuring that its assets
and liabilities are measured in compliance with FRS 101. An explanation of how the
transition to FRS 101 has affected the reported financial position and financial performance
is provided in Note 37.
IFRS 1 grants certain exemptions from the full requirements of Adopted IFRS in the
transition period. The following exemptions have been taken in these financial statements;
Fair value or revaluation as deemed cost-at 1 November 2014, fair value has been
used as deemed cost for investment properties previously measured at fair value.
The Company’s immediate parent undertaking, The Carlyle Trust Limited, includes the
Company in its consolidated financial statements. The consolidated financial statements of
The Carlyle Trust Limited are prepared in accordance with International Financial Reporting
Standards and are available to the public and may be obtained from The Registrar of
Companies, Companies House, Crown way, Cardiff, CF14 3UZ.
In these financial statements, the Company has applied the exemptions available under FRS
101 in respect of the following disclosures:
A Cash Flow Statement and related notes;
Comparative period reconciliations for share capital, property plant and equipment,
intangible assets and investment properties;
Disclosures in respect of transactions with members of a group;
The effects of new IFRSs; that have been issued but not yet effective;
An additional balance sheet for the beginning of the earliest comparative period
following reclassification of items in the financial statement; and
Disclosures in respect of the compensation of Key Management Personnel and related
parties.
The Company proposes to continue to adopt the reduced disclosure framework of FRS 101
in its next financial statements.
The accounting policies set out below have, unless otherwise stated, been applied
consistently to all periods presented in these financial statements and in preparing an
opening FRS 101 balance sheet as at 1 November 2014 for the purposes of the transition to
FRS 101.
Measurement convention
The Group prepares its accounts under the historical cost convention, except for certain
financial assets and liabilities held at fair value and for all derivative contracts.
Notes to the accounts For the year ended 31 October 2016
Financial Statements Registered number 743437
Julian Hodge Bank Limited
22
1 Accounting policies (continued)
Summary of Significant Accounting Policies
Consolidation
The Company is a wholly owned subsidiary of The Carlyle Trust Limited and of its ultimate
parent, The Carlyle Trust (Jersey) Limited. It is included in the consolidated financial
statements of The Carlyle Trust Limited which are publicly available.
The Company is the parent of Hodge Life Assurance Company Limited. Therefore, the
Company is exempt by virtue of section 400 of the Companies Act 2006 from the
requirement to produce consolidated financial statements.
Interest receivable and interest payable
Interest receivable and payable for loans and advances to customers and customer
accounts are recognised in the income statement using the effective interest rate method
(EIR).
The effective interest rate method calculates the amortised cost of a financial asset or a
financial liability, and allocates the interest income or interest expense over the expected
product life. The EIR is the rate that exactly discounts the estimated associated future cash
payments or receipts through the expected life of the financial instrument or, when
appropriate, a shorter period, to the net carrying amount of the financial asset.
In calculating the EIR, the Company estimates cash flows considering all contractual terms
of the financial instrument but does not consider future credit losses. The calculation
includes all fees received and paid and costs borne that are an integral part of the EIR and
other premiums above or below market rates.
Once a financial asset or a group of similar financial assets has been written down as a
result of an impairment loss, interest income is recognised using the rate of interest used to
discount the future cash flows for the purpose of measuring the impairment loss.
Fees and commissions
Fee and commission income arises through a range of services the Company provides to its
customers.
Fee and commission income relates primarily to fees for arranging mortgages to customers.
Fee and commission expenses primarily relate to broker fees.
Fees and commissions receivable and payable that are not spread across expected asset
lives under the EIR method are taken to income on an accruals basis as services are
provided, or on completion of an act to which the fee relates.
Loan commitment fees received are deferred and included in the EIR calculation upon
completion of the loan.
Segmental reporting
The Company operates solely within the banking services sector and within the United
Kingdom, as such no segmental analysis is required.
Notes to the accounts For the year ended 31 October 2016
Financial Statements Registered number 743437
Julian Hodge Bank Limited
23
1 Accounting policies (continued)
Financial assets
The Company classifies its financial assets at inception into the following categories:
i) Loans and receivables
Loans and receivables are non-derivative financial assets with fixed or determinable
payments that are not quoted in an active market. The company’s commercial and
residential loans and advances to customers and loans and advances to credit institutions
are classified as loans and receivables and are measured at amortised cost using the
effective interest rate method, net of impairment provisions, with all movements being
recognised in the Income Statement. Amortised cost is calculated by taking into account
any discount or premium on acquisition and fees and costs that are an integral part of the
EIR.
ii) Fair value through profit or loss (FVTPL)
This category consists of derivative financial assets, Treasury bills and fixed for life
mortgages which are held at fair value. These financial assets are initially designated as
FVTPL upon initial recognition and initially measured at fair value with transaction costs
taken directly to the Income Statement. Subsequent measurement is at fair value with
changes in value reflected in the Income Statement.
For those derivatives in fair value hedge accounting relationships, gains and losses arising
from changes in the fair values are recognised in the Income Statement. The impact of
hedging on the measurement of financial assets and liabilities is detailed in note 33, the
derivatives and hedge accounting policy note.
iii) Available-for-sale
Available-for-sale financial assets are non-derivative financial assets, principally but not
exclusively debt securities and Treasury bills intended to be held for an indefinite period of
time and which may be sold in response to needs for liquidity. They are initially measured at
fair value and subsequently at fair value with changes in fair value being recognised in
Equity in the “Available for Sale” reserve, except for impairment losses which are
recognised in the Income Statement. The fair value of available-for-sale assets is derived
from market data. Where this market data is not available, an independent third party
provides a valuation. If the asset is sold before maturity, cumulative gains and losses are
recognised in Equity (“available for sale” reserve) and are recycled to the income statement
and included in Other fair value gains/ (losses).
iv) Held-to-maturity
The Company does not hold any financial assets classified as held to maturity.
Notes to the accounts For the year ended 31 October 2016
Financial Statements Registered number 743437
Julian Hodge Bank Limited
24
1 Accounting policies (continued)
Impairment of financial assets
The Company assesses its loans and advances to customers for objective evidence of
impairment at each Balance Sheet date. An impairment loss is recognised if, and only if,
there is a loss event (or events) that have occurred after initial recognition and before the
Balance Sheet date and which has a reliably measurable impact on the estimated future
cash flows.
The Bank assesses at each reporting date whether there is any objective evidence that a
financial asset or group of financial assets is impaired. A financial asset or group of financial
assets is deemed to be impaired if, and only if, there is objective evidence of impairment as
a result of one or more events that have occurred after the initial recognition of the asset
(an incurred loss event or events) one which has an impact on the estimated future cash
flows of the financial asset or group of financial assets that can be reliably estimated.
If there is objective evidence that an impairment loss has been incurred, the amount of the
loss is measured as the difference between the asset’s carrying amount and the present
value of estimated future cash flows discounted at the asset’s original effective interest rate.
The resultant provisions have been deducted from the appropriate asset values in the
Balance Sheet and the amount of the loss is recognised in the Income Statement.
Interest income continues to be accrued on the reduced carrying amount and is accrued
using the rate of interest used to discount the future cash flows for the purpose of
measuring the impairment loss. The interest income is recorded as part of interest and
similar income.
In the case of commercial loans that are considered individually significant, cash flows are
estimated on a case-by-case basis considering the following factors:
i) Total aggregate exposure to the customer;
ii) The amount and timing of expected receipts and recoveries;
iii) The likely funds available on liquidation or bankruptcy including any guarantees;
iv) The realisable value of security at the expected date of sale and likelihood of
successful repossession; and
v) The deduction of any likely costs involved in recovery of amounts outstanding.
In the case of commercial loans that are not considered individually significant, cash flows
are estimated based on past experience taking into account the total exposure to the
customer, the likelihood that the loan will progress through the various stages of
delinquency, including being written off and the amount and timing of expected receipts and
recoveries.
The methodology and assumptions used for estimating future cash flows are reviewed
regularly by the Company to reduce any difference between loss estimates and actual loss
experience. If, in a subsequent period, the amount for the impairment loss decreases and
the decrease can be related objectively to an event occurring after the impairment was
recognised, the provision is adjusted and the amount of the reversal is recognised in the
Income Statement.
Where a loan is not recoverable, it is written off against the related provision for loan
impairment once all the necessary procedures have been completed and the amount of the
loss has been determined. Subsequent recoveries of amounts previously written off
decrease the amount of impairment losses recorded in the Income Statement. Loans
subject to individual impairment assessment are subject to ongoing review to determine
whether they remain impaired or are considered to be past due. Management applies
overlays to assumptions where there is a lack of past experience.
Notes to the accounts For the year ended 31 October 2016
Financial Statements Registered number 743437
Julian Hodge Bank Limited
25
1 Accounting policies (continued)
Cash and balances Held at Central Banks
Cash and balances held at Central Banks includes cash in hand, deposits held at call with
central banks, other short term highly liquid investments with original maturities of three
months or less and bank overdrafts.
Financial Liabilities
Financial liabilities incorporates bank and other deposits, amounts owed to other customers
and derivative financial liabilities. The Company classifies its financial liabilities into the
following categories:
i) Amortised cost
Financial liabilities (other than derivatives) are measured on an amortised cost basis. This
represents the face value adjusted for any unamortised premiums, discounts and
transaction costs directly attributable to the acquisition or issue. The amortisation is
recognised in interest payable and similar charges using the EIR method.
ii) Fair value through profit or loss
All derivatives are initially measured at fair value and subsequently measured at fair value.
For those derivatives in fair value hedge accounting relationships and for any derivatives
not in a hedge accounting relationship, gains and losses arising from changes in the fair
values are recognised in the Income Statement. The impact of hedging on the measurement
of financial assets and liabilities is detailed in note 33, the derivatives and hedge accounting
policy note.
Financial liabilities held at fair value through the profit or loss are stated at fair value, with
any gains or losses arising on re-measurement recognised in the Income Statement. The
net gain or loss recognised in the Income Statement incorporates any interest paid on the
financial liability and is included in the ‘other gains and losses’ line item in the Income
Statement.
De-recognition of financial assets and financial liabilities
(i) Financial assets
A financial asset is de-recognised when:
The rights to receive cash flows from the asset have expired.
The Company has transferred its rights to receive cash flows from the asset or has
assumed an obligation to pay the received cash flows in full without material delay to a
third party under a “pass-through arrangement; and either
The Company has transferred substantially all the risks and rewards of the asset
Or
The Company has neither transferred nor retained substantially all the risks and rewards
of the asset, but has transferred control of the asset.
(ii) Financial liabilities
Financial liabilities are de-recognised when the obligation is discharged, cancelled or has
expired. Where an existing financial liability is replaced by another from the same lender on
substantially different terms, or the terms of an existing facility are substantially modified,
such an exchange or modification is treated as a de-recognition of the original liability and
the recognition of a new liability. The difference between the carrying value of the original
financial liability and the consideration paid is recognised in the Income Statement.
Notes to the accounts For the year ended 31 October 2016
Financial Statements Registered number 743437
Julian Hodge Bank Limited
26
1 Accounting policies (continued)
Derivative financial instruments
The Company holds derivative financial instruments to manage the risks associated with its
various fixed rate assets and its fixed rate liabilities. The Company has no foreign currency
transactions. In accordance with its treasury policy, the Company holds derivative financial
instruments only for risk management and not for speculative or trading purposes.
Derivatives are initially measured at fair value on the date on which the derivative contract
is entered into and are subsequently re-measured to fair value at each reporting date with
movements recorded in the Income Statement. Fair values are calculated by discounted
cash flow models using yield curves that are based on observable market data or are based
on valuations from counterparties. Fair values are calculated using mid-prices. All
derivatives are classified as assets where their fair value is positive and liabilities where
their fair value is negative. Where there is the legal ability and intention to settle net, the
derivative is classified as a net asset or liability, as appropriate.
Where cash collateral is given, to mitigate the risk inherent in amounts due from the
Company, it is included as an asset in ‘loans and advances to credit institutions’.
Loans and advances to credit institutions
The International Swaps and Derivatives Association (ISDA) Master Agreement is the
Company’s preferred agreement for documenting derivative activity. For certain
counterparties a Credit Support Annex (CSA) has been executed in conjunction with the
ISDA Master Agreement. Under a CSA, collateral is passed between counter-parties to
mitigate the market contingent counterparty risk inherent in the outstanding positions.
Embedded derivatives
Certain derivatives are embedded within other non-derivative host instruments to create a
hybrid instrument. Where the economic characteristics and risks of the embedded
derivatives are not closely related to the economic characteristics and risk of the host
instrument, the Company separates the embedded derivative from the host instrument and
measures it at fair value with the changes in fair value recognised in the income statement.
The “no-negative equity guarantee” is an embedded derivative and further details are
disclosed in Note 33(d).
Hedge accounting
All derivatives entered into by the Company are for the purposes of providing an economic
hedge. Where the criteria set out in IAS 39 are met, the Company uses hedge accounting
and designates the hedging derivative as hedging fair value risks.
At inception of the hedge relationship, the Bank formally documents the relationship
between the hedged item and the hedging instrument, including the nature of the risk, the
risk management objective and strategy for undertaking the hedge and the method that will
be used to assess the effectiveness of the hedging relationship at inception and on an
ongoing basis.
At each hedge effectiveness assessment date, a hedge relationship must be expected to be
highly effective on a prospective basis and demonstrate that it was effective (retrospective
effectiveness) for the designated period in order to qualify for hedge accounting. A formal
assessment is undertaken by comparing the hedging instrument’s effectiveness in offsetting
the changes in fair value or cash flows attributable to the hedged risk in the hedged item,
both at inception and at each quarter end on an ongoing basis. A hedge is expected to be
highly effective if the changes in fair value or cash flows attributable to the hedged risk
during the period for which the hedge is designated were offset by the hedging instrument
in a range of 80% to 125% and were expected to achieve such offset in future periods.
Notes to the accounts For the year ended 31 October 2016
Financial Statements Registered number 743437
Julian Hodge Bank Limited
27
1 Accounting policies (continued)
Hedge ineffectiveness is recognised in the Income Statement in other fair value gains/
(losses). For situations where the hedged item is a forecast transaction, the Company also
assesses whether the transaction is highly probable and presents an exposure to variations
in cash flows that could ultimately affect the income statement.
Changes in the fair value of derivatives that are designated and qualify as fair value hedges
are recorded in the Income Statement under other fair value gains/ (losses) in the period in
which the movement occurs together with the change in fair value of the hedged asset or
liability that is attributable to the hedged risk (interest rate risk). This also applies if the
hedged item is classified as an Available-for-sale financial asset.
Shares in subsidiaries
Investments in subsidiary undertakings and participating interests are stated at cost less
accumulated impairment losses.
Intangible assets
IAS 38 ‘Intangible Assets’ requires the capitalisation of certain expenditure relating to
software development costs. Software development costs are capitalised if it is probable
that the asset created will generate future economic benefits. Costs incurred to establish
technological feasibility or to maintain existing levels of performance are recognised as an
expense.
Where software costs are capitalised, they are amortised using the straight-line method
over their estimated useful lives which is three to five years. The amortisation periods used
are reviewed annually. Costs associated with maintaining software are expensed as they are
incurred. Amortisation is charged to administration expenses in the Income Statement.
Property, plant and equipment
Property, plant and equipment is stated at cost less accumulated depreciation and any
accumulated impairment losses. The carrying values of property, plant and equipment are
reviewed for impairment whenever events or changes in circumstances indicate that the
carrying value may not be recoverable.
An asset’s carrying value is written down immediately to its recoverable amount if the
asset’s carrying value is greater than its estimated recoverable amount.
Gains and losses on disposals are determined by comparing the net disposal proceeds with
the carrying value of the asset and are included within the Income Statement.
Depreciation is provided on a straight line basis over the anticipated useful lives as follows:
Fixtures, fittings and
equipment
- 5 years
Short leasehold
improvements
- Shorter of remaining term of the lease and
useful life
Depreciation methods, useful lives and residual values are reviewed, and adjusted if
appropriate, at the end of each reporting period.
Investment properties
i) Investment properties held by Company
Investment property is property held to earn rentals, for capital appreciation or for both,
rather than for sale or use in the business. The company recognises investment properties
initially at cost and subsequently at fair value, with any change therein recognised in profit
or loss within other operating income.
Notes to the accounts For the year ended 31 October 2016
Financial Statements Registered number 743437
Julian Hodge Bank Limited
28
1 Accounting policies (continued)
Fair value is based on valuations by external independent valuers and is performed at least
annually to ensure that the fair value of investment properties does not differ materially
from its carrying amount.
No depreciation is provided in respect of investment properties applying fair value.
Investment properties are de-recognised either when they have been disposed of, or when
the investment property is permanently withdrawn from use and no future economic
benefits is expected from its disposals. Any gains/ losses on the retirement or disposal of an
investment property are recognised in the Income Statement in the year of disposal.
ii) Reversionary interests in properties
Reversionary interests in properties are included in the financial statements initially at cost
(being the amount of the cash advanced to the customer together with related acquisition
costs), and subsequently at fair value, with any change therein recognised in the Income
Statement within other income.
The current market value is taken as the last formal valuation of the property on a vacant
possession basis, modified by the change in the monthly national Nationwide House Price
Index, adjusted down by an annual underperformance assumption.
A further deduction is made from the value to reflect the expected sale expenses and a
delay factor between death and sale of the property.
Investment properties are de-recognised either when they have been disposed of, or when
the investment property is permanently withdrawn from use and no future economic
benefits is expected from its disposals. Any gains/ losses on the retirement or disposal of an
investment property are recognised in the Income Statement in the year of disposal.
The calculation of the reimbursement asset is based on the split of scheme members by
employer.
Assets classified as held for sale
Assets classified as held for sale are presented separately in the balance sheet and are
carried at the lower of their carrying amount and fair value less costs to sell. These assets
are classified as held for sale only if available for immediate sale in their present condition,
a sale is highly probable and expected to be completed within one year from the date of
classification. These assets are not amortised from date of classification.
Taxation including deferred tax
Corporation tax on profits for the year comprises current and deferred taxation.
Current tax assets and liabilities are measured at the amount expected to be recovered
from or paid to the taxation authorities, based on tax rates and laws that are enacted or
substantively enacted by the Balance Sheet date.
Deferred tax is recognised on temporary differences arising between the tax bases of assets
and liabilities and their carrying amounts in the financial statements. Deferred tax assets
are recognised only to the extent that it is probable that future taxable profits will be
available against which the deductible temporary differences, carried forward tax credits or
tax losses can be utilised.
Deferred tax assets and liabilities are measured on a non-discounted basis at the tax rates
that are expected to apply when the related asset is realised or liability settled based on the
tax rates and laws enacted or substantively enacted at the Balance Sheet date.
Notes to the accounts For the year ended 31 October 2016
Financial Statements Registered number 743437
Julian Hodge Bank Limited
29
1 Accounting policies (continued)
Corporation tax is charged or credited directly to other comprehensive income if it relates to
items that are credited or charged to other comprehensive income and to the statement of
changes in equity if it relates to items that are credited or charged directly to equity.
Otherwise corporation tax is recognised in the Income Statement.
Employee benefits
i) Pensions
The Company operates a defined benefit pension scheme for members of staff. The
Company and its subsidiary undertaking are participating employers in The Carlyle (1972)
Pension and Life Assurance Scheme, a defined benefits scheme operated by The Carlyle
Trust Limited. The assets of the scheme are held separately from those of the Company.
The Company’s net obligation under the defined benefit pension scheme is assessed
annually by an independent qualified actuary. The net obligation is calculated as the
difference between the fair value of the scheme’s assets and the amount of future
entitlements earned by scheme members from service in the current and prior periods,
discounted back to present values using a rate based on an index of long-dated AA rated
corporate bonds using the projected unit method. This calculation allows the net obligation
of the scheme to be expressed as either a surplus or deficit, which is recognised as either
an asset or liability respectively in the Company’s accounts at the balance sheet date.
Pension costs for service in the period are assessed in accordance with advice from a
qualified actuary and are recognised in the Income Statement. Gains or losses arising from
the re-measurement of the defined benefit plan are recognised in full, in the year they
occur, in the Statement of Other Comprehensive Income.
ii) Reimbursement asset on pension deficit
The Bank has recognised a reimbursement asset in respect of its pension scheme deficit
(see note 30). The obligation falls to the Bank’s immediate parent, The Carlyle Trust
Limited. The movement in the reimbursement asset each year (following its initial
recognition in the year ended 31 October 2014) is recognised in the Income Statement to
the extent that the reimbursement relates to a charge in the Bank’s Income Statement. Any
movement in the reimbursement asset which does not relate to the Company’s Income
Statement is recognised in the Statement of Other Comprehensive Income.
iii) Short-term employment benefits
The cost of short-term employee benefits, including wages and salaries, social security
costs, bonuses payable within twelve months and healthcare, is recognised in the year of
service.
Leases
Where the Company enters into a lease that entails taking substantially all the risks and
rewards of ownership of an asset the agreement is treated as a finance lease. The asset is
recorded on the Balance Sheet within property, plant and equipment and is depreciated
over its estimated useful life. If there is no reasonable certainty that the Company will
obtain ownership at the end of the lease term, the asset is depreciated over the shorter of
the lease term and its useful life. Future instalments under such leases, net of finance
charges, are included within other liabilities. Rentals payable are apportioned between the
finance element, which is charged to the Income Statement at a constant annual rate, and
the capital element, which reduces the outstanding obligation for future instalments.
All other leases are accounted for as operating leases and payments are charged to
administration expenses on a straight line basis over the period of the lease.
Notes to the accounts For the year ended 31 October 2016
Financial Statements Registered number 743437
Julian Hodge Bank Limited
30
1 Accounting policies (continued)
Provisions and contingent liabilities
A provision is recognised when there is a present obligation as a result of a past event, it is
probable that the obligation will be settled and the amount can be estimated reliably. The
expense relating to any increase in provision is charged to the Income Statement.
Contingent liabilities are potential obligations from past events which shall be confirmed by
future events. Contingent liabilities are not recognised within the Balance Sheet unless
arising from a business combination.
Share capital
Ordinary shares are classified as equity.
Incremental costs directly attributable to the issue of new ordinary shares are shown in
equity as a deduction, net of tax, from the proceeds.
Available for Sale Reserve
The Available for Sale Reserve comprises changes in fair values of available for sale
investments in the period.
Funding for lending scheme (FLS)
In order for the Company to access funding from the FLS, mortgages, covered bonds,
supranationals and gilts have been pledged as collateral. Where the risk and reward of
ownership of the collateral remains with the Company they are retained on Balance Sheet.
The interest receivable on these assets continues to be accounted for as earned on an
accruals basis. FLS transactions do not involve the transfer of risk on the collateral and
hence fail the recognition criteria under IAS 39. Therefore, for accounting purposes, the
underlying collateral is retained on the Balance Sheet and the Treasury bills received are
not.
Notes to the accounts For the year ended 31 October 2016
Financial Statements Registered number 743437
Julian Hodge Bank Limited
31
2 Judgement in applying accounting policies and critical accounting
estimates
The Company has to make judgements in applying its accounting policies which affect the
amounts recognised in the accounts. In addition, estimates and assumptions are made that
could affect the reported amounts of assets and liabilities within the following financial year.
The most significant areas where judgement and estimates are made are as follows:
Commercial Loans EIR
The Company recognises interest on loans and advances to customers on the basis of their
Effective Interest Rate (EIR). This is a constant rate that averages out the effect of
incentives and fees across the expected life of the loan account. A critical assumption in the
calculation is the expected life, as this determines the assumed period over which
customers may be paying various differentiated interest rates. The calculation of the EIR
uses assumptions on expected life that are based on the experience of similar products.
These assumptions are monitored to ensure their ongoing appropriateness. Changes in the
amortised cost balance arising from actual product life experience, differing from the
assumed life, are periodically calculated and an adjustment made to the loan balance, with
a corresponding adjustment to interest receivable and similar income.
An increase in the average expected life of one month would result in an increase in loans
and advances to customers of £10,000, with a corresponding reduction to income in the
Income Statement.
Assumptions as to future market interest rates also affect the calculation.
Impairment losses on loans and advances to customers
In accordance with the accounting policy described in note 1, impairment is measured as
the difference between an asset’s carrying amount and the present value of management’s
estimate of discounted future cash flows. Key assumptions include the probability of any
account going into default, the probability of defaulting accounts progressing to possession
and the eventual loss incurred in the event of forced sale or write-off. These assumptions
are based on observable historical (and other independent third party) data and updated as
management considers appropriate to reflect current conditions.
In assessing the need for collective loss allowance, management considers factors such as
credit quality, portfolio size, concentrations and economic factors. To estimate the required
allowance assumptions are made based on historical experience and current economic
conditions.
The sensitivity of provisions is affected in part due to the company’s policy of limiting
advances to a maximum of 60% of property market value for residential properties. If
average residential property prices were to fall by 10%, no further provision would be
required.
The loan loss provision against the Commercial lending portfolio is sensitive to a number of
factors including: Commercial real estate values at the expected date of sale, the likely
funds available on liquidation or bankruptcy, including any guarantees, and the time taken
to dispose of the collateral.
These assumptions are based on observed historical data and updated as management
considers appropriate to reflect current and future conditions. The accuracy of the
impairment provision would therefore be affected by unexpected changes in the above
assumptions.
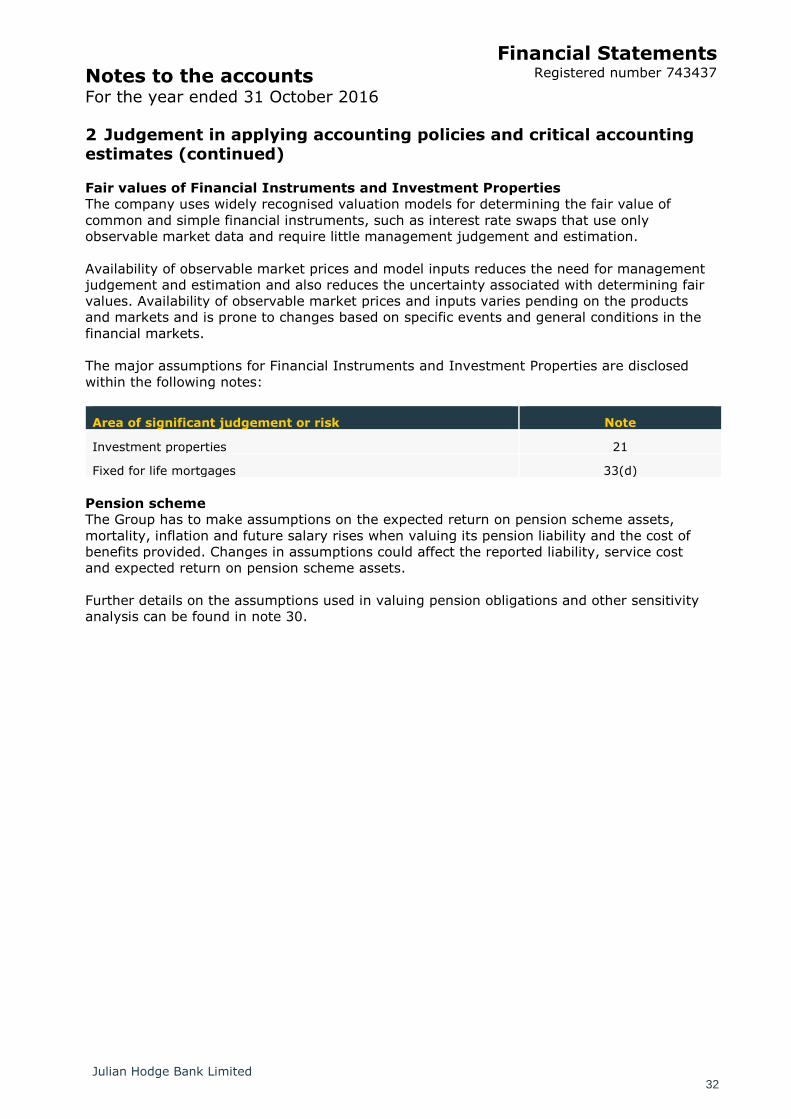
Notes to the accounts For the year ended 31 October 2016
Financial Statements Registered number 743437
Julian Hodge Bank Limited
32
2 Judgement in applying accounting policies and critical accounting estimates (continued)
Fair values of Financial Instruments and Investment Properties
The company uses widely recognised valuation models for determining the fair value of
common and simple financial instruments, such as interest rate swaps that use only
observable market data and require little management judgement and estimation.
Availability of observable market prices and model inputs reduces the need for management
judgement and estimation and also reduces the uncertainty associated with determining fair
values. Availability of observable market prices and inputs varies pending on the products
and markets and is prone to changes based on specific events and general conditions in the
financial markets.
The major assumptions for Financial Instruments and Investment Properties are disclosed
within the following notes:
Area of significant judgement or risk Note
Investment properties 21
Fixed for life mortgages 33(d)
Pension scheme
The Group has to make assumptions on the expected return on pension scheme assets,
mortality, inflation and future salary rises when valuing its pension liability and the cost of
benefits provided. Changes in assumptions could affect the reported liability, service cost
and expected return on pension scheme assets.
Further details on the assumptions used in valuing pension obligations and other sensitivity
analysis can be found in note 30.
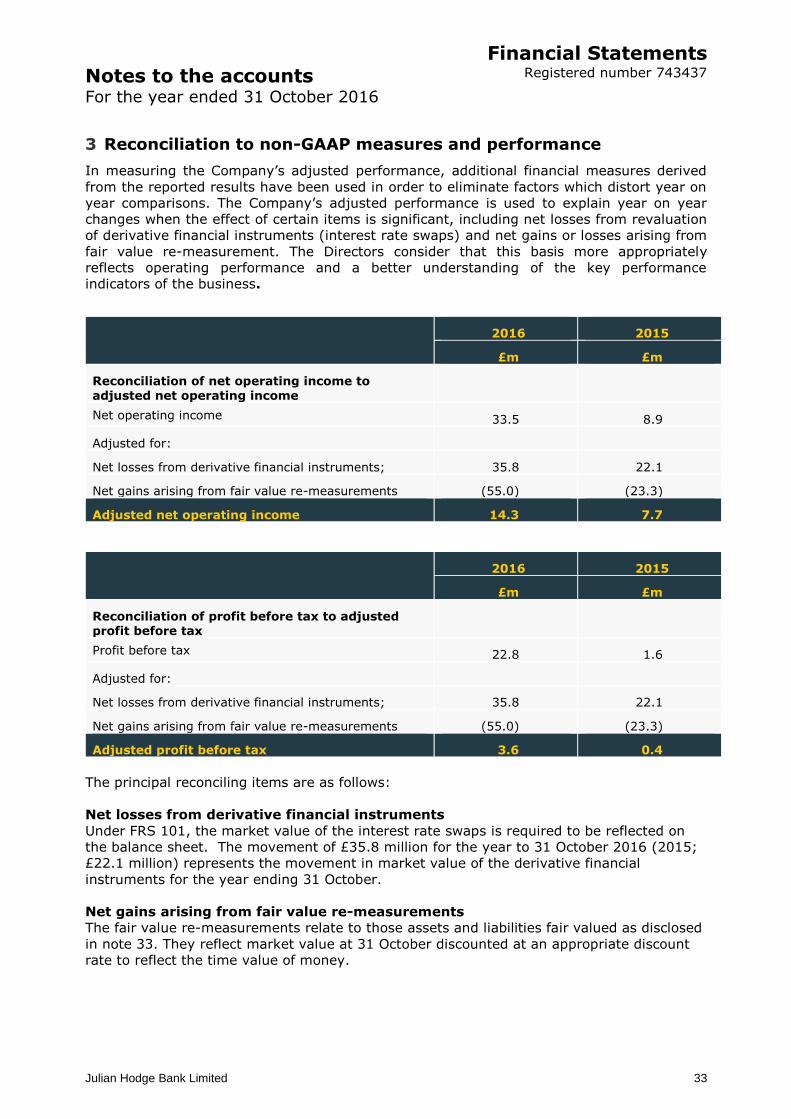
Notes to the accounts For the year ended 31 October 2016
Financial Statements Registered number 743437
Julian Hodge Bank Limited
33
3 Reconciliation to non-GAAP measures and performance
In measuring the Company’s adjusted performance, additional financial measures derived
from the reported results have been used in order to eliminate factors which distort year on
year comparisons. The Company’s adjusted performance is used to explain year on year
changes when the effect of certain items is significant, including net losses from revaluation
of derivative financial instruments (interest rate swaps) and net gains or losses arising from
fair value re-measurement. The Directors consider that this basis more appropriately
reflects operating performance and a better understanding of the key performance
indicators of the business.
2016 2015
£m £m
Reconciliation of net operating income to adjusted net operating income
Net operating income 33.5 8.9
Adjusted for:
Net losses from derivative financial instruments; 35.8 22.1
Net gains arising from fair value re-measurements (55.0) (23.3)
Adjusted net operating income 14.3 7.7
2016 2015
£m £m
Reconciliation of profit before tax to adjusted profit before tax
Profit before tax 22.8 1.6
Adjusted for:
Net losses from derivative financial instruments; 35.8 22.1
Net gains arising from fair value re-measurements (55.0) (23.3)
Adjusted profit before tax 3.6 0.4
The principal reconciling items are as follows:
Net losses from derivative financial instruments
Under FRS 101, the market value of the interest rate swaps is required to be reflected on
the balance sheet. The movement of £35.8 million for the year to 31 October 2016 (2015;
£22.1 million) represents the movement in market value of the derivative financial
instruments for the year ending 31 October.
Net gains arising from fair value re-measurements
The fair value re-measurements relate to those assets and liabilities fair valued as disclosed
in note 33. They reflect market value at 31 October discounted at an appropriate discount
rate to reflect the time value of money.
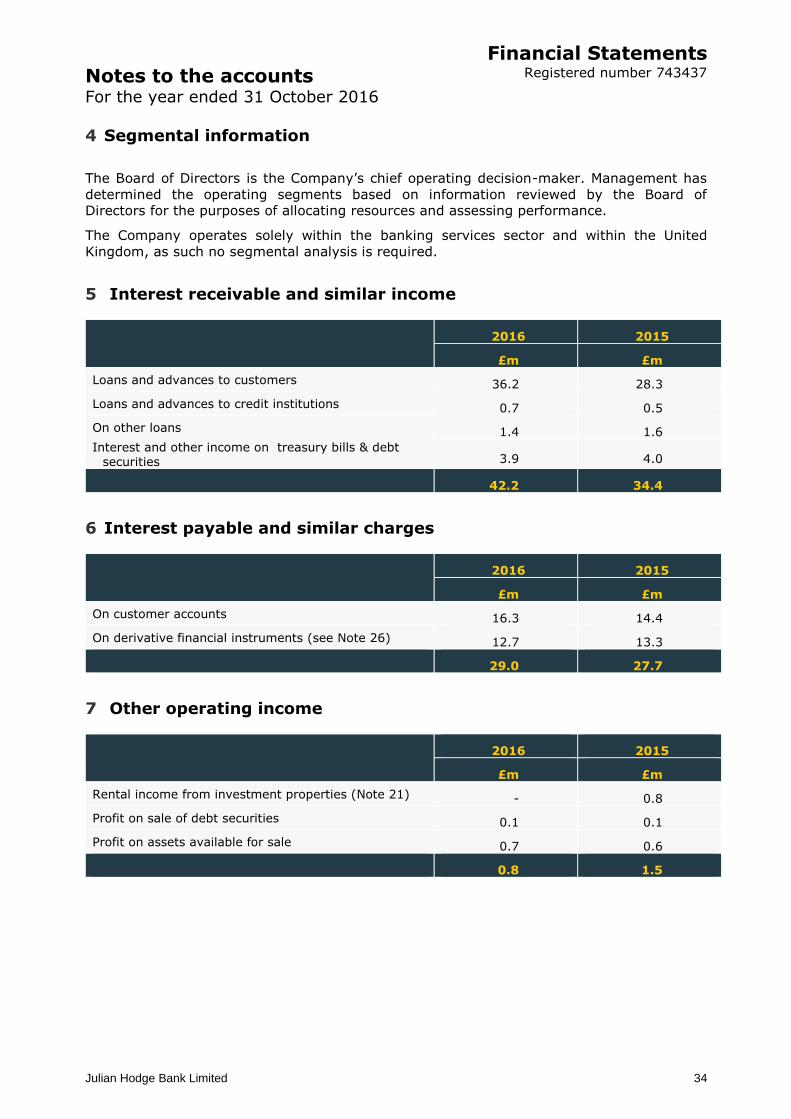
Notes to the accounts For the year ended 31 October 2016
Financial Statements Registered number 743437
Julian Hodge Bank Limited
34
4 Segmental information
The Board of Directors is the Company’s chief operating decision-maker. Management has
determined the operating segments based on information reviewed by the Board of
Directors for the purposes of allocating resources and assessing performance.
The Company operates solely within the banking services sector and within the United
Kingdom, as such no segmental analysis is required.
5 Interest receivable and similar income
2016 2015
£m £m
Loans and advances to customers 36.2 28.3
Loans and advances to credit institutions 0.7 0.5
On other loans 1.4 1.6
Interest and other income on treasury bills & debt securities 3.9 4.0
42.2 34.4
6 Interest payable and similar charges
2016 2015
£m £m
On customer accounts 16.3 14.4
On derivative financial instruments (see Note 26) 12.7 13.3
29.0 27.7
7 Other operating income
2016 2015
£m £m
Rental income from investment properties (Note 21) - 0.8
Profit on sale of debt securities 0.1 0.1
Profit on assets available for sale 0.7 0.6
0.8 1.5
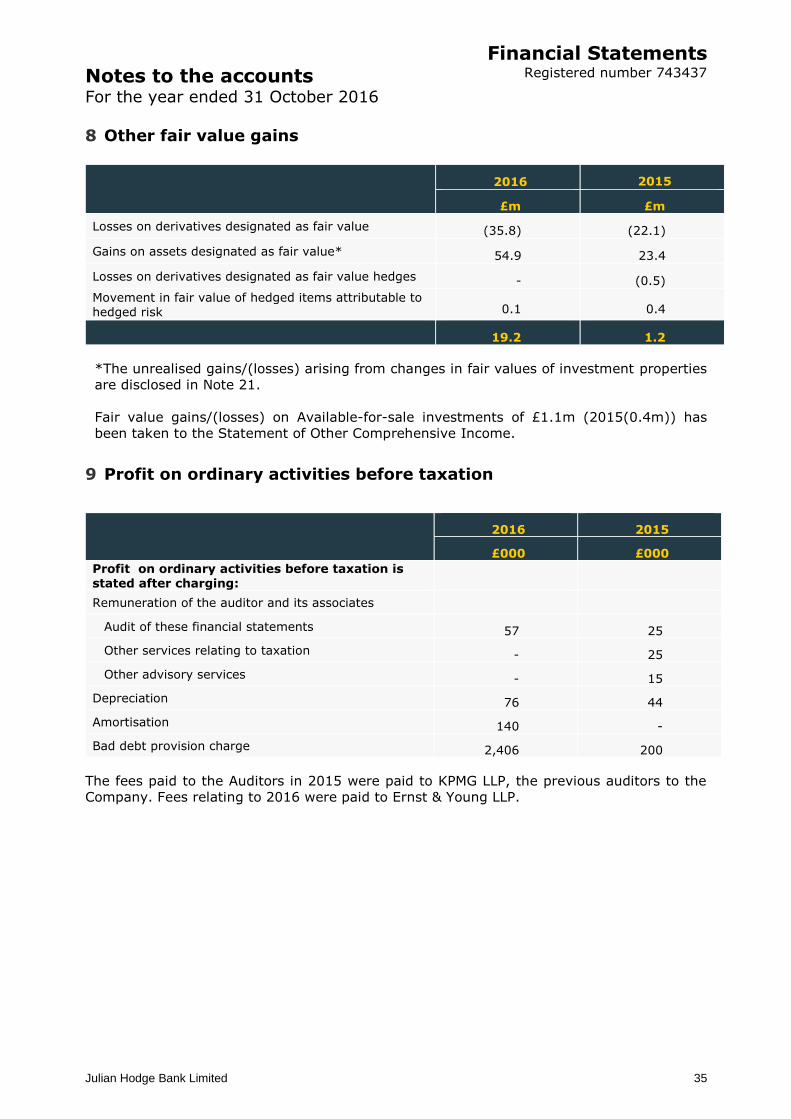
Notes to the accounts For the year ended 31 October 2016
Financial Statements Registered number 743437
Julian Hodge Bank Limited
35
8 Other fair value gains
2016 2015
£m £m
Losses on derivatives designated as fair value (35.8) (22.1)
Gains on assets designated as fair value* 54.9 23.4
Losses on derivatives designated as fair value hedges - (0.5)
Movement in fair value of hedged items attributable to hedged risk 0.1 0.4
19.2 1.2
*The unrealised gains/(losses) arising from changes in fair values of investment properties
are disclosed in Note 21.
Fair value gains/(losses) on Available-for-sale investments of £1.1m (2015(0.4m)) has
been taken to the Statement of Other Comprehensive Income.
9 Profit on ordinary activities before taxation
2016 2015
£000 £000
Profit on ordinary activities before taxation is stated after charging:
Remuneration of the auditor and its associates
Audit of these financial statements 57 25
Other services relating to taxation - 25
Other advisory services - 15
Depreciation 76 44
Amortisation 140 -
Bad debt provision charge 2,406 200
The fees paid to the Auditors in 2015 were paid to KPMG LLP, the previous auditors to the
Company. Fees relating to 2016 were paid to Ernst & Young LLP.
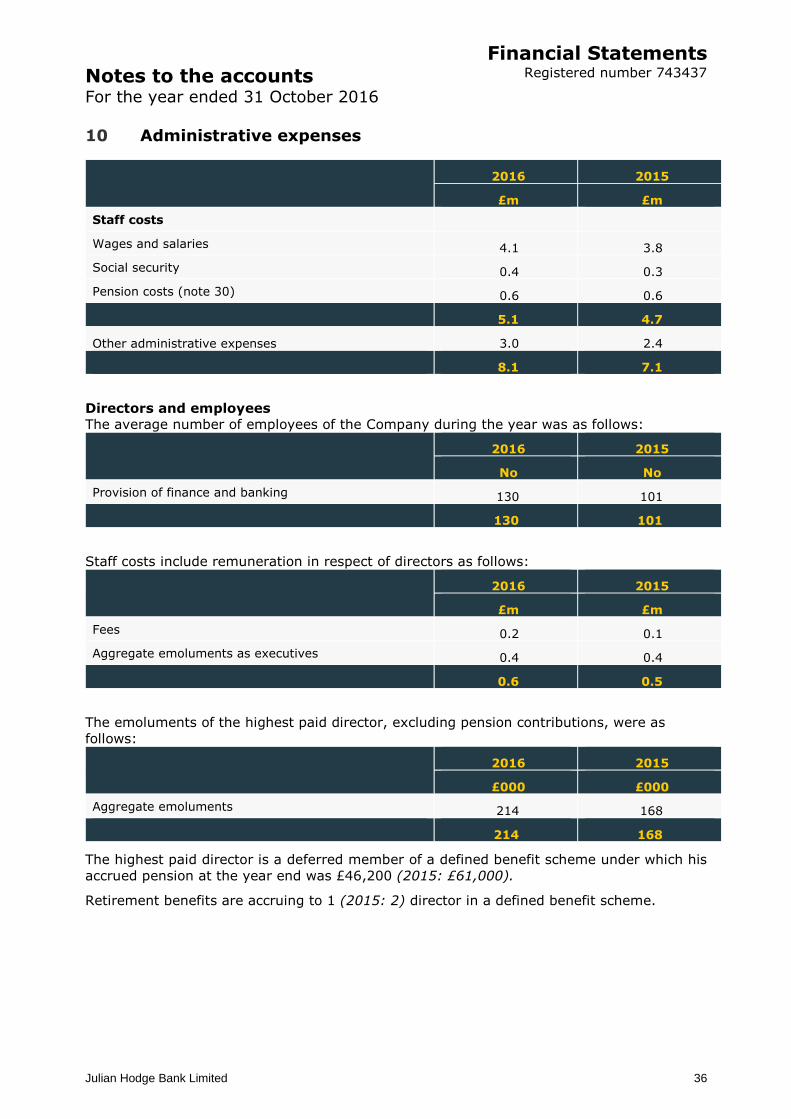
Notes to the accounts For the year ended 31 October 2016
Financial Statements Registered number 743437
Julian Hodge Bank Limited
36
10 Administrative expenses
2016 2015
£m £m
Staff costs
Wages and salaries 4.1 3.8
Social security 0.4 0.3
Pension costs (note 30) 0.6 0.6
5.1 4.7
Other administrative expenses 3.0 2.4
8.1 7.1
Directors and employees
The average number of employees of the Company during the year was as follows:
2016 2015
No No
Provision of finance and banking 130 101
130 101
Staff costs include remuneration in respect of directors as follows:
2016 2015
£m £m
Fees 0.2 0.1
Aggregate emoluments as executives 0.4 0.4
0.6 0.5
The emoluments of the highest paid director, excluding pension contributions, were as
follows:
2016 2015
£000 £000
Aggregate emoluments 214 168
214 168
The highest paid director is a deferred member of a defined benefit scheme under which his
accrued pension at the year end was £46,200 (2015: £61,000).
Retirement benefits are accruing to 1 (2015: 2) director in a defined benefit scheme.
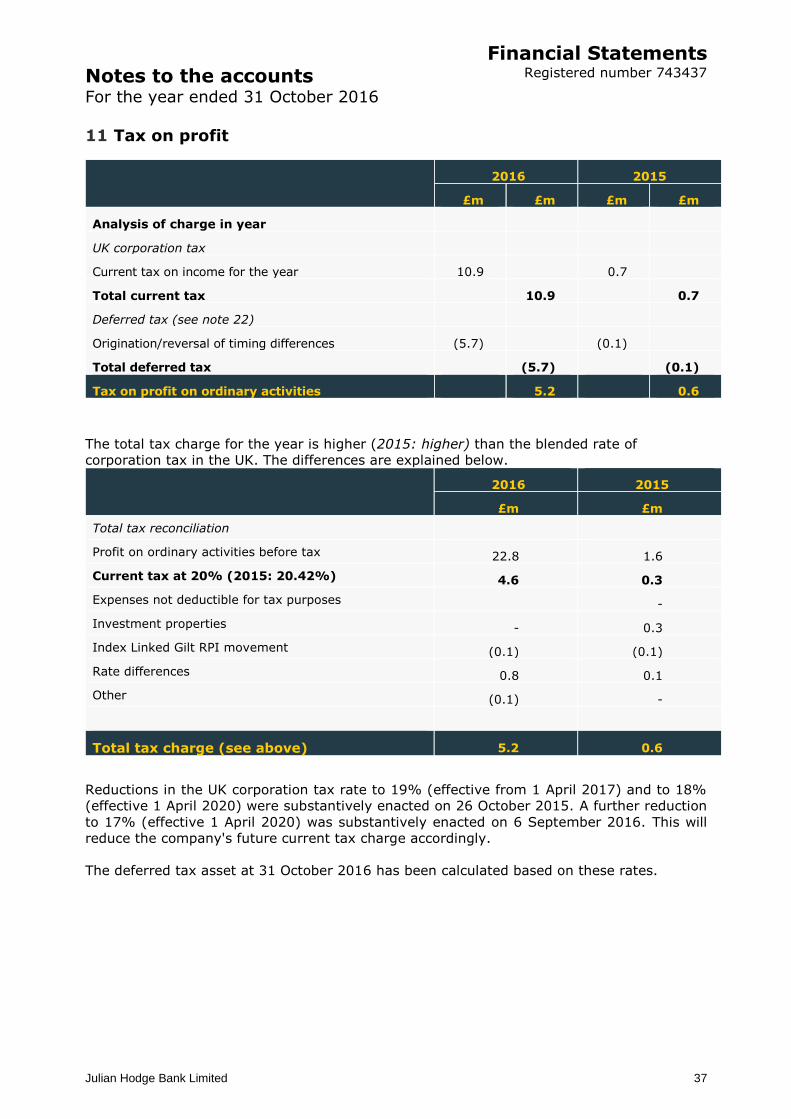
Notes to the accounts For the year ended 31 October 2016
Financial Statements Registered number 743437
Julian Hodge Bank Limited
37
11 Tax on profit
2016 2015
£m £m £m £m
Analysis of charge in year
UK corporation tax
Current tax on income for the year 10.9 0.7
Total current tax 10.9 0.7
Deferred tax (see note 22)
Origination/reversal of timing differences (5.7) (0.1)
Total deferred tax (5.7) (0.1)
Tax on profit on ordinary activities 5.2 0.6
The total tax charge for the year is higher (2015: higher) than the blended rate of
corporation tax in the UK. The differences are explained below.
2016 2015
£m £m
Total tax reconciliation
Profit on ordinary activities before tax 22.8 1.6
Current tax at 20% (2015: 20.42%) 4.6 0.3
Expenses not deductible for tax purposes -
Investment properties - 0.3
Index Linked Gilt RPI movement (0.1) (0.1)
Rate differences 0.8 0.1
Other (0.1) -
Total tax charge (see above) 5.2 0.6
Reductions in the UK corporation tax rate to 19% (effective from 1 April 2017) and to 18%
(effective 1 April 2020) were substantively enacted on 26 October 2015. A further reduction
to 17% (effective 1 April 2020) was substantively enacted on 6 September 2016. This will
reduce the company's future current tax charge accordingly.
The deferred tax asset at 31 October 2016 has been calculated based on these rates.
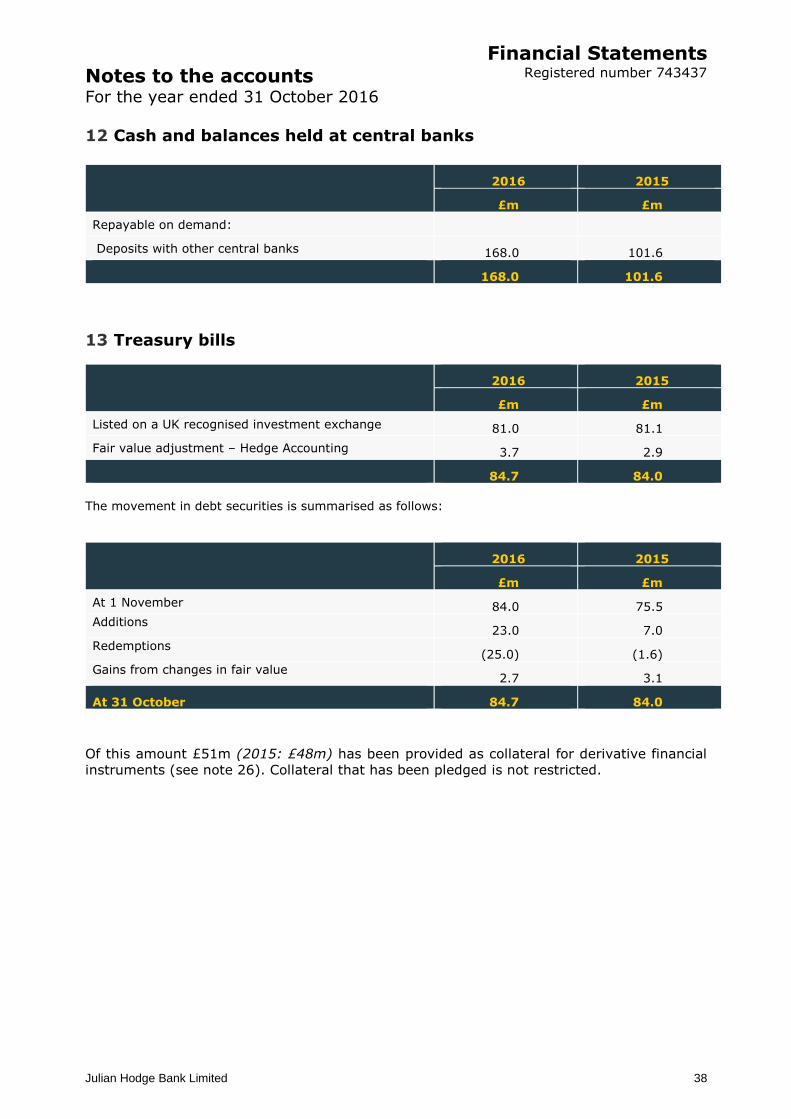
Notes to the accounts For the year ended 31 October 2016
Financial Statements Registered number 743437
Julian Hodge Bank Limited
38
12 Cash and balances held at central banks
2016 2015
£m £m
Repayable on demand:
Deposits with other central banks 168.0 101.6
168.0 101.6
13 Treasury bills
2016 2015
£m £m
Listed on a UK recognised investment exchange 81.0 81.1
Fair value adjustment – Hedge Accounting 3.7 2.9
84.7 84.0
The movement in debt securities is summarised as follows:
2016 2015
£m £m
At 1 November 84.0 75.5
Additions 23.0 7.0
Redemptions (25.0) (1.6)
Gains from changes in fair value 2.7 3.1
At 31 October 84.7 84.0
Of this amount £51m (2015: £48m) has been provided as collateral for derivative financial
instruments (see note 26). Collateral that has been pledged is not restricted.
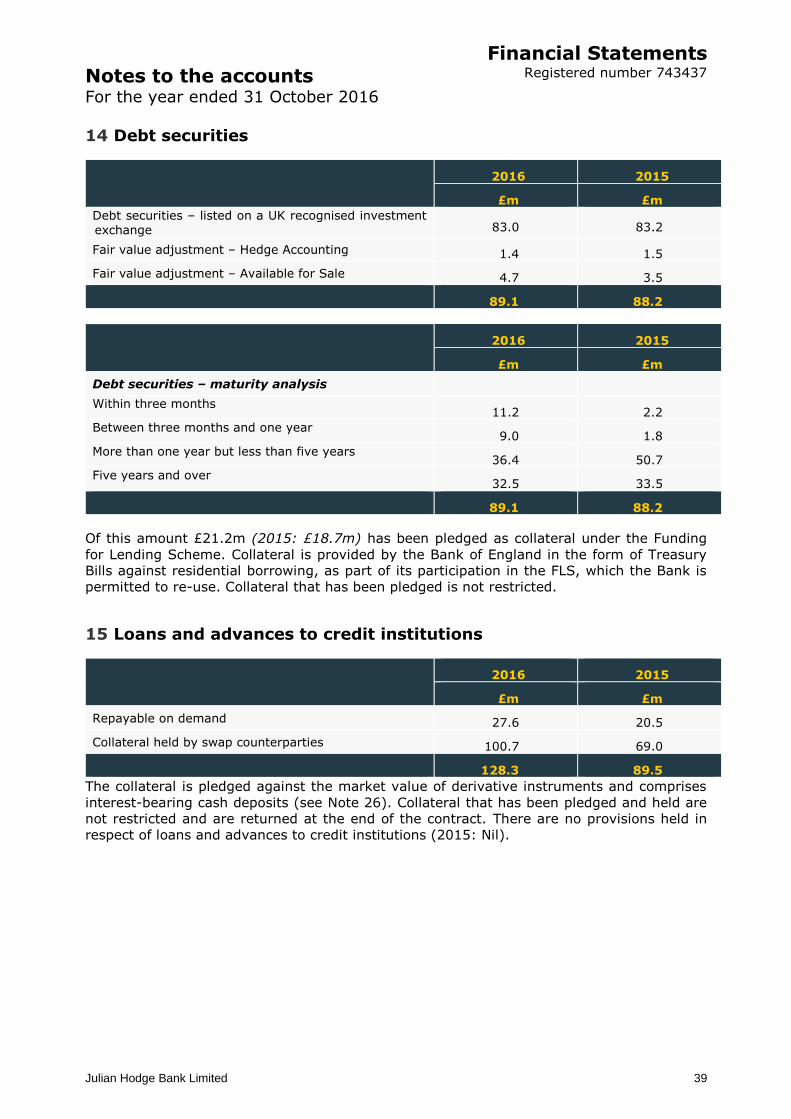
Notes to the accounts For the year ended 31 October 2016
Financial Statements Registered number 743437
Julian Hodge Bank Limited
39
14 Debt securities
2016 2015
£m £m
Debt securities – listed on a UK recognised investment exchange 83.0 83.2
Fair value adjustment – Hedge Accounting 1.4 1.5
Fair value adjustment – Available for Sale 4.7 3.5
89.1 88.2
2016 2015
£m £m
Debt securities – maturity analysis
Within three months 11.2 2.2
Between three months and one year 9.0 1.8
More than one year but less than five years 36.4 50.7
Five years and over 32.5 33.5
89.1 88.2
Of this amount £21.2m (2015: £18.7m) has been pledged as collateral under the Funding
for Lending Scheme. Collateral is provided by the Bank of England in the form of Treasury
Bills against residential borrowing, as part of its participation in the FLS, which the Bank is
permitted to re-use. Collateral that has been pledged is not restricted.
15 Loans and advances to credit institutions
2016 2015
£m £m
Repayable on demand 27.6 20.5
Collateral held by swap counterparties 100.7 69.0
128.3 89.5
The collateral is pledged against the market value of derivative instruments and comprises
interest-bearing cash deposits (see Note 26). Collateral that has been pledged and held are
not restricted and are returned at the end of the contract. There are no provisions held in
respect of loans and advances to credit institutions (2015: Nil).
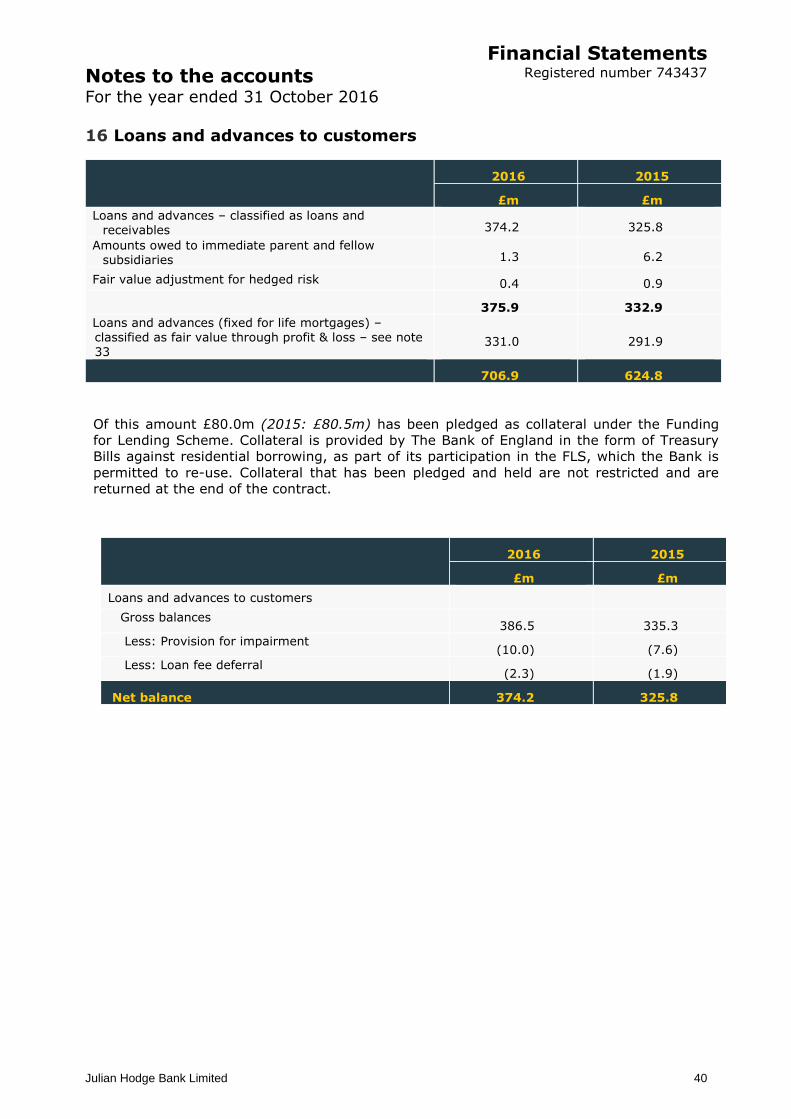
Notes to the accounts For the year ended 31 October 2016
Financial Statements Registered number 743437
Julian Hodge Bank Limited
40
16 Loans and advances to customers
2016 2015
£m £m
Loans and advances – classified as loans and receivables 374.2 325.8
Amounts owed to immediate parent and fellow subsidiaries 1.3 6.2
Fair value adjustment for hedged risk 0.4 0.9
375.9 332.9
Loans and advances (fixed for life mortgages) – classified as fair value through profit & loss – see note
33 331.0 291.9
706.9 624.8
Of this amount £80.0m (2015: £80.5m) has been pledged as collateral under the Funding
for Lending Scheme. Collateral is provided by The Bank of England in the form of Treasury
Bills against residential borrowing, as part of its participation in the FLS, which the Bank is
permitted to re-use. Collateral that has been pledged and held are not restricted and are
returned at the end of the contract.
2016 2015
£m £m
Loans and advances to customers
Gross balances 386.5 335.3
Less: Provision for impairment (10.0) (7.6)
Less: Loan fee deferral (2.3) (1.9)
Net balance 374.2 325.8
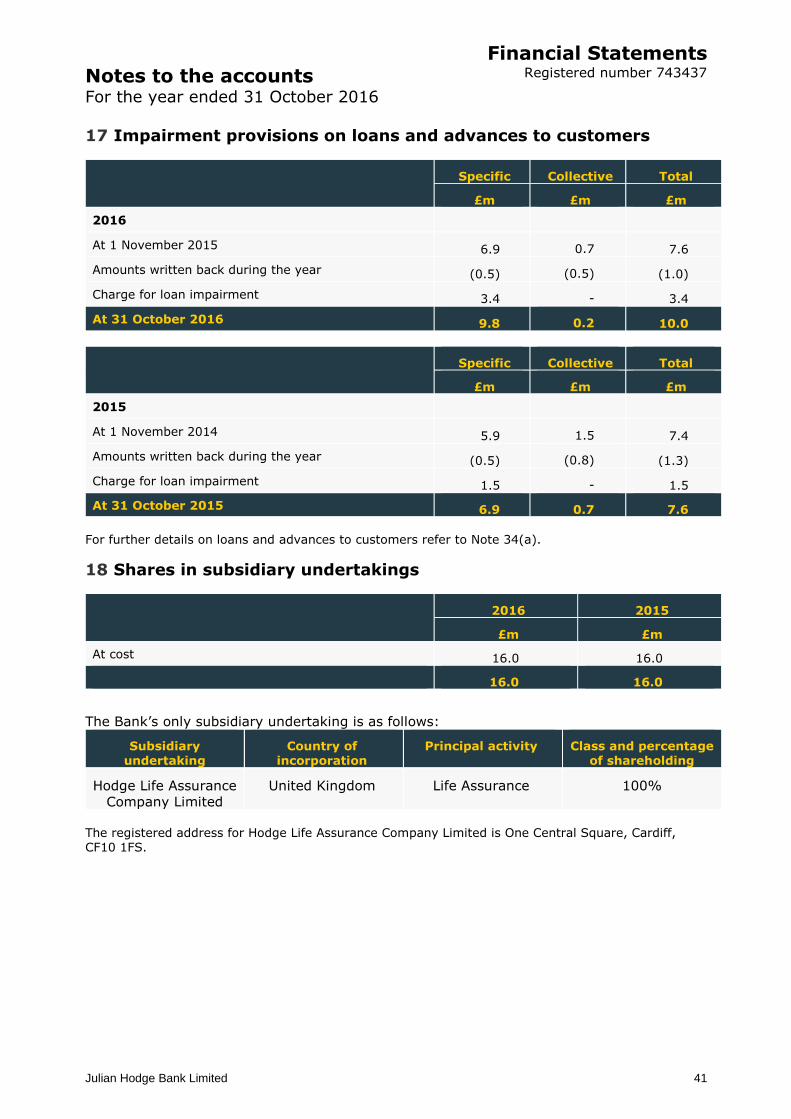
Notes to the accounts For the year ended 31 October 2016
Financial Statements Registered number 743437
Julian Hodge Bank Limited
41
17 Impairment provisions on loans and advances to customers
Specific Collective Total
£m £m £m
2016
At 1 November 2015 6.9 0.7 7.6
Amounts written back during the year (0.5) (0.5) (1.0)
Charge for loan impairment 3.4 - 3.4
At 31 October 2016 9.8 0.2 10.0
Specific Collective Total
£m £m £m
2015
At 1 November 2014 5.9 1.5 7.4
Amounts written back during the year (0.5) (0.8) (1.3)
Charge for loan impairment 1.5 - 1.5
At 31 October 2015 6.9 0.7 7.6
For further details on loans and advances to customers refer to Note 34(a).
18 Shares in subsidiary undertakings
2016 2015
£m £m
At cost 16.0 16.0
16.0 16.0
The Bank’s only subsidiary undertaking is as follows:
Subsidiary undertaking
Country of incorporation
Principal activity Class and percentage of shareholding
Hodge Life Assurance
Company Limited
United Kingdom Life Assurance 100%
The registered address for Hodge Life Assurance Company Limited is One Central Square, Cardiff, CF10 1FS.
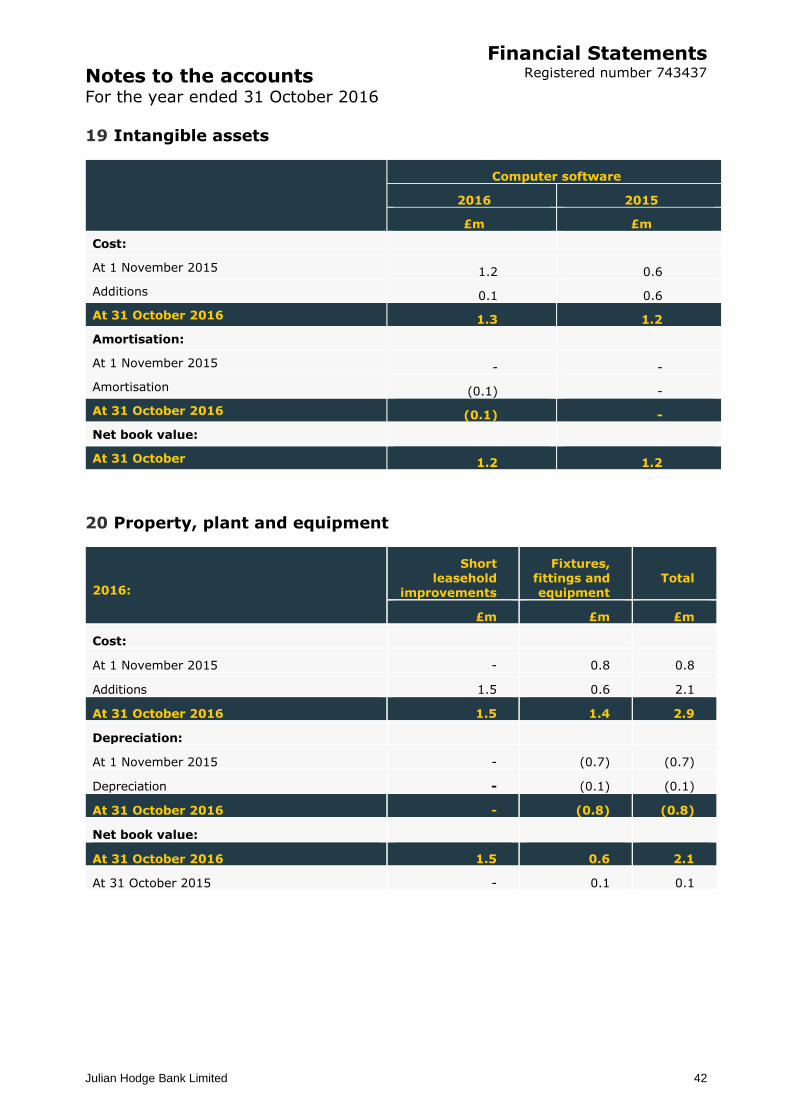
Notes to the accounts For the year ended 31 October 2016
Financial Statements Registered number 743437
Julian Hodge Bank Limited
42
19 Intangible assets
Computer software
2016 2015
£m £m
Cost:
At 1 November 2015 1.2 0.6
Additions 0.1 0.6
At 31 October 2016 1.3 1.2
Amortisation:
At 1 November 2015 - -
Amortisation (0.1) -
At 31 October 2016 (0.1) -
Net book value:
At 31 October 1.2 1.2
20 Property, plant and equipment
2016:
Short leasehold
improvements
Fixtures, fittings and
equipment
Total
£m £m £m
Cost:
At 1 November 2015 - 0.8 0.8
Additions 1.5 0.6 2.1
At 31 October 2016 1.5 1.4 2.9
Depreciation:
At 1 November 2015 - (0.7) (0.7)
Depreciation - (0.1) (0.1)
At 31 October 2016 - (0.8) (0.8)
Net book value:
At 31 October 2016 1.5 0.6 2.1
At 31 October 2015 - 0.1 0.1
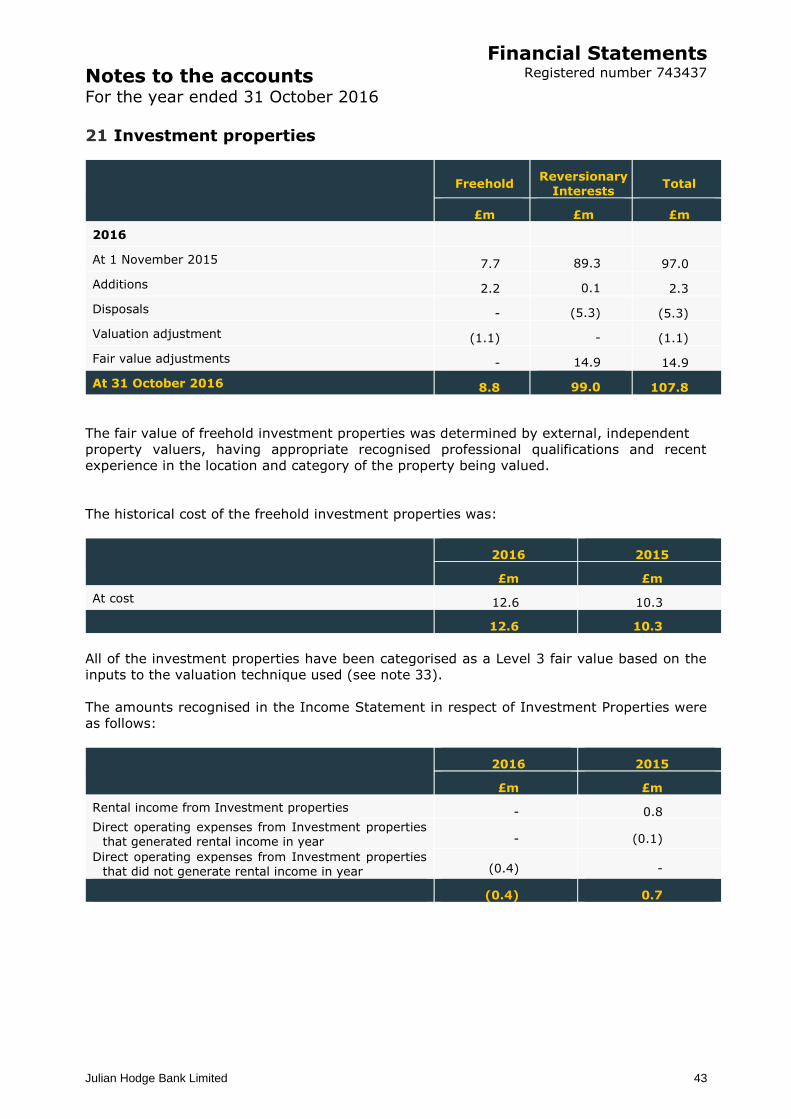
Notes to the accounts For the year ended 31 October 2016
Financial Statements Registered number 743437
Julian Hodge Bank Limited
43
21 Investment properties
Freehold
Reversionary
Interests Total
£m £m £m
2016
At 1 November 2015 7.7 89.3 97.0
Additions 2.2 0.1 2.3
Disposals - (5.3) (5.3)
Valuation adjustment (1.1) - (1.1)
Fair value adjustments - 14.9 14.9
At 31 October 2016 8.8 99.0 107.8
The fair value of freehold investment properties was determined by external, independent
property valuers, having appropriate recognised professional qualifications and recent
experience in the location and category of the property being valued.
The historical cost of the freehold investment properties was:
2016 2015
£m £m
At cost 12.6 10.3
12.6 10.3
All of the investment properties have been categorised as a Level 3 fair value based on the
inputs to the valuation technique used (see note 33).
The amounts recognised in the Income Statement in respect of Investment Properties were
as follows:
2016 2015
£m £m
Rental income from Investment properties - 0.8
Direct operating expenses from Investment properties that generated rental income in year - (0.1)
Direct operating expenses from Investment properties that did not generate rental income in year (0.4) -
(0.4) 0.7
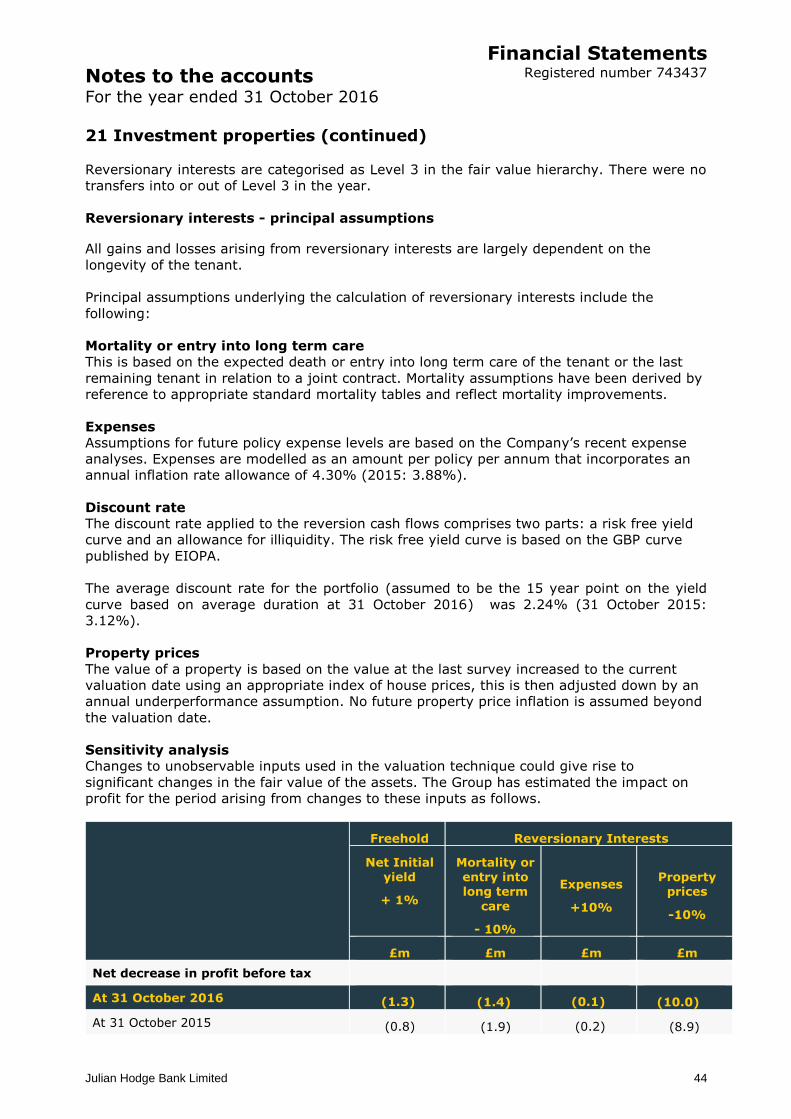
Notes to the accounts For the year ended 31 October 2016
Financial Statements Registered number 743437
Julian Hodge Bank Limited
44
21 Investment properties (continued)
Reversionary interests are categorised as Level 3 in the fair value hierarchy. There were no
transfers into or out of Level 3 in the year.
Reversionary interests - principal assumptions
All gains and losses arising from reversionary interests are largely dependent on the
longevity of the tenant.
Principal assumptions underlying the calculation of reversionary interests include the
following:
Mortality or entry into long term care
This is based on the expected death or entry into long term care of the tenant or the last
remaining tenant in relation to a joint contract. Mortality assumptions have been derived by
reference to appropriate standard mortality tables and reflect mortality improvements.
Expenses
Assumptions for future policy expense levels are based on the Company’s recent expense
analyses. Expenses are modelled as an amount per policy per annum that incorporates an
annual inflation rate allowance of 4.30% (2015: 3.88%).
Discount rate
The discount rate applied to the reversion cash flows comprises two parts: a risk free yield
curve and an allowance for illiquidity. The risk free yield curve is based on the GBP curve
published by EIOPA.
The average discount rate for the portfolio (assumed to be the 15 year point on the yield
curve based on average duration at 31 October 2016) was 2.24% (31 October 2015:
3.12%).
Property prices
The value of a property is based on the value at the last survey increased to the current
valuation date using an appropriate index of house prices, this is then adjusted down by an
annual underperformance assumption. No future property price inflation is assumed beyond
the valuation date.
Sensitivity analysis
Changes to unobservable inputs used in the valuation technique could give rise to
significant changes in the fair value of the assets. The Group has estimated the impact on
profit for the period arising from changes to these inputs as follows.
Freehold Reversionary Interests
Net Initial yield
+ 1%
Mortality or entry into long term
care
- 10%
Expenses
+10%
Property prices
-10%
£m £m £m £m
Net decrease in profit before tax
At 31 October 2016 (1.3) (1.4) (0.1) (10.0)
At 31 October 2015 (0.8) (1.9) (0.2) (8.9)
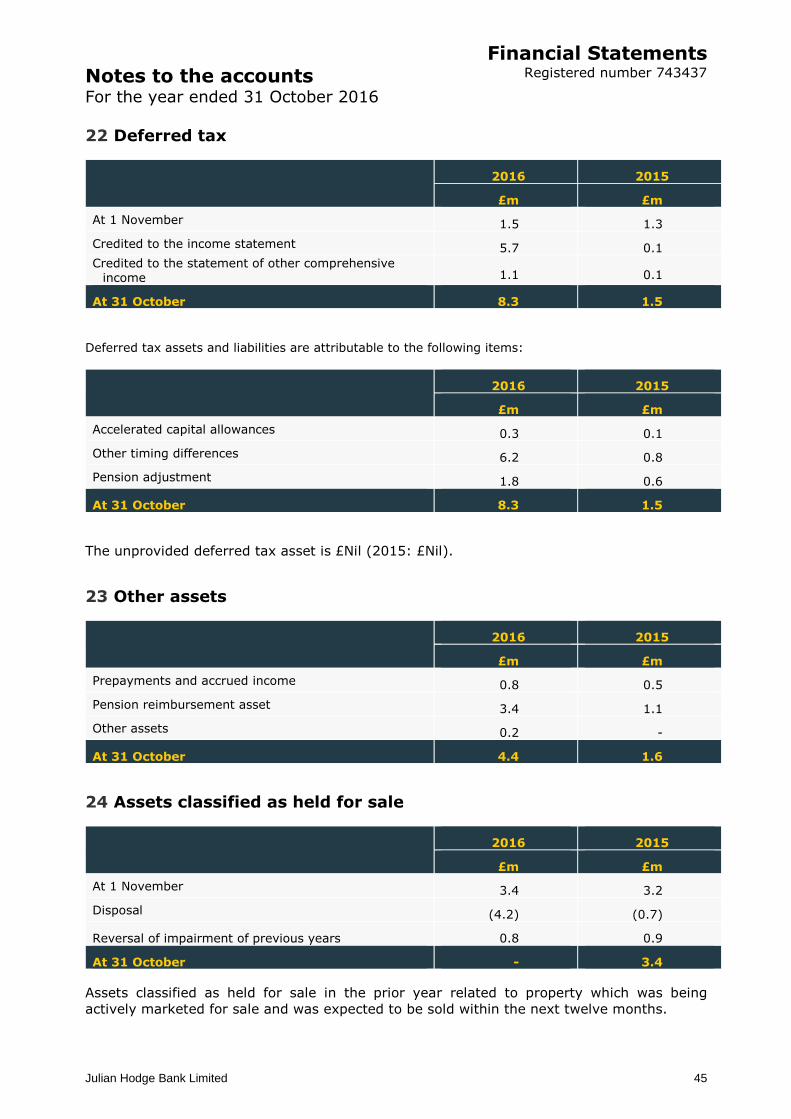
Notes to the accounts For the year ended 31 October 2016
Financial Statements Registered number 743437
Julian Hodge Bank Limited
45
22 Deferred tax
2016 2015
£m £m
At 1 November 1.5 1.3
Credited to the income statement 5.7 0.1
Credited to the statement of other comprehensive income 1.1 0.1
At 31 October 8.3 1.5
Deferred tax assets and liabilities are attributable to the following items:
2016 2015
£m £m
Accelerated capital allowances 0.3 0.1
Other timing differences 6.2 0.8
Pension adjustment 1.8 0.6
At 31 October 8.3 1.5
The unprovided deferred tax asset is £Nil (2015: £Nil).
23 Other assets
2016 2015
£m £m
Prepayments and accrued income 0.8 0.5
Pension reimbursement asset 3.4 1.1
Other assets 0.2 -
At 31 October 4.4 1.6
24 Assets classified as held for sale
2016 2015
£m £m
At 1 November 3.4 3.2
Disposal (4.2) (0.7)
Reversal of impairment of previous years 0.8 0.9
At 31 October - 3.4
Assets classified as held for sale in the prior year related to property which was being
actively marketed for sale and was expected to be sold within the next twelve months.
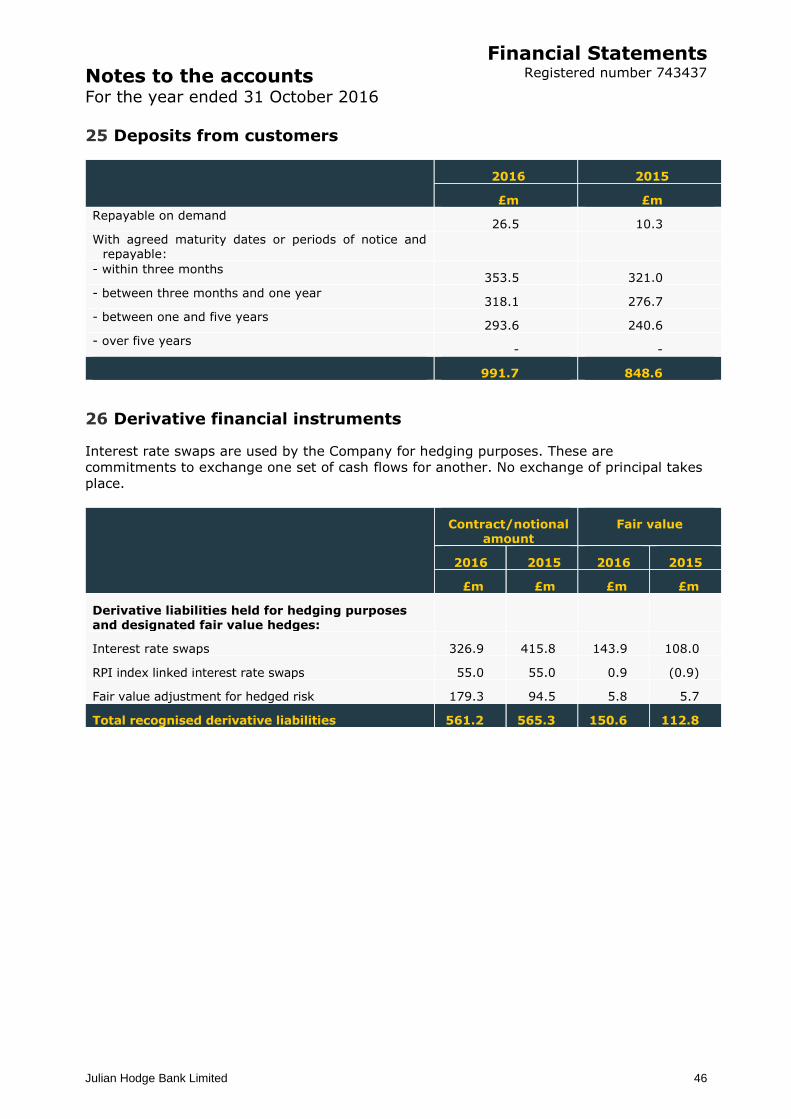
Notes to the accounts For the year ended 31 October 2016
Financial Statements Registered number 743437
Julian Hodge Bank Limited
46
25 Deposits from customers
2016 2015
£m £m
Repayable on demand 26.5 10.3
With agreed maturity dates or periods of notice and repayable:
- within three months 353.5 321.0
- between three months and one year 318.1 276.7
- between one and five years 293.6 240.6
- over five years - -
991.7 848.6
26 Derivative financial instruments
Interest rate swaps are used by the Company for hedging purposes. These are
commitments to exchange one set of cash flows for another. No exchange of principal takes
place.
Contract/notional amount
Fair value
2016 2015 2016 2015
£m £m £m £m
Derivative liabilities held for hedging purposes and designated fair value hedges:
Interest rate swaps 326.9 415.8 143.9 108.0
RPI index linked interest rate swaps 55.0 55.0 0.9 (0.9)
Fair value adjustment for hedged risk 179.3 94.5 5.8 5.7
Total recognised derivative liabilities 561.2 565.3 150.6 112.8
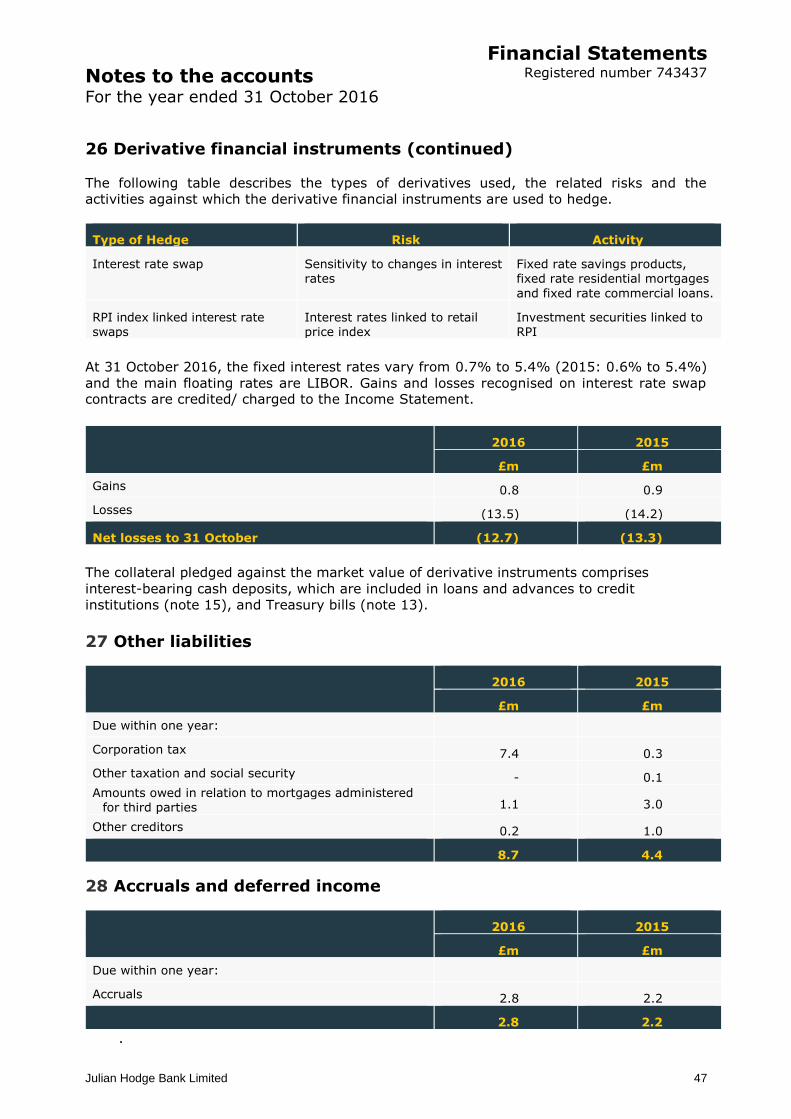
Notes to the accounts For the year ended 31 October 2016
Financial Statements Registered number 743437
Julian Hodge Bank Limited
47
26 Derivative financial instruments (continued)
The following table describes the types of derivatives used, the related risks and the
activities against which the derivative financial instruments are used to hedge.
Type of Hedge Risk Activity
Interest rate swap Sensitivity to changes in interest rates
Fixed rate savings products, fixed rate residential mortgages
and fixed rate commercial loans.
RPI index linked interest rate swaps
Interest rates linked to retail price index
Investment securities linked to RPI
At 31 October 2016, the fixed interest rates vary from 0.7% to 5.4% (2015: 0.6% to 5.4%)
and the main floating rates are LIBOR. Gains and losses recognised on interest rate swap contracts are credited/ charged to the Income Statement.
2016 2015
£m £m
Gains 0.8 0.9
Losses (13.5) (14.2)
Net losses to 31 October (12.7) (13.3)
The collateral pledged against the market value of derivative instruments comprises
interest-bearing cash deposits, which are included in loans and advances to credit
institutions (note 15), and Treasury bills (note 13).
27 Other liabilities
2016 2015
£m £m
Due within one year:
Corporation tax 7.4 0.3
Other taxation and social security - 0.1
Amounts owed in relation to mortgages administered for third parties 1.1 3.0
Other creditors 0.2 1.0
8.7 4.4
28 Accruals and deferred income
2016 2015
£m £m
Due within one year:
Accruals 2.8 2.2
2.8 2.2
.
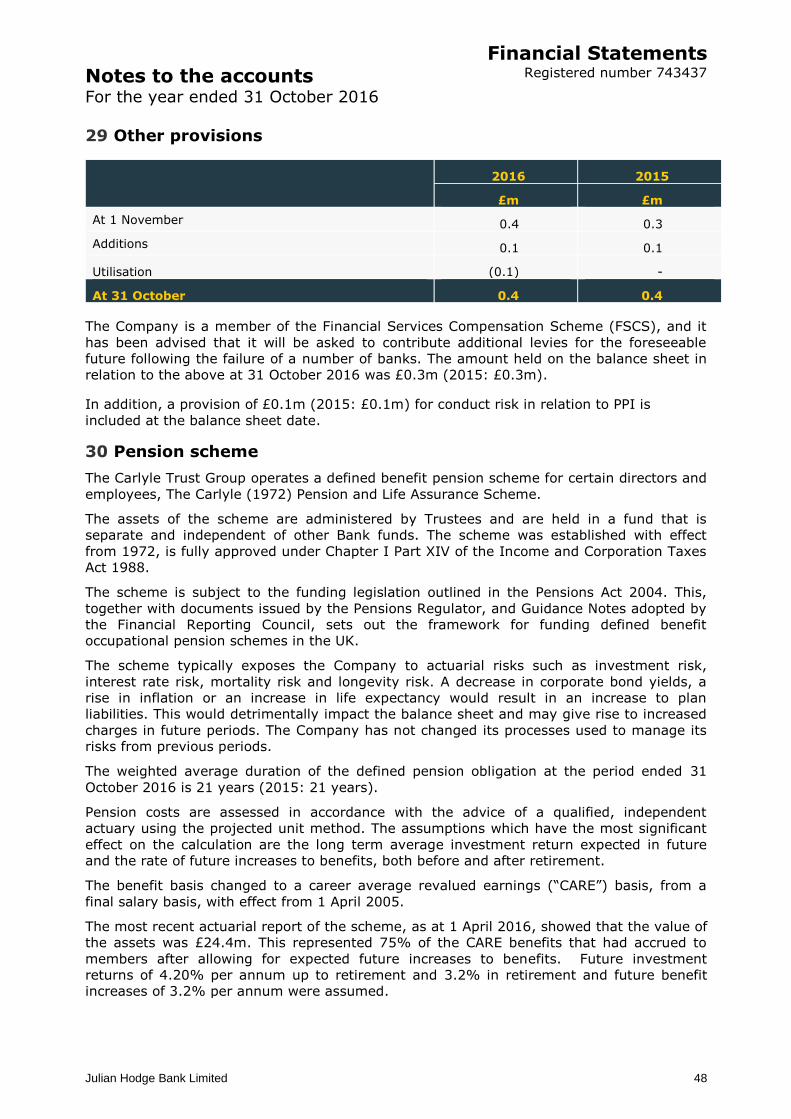
Notes to the accounts For the year ended 31 October 2016
Financial Statements Registered number 743437
Julian Hodge Bank Limited
48
29 Other provisions
2016 2015
£m £m
At 1 November 0.4 0.3
Additions 0.1 0.1
Utilisation (0.1) -
At 31 October 0.4 0.4
The Company is a member of the Financial Services Compensation Scheme (FSCS), and it
has been advised that it will be asked to contribute additional levies for the foreseeable
future following the failure of a number of banks. The amount held on the balance sheet in
relation to the above at 31 October 2016 was £0.3m (2015: £0.3m).
In addition, a provision of £0.1m (2015: £0.1m) for conduct risk in relation to PPI is
included at the balance sheet date.
30 Pension scheme
The Carlyle Trust Group operates a defined benefit pension scheme for certain directors and
employees, The Carlyle (1972) Pension and Life Assurance Scheme.
The assets of the scheme are administered by Trustees and are held in a fund that is
separate and independent of other Bank funds. The scheme was established with effect
from 1972, is fully approved under Chapter I Part XIV of the Income and Corporation Taxes
Act 1988.
The scheme is subject to the funding legislation outlined in the Pensions Act 2004. This,
together with documents issued by the Pensions Regulator, and Guidance Notes adopted by
the Financial Reporting Council, sets out the framework for funding defined benefit
occupational pension schemes in the UK.
The scheme typically exposes the Company to actuarial risks such as investment risk,
interest rate risk, mortality risk and longevity risk. A decrease in corporate bond yields, a
rise in inflation or an increase in life expectancy would result in an increase to plan
liabilities. This would detrimentally impact the balance sheet and may give rise to increased
charges in future periods. The Company has not changed its processes used to manage its
risks from previous periods.
The weighted average duration of the defined pension obligation at the period ended 31
October 2016 is 21 years (2015: 21 years).
Pension costs are assessed in accordance with the advice of a qualified, independent
actuary using the projected unit method. The assumptions which have the most significant
effect on the calculation are the long term average investment return expected in future
and the rate of future increases to benefits, both before and after retirement.
The benefit basis changed to a career average revalued earnings (“CARE”) basis, from a
final salary basis, with effect from 1 April 2005.
The most recent actuarial report of the scheme, as at 1 April 2016, showed that the value of
the assets was £24.4m. This represented 75% of the CARE benefits that had accrued to
members after allowing for expected future increases to benefits. Future investment
returns of 4.20% per annum up to retirement and 3.2% in retirement and future benefit
increases of 3.2% per annum were assumed.
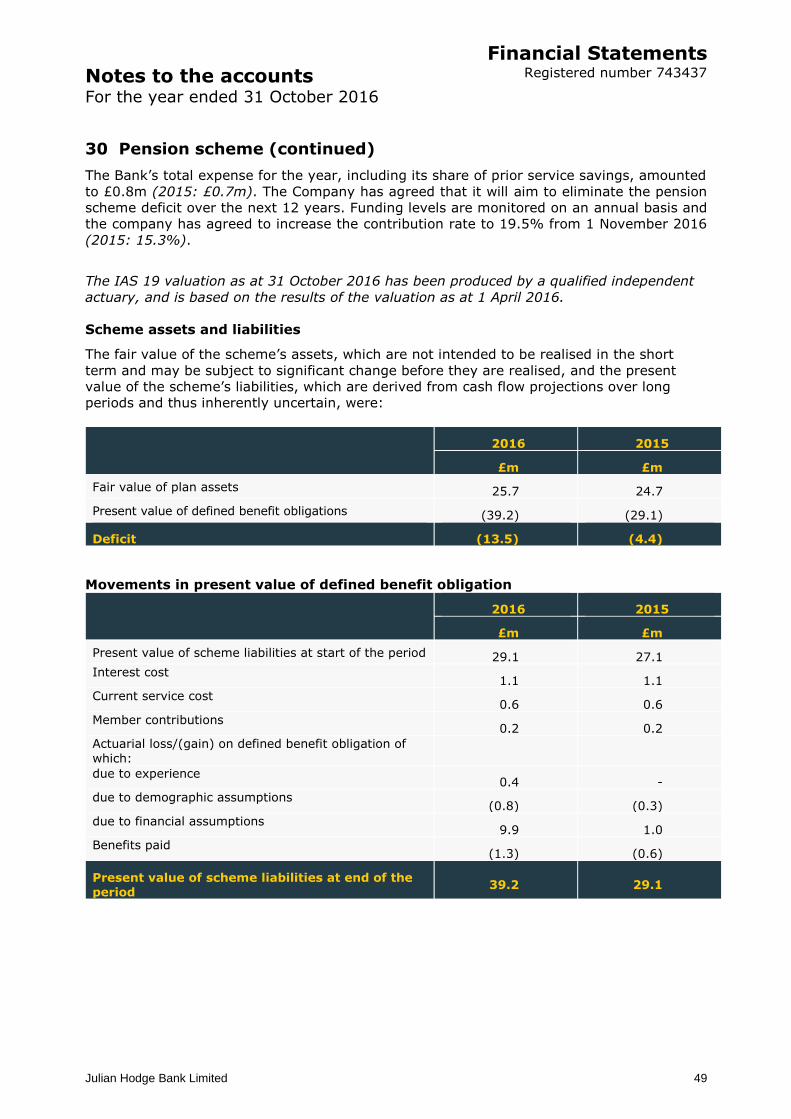
Notes to the accounts For the year ended 31 October 2016
Financial Statements Registered number 743437
Julian Hodge Bank Limited
49
30 Pension scheme (continued)
The Bank’s total expense for the year, including its share of prior service savings, amounted
to £0.8m (2015: £0.7m). The Company has agreed that it will aim to eliminate the pension
scheme deficit over the next 12 years. Funding levels are monitored on an annual basis and
the company has agreed to increase the contribution rate to 19.5% from 1 November 2016
(2015: 15.3%).
The IAS 19 valuation as at 31 October 2016 has been produced by a qualified independent
actuary, and is based on the results of the valuation as at 1 April 2016.
Scheme assets and liabilities
The fair value of the scheme’s assets, which are not intended to be realised in the short
term and may be subject to significant change before they are realised, and the present
value of the scheme’s liabilities, which are derived from cash flow projections over long
periods and thus inherently uncertain, were:
2016 2015
£m £m
Fair value of plan assets 25.7 24.7
Present value of defined benefit obligations (39.2) (29.1)
Deficit (13.5) (4.4)
Movements in present value of defined benefit obligation
2016 2015
£m £m
Present value of scheme liabilities at start of the period 29.1 27.1
Interest cost 1.1 1.1
Current service cost 0.6 0.6
Member contributions 0.2 0.2
Actuarial loss/(gain) on defined benefit obligation of
which:
due to experience 0.4 -
due to demographic assumptions (0.8) (0.3)
due to financial assumptions 9.9 1.0
Benefits paid (1.3) (0.6)
Present value of scheme liabilities at end of the period
39.2 29.1
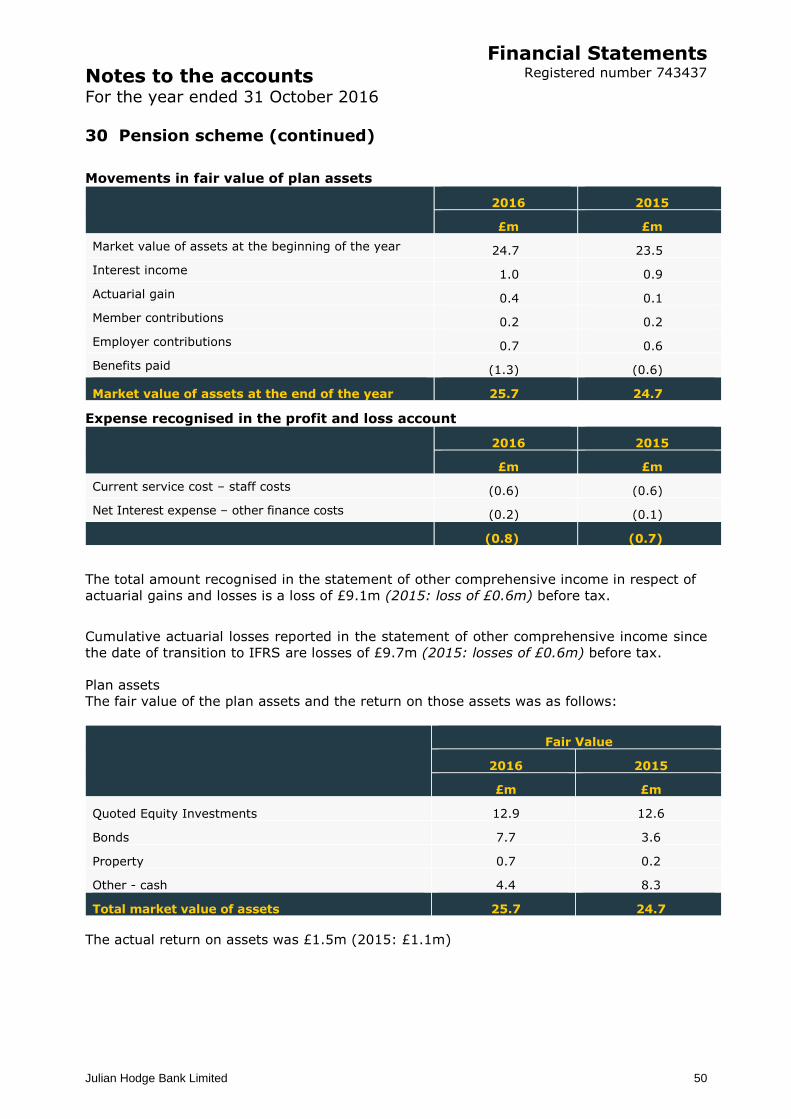
Notes to the accounts For the year ended 31 October 2016
Financial Statements Registered number 743437
Julian Hodge Bank Limited
50
30 Pension scheme (continued)
Movements in fair value of plan assets
2016 2015
£m £m
Market value of assets at the beginning of the year 24.7 23.5
Interest income 1.0 0.9
Actuarial gain 0.4 0.1
Member contributions 0.2 0.2
Employer contributions 0.7 0.6
Benefits paid (1.3) (0.6)
Market value of assets at the end of the year 25.7 24.7
Expense recognised in the profit and loss account
2016 2015
£m £m
Current service cost – staff costs (0.6) (0.6)
Net Interest expense – other finance costs (0.2) (0.1)
(0.8) (0.7)
The total amount recognised in the statement of other comprehensive income in respect of
actuarial gains and losses is a loss of £9.1m (2015: loss of £0.6m) before tax.
Cumulative actuarial losses reported in the statement of other comprehensive income since
the date of transition to IFRS are losses of £9.7m (2015: losses of £0.6m) before tax.
Plan assets
The fair value of the plan assets and the return on those assets was as follows:
Fair Value
2016 2015
£m £m
Quoted Equity Investments 12.9 12.6
Bonds 7.7 3.6
Property 0.7 0.2
Other - cash 4.4 8.3
Total market value of assets 25.7 24.7
The actual return on assets was £1.5m (2015: £1.1m)
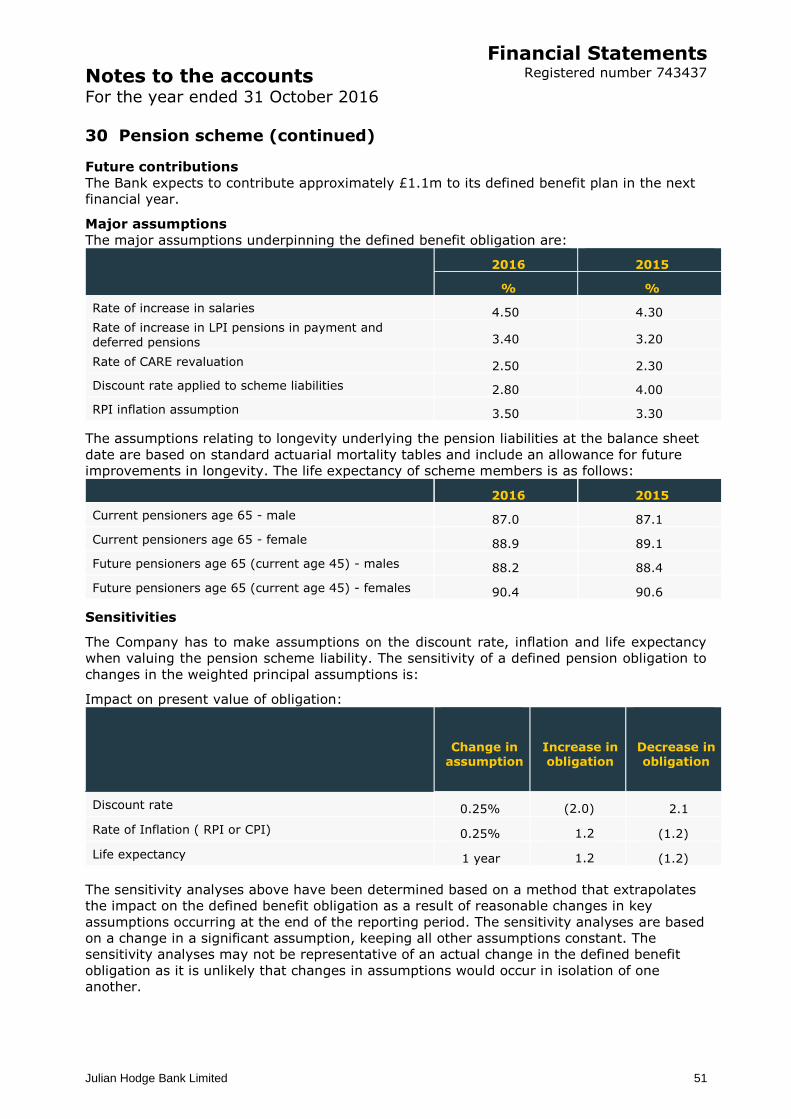
Notes to the accounts For the year ended 31 October 2016
Financial Statements Registered number 743437
Julian Hodge Bank Limited
51
30 Pension scheme (continued)
Future contributions
The Bank expects to contribute approximately £1.1m to its defined benefit plan in the next
financial year.
Major assumptions
The major assumptions underpinning the defined benefit obligation are:
2016 2015
% %
Rate of increase in salaries 4.50 4.30
Rate of increase in LPI pensions in payment and
deferred pensions 3.40 3.20
Rate of CARE revaluation 2.50 2.30
Discount rate applied to scheme liabilities 2.80 4.00
RPI inflation assumption 3.50 3.30
The assumptions relating to longevity underlying the pension liabilities at the balance sheet
date are based on standard actuarial mortality tables and include an allowance for future
improvements in longevity. The life expectancy of scheme members is as follows:
2016 2015
Current pensioners age 65 - male 87.0 87.1
Current pensioners age 65 - female 88.9 89.1
Future pensioners age 65 (current age 45) - males 88.2 88.4
Future pensioners age 65 (current age 45) - females 90.4 90.6
Sensitivities
The Company has to make assumptions on the discount rate, inflation and life expectancy
when valuing the pension scheme liability. The sensitivity of a defined pension obligation to
changes in the weighted principal assumptions is:
Impact on present value of obligation:
Change in assumption
Increase in obligation
Decrease in obligation
Discount rate 0.25% (2.0) 2.1
Rate of Inflation ( RPI or CPI) 0.25% 1.2 (1.2)
Life expectancy 1 year 1.2 (1.2)
The sensitivity analyses above have been determined based on a method that extrapolates
the impact on the defined benefit obligation as a result of reasonable changes in key
assumptions occurring at the end of the reporting period. The sensitivity analyses are based
on a change in a significant assumption, keeping all other assumptions constant. The
sensitivity analyses may not be representative of an actual change in the defined benefit
obligation as it is unlikely that changes in assumptions would occur in isolation of one
another.
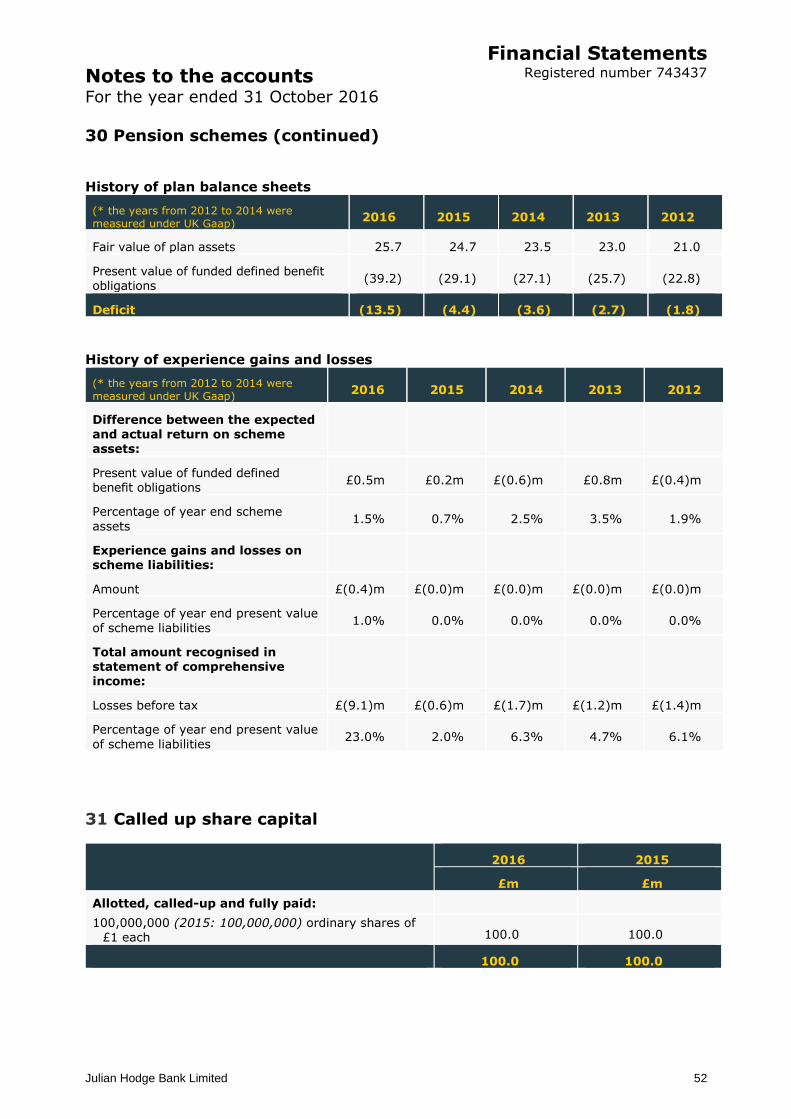
Notes to the accounts For the year ended 31 October 2016
Financial Statements Registered number 743437
Julian Hodge Bank Limited
52
30 Pension schemes (continued)
History of plan balance sheets
(* the years from 2012 to 2014 were measured under UK Gaap)
2016 2015 2014 2013 2012
Fair value of plan assets 25.7 24.7 23.5 23.0 21.0
Present value of funded defined benefit obligations
(39.2) (29.1) (27.1) (25.7) (22.8)
Deficit (13.5) (4.4) (3.6) (2.7) (1.8)
History of experience gains and losses
(* the years from 2012 to 2014 were measured under UK Gaap)
2016 2015 2014 2013 2012
Difference between the expected and actual return on scheme assets:
Present value of funded defined benefit obligations
£0.5m £0.2m £(0.6)m £0.8m £(0.4)m
Percentage of year end scheme
assets 1.5% 0.7% 2.5% 3.5% 1.9%
Experience gains and losses on scheme liabilities:
Amount £(0.4)m £(0.0)m £(0.0)m £(0.0)m £(0.0)m
Percentage of year end present value
of scheme liabilities 1.0% 0.0% 0.0% 0.0% 0.0%
Total amount recognised in statement of comprehensive income:
Losses before tax £(9.1)m £(0.6)m £(1.7)m £(1.2)m £(1.4)m
Percentage of year end present value
of scheme liabilities 23.0% 2.0% 6.3% 4.7% 6.1%
31 Called up share capital
2016 2015
£m £m
Allotted, called-up and fully paid:
100,000,000 (2015: 100,000,000) ordinary shares of £1 each 100.0 100.0
100.0 100.0
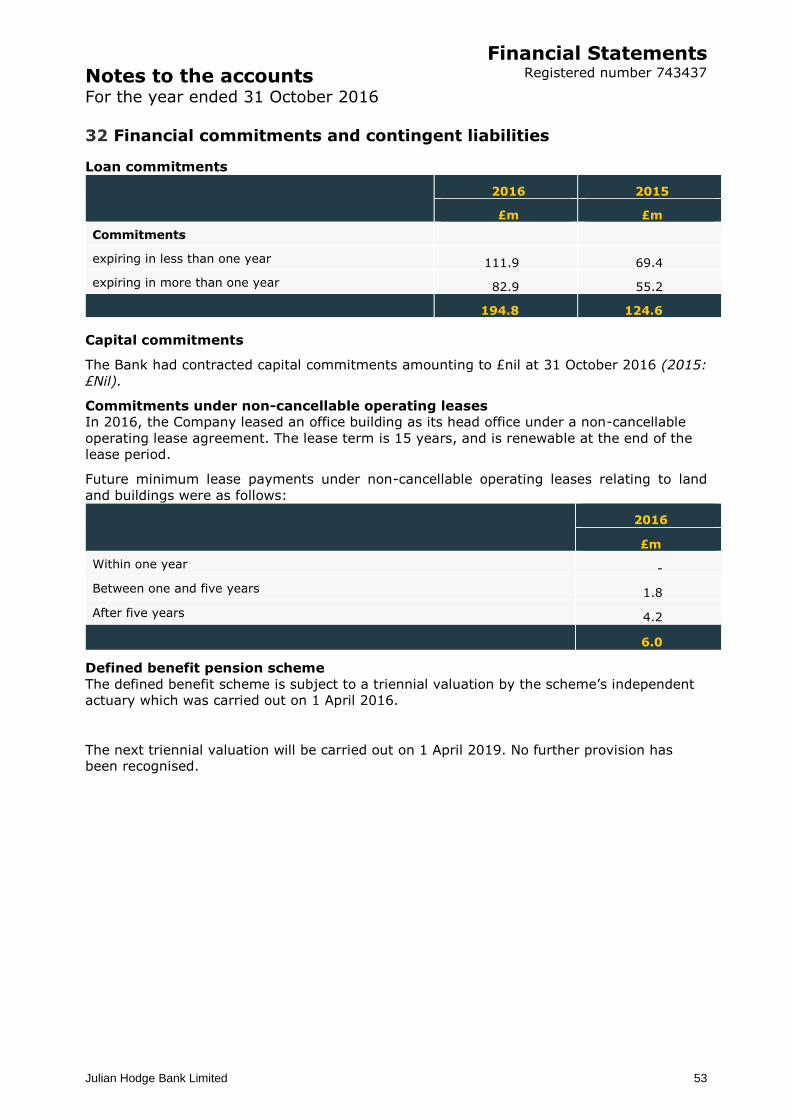
Notes to the accounts For the year ended 31 October 2016
Financial Statements Registered number 743437
Julian Hodge Bank Limited
53
32 Financial commitments and contingent liabilities
Loan commitments
2016 2015
£m £m
Commitments
expiring in less than one year 111.9 69.4
expiring in more than one year 82.9 55.2
194.8 124.6
Capital commitments
The Bank had contracted capital commitments amounting to £nil at 31 October 2016 (2015:
£Nil).
Commitments under non-cancellable operating leases
In 2016, the Company leased an office building as its head office under a non-cancellable
operating lease agreement. The lease term is 15 years, and is renewable at the end of the
lease period.
Future minimum lease payments under non-cancellable operating leases relating to land
and buildings were as follows:
2016
£m
Within one year -
Between one and five years 1.8
After five years 4.2
6.0
Defined benefit pension scheme
The defined benefit scheme is subject to a triennial valuation by the scheme’s independent
actuary which was carried out on 1 April 2016.
The next triennial valuation will be carried out on 1 April 2019. No further provision has
been recognised.
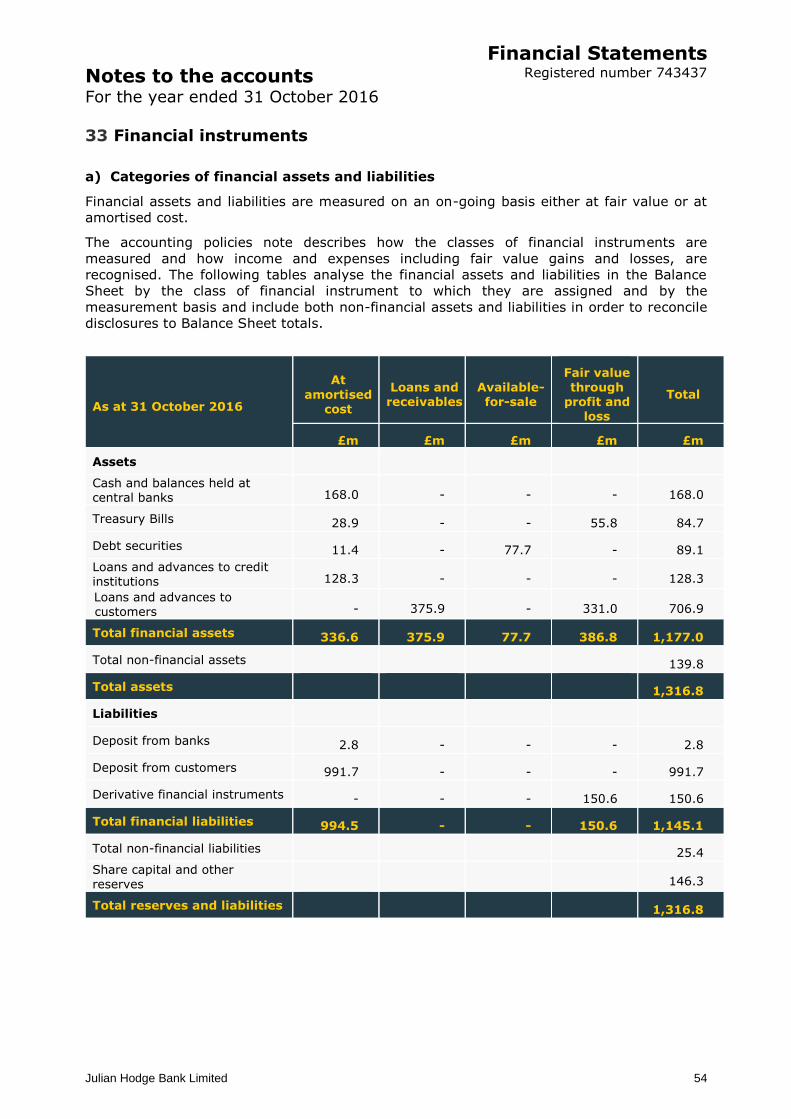
Notes to the accounts For the year ended 31 October 2016
Financial Statements Registered number 743437
Julian Hodge Bank Limited
54
33 Financial instruments
a) Categories of financial assets and liabilities
Financial assets and liabilities are measured on an on-going basis either at fair value or at
amortised cost.
The accounting policies note describes how the classes of financial instruments are
measured and how income and expenses including fair value gains and losses, are
recognised. The following tables analyse the financial assets and liabilities in the Balance
Sheet by the class of financial instrument to which they are assigned and by the
measurement basis and include both non-financial assets and liabilities in order to reconcile
disclosures to Balance Sheet totals.
As at 31 October 2016
At
amortised cost
Loans and receivables
Available-for-sale
Fair value through
profit and loss
Total
£m £m £m £m £m
Assets
Cash and balances held at central banks 168.0 - - - 168.0
Treasury Bills 28.9 - - 55.8 84.7
Debt securities 11.4 - 77.7 - 89.1
Loans and advances to credit institutions 128.3 - - - 128.3
Loans and advances to customers - 375.9 - 331.0 706.9
Total financial assets 336.6 375.9 77.7 386.8 1,177.0
Total non-financial assets 139.8
Total assets 1,316.8
Liabilities
Deposit from banks 2.8 - - - 2.8
Deposit from customers 991.7 - - - 991.7
Derivative financial instruments - - - 150.6 150.6
Total financial liabilities 994.5 - - 150.6 1,145.1
Total non-financial liabilities 25.4
Share capital and other reserves 146.3
Total reserves and liabilities 1,316.8
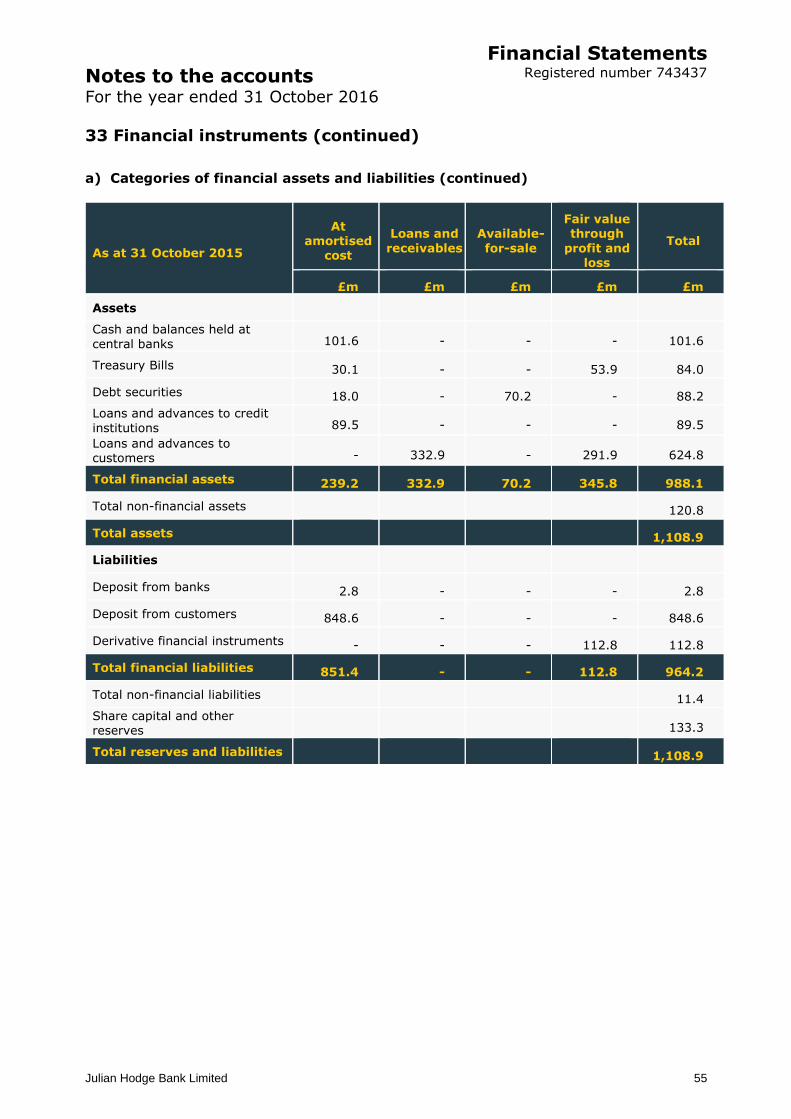
Notes to the accounts For the year ended 31 October 2016
Financial Statements Registered number 743437
Julian Hodge Bank Limited
55
33 Financial instruments (continued)
a) Categories of financial assets and liabilities (continued)
As at 31 October 2015
At amortised
cost
Loans and
receivables
Available-
for-sale
Fair value through
profit and loss
Total
£m £m £m £m £m
Assets
Cash and balances held at
central banks 101.6 - - - 101.6
Treasury Bills 30.1 - - 53.9 84.0
Debt securities 18.0 - 70.2 - 88.2
Loans and advances to credit
institutions 89.5 - - - 89.5
Loans and advances to customers - 332.9 - 291.9 624.8
Total financial assets 239.2 332.9 70.2 345.8 988.1
Total non-financial assets 120.8
Total assets 1,108.9
Liabilities
Deposit from banks 2.8 - - - 2.8
Deposit from customers 848.6 - - - 848.6
Derivative financial instruments - - - 112.8 112.8
Total financial liabilities 851.4 - - 112.8 964.2
Total non-financial liabilities 11.4
Share capital and other reserves 133.3
Total reserves and liabilities 1,108.9
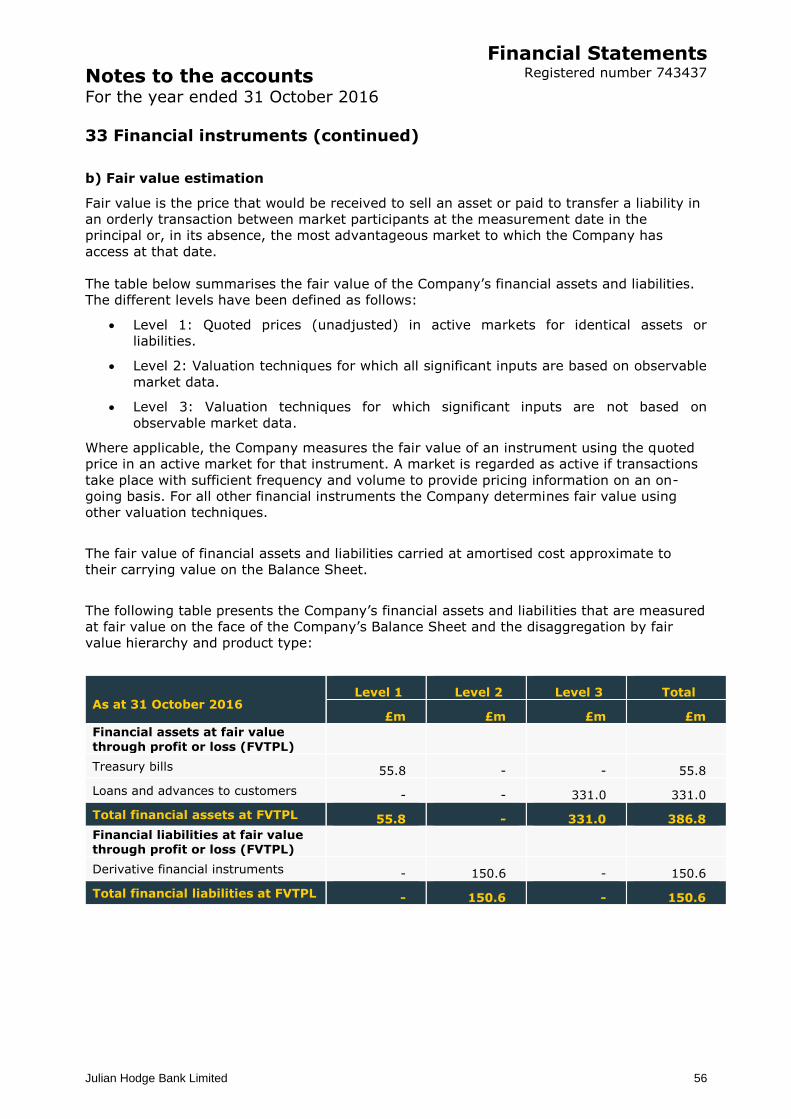
Notes to the accounts For the year ended 31 October 2016
Financial Statements Registered number 743437
Julian Hodge Bank Limited
56
33 Financial instruments (continued)
b) Fair value estimation
Fair value is the price that would be received to sell an asset or paid to transfer a liability in
an orderly transaction between market participants at the measurement date in the
principal or, in its absence, the most advantageous market to which the Company has
access at that date.
The table below summarises the fair value of the Company’s financial assets and liabilities.
The different levels have been defined as follows:
Level 1: Quoted prices (unadjusted) in active markets for identical assets or
liabilities.
Level 2: Valuation techniques for which all significant inputs are based on observable
market data.
Level 3: Valuation techniques for which significant inputs are not based on
observable market data.
Where applicable, the Company measures the fair value of an instrument using the quoted
price in an active market for that instrument. A market is regarded as active if transactions
take place with sufficient frequency and volume to provide pricing information on an on-
going basis. For all other financial instruments the Company determines fair value using
other valuation techniques.
The fair value of financial assets and liabilities carried at amortised cost approximate to
their carrying value on the Balance Sheet.
The following table presents the Company’s financial assets and liabilities that are measured
at fair value on the face of the Company’s Balance Sheet and the disaggregation by fair
value hierarchy and product type:
As at 31 October 2016 Level 1 Level 2 Level 3 Total
£m £m £m £m
Financial assets at fair value
through profit or loss (FVTPL)
Treasury bills 55.8 - - 55.8
Loans and advances to customers - - 331.0 331.0
Total financial assets at FVTPL 55.8 - 331.0 386.8
Financial liabilities at fair value through profit or loss (FVTPL)
Derivative financial instruments - 150.6 - 150.6
Total financial liabilities at FVTPL - 150.6 - 150.6
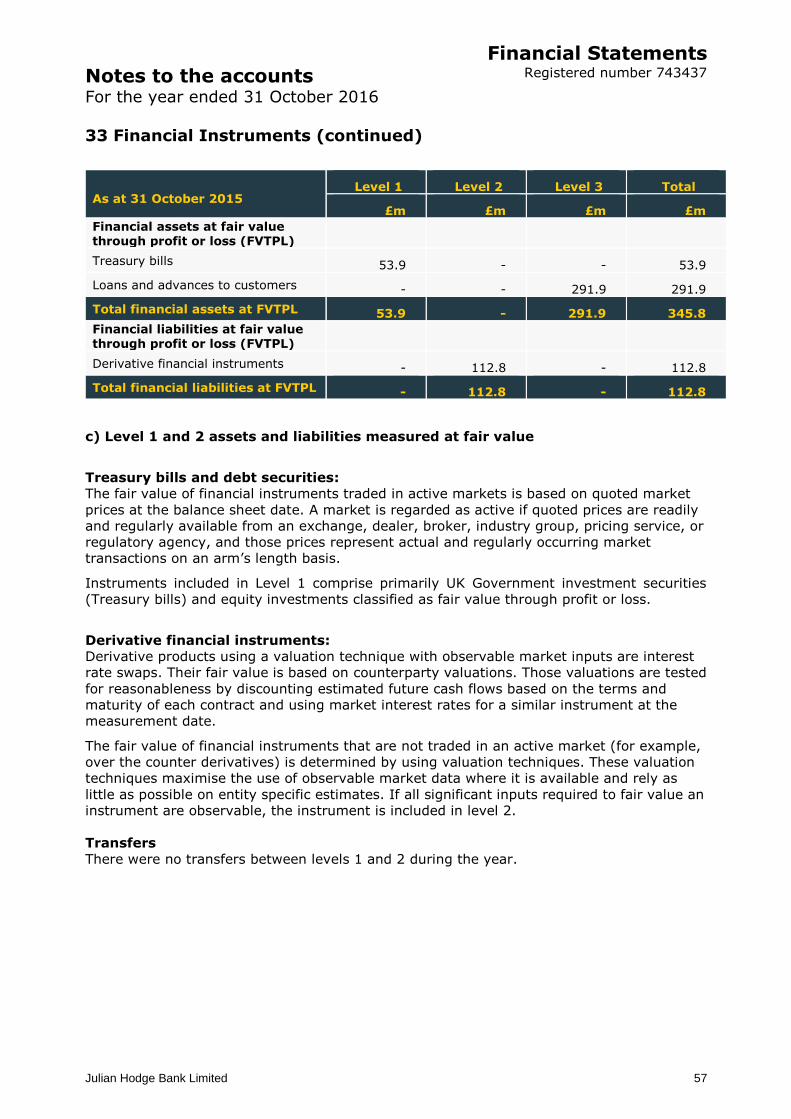
Notes to the accounts For the year ended 31 October 2016
Financial Statements Registered number 743437
Julian Hodge Bank Limited
57
33 Financial Instruments (continued)
As at 31 October 2015 Level 1 Level 2 Level 3 Total
£m £m £m £m
Financial assets at fair value through profit or loss (FVTPL)
Treasury bills 53.9 - - 53.9
Loans and advances to customers - - 291.9 291.9
Total financial assets at FVTPL 53.9 - 291.9 345.8
Financial liabilities at fair value through profit or loss (FVTPL)
Derivative financial instruments - 112.8 - 112.8
Total financial liabilities at FVTPL - 112.8 - 112.8
c) Level 1 and 2 assets and liabilities measured at fair value
Treasury bills and debt securities:
The fair value of financial instruments traded in active markets is based on quoted market
prices at the balance sheet date. A market is regarded as active if quoted prices are readily
and regularly available from an exchange, dealer, broker, industry group, pricing service, or
regulatory agency, and those prices represent actual and regularly occurring market
transactions on an arm’s length basis.
Instruments included in Level 1 comprise primarily UK Government investment securities
(Treasury bills) and equity investments classified as fair value through profit or loss.
Derivative financial instruments:
Derivative products using a valuation technique with observable market inputs are interest
rate swaps. Their fair value is based on counterparty valuations. Those valuations are tested
for reasonableness by discounting estimated future cash flows based on the terms and
maturity of each contract and using market interest rates for a similar instrument at the
measurement date.
The fair value of financial instruments that are not traded in an active market (for example,
over the counter derivatives) is determined by using valuation techniques. These valuation
techniques maximise the use of observable market data where it is available and rely as
little as possible on entity specific estimates. If all significant inputs required to fair value an
instrument are observable, the instrument is included in level 2.
Transfers
There were no transfers between levels 1 and 2 during the year.
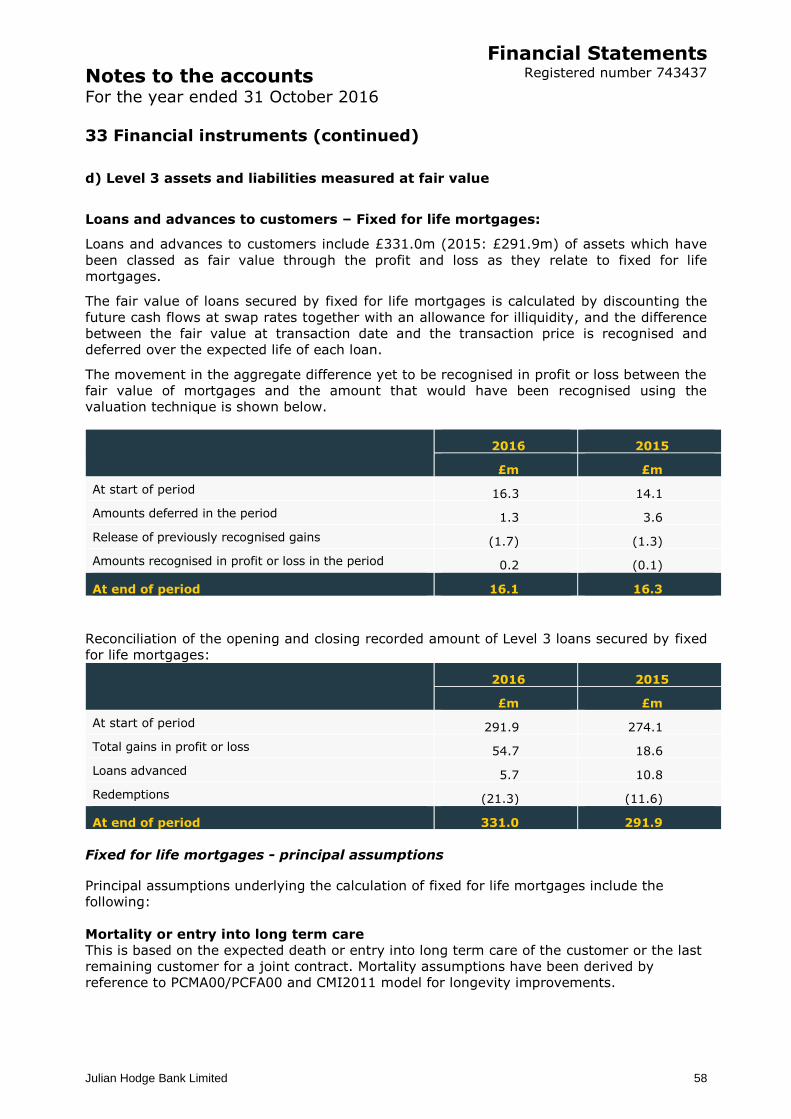
Notes to the accounts For the year ended 31 October 2016
Financial Statements Registered number 743437
Julian Hodge Bank Limited
58
33 Financial instruments (continued)
d) Level 3 assets and liabilities measured at fair value
Loans and advances to customers – Fixed for life mortgages:
Loans and advances to customers include £331.0m (2015: £291.9m) of assets which have
been classed as fair value through the profit and loss as they relate to fixed for life
mortgages.
The fair value of loans secured by fixed for life mortgages is calculated by discounting the
future cash flows at swap rates together with an allowance for illiquidity, and the difference
between the fair value at transaction date and the transaction price is recognised and
deferred over the expected life of each loan.
The movement in the aggregate difference yet to be recognised in profit or loss between the
fair value of mortgages and the amount that would have been recognised using the
valuation technique is shown below.
2016 2015
£m £m
At start of period 16.3 14.1
Amounts deferred in the period 1.3 3.6
Release of previously recognised gains (1.7) (1.3)
Amounts recognised in profit or loss in the period 0.2 (0.1)
At end of period 16.1 16.3
Reconciliation of the opening and closing recorded amount of Level 3 loans secured by fixed
for life mortgages:
2016 2015
£m £m
At start of period 291.9 274.1
Total gains in profit or loss 54.7 18.6
Loans advanced 5.7 10.8
Redemptions (21.3) (11.6)
At end of period 331.0 291.9
Fixed for life mortgages - principal assumptions
Principal assumptions underlying the calculation of fixed for life mortgages include the
following:
Mortality or entry into long term care
This is based on the expected death or entry into long term care of the customer or the last
remaining customer for a joint contract. Mortality assumptions have been derived by
reference to PCMA00/PCFA00 and CMI2011 model for longevity improvements.
Notes to the accounts For the year ended 31 October 2016
Financial Statements Registered number 743437
Julian Hodge Bank Limited
59
33 Financial instruments (continued)
Lapses
Due to limited market information, these assumptions have been derived from the
Company’s own experience on this product.
Expenses
Assumptions for future policy expense levels are based on the Company’s recent expense
analyses. Expenses are modelled as an amount per policy per annum that incorporates an
annual inflation rate allowance of 4.30% (2015: 3.88%).
Discount rate The discount rate applied to the mortgage cash flows comprises two parts: a risk free yield
curve and an allowance for illiquidity. The risk free yield curve is based on the GBP curve
published by EIOPA.
The average discount rate for the portfolio (assumed to be the 15 year point on the yield
curve based on average duration at 31 October 2016) was 2.24% (31 October 2015:
3.12%).
No-negative equity guarantee
The fair value of loans secured by mortgages takes into account an explicit provision in
respect of the no-negative equity guarantee which is calculated using a variant of the Black
Scholes option pricing model. The key assumptions used to derive the value of the no-
negative equity guarantee include property growth, volatility and credit risk. Property price
is based on the last survey valuation adjusted by Nationwide Monthly HPI with an annual
underperformance assumption. The future property price is based on Future HPI with an
annual underperformance assumption.
The property growth and volatility assumed at 31 October 2016 were 3.28% (31 October
2015: 2.17%) and 11% (31 October 2015: 11%) respectively. The value of the no-negative
equity guarantee as at 31 October 2016 was £15.4m (31 October 2015: £27.8m).
The valuation technique that the Company uses to assess the value of the loans secured by
mortgages will generally give a higher value than the price of the initial transaction. Any
differences will be deferred over the expected life of the contract by setting up a deferred
reserve within loan balances. Any Day 1 profit on valuation is not recognised immediately in
the Income Statement and is deferred over the life of the related mortgages. At 31 October
2016 the amount deferred was £16.1m. (2015: £16.3m).
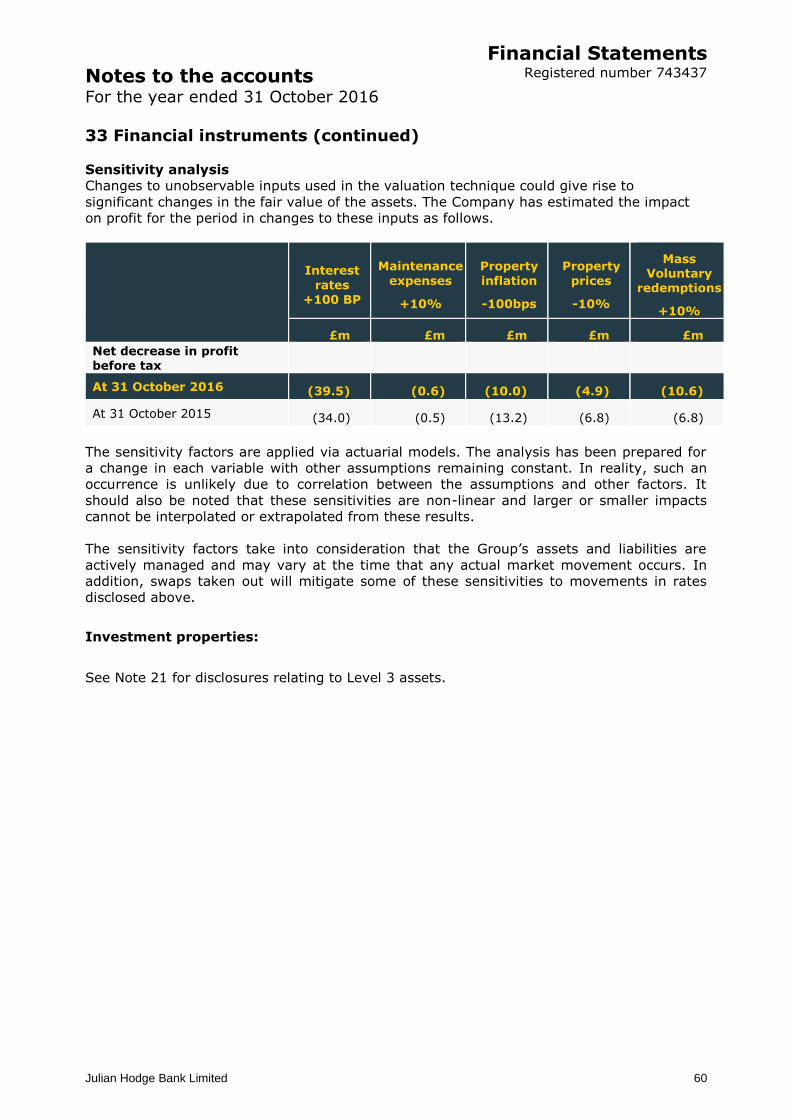
Notes to the accounts For the year ended 31 October 2016
Financial Statements Registered number 743437
Julian Hodge Bank Limited
60
33 Financial instruments (continued)
Sensitivity analysis
Changes to unobservable inputs used in the valuation technique could give rise to
significant changes in the fair value of the assets. The Company has estimated the impact
on profit for the period in changes to these inputs as follows.
Interest
rates +100 BP
Maintenance
expenses
+10%
Property
inflation
-100bps
Property
prices
-10%
Mass Voluntary
redemptions
+10%
£m £m £m £m £m
Net decrease in profit before tax
At 31 October 2016 (39.5) (0.6) (10.0) (4.9) (10.6)
At 31 October 2015 (34.0) (0.5) (13.2) (6.8) (6.8)
The sensitivity factors are applied via actuarial models. The analysis has been prepared for
a change in each variable with other assumptions remaining constant. In reality, such an
occurrence is unlikely due to correlation between the assumptions and other factors. It
should also be noted that these sensitivities are non-linear and larger or smaller impacts
cannot be interpolated or extrapolated from these results.
The sensitivity factors take into consideration that the Group’s assets and liabilities are
actively managed and may vary at the time that any actual market movement occurs. In
addition, swaps taken out will mitigate some of these sensitivities to movements in rates
disclosed above.
Investment properties:
See Note 21 for disclosures relating to Level 3 assets.
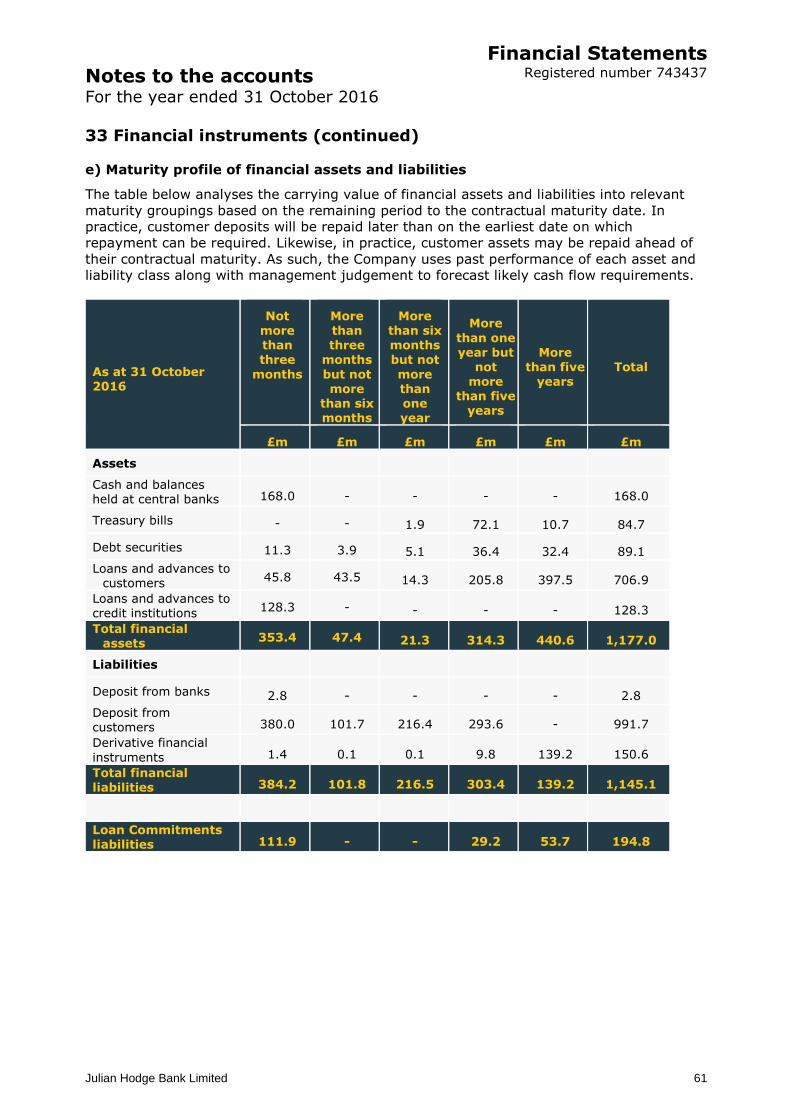
Notes to the accounts For the year ended 31 October 2016
Financial Statements Registered number 743437
Julian Hodge Bank Limited
61
33 Financial instruments (continued)
e) Maturity profile of financial assets and liabilities
The table below analyses the carrying value of financial assets and liabilities into relevant
maturity groupings based on the remaining period to the contractual maturity date. In
practice, customer deposits will be repaid later than on the earliest date on which
repayment can be required. Likewise, in practice, customer assets may be repaid ahead of
their contractual maturity. As such, the Company uses past performance of each asset and
liability class along with management judgement to forecast likely cash flow requirements.
As at 31 October 2016
Not more than
three
months
More than three
months
but not more
than six months
More than six months
but not
more than one year
More
than one
year but not
more than five
years
More than five
years Total
£m £m £m £m £m £m
Assets
Cash and balances held at central banks 168.0 - - - - 168.0
Treasury bills - - 1.9 72.1 10.7 84.7
Debt securities 11.3 3.9 5.1 36.4 32.4 89.1
Loans and advances to customers
45.8 43.5 14.3 205.8 397.5 706.9
Loans and advances to credit institutions
128.3 - - - - 128.3
Total financial assets
353.4 47.4 21.3 314.3 440.6 1,177.0
Liabilities
Deposit from banks 2.8 - - - - 2.8
Deposit from customers 380.0 101.7 216.4 293.6 - 991.7
Derivative financial
instruments 1.4 0.1 0.1 9.8 139.2 150.6
Total financial liabilities 384.2 101.8 216.5 303.4 139.2 1,145.1
Loan Commitments liabilities 111.9 - - 29.2 53.7 194.8
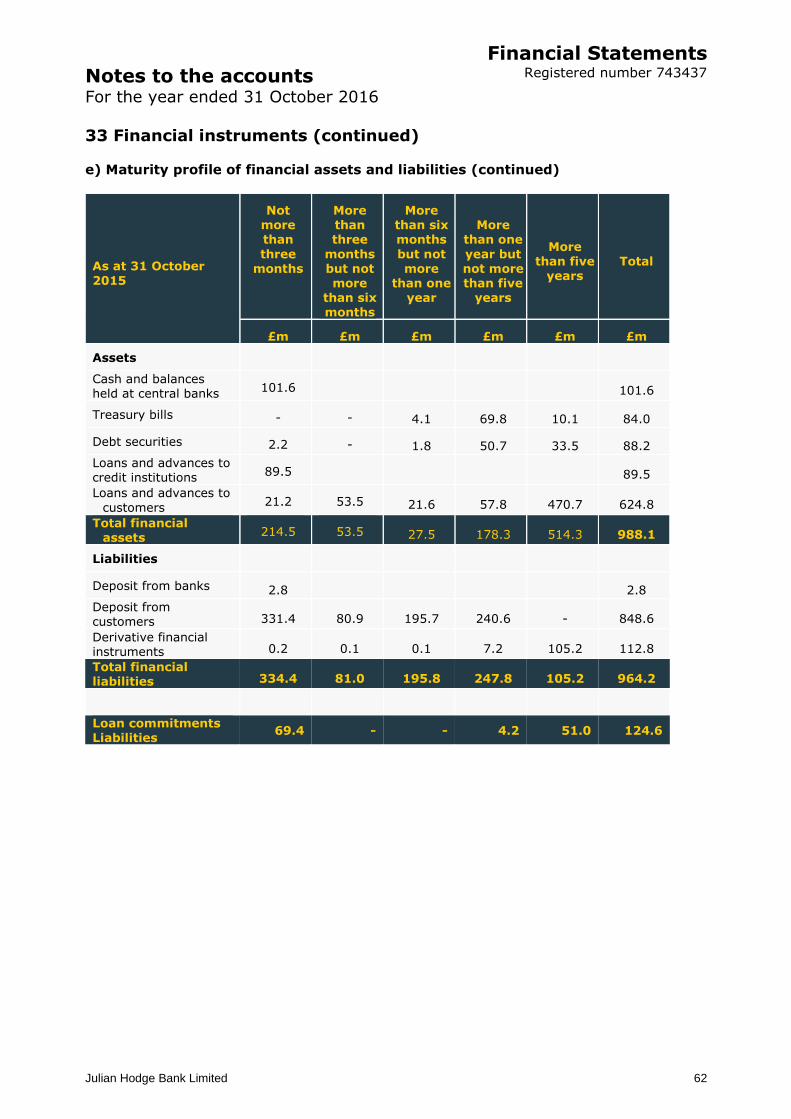
Notes to the accounts For the year ended 31 October 2016
Financial Statements Registered number 743437
Julian Hodge Bank Limited
62
33 Financial instruments (continued)
e) Maturity profile of financial assets and liabilities (continued)
As at 31 October 2015
Not more than
three months
More than three
months but not more
than six months
More than six months
but not more
than one year
More than one
year but not more than five
years
More than five
years Total
£m £m £m £m £m £m
Assets
Cash and balances held at central banks
101.6 101.6
Treasury bills - - 4.1 69.8 10.1 84.0
Debt securities 2.2 - 1.8 50.7 33.5 88.2
Loans and advances to credit institutions
89.5 89.5
Loans and advances to
customers 21.2 53.5 21.6 57.8 470.7 624.8
Total financial assets
214.5 53.5 27.5 178.3 514.3 988.1
Liabilities
Deposit from banks 2.8 2.8
Deposit from customers 331.4 80.9 195.7 240.6 - 848.6
Derivative financial instruments 0.2 0.1 0.1 7.2 105.2 112.8
Total financial liabilities 334.4 81.0 195.8 247.8 105.2 964.2
Loan commitments Liabilities
69.4 - - 4.2 51.0 124.6
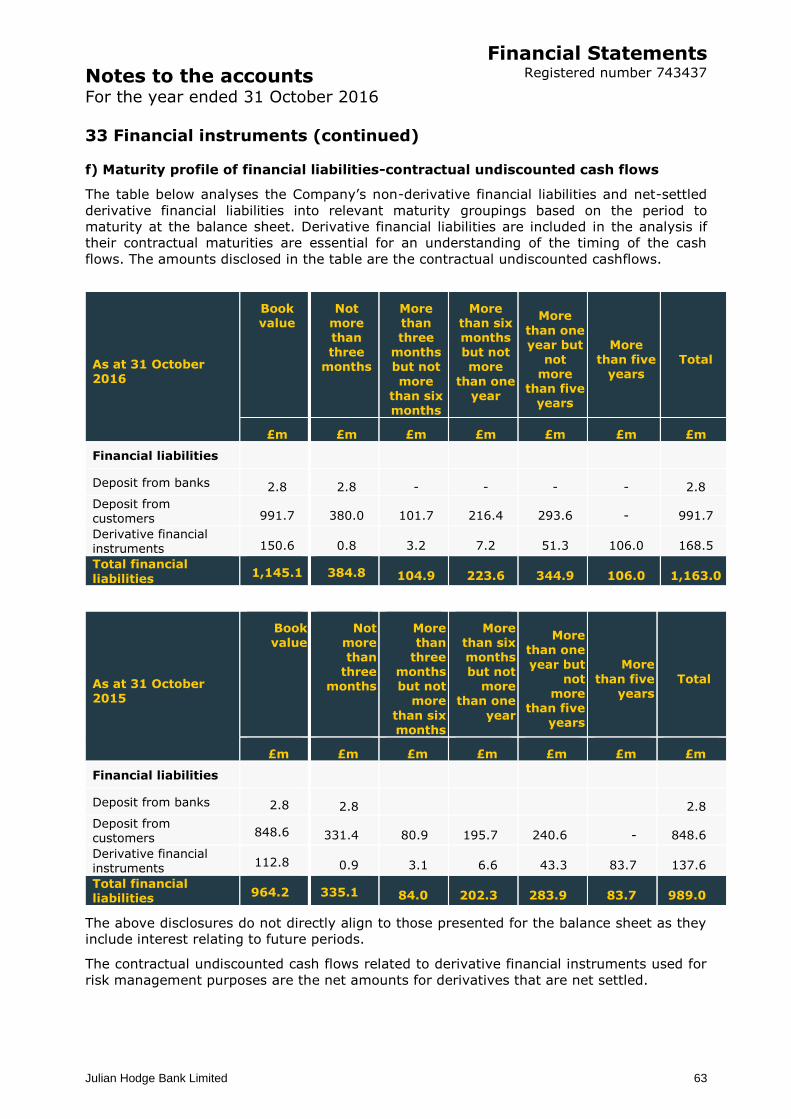
Notes to the accounts For the year ended 31 October 2016
Financial Statements Registered number 743437
Julian Hodge Bank Limited
63
33 Financial instruments (continued)
f) Maturity profile of financial liabilities-contractual undiscounted cash flows
The table below analyses the Company’s non-derivative financial liabilities and net-settled
derivative financial liabilities into relevant maturity groupings based on the period to
maturity at the balance sheet. Derivative financial liabilities are included in the analysis if
their contractual maturities are essential for an understanding of the timing of the cash
flows. The amounts disclosed in the table are the contractual undiscounted cashflows.
As at 31 October 2016
Book value
Not more than
three months
More than three
months but not
more than six months
More than six months
but not more
than one year
More
than one year but
not more
than five years
More
than five years
Total
£m £m £m £m £m £m £m
Financial liabilities
Deposit from banks 2.8 2.8 - - - - 2.8
Deposit from customers 991.7 380.0 101.7 216.4 293.6 - 991.7
Derivative financial instruments 150.6 0.8 3.2 7.2 51.3 106.0 168.5
Total financial
liabilities 1,145.1 384.8 104.9 223.6 344.9 106.0 1,163.0
As at 31 October 2015
Book value
Not more than
three months
More than
three months but not
more
than six months
More than six months but not
more than one
year
More than one
year but not
more than five
years
More
than five years
Total
£m £m £m £m £m £m £m
Financial liabilities
Deposit from banks 2.8 2.8 2.8
Deposit from customers
848.6 331.4 80.9 195.7 240.6 - 848.6
Derivative financial instruments
112.8 0.9 3.1 6.6 43.3 83.7 137.6
Total financial liabilities
964.2 335.1 84.0 202.3 283.9 83.7 989.0
The above disclosures do not directly align to those presented for the balance sheet as they
include interest relating to future periods.
The contractual undiscounted cash flows related to derivative financial instruments used for
risk management purposes are the net amounts for derivatives that are net settled.
Notes to the accounts For the year ended 31 October 2016
Financial Statements Registered number 743437
Julian Hodge Bank Limited
64
33 Financial instruments (continued)
g) Foreign currencies
The Group holds no financial assets or liabilities denominated in foreign currencies.
34 Financial risk management objectives and policies
Risk management
The risk management approach encompasses the requirements for identifying, assessing,
managing, monitoring and reporting on risk.
The evaluation of the various risks and the setting of policy is carried out through the
Bank’s executive risk committee and reports to the risk and conduct committee, which
ensures adherence to the Company’s risk management policy and framework.
Risk management objectives
Risk is inherent in all aspects of the Company’s business. Within the Bank, a risk
management framework is in place to ensure that all material risks faced by the Bank have
been identified and measured, and that appropriate controls are in place to ensure that
each risk is mitigated to an acceptable degree.
In the normal course of its business, the Company is exposed to credit risk, liquidity risk,
house price risk, interest rate risk, conduct risk and operational risk. These are discussed in
more detail in sections a) to f) below.
(a) Credit risk
Credit risk is the risk that borrowers or a counterparty will be unable or unwilling to meet a
commitment that they have entered into with the Bank.
The maximum credit risk as at 31 October is the carrying value recognised on the Balance
Sheet as disclosed in the table in note 33(a), along with the loan commitments as disclosed
in the table in note 33(e).
There were no past due, or impaired, or past due but not impaired balances in respect of all
financial asset classes except for Commercial loans which is disclosed below.
Credit risk within the commercial lending portfolio is defined as a borrower’s inability to
repay or service their debt obligations. The primary drivers of credit risk in the Bank’s case
are property price risk and tenant risk.
The primary driver of credit risk within roll-up mortgages and reversionary interests in
property is a fall in house prices, which would cause credit losses should house prices fall
sufficiently in real terms at the date of redemption.
The primary driver of credit risk within the treasury assets portfolio, which comprises
deposits with other banks, gilts and debt securities is counterparty default, meaning it can
no longer repay its obligations. Only instruments used by counterparties with a minimum
rating of BBB- at the point of purchase are issued. The Company intends to hold its
treasury assets to maturity and is therefore not directly affected by market risk.
For both commercial lending and residential mortgages, the Bank takes security in the form
of a legal charge over the property against which loans are advanced. The Bank’s low risk
approach to new business lending is reflected in the loan to value profile of the commercial
property and residential property books.
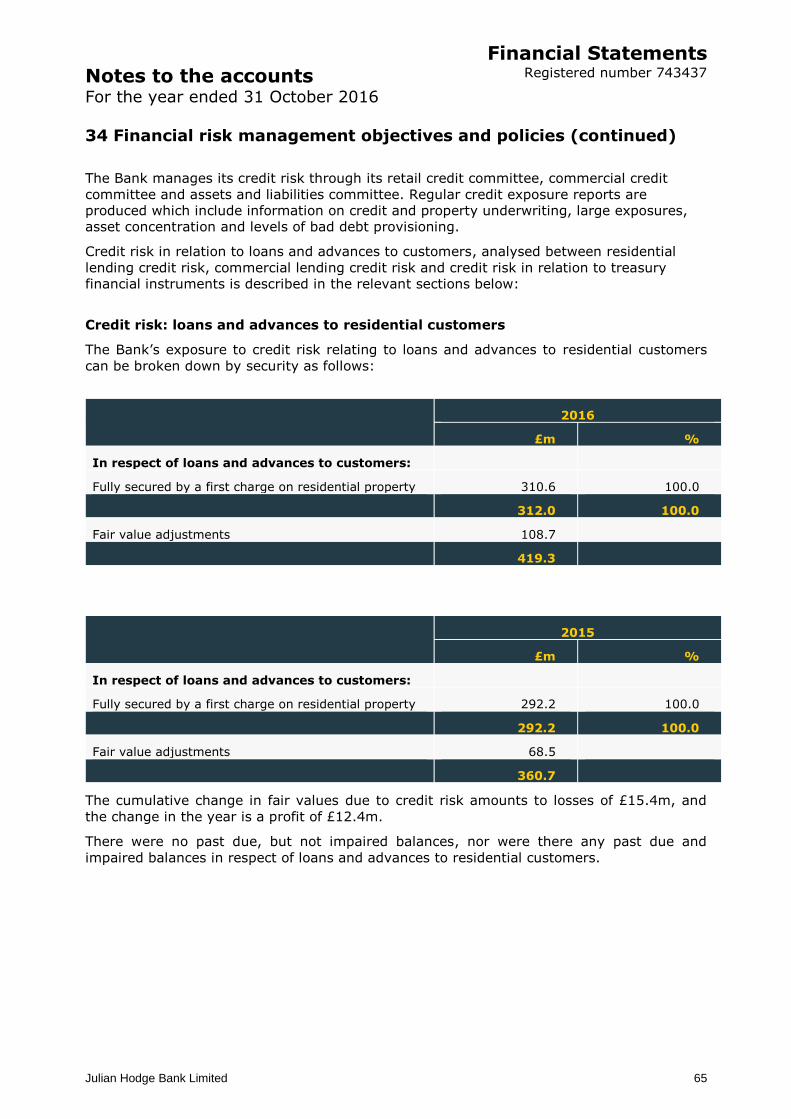
Notes to the accounts For the year ended 31 October 2016
Financial Statements Registered number 743437
Julian Hodge Bank Limited
65
34 Financial risk management objectives and policies (continued)
The Bank manages its credit risk through its retail credit committee, commercial credit
committee and assets and liabilities committee. Regular credit exposure reports are
produced which include information on credit and property underwriting, large exposures,
asset concentration and levels of bad debt provisioning.
Credit risk in relation to loans and advances to customers, analysed between residential
lending credit risk, commercial lending credit risk and credit risk in relation to treasury
financial instruments is described in the relevant sections below:
Credit risk: loans and advances to residential customers
The Bank’s exposure to credit risk relating to loans and advances to residential customers
can be broken down by security as follows:
2016
£m %
In respect of loans and advances to customers:
Fully secured by a first charge on residential property 310.6 100.0
312.0 100.0
Fair value adjustments 108.7
419.3
2015
£m %
In respect of loans and advances to customers:
Fully secured by a first charge on residential property 292.2 100.0
292.2 100.0
Fair value adjustments 68.5
360.7
The cumulative change in fair values due to credit risk amounts to losses of £15.4m, and
the change in the year is a profit of £12.4m.
There were no past due, but not impaired balances, nor were there any past due and
impaired balances in respect of loans and advances to residential customers.
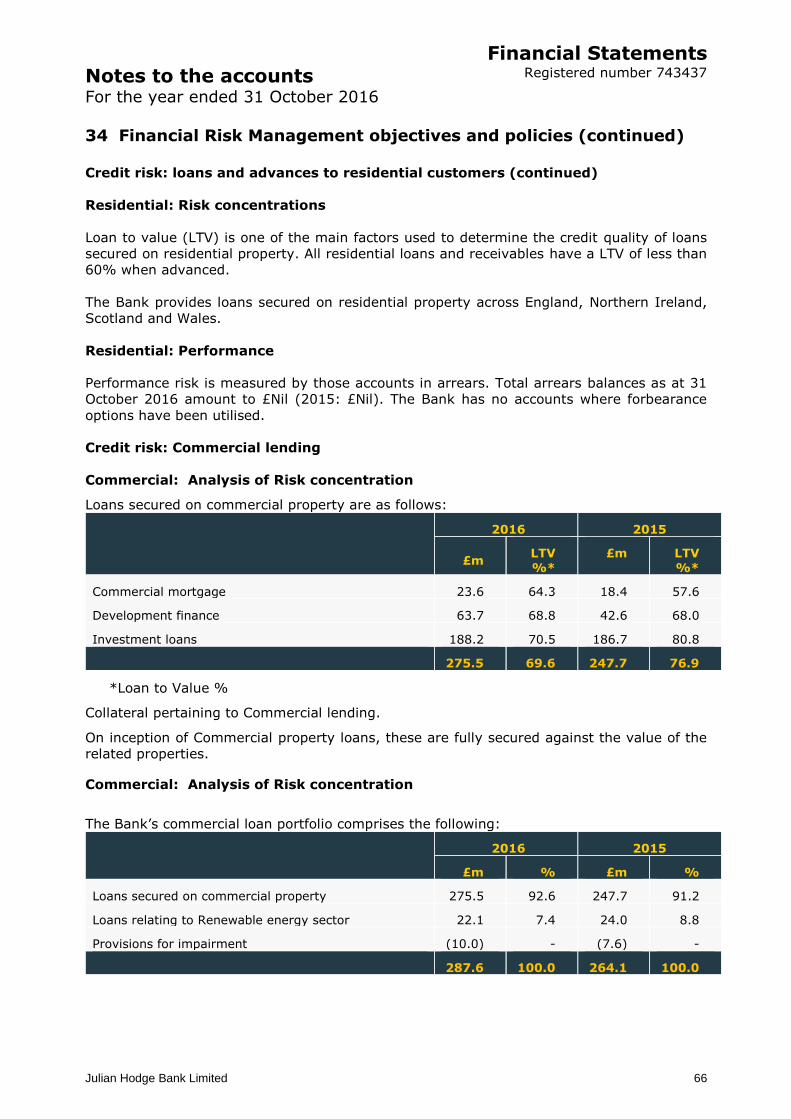
Notes to the accounts For the year ended 31 October 2016
Financial Statements Registered number 743437
Julian Hodge Bank Limited
66
34 Financial Risk Management objectives and policies (continued)
Credit risk: loans and advances to residential customers (continued)
Residential: Risk concentrations
Loan to value (LTV) is one of the main factors used to determine the credit quality of loans
secured on residential property. All residential loans and receivables have a LTV of less than
60% when advanced.
The Bank provides loans secured on residential property across England, Northern Ireland,
Scotland and Wales.
Residential: Performance
Performance risk is measured by those accounts in arrears. Total arrears balances as at 31
October 2016 amount to £Nil (2015: £Nil). The Bank has no accounts where forbearance
options have been utilised.
Credit risk: Commercial lending
Commercial: Analysis of Risk concentration
Loans secured on commercial property are as follows:
2016 2015
£m LTV %*
£m LTV %*
Commercial mortgage 23.6 64.3 18.4 57.6
Development finance 63.7 68.8 42.6 68.0
Investment loans 188.2 70.5 186.7 80.8
275.5 69.6 247.7 76.9
*Loan to Value %
Collateral pertaining to Commercial lending.
On inception of Commercial property loans, these are fully secured against the value of the
related properties.
Commercial: Analysis of Risk concentration
The Bank’s commercial loan portfolio comprises the following:
2016 2015
£m % £m %
Loans secured on commercial property 275.5 92.6 247.7 91.2
Loans relating to Renewable energy sector 22.1 7.4 24.0 8.8
Provisions for impairment (10.0) - (7.6) -
287.6 100.0 264.1 100.0
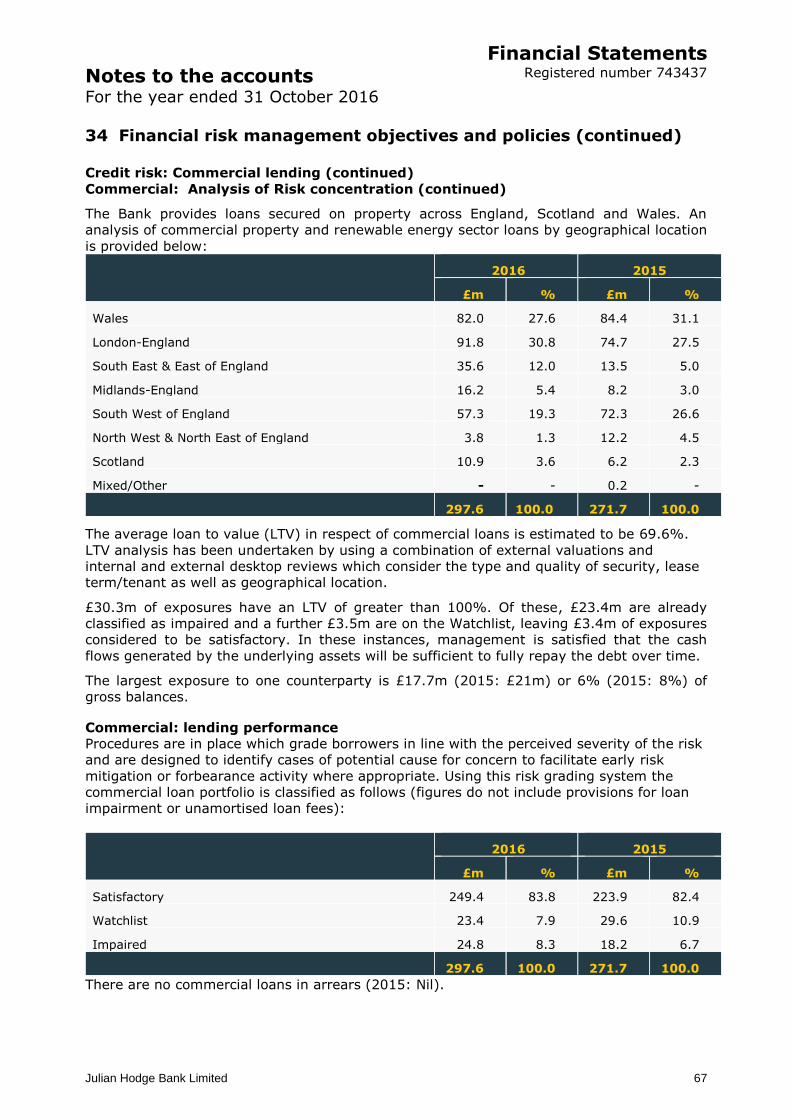
Notes to the accounts For the year ended 31 October 2016
Financial Statements Registered number 743437
Julian Hodge Bank Limited
67
34 Financial risk management objectives and policies (continued)
Credit risk: Commercial lending (continued)
Commercial: Analysis of Risk concentration (continued)
The Bank provides loans secured on property across England, Scotland and Wales. An
analysis of commercial property and renewable energy sector loans by geographical location
is provided below:
2016 2015
£m % £m %
Wales 82.0 27.6 84.4 31.1
London-England 91.8 30.8 74.7 27.5
South East & East of England 35.6 12.0 13.5 5.0
Midlands-England 16.2 5.4 8.2 3.0
South West of England 57.3 19.3 72.3 26.6
North West & North East of England 3.8 1.3 12.2 4.5
Scotland 10.9 3.6 6.2 2.3
Mixed/Other - - 0.2 -
297.6 100.0 271.7 100.0
The average loan to value (LTV) in respect of commercial loans is estimated to be 69.6%.
LTV analysis has been undertaken by using a combination of external valuations and
internal and external desktop reviews which consider the type and quality of security, lease
term/tenant as well as geographical location.
£30.3m of exposures have an LTV of greater than 100%. Of these, £23.4m are already
classified as impaired and a further £3.5m are on the Watchlist, leaving £3.4m of exposures
considered to be satisfactory. In these instances, management is satisfied that the cash
flows generated by the underlying assets will be sufficient to fully repay the debt over time.
The largest exposure to one counterparty is £17.7m (2015: £21m) or 6% (2015: 8%) of
gross balances.
Commercial: lending performance
Procedures are in place which grade borrowers in line with the perceived severity of the risk
and are designed to identify cases of potential cause for concern to facilitate early risk
mitigation or forbearance activity where appropriate. Using this risk grading system the
commercial loan portfolio is classified as follows (figures do not include provisions for loan
impairment or unamortised loan fees):
2016 2015
£m % £m %
Satisfactory 249.4 83.8 223.9 82.4
Watchlist 23.4 7.9 29.6 10.9
Impaired 24.8 8.3 18.2 6.7
297.6 100.0 271.7 100.0
There are no commercial loans in arrears (2015: Nil).
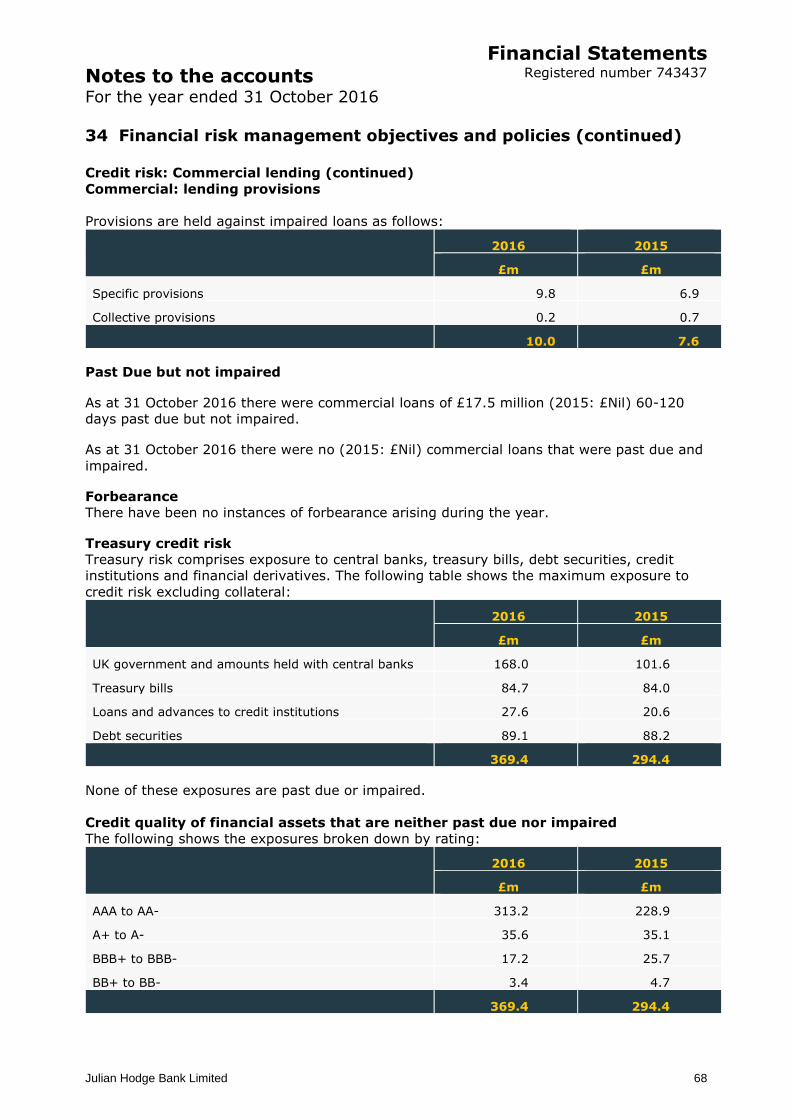
Notes to the accounts For the year ended 31 October 2016
Financial Statements Registered number 743437
Julian Hodge Bank Limited
68
34 Financial risk management objectives and policies (continued)
Credit risk: Commercial lending (continued)
Commercial: lending provisions
Provisions are held against impaired loans as follows:
2016 2015
£m £m
Specific provisions 9.8 6.9
Collective provisions 0.2 0.7
10.0 7.6
Past Due but not impaired
As at 31 October 2016 there were commercial loans of £17.5 million (2015: £Nil) 60-120
days past due but not impaired.
As at 31 October 2016 there were no (2015: £Nil) commercial loans that were past due and
impaired.
Forbearance
There have been no instances of forbearance arising during the year.
Treasury credit risk
Treasury risk comprises exposure to central banks, treasury bills, debt securities, credit
institutions and financial derivatives. The following table shows the maximum exposure to
credit risk excluding collateral:
2016 2015
£m £m
UK government and amounts held with central banks 168.0 101.6
Treasury bills 84.7 84.0
Loans and advances to credit institutions 27.6 20.6
Debt securities 89.1 88.2
369.4 294.4
None of these exposures are past due or impaired.
Credit quality of financial assets that are neither past due nor impaired
The following shows the exposures broken down by rating:
2016 2015
£m £m
AAA to AA- 313.2 228.9
A+ to A- 35.6 35.1
BBB+ to BBB- 17.2 25.7
BB+ to BB- 3.4 4.7
369.4 294.4
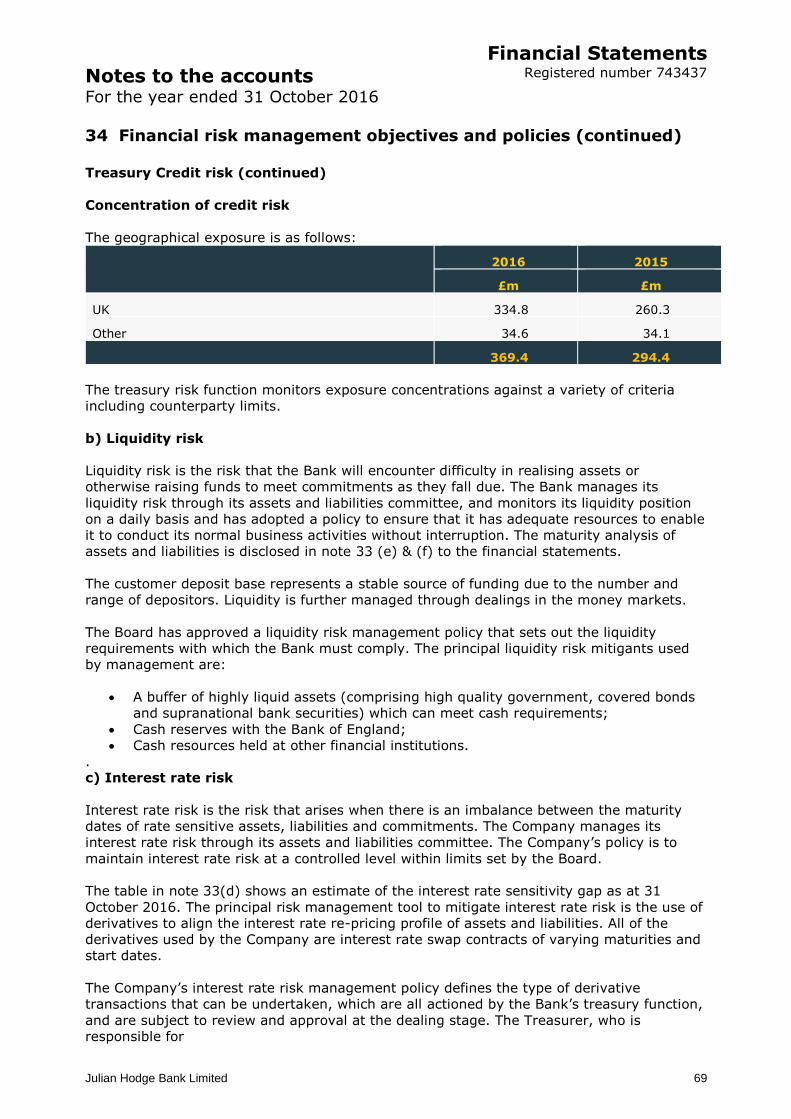
Notes to the accounts For the year ended 31 October 2016
Financial Statements Registered number 743437
Julian Hodge Bank Limited
69
34 Financial risk management objectives and policies (continued)
Treasury Credit risk (continued)
Concentration of credit risk
The geographical exposure is as follows:
2016 2015
£m £m
UK 334.8 260.3
Other 34.6 34.1
369.4 294.4
The treasury risk function monitors exposure concentrations against a variety of criteria
including counterparty limits.
b) Liquidity risk
Liquidity risk is the risk that the Bank will encounter difficulty in realising assets or
otherwise raising funds to meet commitments as they fall due. The Bank manages its
liquidity risk through its assets and liabilities committee, and monitors its liquidity position
on a daily basis and has adopted a policy to ensure that it has adequate resources to enable
it to conduct its normal business activities without interruption. The maturity analysis of
assets and liabilities is disclosed in note 33 (e) & (f) to the financial statements.
The customer deposit base represents a stable source of funding due to the number and
range of depositors. Liquidity is further managed through dealings in the money markets.
The Board has approved a liquidity risk management policy that sets out the liquidity
requirements with which the Bank must comply. The principal liquidity risk mitigants used
by management are:
A buffer of highly liquid assets (comprising high quality government, covered bonds
and supranational bank securities) which can meet cash requirements;
Cash reserves with the Bank of England;
Cash resources held at other financial institutions.
.
c) Interest rate risk
Interest rate risk is the risk that arises when there is an imbalance between the maturity
dates of rate sensitive assets, liabilities and commitments. The Company manages its
interest rate risk through its assets and liabilities committee. The Company’s policy is to
maintain interest rate risk at a controlled level within limits set by the Board.
The table in note 33(d) shows an estimate of the interest rate sensitivity gap as at 31
October 2016. The principal risk management tool to mitigate interest rate risk is the use of
derivatives to align the interest rate re-pricing profile of assets and liabilities. All of the
derivatives used by the Company are interest rate swap contracts of varying maturities and
start dates.
The Company’s interest rate risk management policy defines the type of derivative
transactions that can be undertaken, which are all actioned by the Bank’s treasury function,
and are subject to review and approval at the dealing stage. The Treasurer, who is
responsible for
Notes to the accounts For the year ended 31 October 2016
Financial Statements Registered number 743437
Julian Hodge Bank Limited
70
34 Financial risk management objectives and policies (continued)
treasury matters on a day to day basis, prepares a treasury report for the Board, which
includes analysis of interest rate risk exposures.
d) House price risk
House price risk is the risk that arises when there is an adverse mismatch between actual
house prices and those implicit in the costing of the Company’s later life lending, such that
the ultimate realisation of the property would not yield the expected return to the Company
and could, in certain circumstances, result in a capital loss. The company mitigates house
price risk by monitoring maximum Loan to Value at inception of the loan.
e) Conduct risk
Conduct risk is the risk that the Bank’s behaviour results in poor outcomes for customers.
The Bank is exposed to this risk by virtue of the markets in which it chooses to operate. The
executive risk committee has overall responsibility for implementing and monitoring
principles, frameworks, policies and limits. The committee is responsible for managing risk
decisions and monitoring risk levels which it reports to the Board of Directors.
The Company holds a provision of £0.1m as at 31 October 2016 (2015; £0.1m) in respect
of conduct risk which is disclosed in note 29.
f) Operational risk
Operational risk is the risk of economic loss from systemic failure, human error and fraud
(control failures) or external events, which result in unexpected or indirect loss to the
Company. When controls fail to perform, operational risks can cause damage to reputation,
have legal or regulatory implications or can lead to financial loss. The Company cannot
expect to eliminate all operational risks but by initiating a rigorous control framework and
by monitoring and responding to potential risks, the Company is able to manage the risks.
Controls include effective segregation of duties, access controls, authorisation and
reconciliation procedures, staff education and assessment processes, including the use of
internal audit.
35 Capital risk management
The Company conducts an internal capital adequacy assessment process (“ICAAP”), at least
annually, which is approved by the Board. This is used to assess the Company’s capital
adequacy and to determine the level of capital required to support the future development
of the business as set out in the strategic plan.
The ICAAP addresses all the Company’s material risks and includes Board approved stress
scenarios which are intended, as a minimum, to meet regulatory requirements. The ICAAP
is used by the PRA to set the Company’s Individual Capital Guidance (ICG)
The Company’s capital resources requirements are calculated based on the CRD IV CRR
regulatory framework as implemented by the PRA, namely:
- Pillar 1-based on a Standardised Approach for credit risk, operational risk and
market risk;
- Pillar 2-set by the PRA via the ICG to address those risks not covered under Pillar 1.
Notes to the accounts For the year ended 31 October 2016
Financial Statements Registered number 743437
Julian Hodge Bank Limited
71
35 Capital risk management (continued)
The Board is ultimately responsible for capital management and monitors the capital
position of the Company at each board meeting through the receipt of management
information which sets out the Company’s current and forecast capital position, based on
the methodology adopted within its ICAAP.
This means that the Company will:
i) Maintain a level of capital at least equal to the minimum amount set by the PRA in the
ICG, and;
ii) Hold all its capital in the form of Common Equity Tier 1 and Tier 2 capital.
The Company had a common equity tier 1 capital ratio of 19.1% (2015: 21.4%) and a total
capital ratio of 19.2% (2015: 22.2%)
CRD
Article 89 of the Capital Requirements Directive IV (CRD IV) requires credit institutions and
investment firms in the EU to disclose annually, specifying, by Member State and by third
country in which it has an establishment, the following information:
Name, nature of activities and geographical location: The Bank has one subsidiary
and operates only in the United Kingdom. The principle activities of the Bank are
noted in the Strategic Report on page 5 and the principal activities of the
subsidiaries are disclosed in Note 18 to the accounts.
Average number of employees: as disclosed in Note 10 to the accounts.
Annual turnover (Net Interest Income) and profit before tax: as disclosed in the
Income Statement on page 18.
Corporation Tax paid: 2016 £3.7m (2015: £0.4m).
Public subsidies: There were none received in the year.
.
All minimum regulatory requirements were met during the year and the prior year.
The Company’s objectives when managing capital are:
To have sufficient capital to safeguard the Company’s ability to continue as a going
concern so that it can continue to provide returns for the shareholder and benefits
for other stakeholders;
To comply with the bank capital requirements set out by the PRA in the UK;
When capital is needed, to require an adequate return to the shareholder by pricing
insurance contracts according to the level of risk associated with the business
written; and
To meet the requirements of the Schemes of Transfer.
The Company’s capital comprises all components of equity, movements of which are set out
in the Statement of Changes in Equity.
Notes to the accounts For the year ended 31 October 2016
Financial Statements Registered number 743437
Julian Hodge Bank Limited
72
36 Ultimate parent undertaking
The immediate parent undertaking of the Bank is The Carlyle Trust Limited, registered in
England and Wales, which controls and co-ordinates the management of a group of
companies. The ultimate parent undertaking and controller is The Carlyle Trust (Jersey)
Limited (incorporated in Jersey). Within the meaning of the Companies Act 2006, The
Carlyle Trust Limited is the parent undertaking of the largest and only group of
undertakings for which group accounts are drawn up and of which the Bank is a member.
The accounts of The Carlyle Trust Limited can be obtained from The Registrar of Companies,
Companies House, Crown Way, Cardiff, CF14 3UZ.
37 Explanation of transition to FRS 101
As stated in note 1, these are the Bank’s first financial statements prepared in accordance
with FRS 101. The accounting policies set out in Note 1 have been applied in preparing the
financial statements for the year ended 31 October 2016, the comparative information
presented in these financial statements for the year ended 31 October 2015 and in the
preparation of an opening FRS 101 balance sheet as at 1 November 2014 (the Company’s
date of transition).
In preparing its FRS 101 balance sheet, the Company has adjusted amounts reported
previously in financial statements prepared in accordance with its old basis of accounting
(UK GAAP). An explanation of how the transition from UK GAAP to FRS 101 has affected the
company’s financial position, financial performance and cash flows is set out in the following
tables and the notes that accompany the tables.
Adjustments have been made against opening reserves, unless otherwise stated.
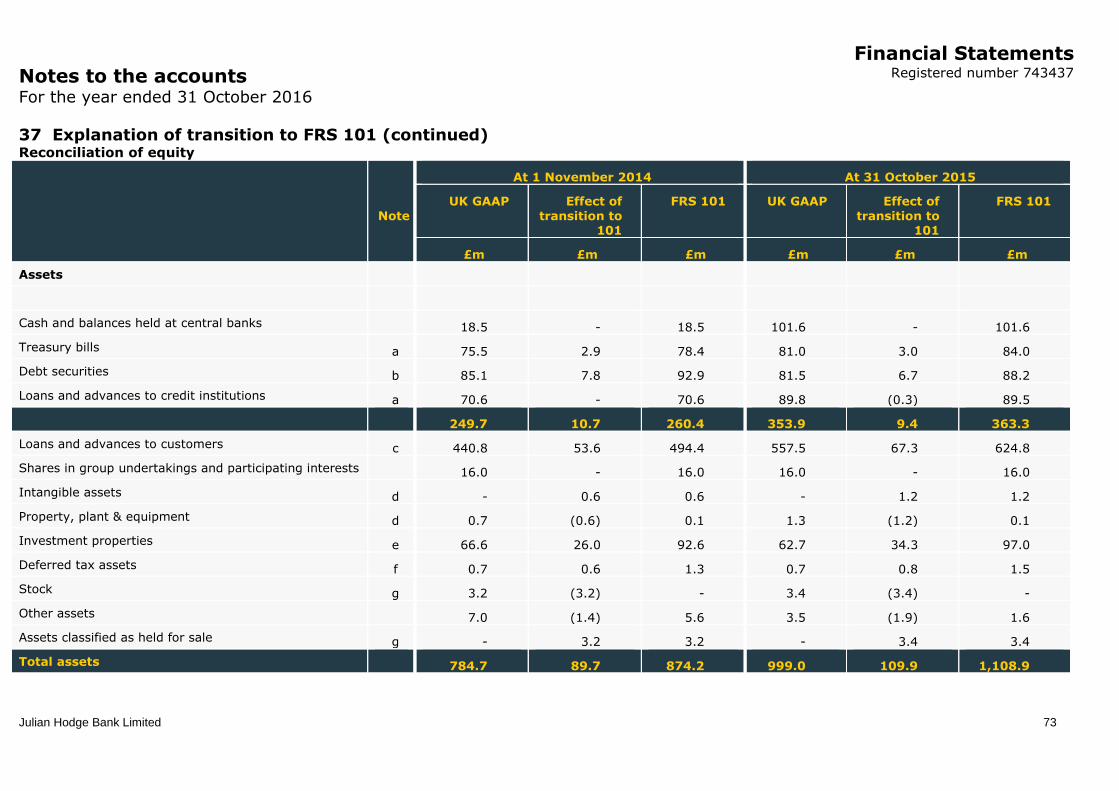
Notes to the accounts For the year ended 31 October 2016
Financial Statements Registered number 743437
Julian Hodge Bank Limited
73
37 Explanation of transition to FRS 101 (continued) Reconciliation of equity
Note
At 1 November 2014 At 31 October 2015
UK GAAP Effect of
transition to 101
FRS 101 UK GAAP Effect of
transition to 101
FRS 101
£m £m £m £m £m £m
Assets
Cash and balances held at central banks 18.5 - 18.5 101.6 - 101.6
Treasury bills a 75.5 2.9 78.4 81.0 3.0 84.0
Debt securities b 85.1 7.8 92.9 81.5 6.7 88.2
Loans and advances to credit institutions a 70.6 - 70.6 89.8 (0.3) 89.5
249.7 10.7 260.4 353.9 9.4 363.3
Loans and advances to customers c 440.8 53.6 494.4 557.5 67.3 624.8
Shares in group undertakings and participating interests 16.0 - 16.0 16.0 - 16.0
Intangible assets d - 0.6 0.6 - 1.2 1.2
Property, plant & equipment d 0.7 (0.6) 0.1 1.3 (1.2) 0.1
Investment properties e 66.6 26.0 92.6 62.7 34.3 97.0
Deferred tax assets f 0.7 0.6 1.3 0.7 0.8 1.5
Stock g 3.2 (3.2) - 3.4 (3.4) -
Other assets 7.0 (1.4) 5.6 3.5 (1.9) 1.6
Assets classified as held for sale g - 3.2 3.2 - 3.4 3.4
Total assets 784.7 89.7 874.2 999.0 109.9 1,108.9
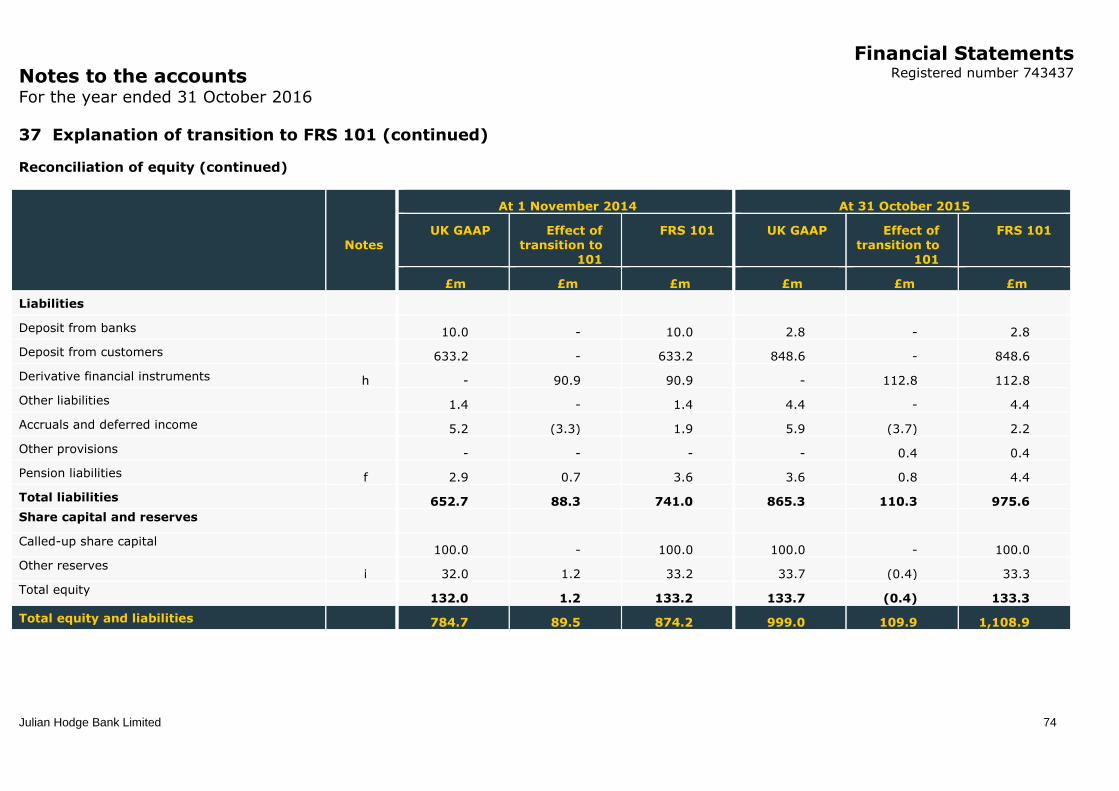
Notes to the accounts For the year ended 31 October 2016
Financial Statements Registered number 743437
Julian Hodge Bank Limited
74
37 Explanation of transition to FRS 101 (continued)
Reconciliation of equity (continued)
Notes
At 1 November 2014 At 31 October 2015
UK GAAP Effect of transition to
101
FRS 101 UK GAAP Effect of transition to
101
FRS 101
£m £m £m £m £m £m
Liabilities
Deposit from banks 10.0 - 10.0 2.8 - 2.8
Deposit from customers 633.2 - 633.2 848.6 - 848.6
Derivative financial instruments h - 90.9 90.9 - 112.8 112.8
Other liabilities 1.4 - 1.4 4.4 - 4.4
Accruals and deferred income 5.2 (3.3) 1.9 5.9 (3.7) 2.2
Other provisions - - - - 0.4 0.4
Pension liabilities f 2.9 0.7 3.6 3.6 0.8 4.4
Total liabilities 652.7 88.3 741.0 865.3 110.3 975.6
Share capital and reserves
Called-up share capital 100.0 - 100.0 100.0 - 100.0
Other reserves i 32.0 1.2 33.2 33.7 (0.4) 33.3
Total equity 132.0 1.2 133.2 133.7 (0.4) 133.3
Total equity and liabilities 784.7 89.5 874.2 999.0 109.9 1,108.9
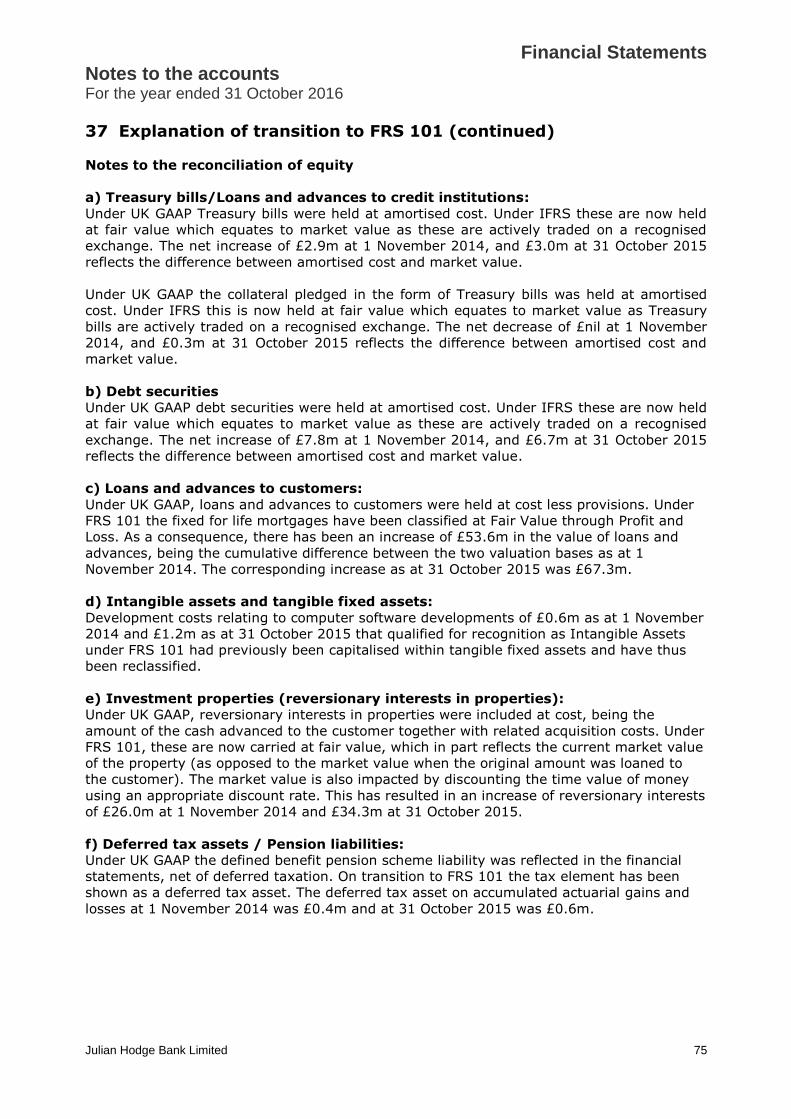
Notes to the accounts For the year ended 31 October 2016
Financial Statements
Julian Hodge Bank Limited
75
37 Explanation of transition to FRS 101 (continued)
Notes to the reconciliation of equity
a) Treasury bills/Loans and advances to credit institutions:
Under UK GAAP Treasury bills were held at amortised cost. Under IFRS these are now held
at fair value which equates to market value as these are actively traded on a recognised
exchange. The net increase of £2.9m at 1 November 2014, and £3.0m at 31 October 2015
reflects the difference between amortised cost and market value.
Under UK GAAP the collateral pledged in the form of Treasury bills was held at amortised
cost. Under IFRS this is now held at fair value which equates to market value as Treasury
bills are actively traded on a recognised exchange. The net decrease of £nil at 1 November
2014, and £0.3m at 31 October 2015 reflects the difference between amortised cost and
market value.
b) Debt securities
Under UK GAAP debt securities were held at amortised cost. Under IFRS these are now held
at fair value which equates to market value as these are actively traded on a recognised
exchange. The net increase of £7.8m at 1 November 2014, and £6.7m at 31 October 2015
reflects the difference between amortised cost and market value.
c) Loans and advances to customers:
Under UK GAAP, loans and advances to customers were held at cost less provisions. Under
FRS 101 the fixed for life mortgages have been classified at Fair Value through Profit and
Loss. As a consequence, there has been an increase of £53.6m in the value of loans and
advances, being the cumulative difference between the two valuation bases as at 1
November 2014. The corresponding increase as at 31 October 2015 was £67.3m.
d) Intangible assets and tangible fixed assets:
Development costs relating to computer software developments of £0.6m as at 1 November
2014 and £1.2m as at 31 October 2015 that qualified for recognition as Intangible Assets
under FRS 101 had previously been capitalised within tangible fixed assets and have thus
been reclassified.
e) Investment properties (reversionary interests in properties):
Under UK GAAP, reversionary interests in properties were included at cost, being the
amount of the cash advanced to the customer together with related acquisition costs. Under
FRS 101, these are now carried at fair value, which in part reflects the current market value
of the property (as opposed to the market value when the original amount was loaned to
the customer). The market value is also impacted by discounting the time value of money
using an appropriate discount rate. This has resulted in an increase of reversionary interests
of £26.0m at 1 November 2014 and £34.3m at 31 October 2015.
f) Deferred tax assets / Pension liabilities:
Under UK GAAP the defined benefit pension scheme liability was reflected in the financial
statements, net of deferred taxation. On transition to FRS 101 the tax element has been
shown as a deferred tax asset. The deferred tax asset on accumulated actuarial gains and
losses at 1 November 2014 was £0.4m and at 31 October 2015 was £0.6m.
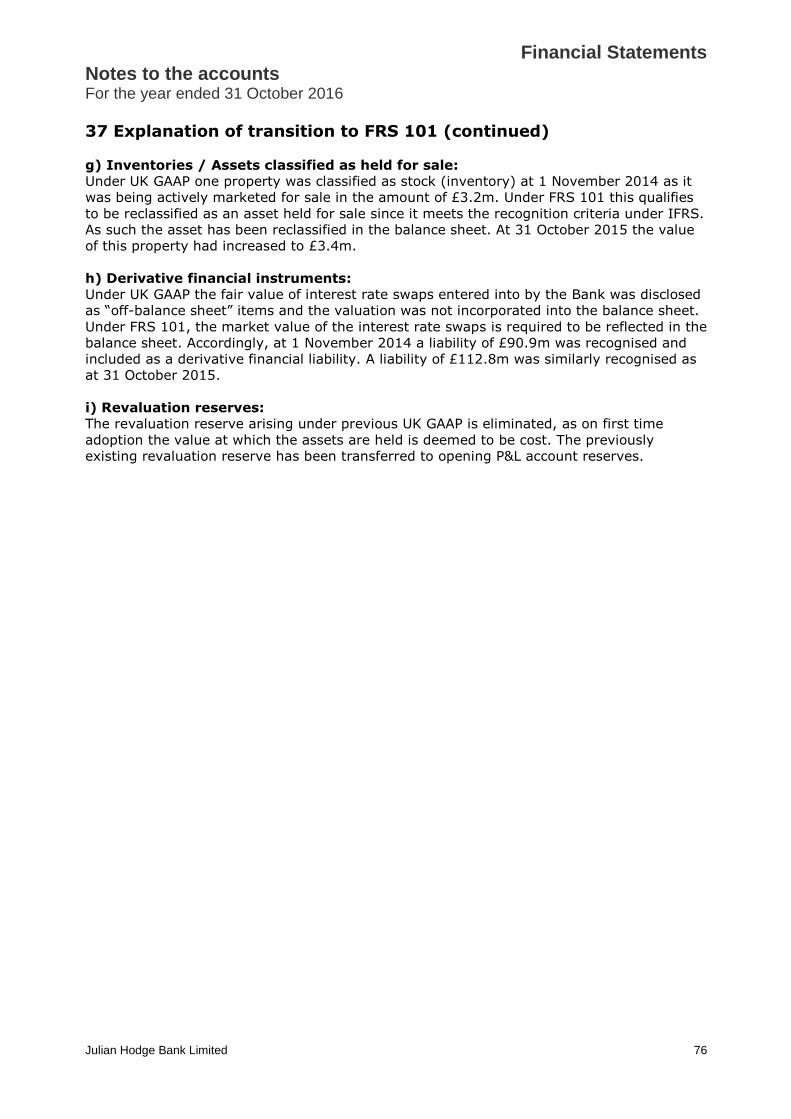
Notes to the accounts For the year ended 31 October 2016
Financial Statements
Julian Hodge Bank Limited
76
37 Explanation of transition to FRS 101 (continued)
g) Inventories / Assets classified as held for sale:
Under UK GAAP one property was classified as stock (inventory) at 1 November 2014 as it
was being actively marketed for sale in the amount of £3.2m. Under FRS 101 this qualifies
to be reclassified as an asset held for sale since it meets the recognition criteria under IFRS.
As such the asset has been reclassified in the balance sheet. At 31 October 2015 the value
of this property had increased to £3.4m.
h) Derivative financial instruments:
Under UK GAAP the fair value of interest rate swaps entered into by the Bank was disclosed
as “off-balance sheet” items and the valuation was not incorporated into the balance sheet.
Under FRS 101, the market value of the interest rate swaps is required to be reflected in the
balance sheet. Accordingly, at 1 November 2014 a liability of £90.9m was recognised and
included as a derivative financial liability. A liability of £112.8m was similarly recognised as
at 31 October 2015.
i) Revaluation reserves:
The revaluation reserve arising under previous UK GAAP is eliminated, as on first time
adoption the value at which the assets are held is deemed to be cost. The previously
existing revaluation reserve has been transferred to opening P&L account reserves.
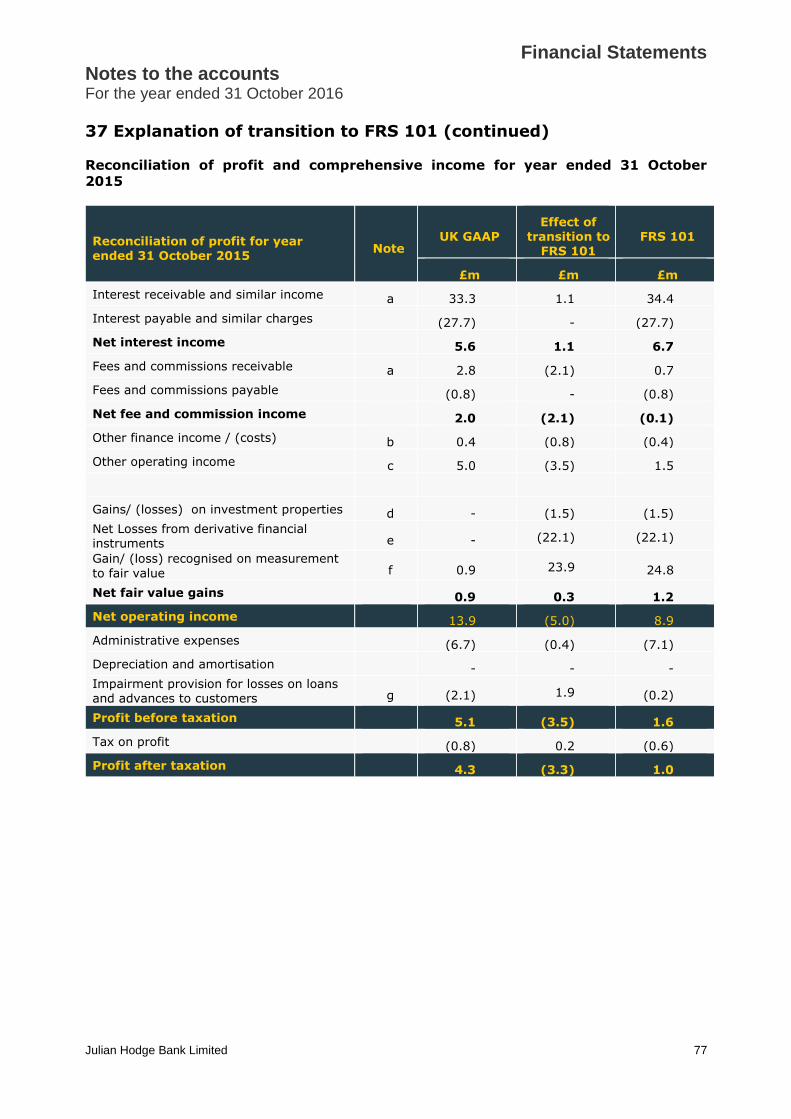
Notes to the accounts For the year ended 31 October 2016
Financial Statements
Julian Hodge Bank Limited
77
37 Explanation of transition to FRS 101 (continued)
Reconciliation of profit and comprehensive income for year ended 31 October
2015
Reconciliation of profit for year ended 31 October 2015
Note UK GAAP
Effect of transition to
FRS 101 FRS 101
£m £m £m
Interest receivable and similar income a 33.3 1.1 34.4
Interest payable and similar charges (27.7) - (27.7)
Net interest income 5.6 1.1 6.7
Fees and commissions receivable a 2.8 (2.1) 0.7
Fees and commissions payable (0.8) - (0.8)
Net fee and commission income 2.0 (2.1) (0.1)
Other finance income / (costs) b 0.4 (0.8) (0.4)
Other operating income c 5.0 (3.5) 1.5
Gains/ (losses) on investment properties d - (1.5) (1.5)
Net Losses from derivative financial instruments e - (22.1) (22.1)
Gain/ (loss) recognised on measurement
to fair value f 0.9 23.9 24.8
Net fair value gains 0.9 0.3 1.2
Net operating income 13.9 (5.0) 8.9
Administrative expenses (6.7) (0.4) (7.1)
Depreciation and amortisation - - -
Impairment provision for losses on loans and advances to customers g (2.1) 1.9 (0.2)
Profit before taxation 5.1 (3.5) 1.6
Tax on profit (0.8) 0.2 (0.6)
Profit after taxation 4.3 (3.3) 1.0
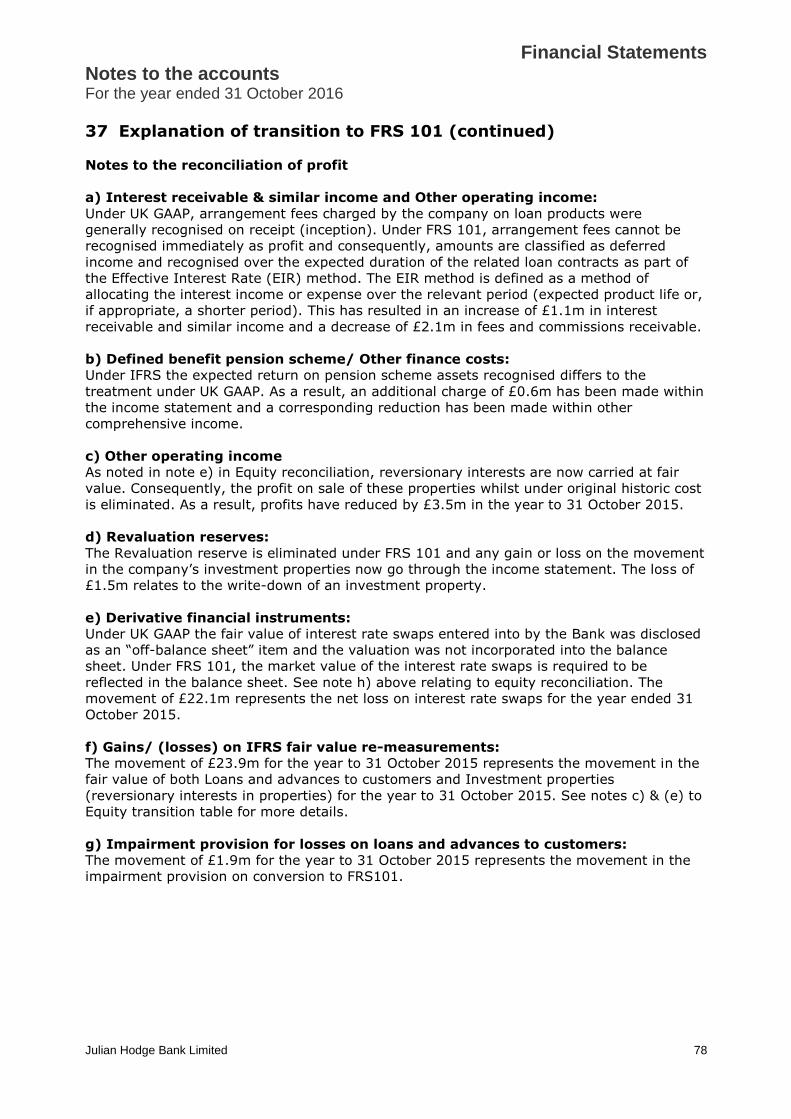
Notes to the accounts For the year ended 31 October 2016
Financial Statements
Julian Hodge Bank Limited
78
37 Explanation of transition to FRS 101 (continued)
Notes to the reconciliation of profit
a) Interest receivable & similar income and Other operating income:
Under UK GAAP, arrangement fees charged by the company on loan products were
generally recognised on receipt (inception). Under FRS 101, arrangement fees cannot be
recognised immediately as profit and consequently, amounts are classified as deferred
income and recognised over the expected duration of the related loan contracts as part of
the Effective Interest Rate (EIR) method. The EIR method is defined as a method of
allocating the interest income or expense over the relevant period (expected product life or,
if appropriate, a shorter period). This has resulted in an increase of £1.1m in interest
receivable and similar income and a decrease of £2.1m in fees and commissions receivable.
b) Defined benefit pension scheme/ Other finance costs:
Under IFRS the expected return on pension scheme assets recognised differs to the
treatment under UK GAAP. As a result, an additional charge of £0.6m has been made within
the income statement and a corresponding reduction has been made within other
comprehensive income.
c) Other operating income
As noted in note e) in Equity reconciliation, reversionary interests are now carried at fair
value. Consequently, the profit on sale of these properties whilst under original historic cost
is eliminated. As a result, profits have reduced by £3.5m in the year to 31 October 2015.
d) Revaluation reserves:
The Revaluation reserve is eliminated under FRS 101 and any gain or loss on the movement
in the company’s investment properties now go through the income statement. The loss of
£1.5m relates to the write-down of an investment property.
e) Derivative financial instruments:
Under UK GAAP the fair value of interest rate swaps entered into by the Bank was disclosed
as an “off-balance sheet” item and the valuation was not incorporated into the balance
sheet. Under FRS 101, the market value of the interest rate swaps is required to be
reflected in the balance sheet. See note h) above relating to equity reconciliation. The
movement of £22.1m represents the net loss on interest rate swaps for the year ended 31
October 2015.
f) Gains/ (losses) on IFRS fair value re-measurements:
The movement of £23.9m for the year to 31 October 2015 represents the movement in the
fair value of both Loans and advances to customers and Investment properties
(reversionary interests in properties) for the year to 31 October 2015. See notes c) & (e) to
Equity transition table for more details.
g) Impairment provision for losses on loans and advances to customers:
The movement of £1.9m for the year to 31 October 2015 represents the movement in the
impairment provision on conversion to FRS101.
Recommended