© Copyright 2014 Quintiles
J.P. Morgan 2015
Healthcare Conference
January 14, 2015
NYSE: Q
2
Forward Looking Statements and
Use of Non-GAAP Financial MeasuresThis presentation contains forward-looking statements within the meaning of Section 27A of the Securities Act of 1933, as
amended and Section 21E of the Securities Exchange Act of 1934, as amended. Such forward-looking statements reflect,
among other things, the Company’s current expectations and anticipated results of operations, all of which are subject to
known and unknown risks, uncertainties and other factors that may cause actual results, performance or achievements,
market trends or industry results to differ materially from those expressed or implied by such forward-looking statements.
Therefore, any statements contained herein that are not statements of historical fact may be forward-looking statements
and should be evaluated as such. Without limiting the foregoing, the words “anticipates,” “believes,” “estimates,” “expects,”
“intends,” “may,” “plans,” “projects,” “should,” “guidance,” “targets,” “will” and the negative thereof and similar words and
expressions are intended to identify forward-looking statements. Actual results may differ materially from the Company’s
expectations due to a number of factors, including that most of the Company’s contracts may be terminated on short notice,
the Company may be unable to maintain large customer contracts or to enter into new contracts, the Company may under-
price its contracts, overrun its cost estimates, or fail to receive approval for or experience delays in documenting change
orders, the historical indications of the relationship of backlog to revenues may not be indicative of their future relationship,
the Company is subject to the complex and changing regulatory and international environments in which the Company
operates, the Company may be unable to successfully identify, acquire and integrate businesses, the Company’s
substantial indebtedness, and other risks more fully set forth in the Company's filings with the SEC, including the
Company’s annual report on Form 10-K for the fiscal year ended December 31, 2013, filed with the SEC on February 13,
2014, as such factors may be amended or updated from time to time in the Company’s periodic filings with the SEC, which
are accessible on the SEC's website at www.sec.gov. The Company assumes no obligation to update any forward-looking
statement after the date of this presentation, whether as a result of new information, future developments or otherwise.
This presentation includes financial measures not prepared in accordance with accounting principles generally accepted in
the United States (“GAAP”). Management believes that these non-GAAP financial measures provide useful supplemental
information to management and investors regarding the underlying performance of the Company’s business operations and
are more indicative of core operating results as they exclude certain items whose fluctuations from period-to-period do not
necessarily correspond to changes in the core operations of the Company’s business. Investors and potential investors are
encouraged to review the reconciliations of the non-GAAP financial measures to their most directly comparable GAAP
measures attached to this presentation.
3
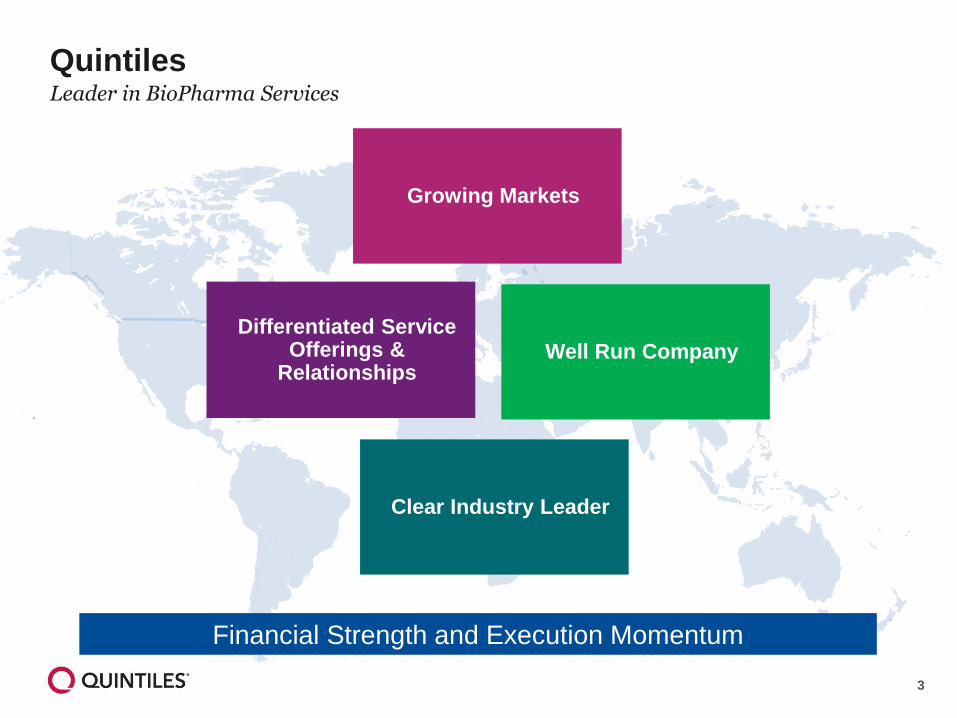
Well Run Company
QuintilesLeader in BioPharma Services
Clear Industry Leader
Growing Markets
Differentiated Service Offerings &
Relationships
Financial Strength and Execution Momentum
4
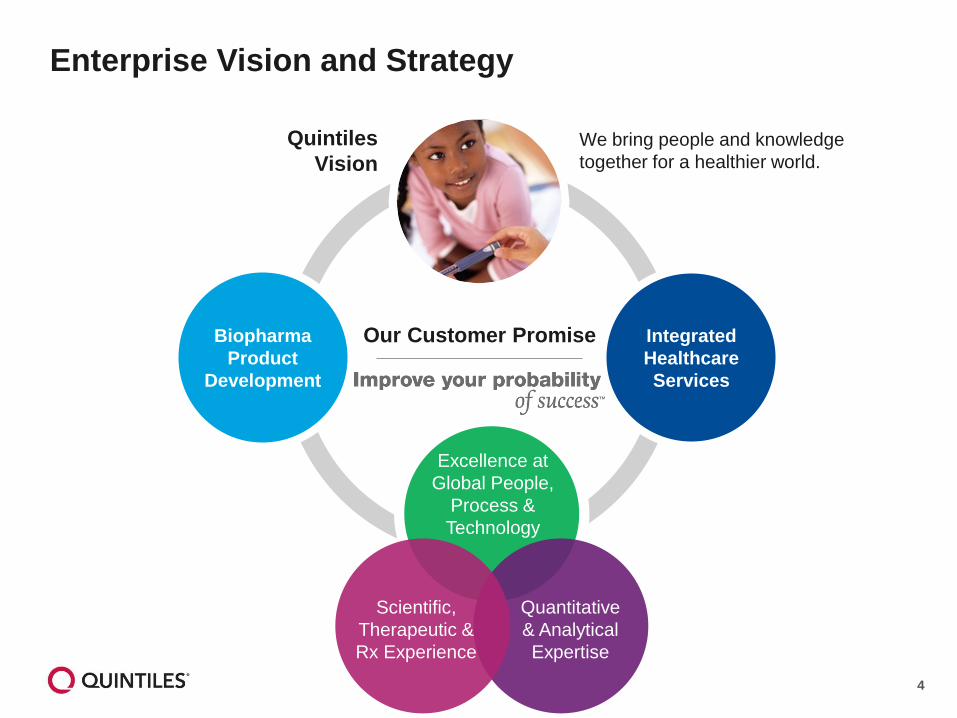
Enterprise Vision and Strategy
Quintiles
Vision
We bring people and knowledge
together for a healthier world.
Our Customer Promise
Excellence at
Global People,
Process &
Technology
Scientific,
Therapeutic &
Rx Experience
Quantitative
& Analytical
Expertise
Biopharma
Product
Development
Integrated
Healthcare
Services
5
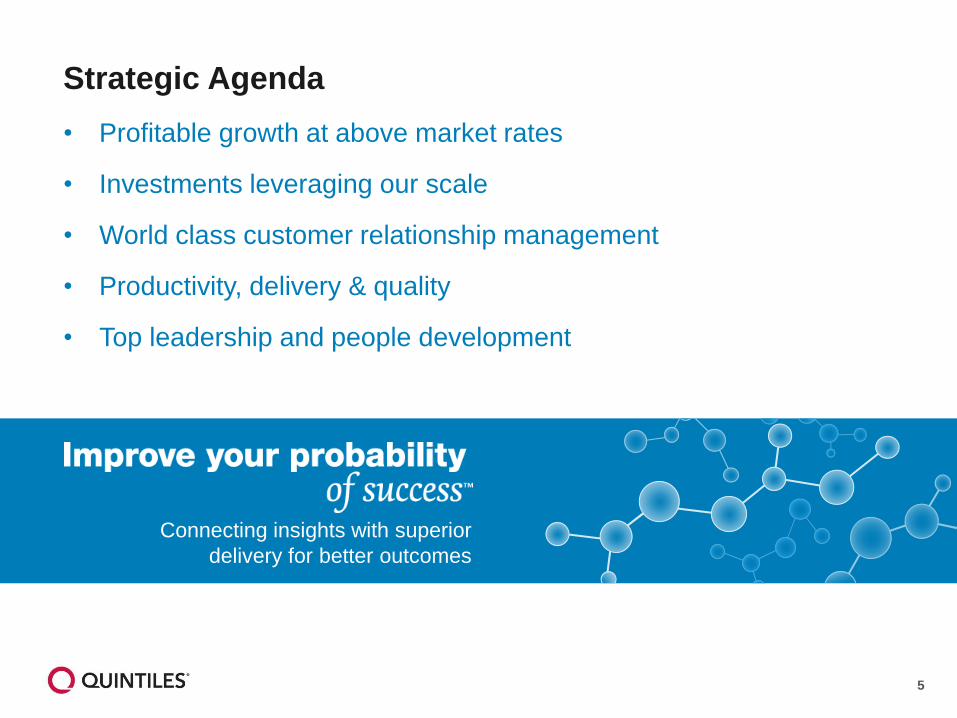
Strategic Agenda
• Profitable growth at above market rates
• Investments leveraging our scale
• World class customer relationship management
• Productivity, delivery & quality
• Top leadership and people development
Connecting insights with superior
delivery for better outcomes
6
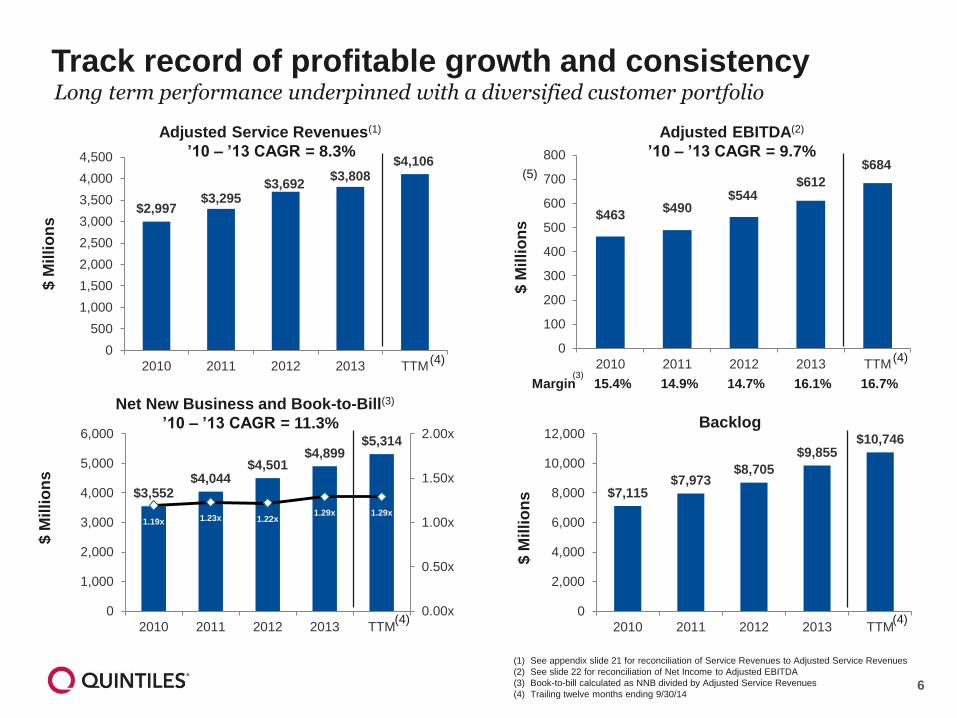
$463$490
$544$612
$684
0
100
200
300
400
500
600
700
800
2010 2011 2012 2013 TTM
$2,997$3,295
$3,692$3,808
$4,106
0
500
1,000
1,500
2,000
2,500
3,000
3,500
4,000
4,500
2010 2011 2012 2013 TTM
$3,552$4,044
$4,501$4,899
$5,314
1.19x 1.23x 1.22x1.29x 1.29x
0.00x
0.50x
1.00x
1.50x
2.00x
0
1,000
2,000
3,000
4,000
5,000
6,000
2010 2011 2012 2013 TTM
$7,115$7,973
$8,705
$9,855$10,746
0
2,000
4,000
6,000
8,000
10,000
12,000
2010 2011 2012 2013 TTM
Track record of profitable growth and consistency
Backlog
(1) See appendix slide 21 for reconciliation of Service Revenues to Adjusted Service Revenues
(2) See slide 22 for reconciliation of Net Income to Adjusted EBITDA
(3) Book-to-bill calculated as NNB divided by Adjusted Service Revenues
(4) Trailing twelve months ending 9/30/14
Adjusted Service Revenues(1)
’10 – ’13 CAGR = 8.3%
Adjusted EBITDA(2)
’10 – ’13 CAGR = 9.7%
Net New Business and Book-to-Bill(3)
’10 – ’13 CAGR = 11.3%
$ M
illi
on
s
$ M
illi
on
s
$ M
illi
on
s
$ M
illi
on
s
15.4% 14.9% 14.7% 16.1% 16.7%Margin(3)
Long term performance underpinned with a diversified customer portfolio
(4)
(4)
(4)
(5)
(4)
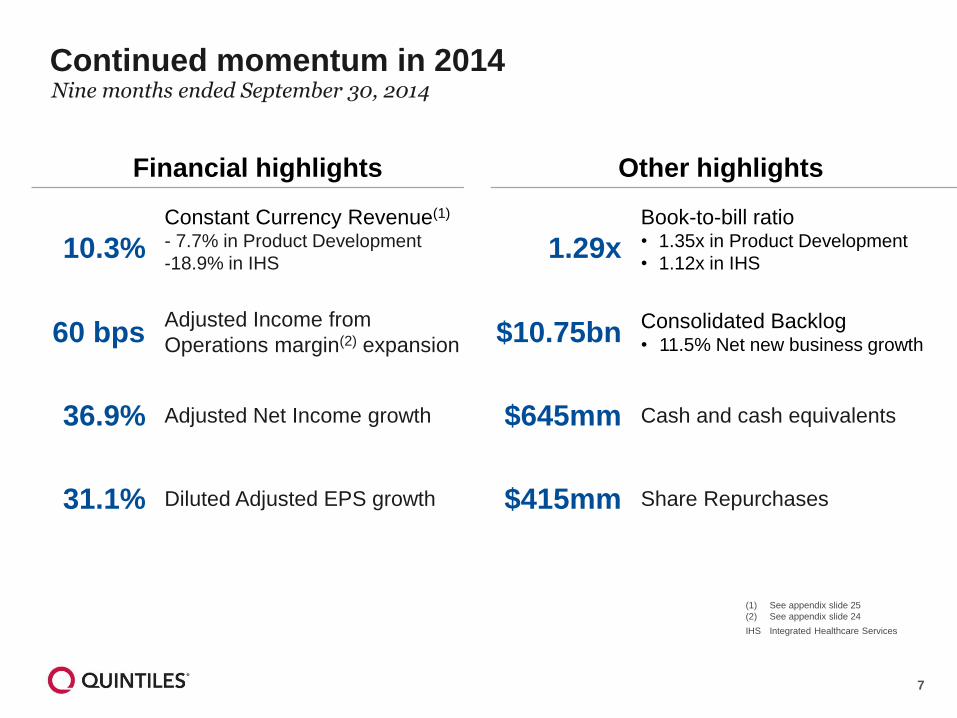
7
Continued momentum in 2014Nine months ended September 30, 2014
(1) See appendix slide 25
(2) See appendix slide 24
Financial highlights Other highlights
10.3%Constant Currency Revenue(1)
- 7.7% in Product Development
-18.9% in IHS1.29x
Book-to-bill ratio• 1.35x in Product Development
• 1.12x in IHS
60 bpsAdjusted Income from
Operations margin(2) expansion $10.75bnConsolidated Backlog• 11.5% Net new business growth
36.9% Adjusted Net Income growth $645mm Cash and cash equivalents
31.1% Diluted Adjusted EPS growth $415mm Share Repurchases
IHS Integrated Healthcare Services
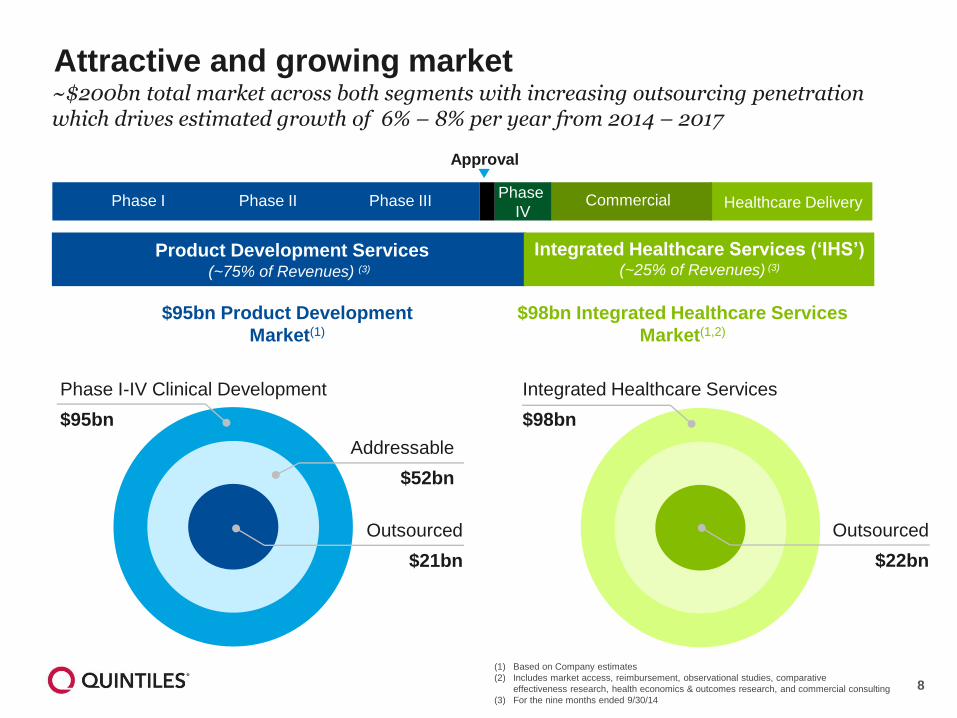
8
Attractive and growing market~$200bn total market across both segments with increasing outsourcing penetration which drives estimated growth of 6% – 8% per year from 2014 – 2017
$95bn Product Development
Market(1)
$98bn Integrated Healthcare Services
Market(1,2)
Phase I-IV Clinical Development
$95bn
Outsourced
$21bn
Addressable
$52bn
Integrated Healthcare Services
$98bn
Outsourced
$22bn
(1) Based on Company estimates
(2) Includes market access, reimbursement, observational studies, comparative
effectiveness research, health economics & outcomes research, and commercial consulting
(3) For the nine months ended 9/30/14
Product Development Services (~75% of Revenues) (3)
Integrated Healthcare Services (‘IHS’) (~25% of Revenues) (3)
Approval
Phase I Phase II Phase III Healthcare DeliveryCommercialPhase
IV
9
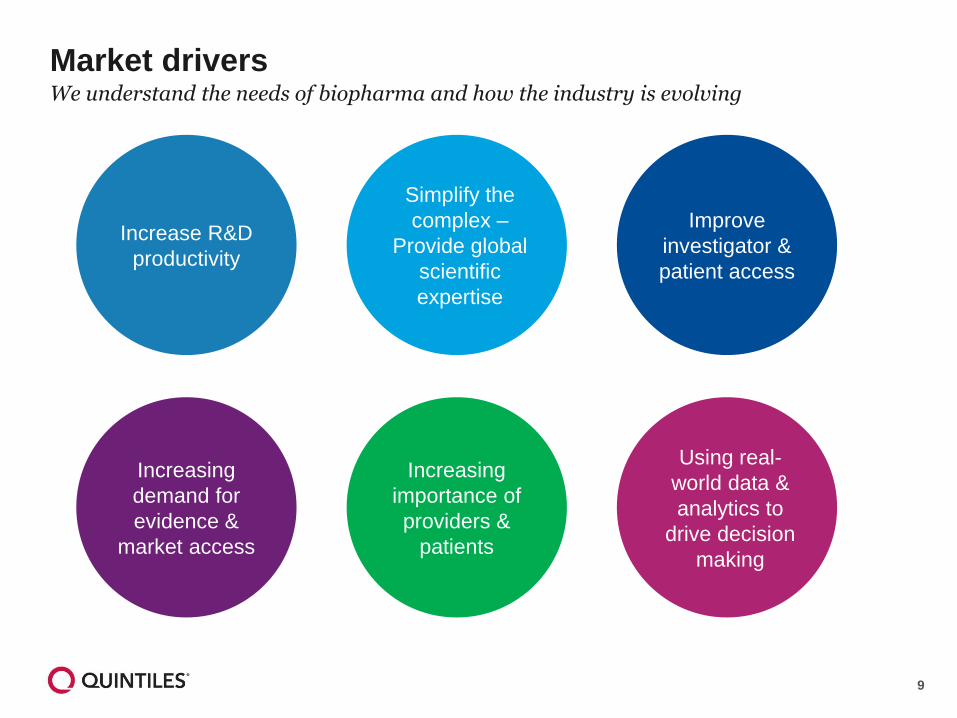
Increase R&D
productivity
Simplify the
complex –
Provide global
scientific
expertise
Improve
investigator &
patient access
Increasing
importance of
providers &
patients
Using real-
world data &
analytics to
drive decision
making
Increasing
demand for
evidence &
market access
Market drivers We understand the needs of biopharma and how the industry is evolving
10
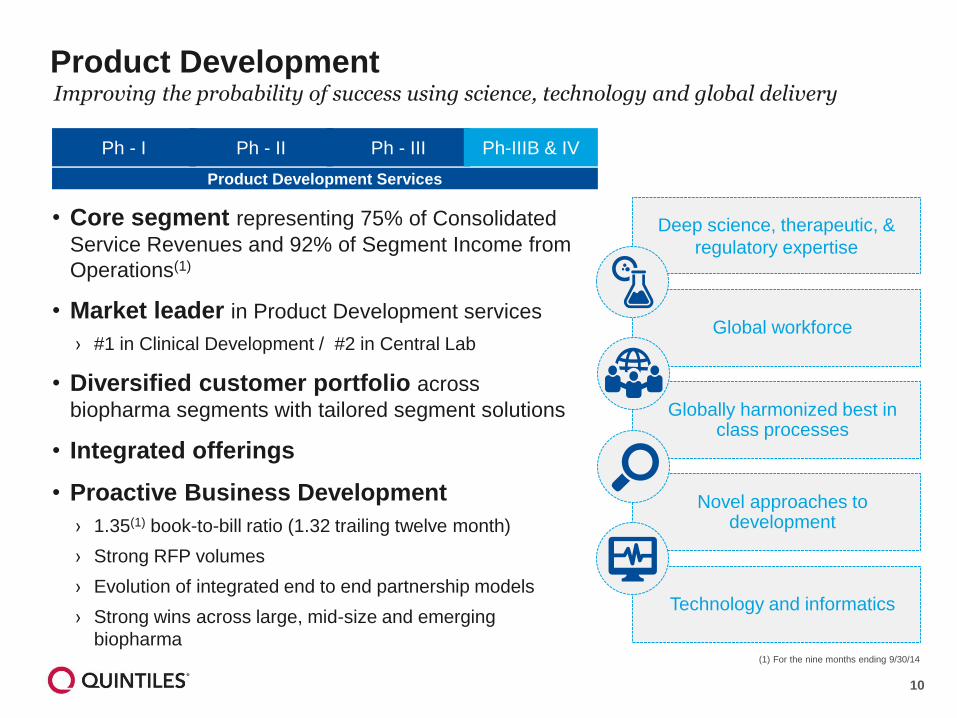
Product Development
• Core segment representing 75% of Consolidated
Service Revenues and 92% of Segment Income from
Operations(1)
• Market leader in Product Development services
› #1 in Clinical Development / #2 in Central Lab
• Diversified customer portfolio across
biopharma segments with tailored segment solutions
• Integrated offerings
• Proactive Business Development
› 1.35(1) book-to-bill ratio (1.32 trailing twelve month)
› Strong RFP volumes
› Evolution of integrated end to end partnership models
› Strong wins across large, mid-size and emerging
biopharma
Ph - I Ph - II Ph - III Ph-IIIB & IV
Product Development Services
Technology and informatics
Deep science, therapeutic, &
regulatory expertise
Globally harmonized best in class processes
Novel approaches to development
Global workforce
(1) For the nine months ending 9/30/14
Improving the probability of success using science, technology and global delivery
11
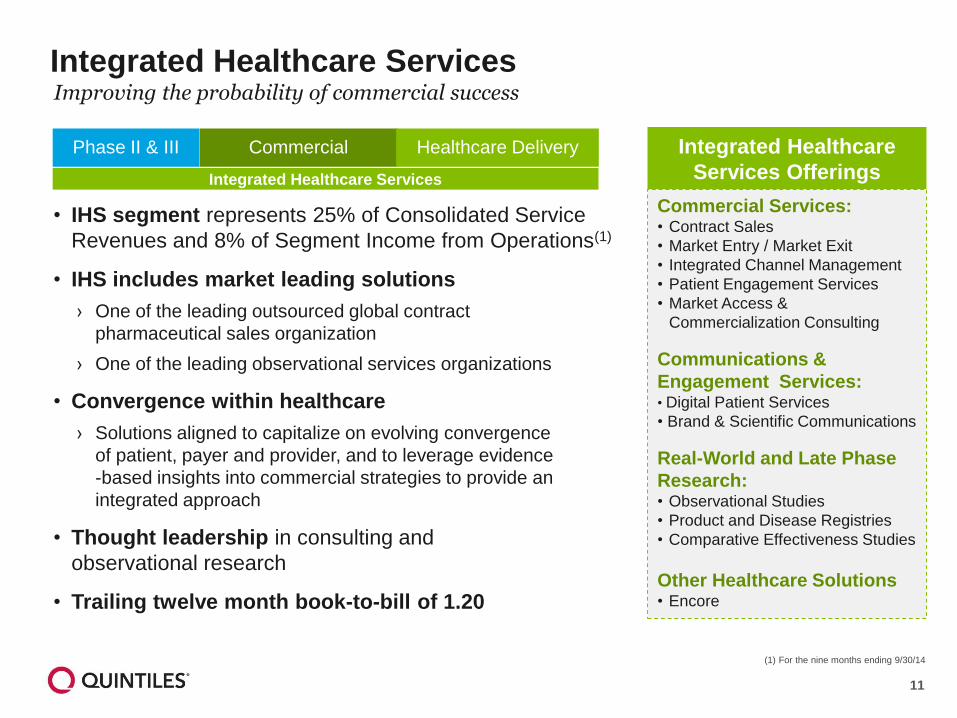
Integrated Healthcare Services
• IHS segment represents 25% of Consolidated Service
Revenues and 8% of Segment Income from Operations(1)
• IHS includes market leading solutions
› One of the leading outsourced global contract
pharmaceutical sales organization
› One of the leading observational services organizations
• Convergence within healthcare
› Solutions aligned to capitalize on evolving convergence
of patient, payer and provider, and to leverage evidence
-based insights into commercial strategies to provide an
integrated approach
• Thought leadership in consulting and
observational research
• Trailing twelve month book-to-bill of 1.20
Integrated Healthcare
Services Offerings
Commercial Services:• Contract Sales
• Market Entry / Market Exit
• Integrated Channel Management
• Patient Engagement Services
• Market Access &
Commercialization Consulting
Communications &
Engagement Services:• Digital Patient Services
• Brand & Scientific Communications
Real-World and Late Phase
Research:• Observational Studies
• Product and Disease Registries
• Comparative Effectiveness Studies
Other Healthcare Solutions• Encore
Integrated Healthcare Services
Phase II & III Commercial Healthcare Delivery
(1) For the nine months ending 9/30/14
Improving the probability of commercial success
12
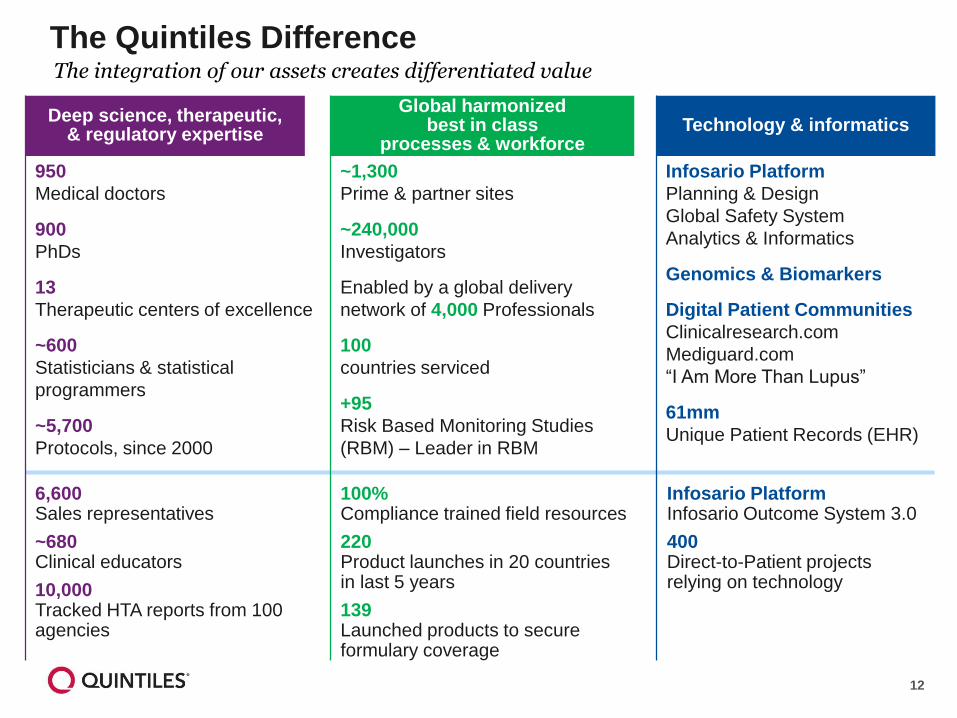
The Quintiles Difference
Deep science, therapeutic, & regulatory expertise
Global harmonized best in class
processes & workforceTechnology & informatics
Infosario Platform
Planning & Design
Global Safety System
Analytics & Informatics
Genomics & Biomarkers
Digital Patient Communities
Clinicalresearch.com
Mediguard.com
“I Am More Than Lupus”
61mm
Unique Patient Records (EHR)
~1,300
Prime & partner sites
~240,000
Investigators
Enabled by a global delivery
network of 4,000 Professionals
100
countries serviced
+95
Risk Based Monitoring Studies
(RBM) – Leader in RBM
950
Medical doctors
900
PhDs
13
Therapeutic centers of excellence
~600
Statisticians & statistical
programmers
~5,700
Protocols, since 2000
Infosario PlatformInfosario Outcome System 3.0
400Direct-to-Patient projects relying on technology
100% Compliance trained field resources
220 Product launches in 20 countries in last 5 years
139Launched products to secure formulary coverage
6,600Sales representatives
~680Clinical educators
10,000Tracked HTA reports from 100 agencies
The integration of our assets creates differentiated value
13
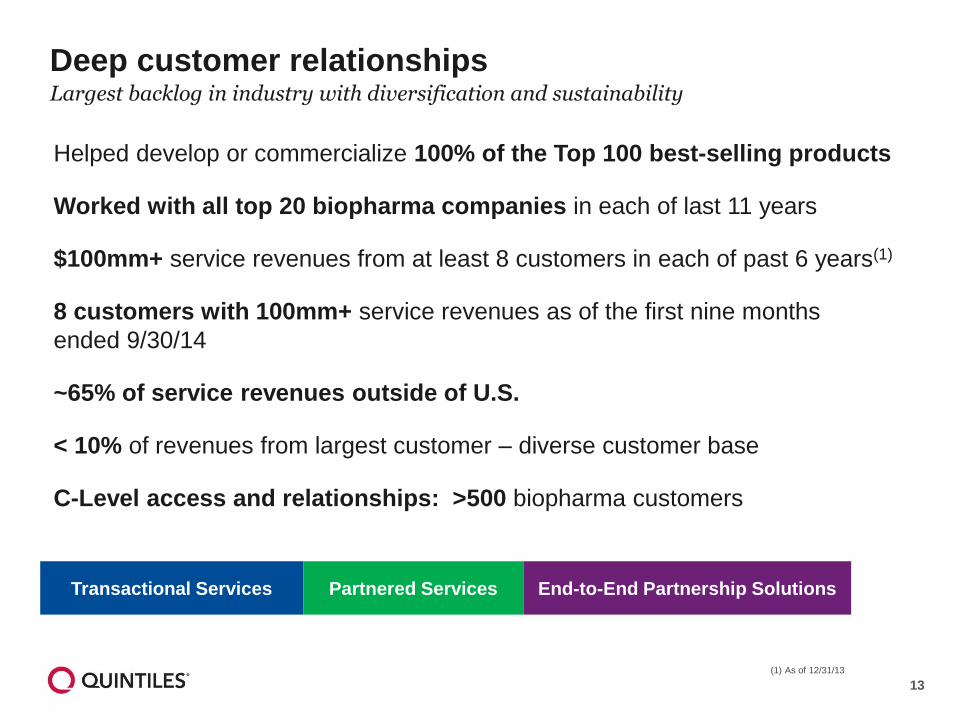
Deep customer relationships Largest backlog in industry with diversification and sustainability
Helped develop or commercialize 100% of the Top 100 best-selling products
Worked with all top 20 biopharma companies in each of last 11 years
$100mm+ service revenues from at least 8 customers in each of past 6 years(1)
8 customers with 100mm+ service revenues as of the first nine months
ended 9/30/14
~65% of service revenues outside of U.S.
< 10% of revenues from largest customer – diverse customer base
C-Level access and relationships: >500 biopharma customers
Transactional Services Partnered Services End-to-End Partnership Solutions
(1) As of 12/31/13
14
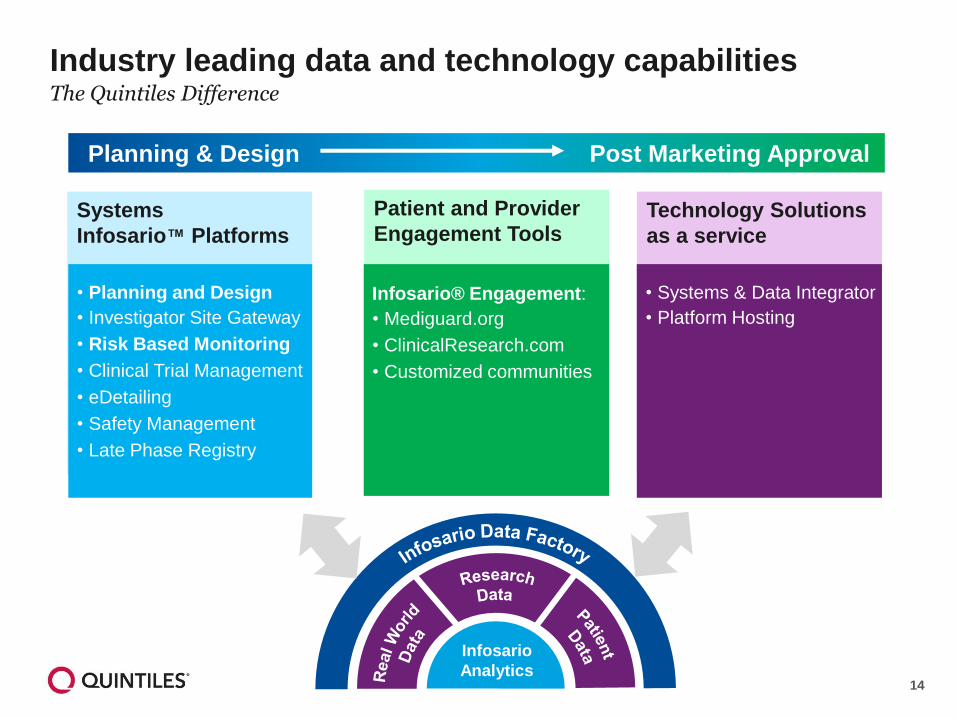
Industry leading data and technology capabilitiesThe Quintiles Difference
Infosario
Analytics
Patient and Provider
Engagement ToolsSystems
Infosario™ Platforms
Technology Solutions
as a service
• Systems & Data Integrator
• Platform Hosting
Planning & Design Post Marketing Approval
• Planning and Design
• Investigator Site Gateway
• Risk Based Monitoring
• Clinical Trial Management
• eDetailing
• Safety Management
• Late Phase Registry
Infosario® Engagement:
• Mediguard.org
• ClinicalResearch.com
• Customized communities
15
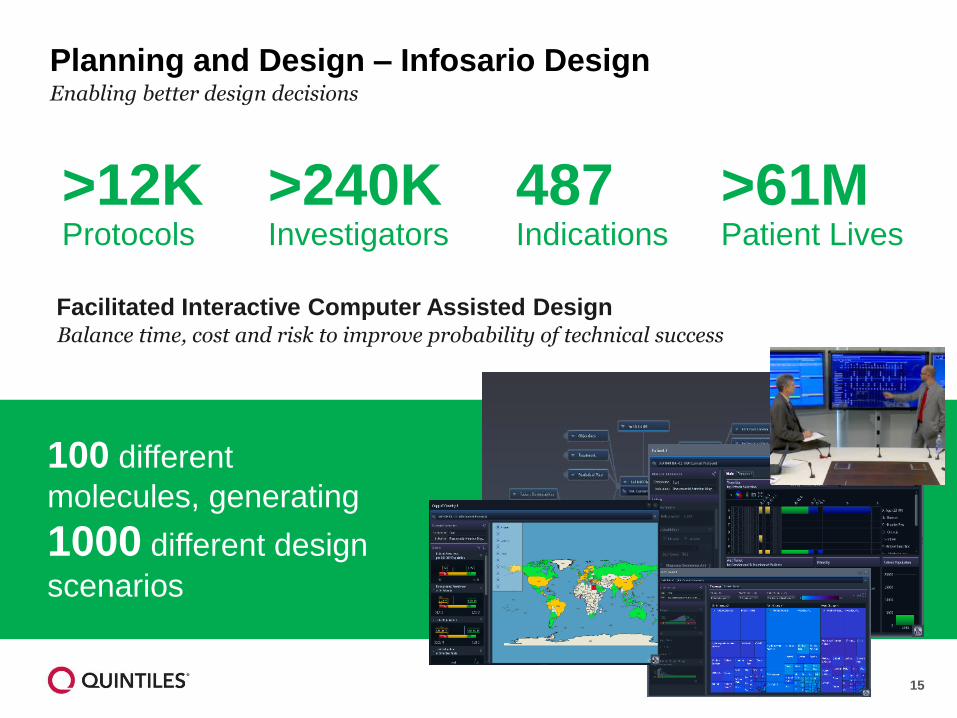
>12KProtocols
>240KInvestigators
487Indications
>61MPatient Lives
100 different
molecules, generating
1000 different design
scenarios
Planning and Design – Infosario DesignEnabling better design decisions
Facilitated Interactive Computer Assisted DesignBalance time, cost and risk to improve probability of technical success
16
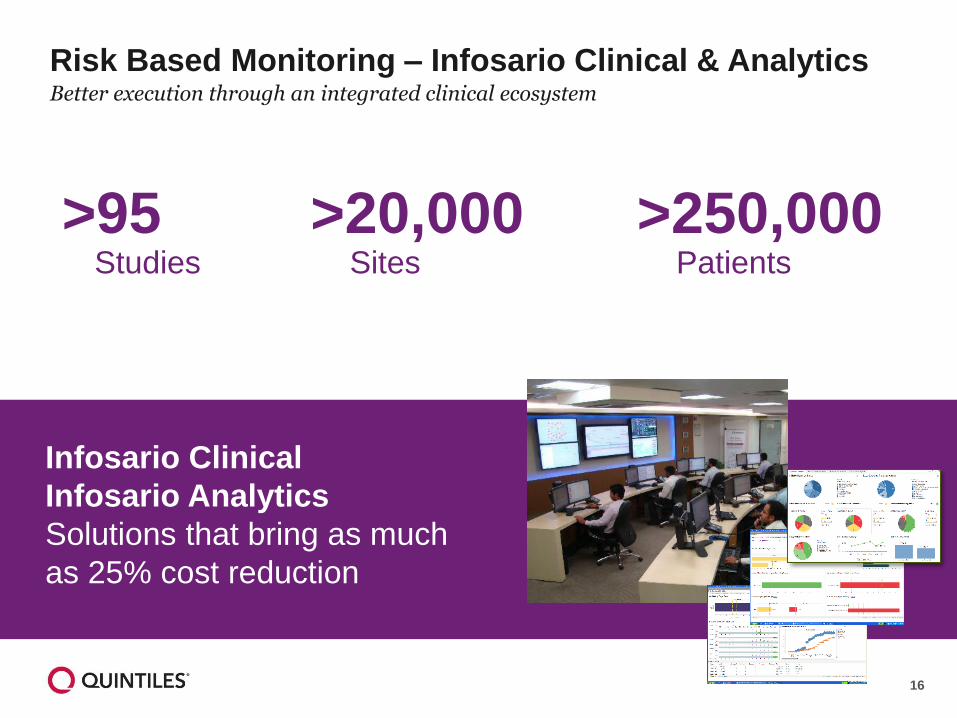
>95 Studies
>20,000Sites
>250,000Patients
Infosario Clinical
Infosario Analytics
Solutions that bring as much
as 25% cost reduction
Risk Based Monitoring – Infosario Clinical & AnalyticsBetter execution through an integrated clinical ecosystem
17
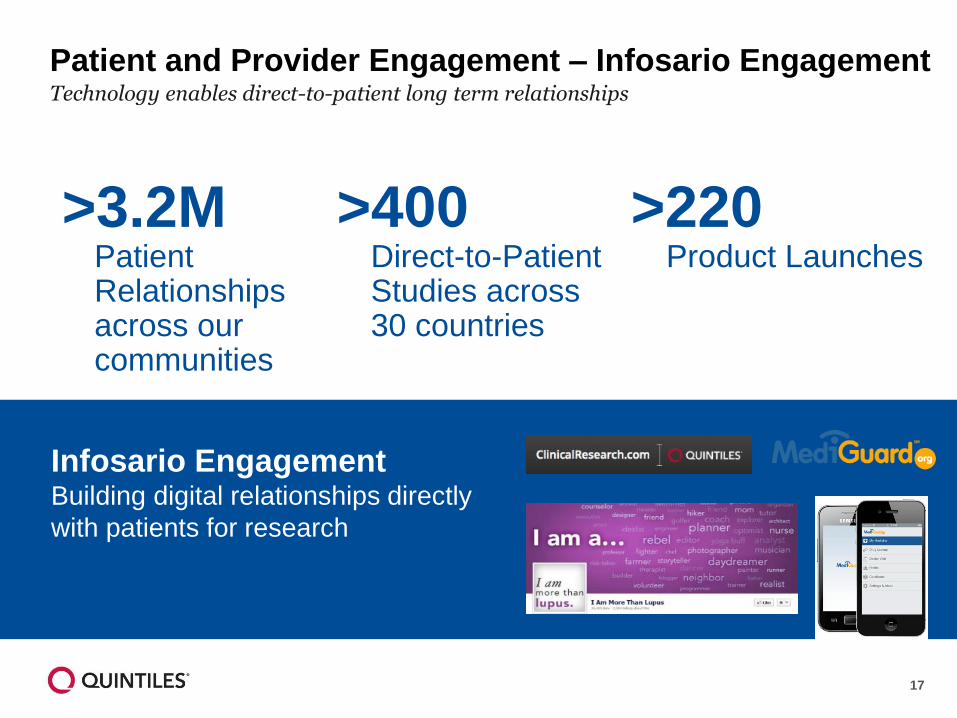
>3.2MPatient Relationships across our communities
>400Direct-to-Patient Studies across30 countries
Infosario EngagementBuilding digital relationships directly
with patients for research
>220Product Launches
Patient and Provider Engagement – Infosario EngagementTechnology enables direct-to-patient long term relationships
18
Recognized for excellence Differentiated through innovation, thought leadership and talent
Industry Leader in Phase
II/III Research
19
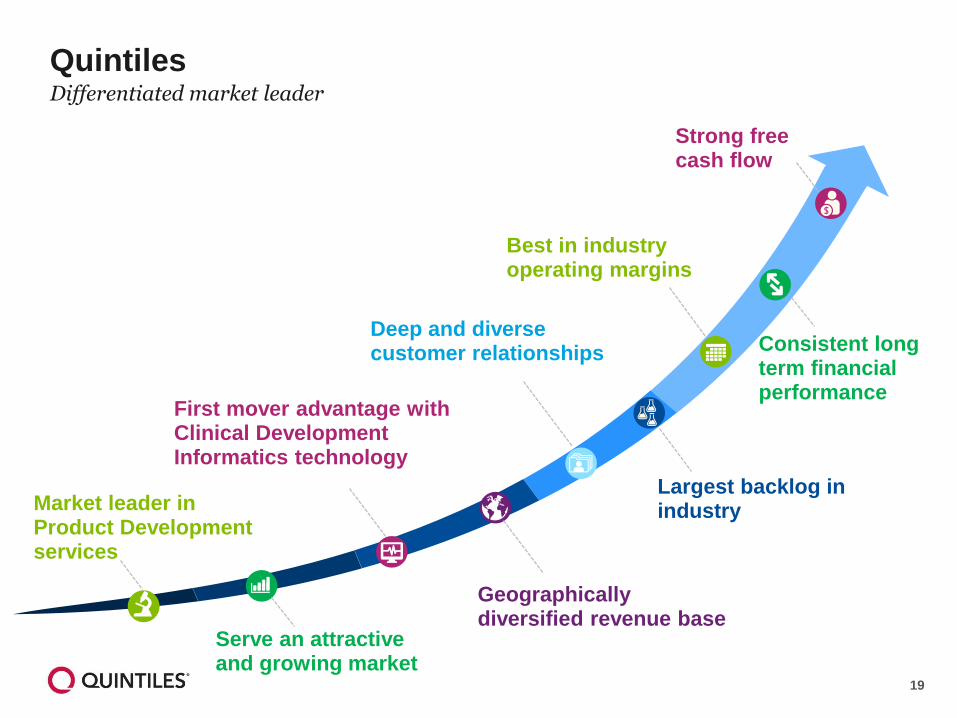
QuintilesDifferentiated market leader
Market leader in Product Development services
Deep and diverse customer relationships
Serve an attractive and growing market
Geographically diversified revenue base
Strong free cash flow
First mover advantage with Clinical Development Informatics technology
Largest backlog in industry
Best in industry operating margins
Consistent long term financial performance

20
Appendix
21
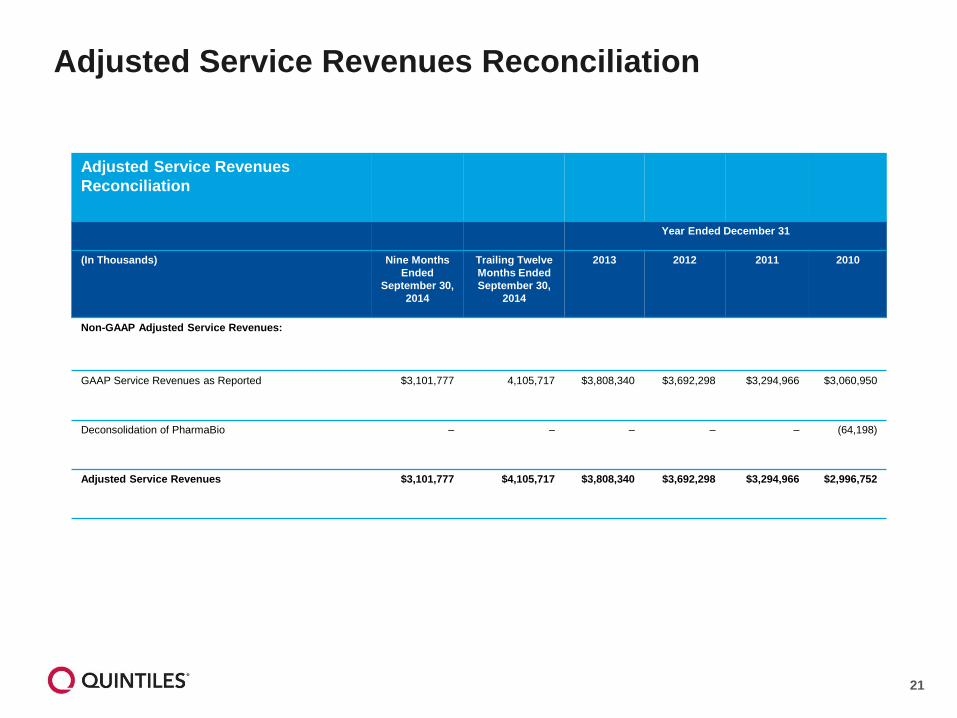
Adjusted Service Revenues Reconciliation
Adjusted Service Revenues
Reconciliation
Year Ended December 31
(In Thousands) Nine Months
Ended
September 30,
2014
Trailing Twelve
Months Ended
September 30,
2014
2013 2012 2011 2010
Non-GAAP Adjusted Service Revenues:
GAAP Service Revenues as Reported $3,101,777 4,105,717 $3,808,340 $3,692,298 $3,294,966 $3,060,950
Deconsolidation of PharmaBio – – – – – (64,198)
Adjusted Service Revenues $3,101,777 $4,105,717 $3,808,340 $3,692,298 $3,294,966 $2,996,752
22
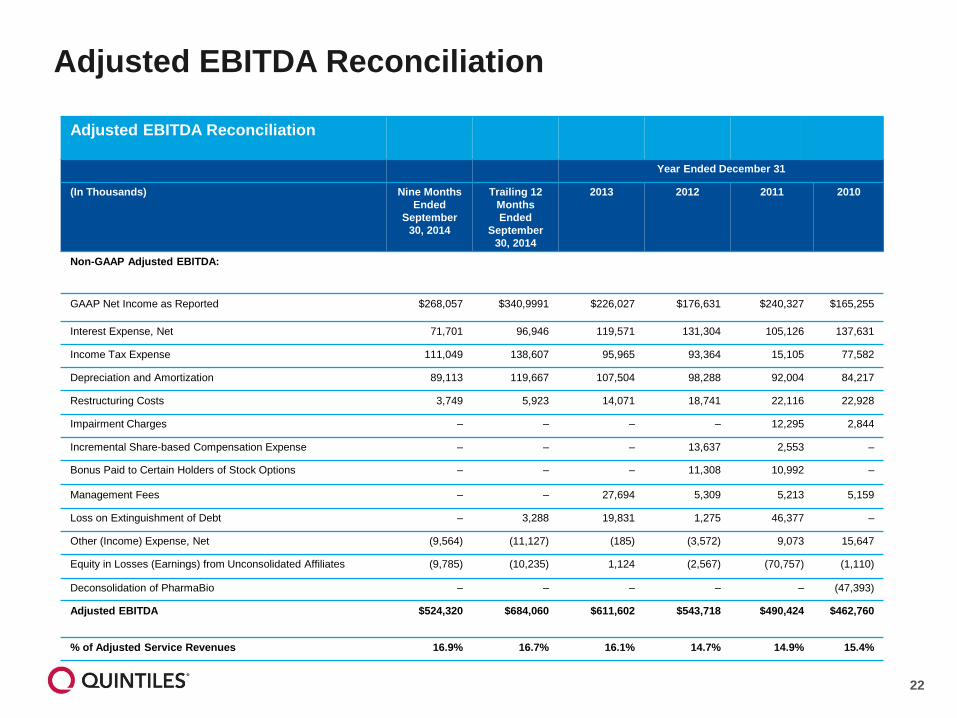
Adjusted EBITDA Reconciliation
Adjusted EBITDA Reconciliation
Year Ended December 31
(In Thousands) Nine Months
Ended
September
30, 2014
Trailing 12
Months
Ended
September
30, 2014
2013 2012 2011 2010
Non-GAAP Adjusted EBITDA:
GAAP Net Income as Reported $268,057 $340,9991 $226,027 $176,631 $240,327 $165,255
Interest Expense, Net 71,701 96,946 119,571 131,304 105,126 137,631
Income Tax Expense 111,049 138,607 95,965 93,364 15,105 77,582
Depreciation and Amortization 89,113 119,667 107,504 98,288 92,004 84,217
Restructuring Costs 3,749 5,923 14,071 18,741 22,116 22,928
Impairment Charges – – – – 12,295 2,844
Incremental Share-based Compensation Expense – – – 13,637 2,553 –
Bonus Paid to Certain Holders of Stock Options – – – 11,308 10,992 –
Management Fees – – 27,694 5,309 5,213 5,159
Loss on Extinguishment of Debt – 3,288 19,831 1,275 46,377 –
Other (Income) Expense, Net (9,564) (11,127) (185) (3,572) 9,073 15,647
Equity in Losses (Earnings) from Unconsolidated Affiliates (9,785) (10,235) 1,124 (2,567) (70,757) (1,110)
Deconsolidation of PharmaBio – – – – – (47,393)
Adjusted EBITDA $524,320 $684,060 $611,602 $543,718 $490,424 $462,760
% of Adjusted Service Revenues 16.9% 16.7% 16.1% 14.7% 14.9% 15.4%
23
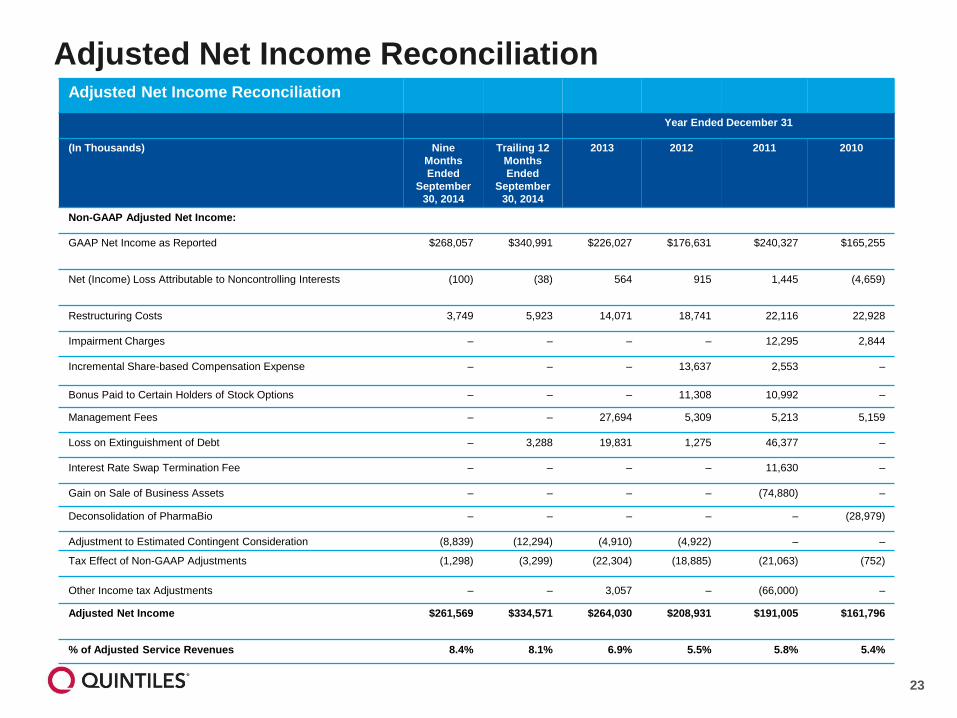
Adjusted Net Income ReconciliationAdjusted Net Income Reconciliation
Year Ended December 31
(In Thousands) Nine
Months
Ended
September
30, 2014
Trailing 12
Months
Ended
September
30, 2014
2013 2012 2011 2010
Non-GAAP Adjusted Net Income:
GAAP Net Income as Reported $268,057 $340,991 $226,027 $176,631 $240,327 $165,255
Net (Income) Loss Attributable to Noncontrolling Interests (100) (38) 564 915 1,445 (4,659)
Restructuring Costs 3,749 5,923 14,071 18,741 22,116 22,928
Impairment Charges – – – – 12,295 2,844
Incremental Share-based Compensation Expense – – – 13,637 2,553 –
Bonus Paid to Certain Holders of Stock Options – – – 11,308 10,992 –
Management Fees – – 27,694 5,309 5,213 5,159
Loss on Extinguishment of Debt – 3,288 19,831 1,275 46,377 –
Interest Rate Swap Termination Fee – – – – 11,630 –
Gain on Sale of Business Assets – – – – (74,880) –
Deconsolidation of PharmaBio – – – – – (28,979)
Adjustment to Estimated Contingent Consideration (8,839) (12,294) (4,910) (4,922) – –
Tax Effect of Non-GAAP Adjustments (1,298) (3,299) (22,304) (18,885) (21,063) (752)
Other Income tax Adjustments – – 3,057 – (66,000) –
Adjusted Net Income $261,569 $334,571 $264,030 $208,931 $191,005 $161,796
% of Adjusted Service Revenues 8.4% 8.1% 6.9% 5.5% 5.8% 5.4%
24
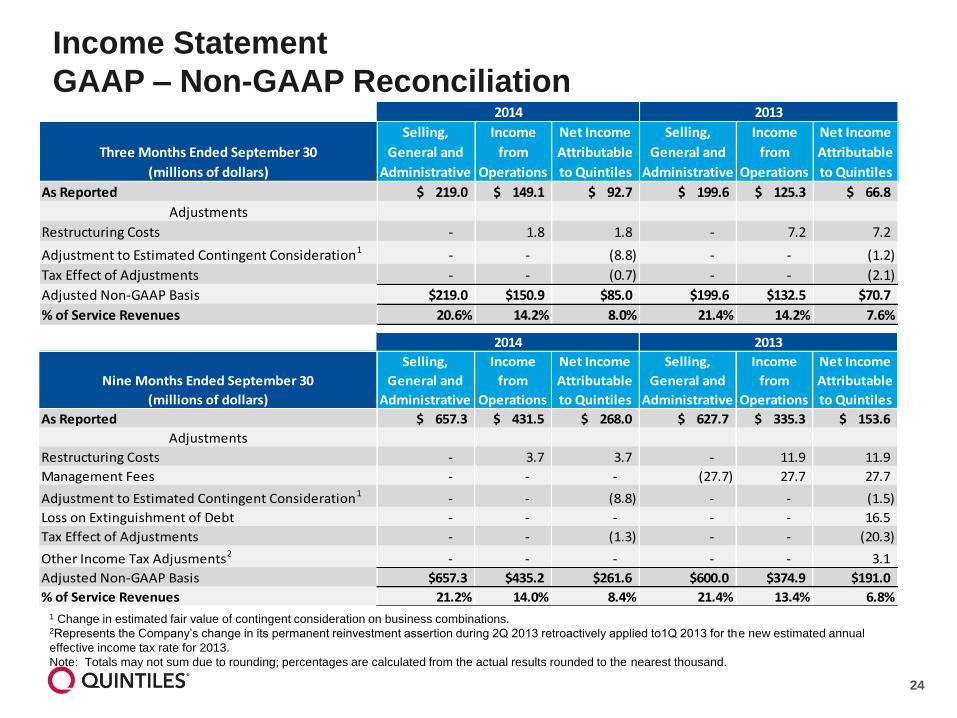
1 Change in estimated fair value of contingent consideration on business combinations. 2Represents the Company’s change in its permanent reinvestment assertion during 2Q 2013 retroactively applied to1Q 2013 for the new estimated annual
effective income tax rate for 2013.
Note: Totals may not sum due to rounding; percentages are calculated from the actual results rounded to the nearest thousand.
Income Statement
GAAP – Non-GAAP Reconciliation
Nine Months Ended September 30
(millions of dollars)
Selling,
General and
Administrative
Income
from
Operations
Net Income
Attributable
to Quintiles
Selling,
General and
Administrative
Income
from
Operations
Net Income
Attributable
to Quintiles
As Reported $ 657.3 $ 431.5 $ 268.0 $ 627.7 $ 335.3 $ 153.6
Adjustments
Restructuring Costs - 3.7 3.7 - 11.9 11.9
Management Fees - - - (27.7) 27.7 27.7
Adjustment to Estimated Contingent Consideration1 - - (8.8) - - (1.5)
Loss on Extinguishment of Debt - - - - - 16.5
Tax Effect of Adjustments - - (1.3) - - (20.3)
Other Income Tax Adjusments2 - - - - - 3.1
Adjusted Non-GAAP Basis $657.3 $435.2 $261.6 $600.0 $374.9 $191.0
% of Service Revenues 21.2% 14.0% 8.4% 21.4% 13.4% 6.8%
2014 2013
Three Months Ended September 30
(millions of dollars)
Selling,
General and
Administrative
Income
from
Operations
Net Income
Attributable
to Quintiles
Selling,
General and
Administrative
Income
from
Operations
Net Income
Attributable
to Quintiles
As Reported $ 219.0 $ 149.1 $ 92.7 $ 199.6 $ 125.3 $ 66.8
Adjustments
Restructuring Costs - 1.8 1.8 - 7.2 7.2
Adjustment to Estimated Contingent Consideration1 - - (8.8) - - (1.2)
Tax Effect of Adjustments - - (0.7) - - (2.1)
Adjusted Non-GAAP Basis $219.0 $150.9 $85.0 $199.6 $132.5 $70.7
% of Service Revenues 20.6% 14.2% 8.0% 21.4% 14.2% 7.6%
2014 2013
25
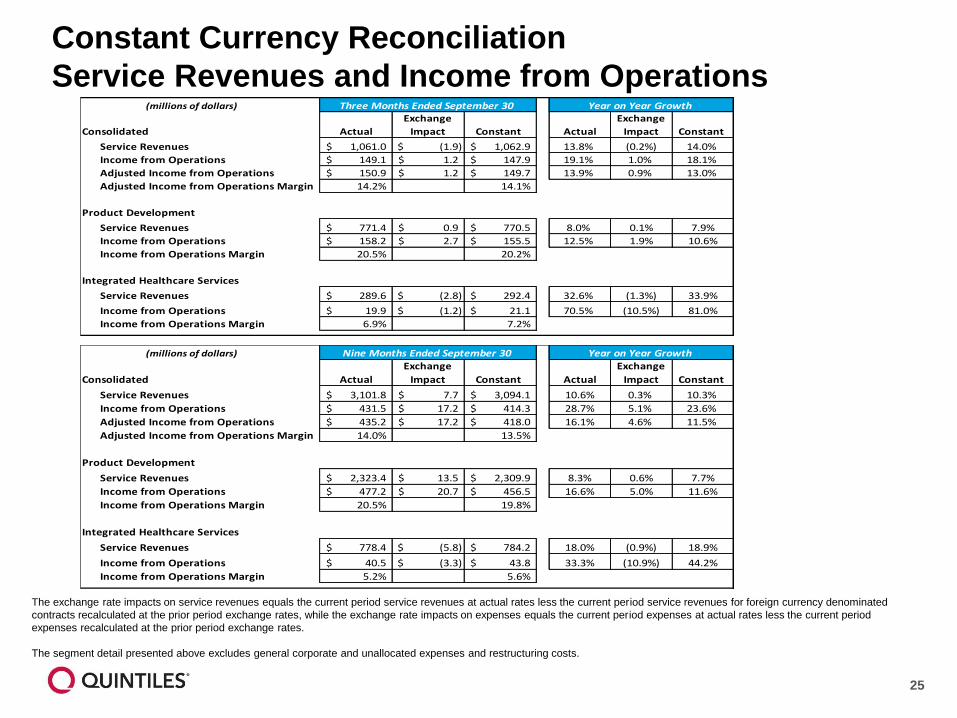
Constant Currency Reconciliation
Service Revenues and Income from Operations
The exchange rate impacts on service revenues equals the current period service revenues at actual rates less the current period service revenues for foreign currency denominated
contracts recalculated at the prior period exchange rates, while the exchange rate impacts on expenses equals the current period expenses at actual rates less the current period
expenses recalculated at the prior period exchange rates.
The segment detail presented above excludes general corporate and unallocated expenses and restructuring costs.
(millions of dollars)
Consolidated Actual
Exchange
Impact Constant Actual
Exchange
Impact Constant
Service Revenues 3,101.8$ 7.7$ 3,094.1$ 10.6% 0.3% 10.3%
Income from Operations 431.5$ 17.2$ 414.3$ 28.7% 5.1% 23.6%
Adjusted Income from Operations 435.2$ 17.2$ 418.0$ 16.1% 4.6% 11.5%
Adjusted Income from Operations Margin 14.0% 13.5%
Product Development
Service Revenues 2,323.4$ 13.5$ 2,309.9$ 8.3% 0.6% 7.7%
Income from Operations 477.2$ 20.7$ 456.5$ 16.6% 5.0% 11.6%
Income from Operations Margin 20.5% 19.8%
Integrated Healthcare Services
Service Revenues 778.4$ (5.8)$ 784.2$ 18.0% (0.9%) 18.9%
Income from Operations 40.5$ (3.3)$ 43.8$ 33.3% (10.9%) 44.2%
Income from Operations Margin 5.2% 5.6%
Year on Year GrowthNine Months Ended September 30
(millions of dollars)
Consolidated Actual
Exchange
Impact Constant Actual
Exchange
Impact Constant
Service Revenues 1,061.0$ (1.9)$ 1,062.9$ 13.8% (0.2%) 14.0%
Income from Operations 149.1$ 1.2$ 147.9$ 19.1% 1.0% 18.1%
Adjusted Income from Operations 150.9$ 1.2$ 149.7$ 13.9% 0.9% 13.0%
Adjusted Income from Operations Margin 14.2% 14.1%
Product Development
Service Revenues 771.4$ 0.9$ 770.5$ 8.0% 0.1% 7.9%
Income from Operations 158.2$ 2.7$ 155.5$ 12.5% 1.9% 10.6%
Income from Operations Margin 20.5% 20.2%
Integrated Healthcare Services
Service Revenues 289.6$ (2.8)$ 292.4$ 32.6% (1.3%) 33.9%
Income from Operations 19.9$ (1.2)$ 21.1$ 70.5% (10.5%) 81.0%
Income from Operations Margin 6.9% 7.2%
Three Months Ended September 30 Year on Year Growth
26
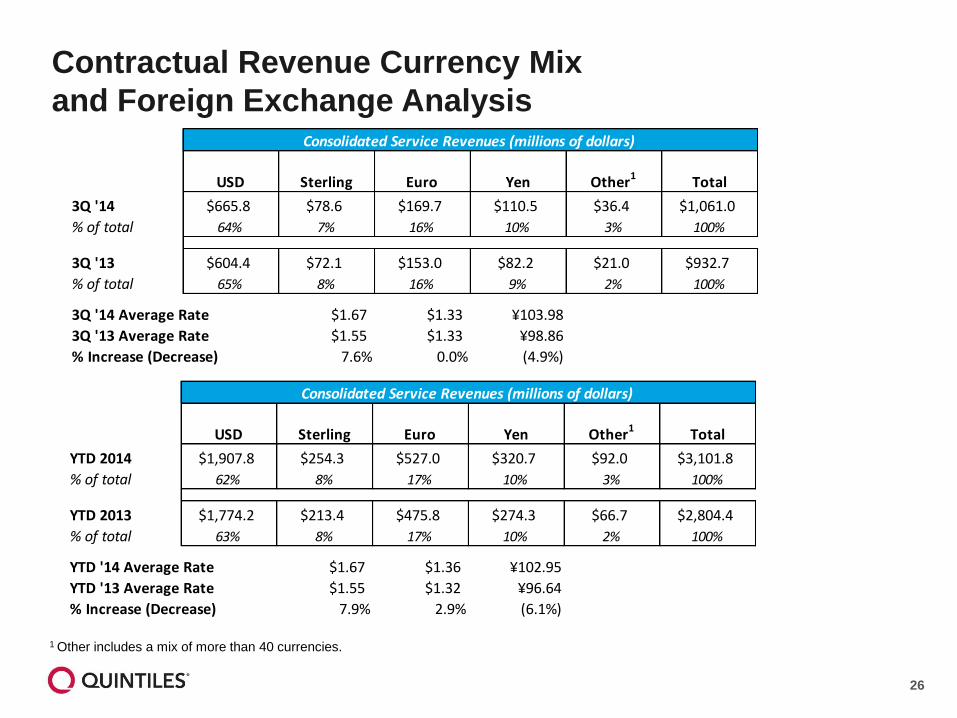
1 Other includes a mix of more than 40 currencies.
Contractual Revenue Currency Mix
and Foreign Exchange Analysis
USD Sterling Euro Yen Other1 Total
YTD 2014 $1,907.8 $254.3 $527.0 $320.7 $92.0 $3,101.8
% of total 62% 8% 17% 10% 3% 100%
YTD 2013 $1,774.2 $213.4 $475.8 $274.3 $66.7 $2,804.4
% of total 63% 8% 17% 10% 2% 100%
YTD '14 Average Rate $1.67 $1.36 ¥102.95
YTD '13 Average Rate $1.55 $1.32 ¥96.64
% Increase (Decrease) 7.9% 2.9% (6.1%)
Consolidated Service Revenues (millions of dollars)
USD Sterling Euro Yen Other1 Total
3Q '14 $665.8 $78.6 $169.7 $110.5 $36.4 $1,061.0
% of total 64% 7% 16% 10% 3% 100%
3Q '13 $604.4 $72.1 $153.0 $82.2 $21.0 $932.7
% of total 65% 8% 16% 9% 2% 100%
3Q '14 Average Rate $1.67 $1.33 ¥103.98
3Q '13 Average Rate $1.55 $1.33 ¥98.86
% Increase (Decrease) 7.6% 0.0% (4.9%)
Consolidated Service Revenues (millions of dollars)
27
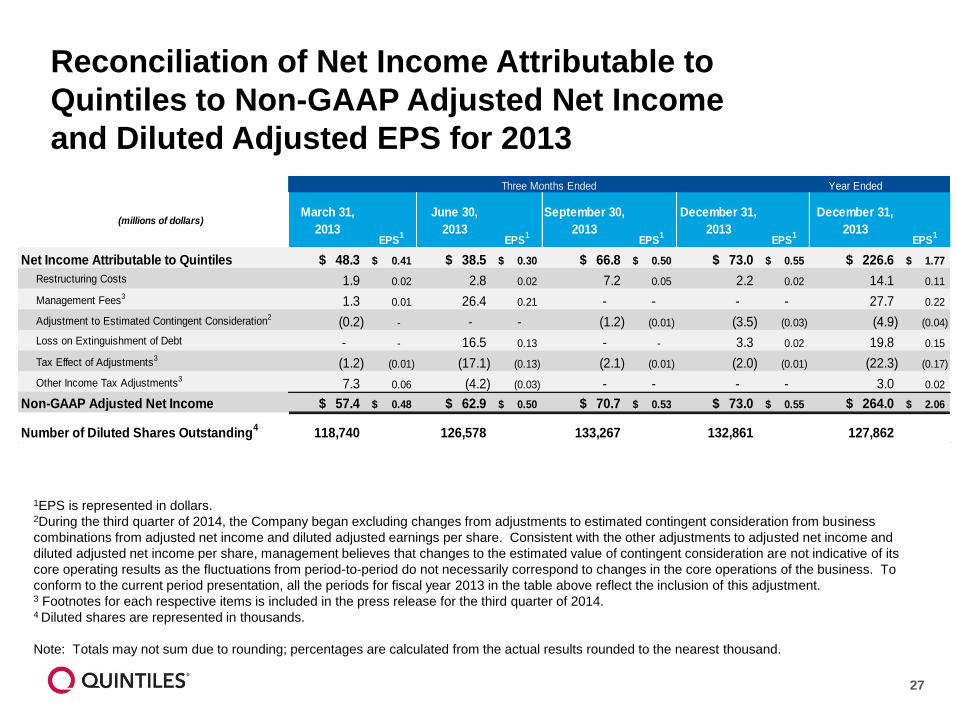
Reconciliation of Net Income Attributable to
Quintiles to Non-GAAP Adjusted Net Income
and Diluted Adjusted EPS for 2013
1EPS is represented in dollars.2During the third quarter of 2014, the Company began excluding changes from adjustments to estimated contingent consideration from business
combinations from adjusted net income and diluted adjusted earnings per share. Consistent with the other adjustments to adjusted net income and
diluted adjusted net income per share, management believes that changes to the estimated value of contingent consideration are not indicative of its
core operating results as the fluctuations from period-to-period do not necessarily correspond to changes in the core operations of the business. To
conform to the current period presentation, all the periods for fiscal year 2013 in the table above reflect the inclusion of this adjustment. 3 Footnotes for each respective items is included in the press release for the third quarter of 2014.4 Diluted shares are represented in thousands.
Note: Totals may not sum due to rounding; percentages are calculated from the actual results rounded to the nearest thousand.
Year Ended
(millions of dollars)March 31,
2013EPS
1
June 30,
2013EPS
1
September 30,
2013EPS
1
December 31,
2013EPS
1
December 31,
2013EPS
1
Net Income Attributable to Quintiles $ 48.3 0.41$ $ 38.5 0.30$ $ 66.8 0.50$ $ 73.0 0.55$ $ 226.6 1.77$
Restructuring Costs 1.9 0.02 2.8 0.02 7.2 0.05 2.2 0.02 14.1 0.11
Management Fees31.3 0.01 26.4 0.21 - - - - 27.7 0.22
Adjustment to Estimated Contingent Consideration2(0.2) - - - (1.2) (0.01) (3.5) (0.03) (4.9) (0.04)
Loss on Extinguishment of Debt - - 16.5 0.13 - - 3.3 0.02 19.8 0.15
Tax Effect of Adjustments3(1.2) (0.01) (17.1) (0.13) (2.1) (0.01) (2.0) (0.01) (22.3) (0.17)
Other Income Tax Adjustments37.3 0.06 (4.2) (0.03) - - - - 3.0 0.02
Non-GAAP Adjusted Net Income $ 57.4 0.48$ $ 62.9 0.50$ $ 70.7 0.53$ $ 73.0 0.55$ $ 264.0 2.06$
Number of Diluted Shares Outstanding4
118,740 126,578 133,267 132,861 127,862
Three Months Ended
Recommended