Journée « Gestion alternative et Imperfections de marché »
Hedge Fund Risk Profiling:A non-linear approach to assess the risk and optimise
Funds of Hedge Funds allocation.
Université d’Evry, 1-2 Avril 2004
Raphaël DouadyResearch Director, Riskdata®
[email protected] www.riskdata.com +33 1 44 54 35 00

2
Evry, April 1, 2004 Journée Gestion Alternative
Hedge Fund Modelling
The Investor Problem
What is the most likely Hedge Fund behaviour under the various market conditions?
What factor or event can put the Hedge Fund at risk?
Is the risk of a portfolio well diversified across the funds
Goal
Build and Rebalance portfolio of Hedge Funds
Select new Hedge Funds to invest in
3
Evry, April 1, 2004 Journée Gestion Alternative
Hedge Fund Modelling
Hedge Funds form asset class different from others
Apparent Statistical Instability
Structural Non-linearity stemming from Dynamic Trading
Usual market factors inefficient to explain returns
Seldom and imprecise information:
Net Asset Value (weekly or monthly, delayed in all cases)
Exposure and sensitivity report
Position transparency only in some cases

4
Evry, April 1, 2004 Journée Gestion Alternative
Hedge Fund Modelling
Methodology
Determine a set of Factors that define the “Market”
Identify, for each Hedge Fund, the Factors that do impact the returns
Build a Proxy of the fund, as a function of each Selected Factor, or of the subset of them
HF return = Proxy + Prediction error
Proxyt = E(HF returnt | Factort U t-1)

5
Evry, April 1, 2004 Journée Gestion Alternative
What Statistical Model for H.F.
Single factor vs. Multi-factor
Factor choice?
Linear vs. Non-linear
Non-linear modelling?
Instantaneous info vs. Lagged
Number of periods for the Fund? For the Factors?
Return series vs. Integrated series
Extreme moves modelling

6
Evry, April 1, 2004 Journée Gestion Alternative
Evaluation Criteria
Explanatory Power
In-sample modelling error
Fund(t) = f(Factor1(t), …, Factorn(t)) + (t)
calibrated on the whole analysis period
Predictive Power
Out-of-sample modelling error
Fund(t) = f(t-1)(Factor1(t), …, Factorn(t)) + (t)
calibrated on [t0, t - 1]

7
Evry, April 1, 2004 Journée Gestion Alternative
Explanation Power
R-square obtained with a Set of 25 Factors – Linear Reg.
TUNA Hedge Fund Indices
Selection of best combination of 5 factors
Factor set:
S&P500, size/style indicesCorp. Bond and HY indicesUS Libor, bond curve, swap curveMSCI World, Emerging marketsFama-FrenchFX BasketCommodity index, Gold, OilS&P optionsS&P historical and implied VolUS T-bond historical vol
STRATEGY Avg R² 5 fact.#periods
Tuna Long Only Average 96.6% 0.2% 0.1%
Tuna Value Average 91.9% 1.2% 0.5%
Tuna Long/Short Hedged Average 91.2% 13.1% 11.2%
Tuna Equity Hedge Aggregate Average 91.1% 13.1% 11.2%
Tuna Hedge Fund Aggregate Average 90.9% 0.0% 0.0%
Tuna Opportunistic Average 90.8% 1.2% 0.8%
Tuna Aggressive Aggregate Average 90.3% 0.1% 0.0%
Tuna Technology Sector Average 89.2% 0.8% 0.3%
Tuna Short Bias Average 88.2% 0.5% 0.5%
Tuna Event Driven Average 87.7% 2.4% 2.8%
Tuna Aggressive Growth Average 87.5% 0.1% 0.0%
Tuna Fund of Funds Average 86.0% 28.1% 24.4%
Tuna Small/Micro Cap Average 83.5% 0.3% 0.0%
Tuna Healthcare Sector Average 83.2% 0.5% 0.2%
Tuna Other Average 83.2% 1.8% 1.0%
Tuna Emerging Markets Average 82.3% 3.4% 2.4%
Tuna Country Specific Average 81.5% 0.4% 0.7%
Tuna MarketTimer Average 78.9% 1.4% 0.6%
Tuna Fixed Income Average 76.8% 1.7% 2.7%
Tuna Market Neutral Average 74.3% 7.5% 13.0%
Tuna Distressed Average 74.2% 2.2% 3.1%
Tuna Finance Sector Average 73.8% 0.4% 0.1%
Tuna Options Strategies Average 67.4% 0.5% 0.3%
Tuna Short-termTrading Average 66.5% 0.4% 0.2%
Tuna Risk Arbitrage Average 66.1% 1.1% 1.0%
Tuna Regulation D Average 60.9% 0.4% 0.1%
Tuna Relative Value Aggregate Average 60.4% 0.8% 1.6%
Tuna Convertible Arbitrage Average 57.1% 4.3% 6.5%
Tuna Macro Average 54.0% 3.1% 4.3%
Tuna Energy Sector Average 52.1% 0.1% 0.0%
Tuna VC / Private Equity Average 49.8% 0.0% 0.0%
Tuna Fixed Income Arbitrage Average 46.3% 2.4% 4.7%
Tuna Statistical Arbitrage Average 46.0% 0.8% 0.3%
Tuna Other Relative Value Average 44.4% 0.8% 1.6%
Tuna Special Situations Average 43.1% 0.2% 0.0%
Tuna Options Arbitrage Average 38.1% 0.5% 0.3%
Tuna CTA Average 36.2% 4.2% 3.6%
10%
80%
11%
9%
% Funds % AUM
76%
14%

8
Evry, April 1, 2004 Journée Gestion Alternative
Risk Profiling: Pairwise Analysis
Question: Does the Risk Factor significantly impacts the fund returns?
Statistical Inference
Sensitivity (Beta)
Convexity (Gamma)
Directional Sensitivities
Conditional Statistics under Up and Down hypotheses
Long-short Equity Europe
-2%
0%
2%
4%
6%
8%
10%
-25% -20% -15% -10% -5% 0% 5% 10% 15% 20%
STOXX Returns
Fund
Ret
urns
= 0 > 0
Beta = 0 does not imply no exposure to Risk Factor

9
Evry, April 1, 2004 Journée Gestion Alternative
Evaluation Criteria
Prediction Power
Correlation between Predicted Series and Actual Returns
Direction Match Probability
Biased if the the Fund average return is ≠ 0
Unbiased measure: Correlation of Sign Series
Prediction Power P2
P2 = 1 – Var(Error) / Var(Return)
Negatively biased because of Spurious Selections
Var(Error) = Var(Specific) + Var(Spurious)

10
Evry, April 1, 2004 Journée Gestion Alternative
State of the Art
Maximum Correlation
Select, in a set of market factors, the factor that is the most correlated to the fund
Proxy the fund by linear regression with respect to this factor
Factor Model / Style Analysis
Determine a fixed factor set
Size limited to the number of data points
Multi-dimensional regression of the Fund returns on this set
Constrain by positive weights for stability (only with directional funds)
Stepwise Regression
Factor set Not Limited
Exposed to Spurious Selections
Still Linear

11
Evry, April 1, 2004 Journée Gestion Alternative
Testing Procedure
Test Pannel (250 funds)
Directional: 75
Non directional: 64
Arbitrage: 32
Special/Event: 24
Aggregates: 23
Other: 22
Random: 10
Hedge Fund Analysis
3Y slipping window
Monthly returns
[Jan 99 – Dec 01]
to [Jan 01 – Dec 03]
Factor set
~200 factors
Equity, IR, Commodity, FX…
Volatility, Correlation, Trend…
13
Evry, April 1, 2004 Journée Gestion Alternative
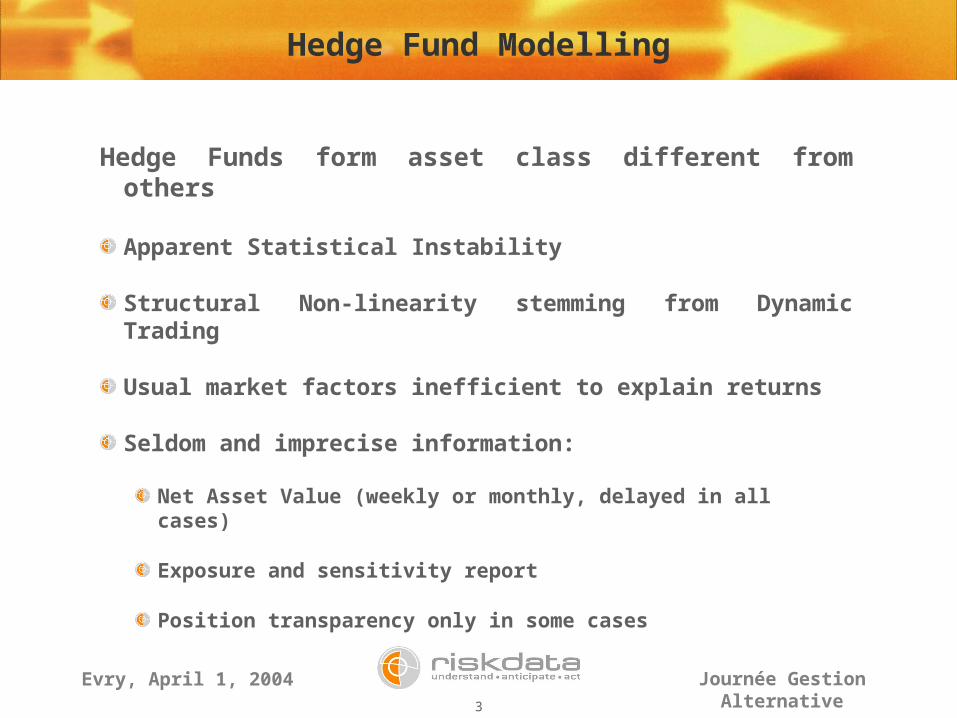
Max Correlation
0%
10%
20%
30%
40%
50%
60%
70%
80%
90%
100%
0.3 0.4 0.5 0.6 0.7 0.8 0.9 1
Selection Rate
Prediction Correlation
P2
Threshold

14
Evry, April 1, 2004 Journée Gestion Alternative
Max Correlation: Prediction Correlation1 2 3 4 5 6 7 8 9
Threshold 0.1 0.2 0.3 0.4 0.5 0.6 0.7 0.8 0.9Strategy Type Nb Funds Correlation 1 Correlation 2 Correlation 3 Correlation 4 Correlation 5 Correlation 6 Correlation 7 Correlation 8 Correlation 9
Total 240 60% 60% 60% 60% 70% 78% 91% 95% 99%Non directional Non directional 64 53% 53% 53% 53% 60% 67% 60% 89% 0%Long/Short Equity Non directional 18 44% 44% 44% 44% 47% 44% 0% 0% 0%CTA/Managed Futures Non directional 14 0% 0% 0% 0% 0% 0% 0% 0% 0%Market Neutral Non directional 17 57% 57% 57% 57% 57% -100% 0% 0% 0%Technology Sector Non directional 3 56% 56% 56% 56% 56% 66% 32% 89% 0%Healthcare Sector Non directional 3 24% 24% 24% 24% -41% 0% 0% 0% 0%Finance Sector Non directional 3 62% 62% 62% 62% 94% 87% 0% 0% 0%Market Neutral Equity Non directional 5 92% 92% 92% 92% 92% 92% 93% 0% 0%Energy Sector Non directional 1 0% 0% 0% 0% 0% 0% 0% 0% 0%Directional Directional 75 67% 67% 67% 67% 74% 80% 93% 95% 99%Test Directional 14 93% 93% 93% 93% 94% 95% 97% 97% 99%Emerging Markets Directional 9 63% 63% 63% 63% 61% 83% 90% 80% 0%Fixed Income (non-arbitrage) Directional 16 24% 24% 24% 24% 52% 100% 0% 0% 0%Opportunistic Directional 9 47% 47% 47% 47% 55% 59% 0% 0% 0%Long Only Directional 6 87% 87% 87% 87% 85% 85% 91% 95% 99%Country Specific Directional 5 75% 75% 75% 75% 75% 43% 87% 0% 0%Short Bias Directional 4 51% 51% 51% 51% 50% 0% 0% 0% 0%Value Directional 6 65% 65% 65% 65% 69% 84% 78% 0% 0%Small/Micro Cap Directional 4 64% 64% 64% 64% 60% 67% 0% 0% 0%Aggressive Growth Directional 2 43% 43% 43% 43% 44% 33% 0% 0% 0%Aggregate Aggregate 23 23% 23% 23% 23% 45% 62% 0% 0% 0%Fund of Funds Aggregate 17 -13% -13% -13% -13% -77% 0% 0% 0% 0%AGGREGATE Aggregate 3 50% 50% 50% 50% 54% -66% 0% 0% 0%Multi-Strategy Aggregate 2 86% 86% 86% 86% 86% 87% 0% 0% 0%Fund of Funds - Multi-Strategy Aggregate 1 0% 0% 0% 0% 0% 0% 0% 0% 0%Special/Event Special/Event 24 44% 44% 44% 44% 60% 76% 84% 0% 0%Event Driven Special/Event 5 39% 39% 39% 39% 71% 74% 0% 0% 0%Distressed Special/Event 8 65% 65% 65% 65% 87% 79% 84% 0% 0%Merger/Risk Arbitrage Special/Event 6 -3% -3% -3% -3% 47% 0% 0% 0% 0%Regulation D Special/Event 2 0% 0% 0% 0% 0% 0% 0% 0% 0%Special Situations Special/Event 3 61% 61% 61% 61% 3% 0% 0% 0% 0%Arbitrage Arbitrage 32 82% 82% 82% 82% 82% 82% 43% 0% 0%Convertible Arbitrage Arbitrage 11 0% 0% 0% 0% 0% 0% 0% 0% 0%Fixed Income Arbitrage Arbitrage 7 0% 0% 0% 0% 0% 0% 0% 0% 0%Other Arbitrage Arbitrage 5 0% 0% 0% 0% 0% 0% 0% 0% 0%Statistical Arbitrage Arbitrage 8 82% 82% 82% 82% 82% 82% 43% 0% 0%Options Strategies Arbitrage 1 0% 0% 0% 0% 0% 0% 0% 0% 0%Options Arbitrage Arbitrage 0 0% 0% 0% 0% 0% 0% 0% 0% 0%Other Other 22 66% 66% 66% 66% 64% 61% 0% 0% 0%Macro Other 9 74% 74% 74% 74% 74% 72% 0% 0% 0%Other Other 7 67% 67% 67% 67% 57% 51% 0% 0% 0%Short-term Trading Other 3 0% 0% 0% 0% 0% 0% 0% 0% 0%Market Timer Other 2 48% 48% 48% 48% 0% 0% 0% 0% 0%VC Private Equity Other 1 100% 100% 100% 100% 0% 0% 0% 0% 0%Random Random 10 0% 0% 0% 0% 0% 0% 0% 0% 0%
15
Evry, April 1, 2004 Journée Gestion Alternative
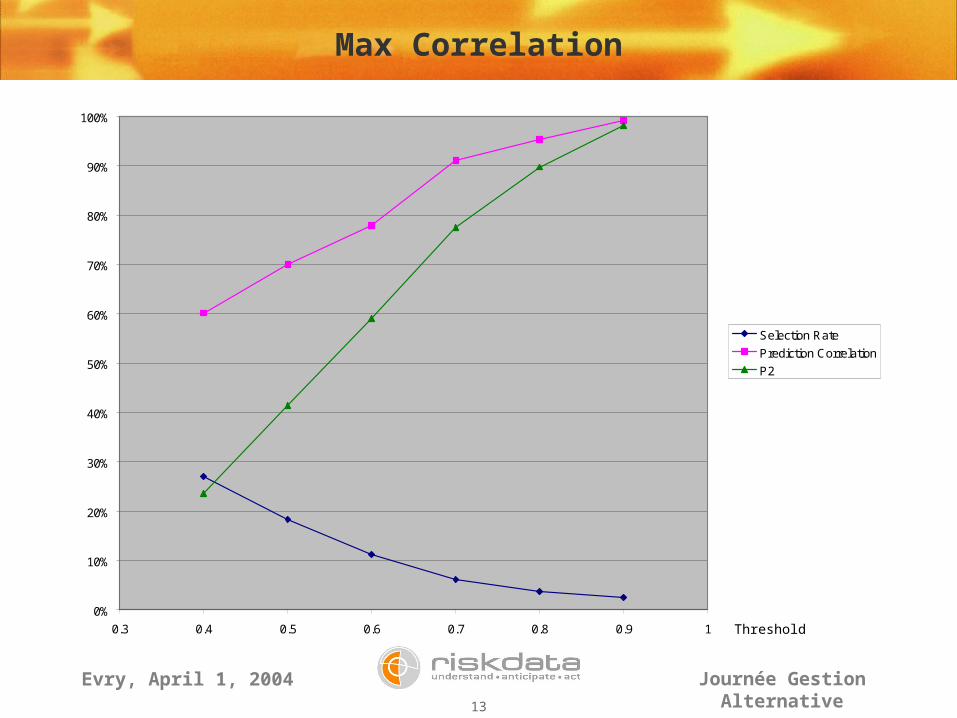
Max Correlation: Selection RateThreshold 0.1 0.2 0.3 0.4 0.5 0.6 0.7 0.8
Strategy Type Nb Funds Correlation 1 Correlation 2 Correlation 3 Correlation 4 Correlation 5 Correlation 6 Correlation 7 Correlation 8
Total 240 27% 27% 27% 27% 18% 11% 6% 4%Non directional Non directional 64 18% 18% 18% 18% 10% 5% 1% 0%Long/Short Equity Non directional 18 28% 28% 28% 28% 11% 4% 0% 0%CTA/Managed Futures Non directional 14 0% 0% 0% 0% 0% 0% 0% 0%Market Neutral Non directional 17 12% 12% 12% 12% 5% 0% 0% 0%Technology Sector Non directional 3 52% 52% 52% 52% 52% 38% 17% 8%Healthcare Sector Non directional 3 15% 15% 15% 15% 7% 0% 0% 0%Finance Sector Non directional 3 42% 42% 42% 42% 29% 18% 0% 0%Market Neutral Equity Non directional 5 16% 16% 16% 16% 16% 16% 8% 0%Energy Sector Non directional 1 0% 0% 0% 0% 0% 0% 0% 0%Directional Directional 75 49% 49% 49% 49% 37% 25% 15% 10%Test Directional 14 56% 56% 56% 56% 53% 50% 45% 43%Emerging Markets Directional 9 58% 58% 58% 58% 31% 19% 13% 6%Fixed Income (non-arbitrage) Directional 16 18% 18% 18% 18% 12% 1% 0% 0%Opportunistic Directional 9 41% 41% 41% 41% 23% 5% 0% 0%Long Only Directional 6 77% 77% 77% 77% 74% 68% 35% 16%Country Specific Directional 5 62% 62% 62% 62% 62% 48% 33% 0%Short Bias Directional 4 41% 41% 41% 41% 10% 0% 0% 0%Value Directional 6 67% 67% 67% 67% 43% 22% 6% 0%Small/Micro Cap Directional 4 59% 59% 59% 59% 47% 25% 0% 0%Aggressive Growth Directional 2 79% 79% 79% 79% 52% 29% 2% 0%Aggregate Aggregate 23 21% 21% 21% 21% 9% 3% 0% 0%Fund of Funds Aggregate 17 15% 15% 15% 15% 2% 0% 0% 0%AGGREGATE Aggregate 3 43% 43% 43% 43% 29% 4% 0% 0%Multi-Strategy Aggregate 2 46% 46% 46% 46% 46% 31% 2% 0%Fund of Funds - Multi-Strategy Aggregate 1 0% 0% 0% 0% 0% 0% 0% 0%Special/Event Special/Event 24 21% 21% 21% 21% 10% 4% 1% 0%Event Driven Special/Event 5 32% 32% 32% 32% 16% 11% 0% 0%Distressed Special/Event 8 21% 21% 21% 21% 9% 6% 4% 0%Merger/Risk Arbitrage Special/Event 6 16% 16% 16% 16% 8% 0% 0% 0%Regulation D Special/Event 2 0% 0% 0% 0% 0% 0% 0% 0%Special Situations Special/Event 3 28% 28% 28% 28% 14% 0% 0% 0%Arbitrage Arbitrage 32 3% 3% 3% 3% 2% 2% 1% 0%Convertible Arbitrage Arbitrage 11 0% 0% 0% 0% 0% 0% 0% 0%Fixed Income Arbitrage Arbitrage 7 0% 0% 0% 0% 0% 0% 0% 0%Other Arbitrage Arbitrage 5 0% 0% 0% 0% 0% 0% 0% 0%Statistical Arbitrage Arbitrage 8 10% 10% 10% 10% 10% 10% 3% 0%Options Strategies Arbitrage 1 4% 4% 4% 4% 0% 0% 0% 0%Options Arbitrage Arbitrage 0 0% 0% 0% 0% 0% 0% 0% 0%Other Other 22 13% 13% 13% 13% 9% 2% 0% 0%Macro Other 9 8% 8% 8% 8% 8% 3% 0% 0%Other Other 7 23% 23% 23% 23% 18% 4% 0% 0%Short-term Trading Other 3 0% 0% 0% 0% 0% 0% 0% 0%Market Timer Other 2 27% 27% 27% 27% 2% 0% 0% 0%VC Private Equity Other 1 8% 8% 8% 8% 0% 0% 0% 0%Random Random 10 0% 0% 0% 0% 0% 0% 0% 0%

16
Evry, April 1, 2004 Journée Gestion Alternative
Stepwise Regression: Prediction CorrelationThreshold 1.5 2.7 5 10 25 50
Strategy Type Nb Funds Stepwise L 1 Stepwise L 2 Stepwise L 3 Stepwise L 4 Stepwise L 5 Stepwise L 6
Total 240 36% 36% 39% 40% 39% 38%Non directional Non directional 64 33% 33% 33% 33% 31% 30%Long/Short Equity Non directional 18 31% 31% 29% 26% 28% 28%CTA/Managed Futures Non directional 14 29% 29% 30% 36% 31% 31%Market Neutral Non directional 17 30% 30% 28% 24% 25% 24%Technology Sector Non directional 3 43% 41% 35% 36% 20% 20%Healthcare Sector Non directional 3 7% 6% 22% 33% 41% 41%Finance Sector Non directional 3 60% 60% 57% 62% 44% 40%Market Neutral Equity Non directional 5 49% 51% 65% 61% 55% 56%Energy Sector Non directional 1 48% 47% 47% 44% 44% 44%Directional Directional 75 54% 54% 58% 64% 62% 62%Test Directional 14 91% 92% 93% 94% 94% 94%Emerging Markets Directional 9 43% 43% 46% 60% 58% 58%Fixed Income (non-arbitrage) Directional 16 29% 29% 35% 46% 44% 44%Opportunistic Directional 9 40% 39% 42% 42% 31% 31%Long Only Directional 6 78% 78% 80% 86% 89% 88%Country Specific Directional 5 41% 42% 47% 54% 56% 56%Short Bias Directional 4 70% 70% 71% 71% 76% 76%Value Directional 6 59% 60% 60% 66% 68% 67%Small/Micro Cap Directional 4 45% 46% 55% 59% 54% 52%Aggressive Growth Directional 2 42% 42% 46% 49% 31% 31%Aggregate Aggregate 23 49% 50% 48% 46% 40% 39%Fund of Funds Aggregate 17 44% 45% 44% 45% 39% 39%AGGREGATE Aggregate 3 74% 74% 68% 66% 55% 54%Multi-Strategy Aggregate 2 81% 83% 82% 87% 85% 85%Fund of Funds - Multi-Strategy Aggregate 1 32% 32% 27% -21% -33% -33%Special/Event Special/Event 24 33% 33% 41% 42% 39% 39%Event Driven Special/Event 5 53% 54% 59% 60% 55% 55%Distressed Special/Event 8 26% 26% 35% 43% 45% 45%Merger/Risk Arbitrage Special/Event 6 41% 42% 37% 19% 11% 11%Regulation D Special/Event 2 -26% -33% 19% 34% 37% 37%Special Situations Special/Event 3 28% 28% 45% 63% 60% 60%Arbitrage Arbitrage 32 13% 12% 12% 7% 7% 7%Convertible Arbitrage Arbitrage 11 16% 16% 15% 3% 5% 5%Fixed Income Arbitrage Arbitrage 7 6% 8% 6% 2% 3% 3%Other Arbitrage Arbitrage 5 0% 0% 0% 1% 11% 11%Statistical Arbitrage Arbitrage 8 17% 16% 15% 14% 12% 12%Options Strategies Arbitrage 1 45% 42% 63% 39% 14% 15%Options Arbitrage Arbitrage 0 0% 0% 0% 0% 0% 0%Other Other 22 3% 4% 10% 13% 12% 12%Macro Other 9 1% 2% 3% 5% 3% 4%Other Other 7 28% 28% 33% 30% 30% 30%Short-term Trading Other 3 -30% -23% -26% -17% -19% -19%Market Timer Other 2 -42% -43% 7% 45% 47% 47%VC Private Equity Other 1 32% 33% 11% -23% -36% -36%Random Random 10 10% 12% 9% 0% 0% 1%

17
Evry, April 1, 2004 Journée Gestion Alternative
Stepwise Regression: P2Threshold 1.5 2.7 5 10 25 50
Strategy Type Nb Funds Stepwise L 1 Stepwise L 2 Stepwise L 3 Stepwise L 4 Stepwise L 5 Stepwise L 6
Total 240 -50% -49% -34% -11% -8% -8%Non directional Non directional 64 -65% -65% -52% -24% -21% -22%Long/Short Equity Non directional 18 -67% -67% -56% -39% -31% -31%CTA/Managed Futures Non directional 14 -73% -73% -53% -7% -5% -5%Market Neutral Non directional 17 -65% -65% -57% -34% -24% -25%Technology Sector Non directional 3 -32% -31% -9% 7% -23% -23%Healthcare Sector Non directional 3 -100% -100% -62% -40% -46% -46%Finance Sector Non directional 3 -58% -57% -19% -1% -10% -17%Market Neutral Equity Non directional 5 -24% -26% -44% -13% -20% -20%Energy Sector Non directional 1 -100% -100% -100% -1% -1% -1%Directional Directional 75 -19% -17% -3% 21% 23% 23%Test Directional 14 76% 77% 80% 83% 83% 81%Emerging Markets Directional 9 -54% -55% -44% 1% 9% 9%Fixed Income (non-arbitrage) Directional 16 -69% -69% -44% -8% -7% -6%Opportunistic Directional 9 -59% -61% -43% -22% -33% -30%Long Only Directional 6 56% 54% 60% 73% 79% 78%Country Specific Directional 5 -64% -63% -29% -3% 17% 18%Short Bias Directional 4 -20% -19% 8% 23% 50% 50%Value Directional 6 -8% -5% 11% 26% 35% 35%Small/Micro Cap Directional 4 -14% -13% -6% 11% 4% 4%Aggressive Growth Directional 2 -57% -59% -67% -17% -51% -51%Aggregate Aggregate 23 -54% -53% -45% -22% -21% -22%Fund of Funds Aggregate 17 -65% -64% -53% -29% -23% -24%AGGREGATE Aggregate 3 -13% -7% -20% 21% -14% -15%Multi-Strategy Aggregate 2 65% 69% 68% 67% 63% 63%Fund of Funds - Multi-Strategy Aggregate 1 -100% -100% -100% -100% -100% -100%Special/Event Special/Event 24 -53% -54% -29% -9% -9% -9%Event Driven Special/Event 5 -38% -35% -3% 9% -1% -1%Distressed Special/Event 8 -34% -35% -10% 16% 18% 19%Merger/Risk Arbitrage Special/Event 6 -82% -82% -76% -71% -65% -65%Regulation D Special/Event 2 -92% -100% -49% -22% -27% -27%Special Situations Special/Event 3 -55% -63% -13% 37% 37% 37%Arbitrage Arbitrage 32 -82% -81% -71% -44% -35% -35%Convertible Arbitrage Arbitrage 11 -71% -71% -62% -44% -35% -35%Fixed Income Arbitrage Arbitrage 7 -82% -80% -78% -47% -43% -43%Other Arbitrage Arbitrage 5 -94% -90% -93% -49% -28% -28%Statistical Arbitrage Arbitrage 8 -90% -90% -73% -47% -33% -33%Options Strategies Arbitrage 1 -91% -94% 20% 0% -23% -21%Options Arbitrage Arbitrage 0 0% 0% 0% 0% 0% 0%Other Other 22 -80% -79% -63% -43% -41% -40%Macro Other 9 -76% -76% -62% -43% -44% -43%Other Other 7 -71% -71% -48% -27% -28% -28%Short-term Trading Other 3 -100% -100% -100% -80% -80% -80%Market Timer Other 2 -100% -100% -52% -29% 4% 4%VC Private Equity Other 1 -52% -51% -100% -100% -100% -100%Random Random 10 -79% -79% -62% -31% -24% -23%

18
Evry, April 1, 2004 Journée Gestion Alternative
Other Selection Methods
Non linear regression: F-test, Log-likelihood
Causality (non linear VARMA): F-test
Cointegration. Non linear factor: ∫ Factt² dt
P2
Direction Match
Joint occurrence of Extreme Moves

19
Evry, April 1, 2004 Journée Gestion Alternative
Selection Method Comparison: Prediction Correlation (1 fact)Threshold 10 0.6 0.6 0.4 0.6 0.5 0.9 0.5 0.7
Strategy Type Nb Funds Stepwise Linear Correlation Regression PLReg PL + Bucket Shape Causality
Causality + Bucket Shape Co-integration Prediction Power
Predicted Direction
Total 240 -11% 59% 4% 26% 46% 48% 82% 34% 7%Non directional Non directional 64 -24% 38% -65% -15% 6% 20% 94% 7% -14%Long/Short Equity Non directional 18 -39% 3% -81% -24% -56% 14% 0% -8% -8%CTA/Managed Futures Non directional 14 -7% 0% -83% -19% 0% -11% 0% 6% -7%Market Neutral Non directional 17 -34% 0% -47% -100% 11% -17% 0% -20% -41%Technology Sector Non directional 3 7% 34% -55% -4% 55% 30% 94% 68% -1%Healthcare Sector Non directional 3 -40% 0% -100% 0% 0% -100% 0% 27% -100%Finance Sector Non directional 3 -1% 22% 0% -4% 40% 34% 0% -37% -71%Market Neutral Equity Non directional 5 -13% 84% -14% 64% 76% 76% 0% 90% 68%Energy Sector Non directional 1 -1% 0% 0% 0% 0% 0% 0% 21% 0%Directional Directional 75 21% 64% 43% 49% 53% 58% 93% 49% 33%Test Directional 14 83% 91% 62% 77% 79% 93% 97% 83% 85%Emerging Markets Directional 9 1% 66% 68% 39% 60% 38% 0% 11% -20%Fixed Income (non-arbitrage) Directional 16 -8% 0% -87% -15% -13% -44% 0% 15% 2%Opportunistic Directional 9 -22% -9% -44% 3% -1% 39% 0% 0% -11%Long Only Directional 6 73% 66% 88% 69% 70% 72% 98% 73% 60%Country Specific Directional 5 -3% 20% 65% 66% 59% 54% -45% 36% -28%Short Bias Directional 4 23% 0% 58% 32% 30% 52% 0% 69% 46%Value Directional 6 26% 69% -55% 18% 6% 14% 0% 24% 32%Small/Micro Cap Directional 4 11% 42% -100% -20% 37% 61% 0% 30% 17%Aggressive Growth Directional 2 -17% -13% -100% -31% -10% -29% 0% 35% 13%Aggregate Aggregate 23 -22% 49% -84% -24% 37% 23% -100% 16% -32%Fund of Funds Aggregate 17 -29% 0% -100% -48% 17% -30% -100% -4% -42%AGGREGATE Aggregate 3 21% -36% -7% -96% 60% 55% 0% 42% -63%Multi-Strategy Aggregate 2 67% 66% 0% 70% 52% 51% 0% 69% 59%Fund of Funds - Multi-Strategy Aggregate 1 -100% 0% 0% 0% 0% 0% 0% 0% 0%Special/Event Special/Event 24 -9% 45% -71% -18% 26% -29% -100% 17% -8%Event Driven Special/Event 5 9% 33% -100% -34% 16% -37% 0% 25% -10%Distressed Special/Event 8 16% 60% -24% 24% 69% 5% 0% 42% 2%Merger/Risk Arbitrage Special/Event 6 -71% 0% 0% -5% -100% -100% -100% -7% 30%Regulation D Special/Event 2 -22% 0% 0% 0% 0% 0% 0% 0% -100%Special Situations Special/Event 3 37% 0% -100% 0% 0% 0% 0% -5% -28%Arbitrage Arbitrage 32 -44% 51% -54% -80% 49% 47% 0% -17% -43%Convertible Arbitrage Arbitrage 11 -44% 0% -41% -100% 0% 0% 0% -100% -51%Fixed Income Arbitrage Arbitrage 7 -47% 0% -65% -100% 0% 0% 0% -54% -25%Other Arbitrage Arbitrage 5 -49% 0% -52% -93% 0% 0% 0% 0% -100%Statistical Arbitrage Arbitrage 8 -47% 51% -48% -26% 49% 47% 0% 57% -11%Options Strategies Arbitrage 1 0% 0% 0% 0% 0% 0% 0% 0% 0%Options Arbitrage Arbitrage 0 0% 0% 0% 0% 0% 0% 0% 0% 0%Other Other 22 -43% -5% -66% -26% -4% 11% 65% 9% -32%Macro Other 9 -43% 48% -100% 20% 62% 54% 0% 13% 14%Other Other 7 -27% -57% -32% -82% -68% -14% 0% 21% -53%Short-term Trading Other 3 -80% 0% -100% 0% -100% 0% 65% -46% -100%Market Timer Other 2 -29% 0% 0% 23% 0% 0% 0% 47% -40%VC Private Equity Other 1 -100% 0% 0% 0% 0% 0% 0% 0% -100%Random Random 10 -31% 0% -100% 0% 0% 0% 0% 0% -30%

20
Evry, April 1, 2004 Journée Gestion Alternative
Selection Method Comparison: Prediction CorrelationThreshold 10 0.6 0.6 0.4 0.6 0.5 0.9 0.5 0.7
Strategy Type Nb Funds Stepwise PLCorrelation Multi
Regression PL Multi
Reg PL + Bucket Shape Multi Causality Multi
Causality + Bucket Shape Multi
Co-integration Multi
Prediction Power Multi
Predicted Direction Multi
Total 240 -12% 60% 2% 29% 48% 48% 80% 32% 3%Non directional Non directional 64 -30% 43% -54% -2% 14% 36% 94% -5% -19%Long/Short Equity Non directional 18 -38% 0% -67% -22% -47% 33% 0% -14% -16%CTA/Managed Futures Non directional 14 -19% 0% -83% -19% 0% -19% 0% -49% -25%Market Neutral Non directional 17 -39% 0% -47% -100% 15% -7% 0% -23% -49%Technology Sector Non directional 3 -6% 46% -48% 44% 71% 63% 94% 66% 37%Healthcare Sector Non directional 3 -42% 0% -45% -18% 0% -100% 0% 55% -86%Finance Sector Non directional 3 -15% 22% 0% 34% 30% 31% 0% -37% -42%Market Neutral Equity Non directional 5 -21% 92% 1% 90% 92% 91% 0% 81% 43%Energy Sector Non directional 1 -34% 0% 0% 0% 0% 0% 0% 21% -100%Directional Directional 75 22% 65% 41% 50% 55% 60% 94% 48% 32%Test Directional 14 83% 92% 63% 79% 81% 93% 98% 81% 76%Emerging Markets Directional 9 8% 62% 66% 39% 63% 37% 0% 20% -20%Fixed Income (non-arbitrage) Directional 16 -6% -100% -87% -24% -12% -33% 0% 15% -6%Opportunistic Directional 9 -17% 0% -44% -7% 20% 36% 0% -10% -12%Long Only Directional 6 71% 74% 84% 74% 79% 81% 98% 83% 72%Country Specific Directional 5 -1% 20% 65% 66% 46% 42% -45% 17% -20%Short Bias Directional 4 17% 0% 58% 21% 39% 68% 0% 69% 65%Value Directional 6 32% 70% -55% 18% 11% 15% 0% 29% 31%Small/Micro Cap Directional 4 11% 45% -100% 12% 18% 51% 0% 32% 35%Aggressive Growth Directional 2 -12% -15% -100% -27% -43% -24% 0% 16% -25%Aggregate Aggregate 23 -23% 48% -60% -23% 27% 1% 15% 21% -32%Fund of Funds Aggregate 17 -28% 0% -60% -37% -7% -28% 15% 7% -43%AGGREGATE Aggregate 3 13% -76% -7% -95% 37% -23% 0% 30% -43%Multi-Strategy Aggregate 2 64% 72% 0% 70% 68% 71% 0% 70% 66%Fund of Funds - Multi-Strategy Aggregate 1 -100% 0% -100% 0% 0% 0% 0% 0% -44%Special/Event Special/Event 24 -13% 37% -31% 12% 46% -14% -100% 26% -8%Event Driven Special/Event 5 0% 17% -30% -6% 33% 3% 0% 46% -5%Distressed Special/Event 8 16% 60% -24% 24% 66% -7% 0% -3% 16%Merger/Risk Arbitrage Special/Event 6 -79% 0% 30% 33% 59% -100% -100% 31% -19%Regulation D Special/Event 2 -29% 0% 0% 0% 0% 0% 0% 0% -44%Special Situations Special/Event 3 39% 0% -100% 0% 14% 0% 0% 32% -18%Arbitrage Arbitrage 32 -49% 47% -54% -63% 57% 51% 0% -21% -45%Convertible Arbitrage Arbitrage 11 -48% 0% -41% -100% 0% 0% 0% -100% -53%Fixed Income Arbitrage Arbitrage 7 -50% 0% -68% -100% 0% 0% 0% -62% -37%Other Arbitrage Arbitrage 5 -64% 0% -49% -93% 0% 0% 0% 0% -100%Statistical Arbitrage Arbitrage 8 -46% 47% -40% 25% 57% 51% 0% 64% -11%Options Strategies Arbitrage 1 -12% 0% 0% 0% 0% 0% 0% 0% 0%Options Arbitrage Arbitrage 0 0% 0% 0% 0% 0% 0% 0% 0% 0%Other Other 22 -43% -5% -81% -15% 13% -7% 46% -8% -40%Macro Other 9 -39% 48% -100% 47% 75% -3% 0% -1% 0%Other Other 7 -35% -57% -63% -83% -53% -10% 0% 1% -50%Short-term Trading Other 3 -75% 0% -100% 0% -100% 0% 65% -66% -100%Market Timer Other 2 -26% 0% 0% 23% 0% 0% 23% 47% -46%VC Private Equity Other 1 -79% 0% 0% 0% 0% 0% 0% 0% -100%Random Random 10 -27% 0% -100% 0% 0% 0% 0% 0% -26%

21
Evry, April 1, 2004 Journée Gestion Alternative
Selection Method Comparison: Selection RateThreshold 10 0.6 0.6 0.4 0.6 0.5 0.9 0.5
Strategy Type Nb Funds Stepwise Linear Correlation Regression PLReg PL + Bucket Shape Causality
Causality + Bucket Shape Co-integration Prediction Power
Total 240 76% 11% 12% 18% 18% 19% 5% 27%Non directional Non directional 64 75% 5% 9% 11% 9% 10% 0% 19%Long/Short Equity Non directional 18 78% 4% 11% 14% 13% 13% 0% 22%CTA/Managed Futures Non directional 14 79% 0% 3% 6% 0% 2% 0% 13%Market Neutral Non directional 17 76% 0% 8% 4% 3% 5% 0% 13%Technology Sector Non directional 3 79% 38% 35% 47% 40% 51% 7% 51%Healthcare Sector Non directional 3 54% 0% 15% 1% 1% 4% 0% 11%Finance Sector Non directional 3 79% 18% 0% 19% 26% 21% 0% 36%Market Neutral Equity Non directional 5 59% 16% 9% 16% 16% 16% 0% 17%Energy Sector Non directional 1 79% 0% 0% 4% 0% 0% 0% 13%Directional Directional 75 78% 25% 21% 37% 37% 39% 11% 46%Test Directional 14 79% 50% 63% 75% 73% 71% 54% 75%Emerging Markets Directional 9 77% 19% 18% 25% 25% 29% 0% 44%Fixed Income (non-arbitrage) Directional 16 78% 1% 9% 14% 9% 7% 0% 21%Opportunistic Directional 9 77% 5% 3% 13% 15% 22% 0% 24%Long Only Directional 6 77% 68% 29% 67% 72% 72% 11% 74%Country Specific Directional 5 78% 48% 18% 45% 52% 48% 4% 51%Short Bias Directional 4 78% 0% 9% 45% 43% 42% 0% 53%Value Directional 6 78% 22% 6% 25% 28% 38% 0% 53%Small/Micro Cap Directional 4 77% 25% 4% 31% 47% 59% 0% 46%Aggressive Growth Directional 2 79% 29% 21% 29% 33% 42% 0% 42%Aggregate Aggregate 23 73% 3% 3% 9% 9% 13% 1% 24%Fund of Funds Aggregate 17 78% 0% 3% 6% 6% 6% 1% 21%AGGREGATE Aggregate 3 57% 4% 4% 17% 17% 33% 0% 32%Multi-Strategy Aggregate 2 46% 31% 4% 31% 33% 42% 0% 44%Fund of Funds - Multi-Strategy Aggregate 1 79% 0% 0% 0% 0% 0% 0% 4%Special/Event Special/Event 24 74% 4% 6% 4% 7% 5% 1% 17%Event Driven Special/Event 5 79% 11% 9% 12% 14% 13% 0% 27%Distressed Special/Event 8 79% 6% 6% 2% 8% 5% 0% 13%Merger/Risk Arbitrage Special/Event 6 79% 0% 1% 3% 3% 2% 4% 9%Regulation D Special/Event 2 50% 0% 4% 4% 0% 2% 0% 0%Special Situations Special/Event 3 57% 0% 10% 0% 3% 1% 0% 39%Arbitrage Arbitrage 32 77% 2% 10% 8% 2% 2% 0% 7%Convertible Arbitrage Arbitrage 11 79% 0% 9% 8% 0% 0% 0% 3%Fixed Income Arbitrage Arbitrage 7 77% 0% 22% 12% 0% 0% 0% 13%Other Arbitrage Arbitrage 5 79% 0% 3% 5% 0% 0% 0% 2%Statistical Arbitrage Arbitrage 8 74% 10% 7% 9% 9% 9% 1% 10%Options Strategies Arbitrage 1 79% 0% 8% 0% 0% 0% 0% 0%Options Arbitrage Arbitrage 0 0% 0% 0% 0% 0% 0% 0% 0%Other Other 22 74% 2% 5% 6% 4% 8% 1% 14%Macro Other 9 75% 3% 2% 6% 6% 7% 0% 17%Other Other 7 79% 4% 8% 8% 5% 15% 0% 15%Short-term Trading Other 3 78% 0% 14% 0% 4% 0% 7% 14%Market Timer Other 2 73% 0% 0% 8% 0% 0% 0% 6%VC Private Equity Other 1 38% 0% 0% 0% 0% 0% 4% 0%Random Random 10 79% 0% 4% 1% 0% 0% 0% 0%

22
Evry, April 1, 2004 Journée Gestion Alternative
Selection Method Comparison: Direction MatchThreshold 0.5 0.7 0.5 0
Strategy Type Nb FundsPrediction Power Multi
Predicted Direction Multi
Causality Multi 5
RegPL AND Caus. AND BS Multi
Total 240 57% 49% 57% 68%Non directional Non directional 64 41% 37% 38% 64%Long/Short Equity Non directional 18 44% 32% 29% 58%CTA/Managed Futures Non directional 14 24% 46% 21% 62%Market Neutral Non directional 17 46% 24% 37% 0%Technology Sector Non directional 3 62% 67% 70% 67%Healthcare Sector Non directional 3 100% 50% 3% 87%Finance Sector Non directional 3 -27% -56% 60% 74%Market Neutral Equity Non directional 5 76% 52% 59% 59%Energy Sector Non directional 1 0% 0% 0% 0%Directional Directional 75 65% 60% 66% 76%Test Directional 14 94% 90% 93% 95%Emerging Markets Directional 9 43% 28% 54% 52%Fixed Income (non-arbitrage) Directional 16 34% 27% 39% -11%Opportunistic Directional 9 18% 39% 36% 72%Long Only Directional 6 86% 81% 83% 83%Country Specific Directional 5 54% 54% 72% 75%Short Bias Directional 4 68% 57% 72% 84%Value Directional 6 61% 42% 54% 86%Small/Micro Cap Directional 4 30% 67% 57% 51%Aggressive Growth Directional 2 55% 57% -7% 33%Aggregate Aggregate 23 44% 28% 44% 4%Fund of Funds Aggregate 17 42% 22% 40% -36%AGGREGATE Aggregate 3 46% 35% 51% 42%Multi-Strategy Aggregate 2 50% 54% 55% 64%Fund of Funds - Multi-Strategy Aggregate 1 0% 0% 0% 0%Special/Event Special/Event 24 38% 37% 45% -15%Event Driven Special/Event 5 12% 32% 58% 3%Distressed Special/Event 8 52% 21% 38% 0%Merger/Risk Arbitrage Special/Event 6 73% 65% 73% -100%Regulation D Special/Event 2 0% 0% 0% 0%Special Situations Special/Event 3 38% 30% 10% 0%Arbitrage Arbitrage 32 69% 76% 68% 93%Convertible Arbitrage Arbitrage 11 0% 0% -52% 0%Fixed Income Arbitrage Arbitrage 7 50% 0% 0% 0%Other Arbitrage Arbitrage 5 0% 0% 0% 0%Statistical Arbitrage Arbitrage 8 97% 76% 93% 93%Options Strategies Arbitrage 1 0% 0% 0% 0%Options Arbitrage Arbitrage 0 0% 0% 0% 0%Other Other 22 38% 34% 34% 79%Macro Other 9 17% 44% 26% 65%Other Other 7 66% 46% 43% 100%Short-term Trading Other 3 0% 9% 27% 0%Market Timer Other 2 0% 38% 0% 0%VC Private Equity Other 1 0% -100% 0% 0%Random Random 10 0% -25% 58% 0%
23
Evry, April 1, 2004 Journée Gestion Alternative
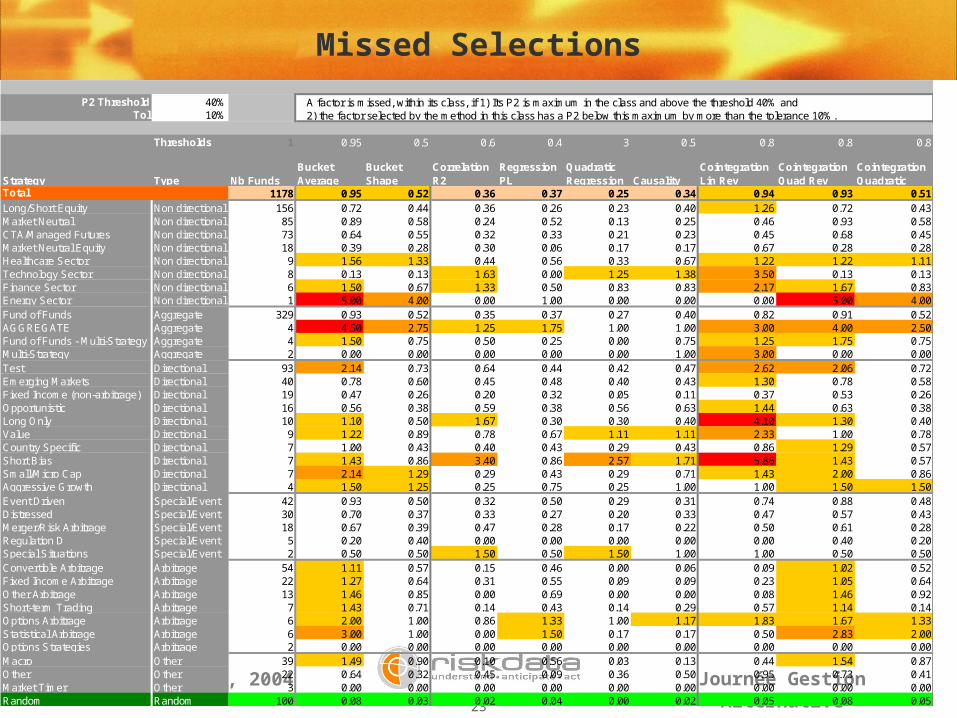
Missed Selections
P2 Threshold 40%Tol 10%
Thresholds 1 0.95 0.5 0.6 0.4 3 0.5 0.8 0.8 0.8
Strategy Type Nb FundsBucket Average
Bucket Shape
Correlation R2
Regression PL
Quadratic Regression Causality
Cointegration Lin Rev
Cointegration Quad Rev
Cointegration Quadratic
Total 1178 0.95 0.52 0.36 0.37 0.25 0.34 0.94 0.93 0.51Long/Short Equity Non directional 156 0.72 0.44 0.36 0.26 0.23 0.40 1.26 0.72 0.43Market Neutral Non directional 85 0.89 0.58 0.24 0.52 0.13 0.25 0.46 0.93 0.58CTA/Managed Futures Non directional 73 0.64 0.55 0.32 0.33 0.21 0.23 0.45 0.68 0.45Market Neutral Equity Non directional 18 0.39 0.28 0.30 0.06 0.17 0.17 0.67 0.28 0.28Healthcare Sector Non directional 9 1.56 1.33 0.44 0.56 0.33 0.67 1.22 1.22 1.11Technology Sector Non directional 8 0.13 0.13 1.63 0.00 1.25 1.38 3.50 0.13 0.13Finance Sector Non directional 6 1.50 0.67 1.33 0.50 0.83 0.83 2.17 1.67 0.83Energy Sector Non directional 1 5.00 4.00 0.00 1.00 0.00 0.00 0.00 5.00 4.00Fund of Funds Aggregate 329 0.93 0.52 0.35 0.37 0.27 0.40 0.82 0.91 0.52AGGREGATE Aggregate 4 4.50 2.75 1.25 1.75 1.00 1.00 3.00 4.00 2.50Fund of Funds - Multi-Strategy Aggregate 4 1.50 0.75 0.50 0.25 0.00 0.75 1.25 1.75 0.75Multi-Strategy Aggregate 2 0.00 0.00 0.00 0.00 0.00 1.00 3.00 0.00 0.00Test Directional 93 2.14 0.73 0.64 0.44 0.42 0.47 2.62 2.06 0.72Emerging Markets Directional 40 0.78 0.60 0.45 0.48 0.40 0.43 1.30 0.78 0.58Fixed Income (non-arbitrage) Directional 19 0.47 0.26 0.20 0.32 0.05 0.11 0.37 0.53 0.26Opportunistic Directional 16 0.56 0.38 0.59 0.38 0.56 0.63 1.44 0.63 0.38Long Only Directional 10 1.10 0.50 1.67 0.30 0.30 0.40 4.10 1.30 0.40Value Directional 9 1.22 0.89 0.78 0.67 1.11 1.11 2.33 1.00 0.78Country Specific Directional 7 1.00 0.43 0.40 0.43 0.29 0.43 0.86 1.29 0.57Short Bias Directional 7 1.43 0.86 3.40 0.86 2.57 1.71 5.86 1.43 0.57Small/Micro Cap Directional 7 2.14 1.29 0.29 0.43 0.29 0.71 1.43 2.00 0.86Aggressive Growth Directional 4 1.50 1.25 0.25 0.75 0.25 1.00 1.00 1.50 1.50Event Driven Special/Event 42 0.93 0.50 0.32 0.50 0.29 0.31 0.74 0.88 0.48Distressed Special/Event 30 0.70 0.37 0.33 0.27 0.20 0.33 0.47 0.57 0.43Merger/Risk Arbitrage Special/Event 18 0.67 0.39 0.47 0.28 0.17 0.22 0.50 0.61 0.28Regulation D Special/Event 5 0.20 0.40 0.00 0.00 0.00 0.00 0.00 0.40 0.20Special Situations Special/Event 2 0.50 0.50 1.50 0.50 1.50 1.00 1.00 0.50 0.50Convertible Arbitrage Arbitrage 54 1.11 0.57 0.15 0.46 0.00 0.06 0.09 1.02 0.52Fixed Income Arbitrage Arbitrage 22 1.27 0.64 0.31 0.55 0.09 0.09 0.23 1.05 0.64Other Arbitrage Arbitrage 13 1.46 0.85 0.00 0.69 0.00 0.00 0.08 1.46 0.92Short-term Trading Arbitrage 7 1.43 0.71 0.14 0.43 0.14 0.29 0.57 1.14 0.14Options Arbitrage Arbitrage 6 2.00 1.00 0.86 1.33 1.00 1.17 1.83 1.67 1.33Statistical Arbitrage Arbitrage 6 3.00 1.00 0.00 1.50 0.17 0.17 0.50 2.83 2.00Options Strategies Arbitrage 2 0.00 0.00 0.00 0.00 0.00 0.00 0.00 0.00 0.00Macro Other 39 1.49 0.90 0.10 0.56 0.03 0.13 0.44 1.54 0.87Other Other 22 0.64 0.32 0.45 0.09 0.36 0.50 0.95 0.73 0.41Market Timer Other 3 0.00 0.00 0.00 0.00 0.00 0.00 0.00 0.00 0.00Random Random 100 0.08 0.03 0.02 0.04 0.00 0.02 0.05 0.08 0.05
A factor is missed, within its class, if 1) Its P2 is maximum in the class and above the threshold 40% and 2) the factor selected by the method in this class has a P2 below this maximum by more than the tolerance 10%.

24
Evry, April 1, 2004 Journée Gestion Alternative
Findings
Classical Linear methods are either often spurious (stepwise regression) or miss essential afctors (correlation)
Non linear modelling is necessary
Statistical factors, such as Hist. Vol., Correl Index, etc. expalin a lot of hedge fund returns
Causality is efficient because of Lagged series
Co-integration is useful to find the “right” factor, but not for prediction capabilities. Dickey-Fuller mean reversion test worsen statistics
Direction match probability test good for “event” type strategies
Large factor shifts should be analysed differently: use the frequency of joint large move occurrence between the fund and the factor.

25
Evry, April 1, 2004 Journée Gestion Alternative
Conclusion
Performance Analysis + Correlations are insufficient for the construction of Portfolios of of Hedge Fund
A Complete Set of Risk Factors contains Factors that replicate Dynamic Strategies
Sensitive to Volatility and Correlation of Assets
Include Non-linear Features
Hedge Funds must be Proxied by Non-linear functions of Factors
Building a Risk Profile is the only way to identify Market Conditions under which Funds over/under-perform
This is also the only way to extract Stable information from Return series
26
Evry, April 1, 2004 Journée Gestion Alternative
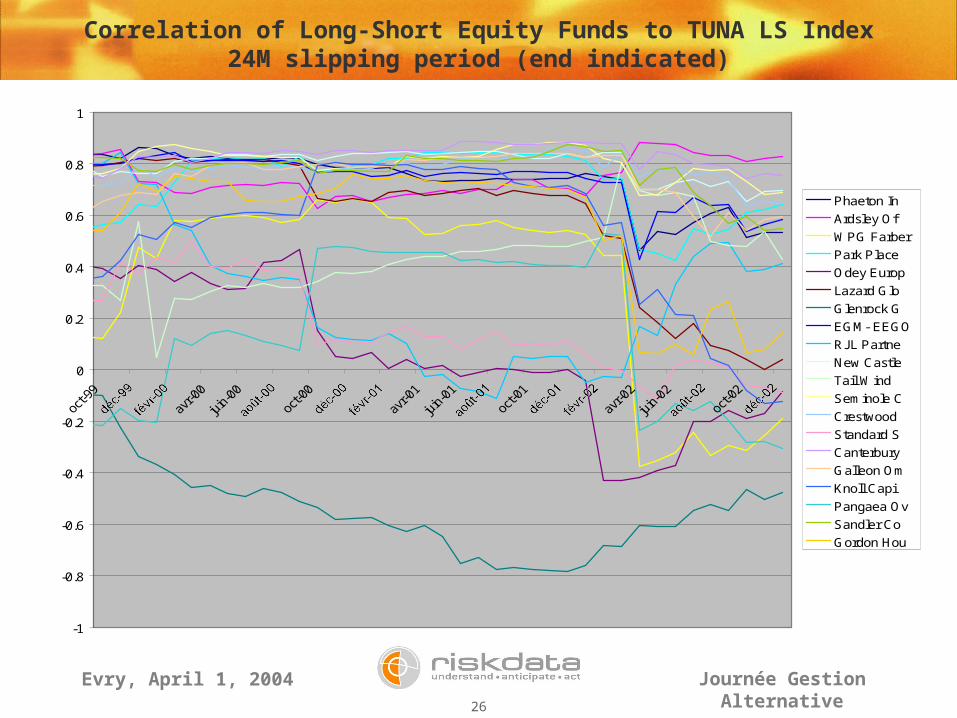
Correlation of Long-Short Equity Funds to TUNA LS Index24M slipping period (end indicated)
-1
-0.8
-0.6
-0.4
-0.2
0
0.2
0.4
0.6
0.8
1
Phaeton In
Ardsley Of
WPG Farber
Park Place
Odey Europ
Lazard Glo
Glenrock G
EGM- EEGO
RJL Partne
New Castle
Tail Wind
Seminole C
Crestwood
Standard S
Canterbury
Galleon Om
Knoll Capi
Pangaea Ov
Sandler Co
Gordon Hou

27
Evry, April 1, 2004 Journée Gestion Alternative
Riskdata FoFIX®
Recommended