Job Navigator -Incident Manager

INTRODUCTION
Are you responsible for managing the lifecycle of all incidents, but don’t know where to start? Or how to ensure IT services are up and running? Or how to restore them as quickly as possible?
This eBook provides tips, best practices, and step-by-step guidance around which metrics to track and how to track them to help you succeed in your role.
2

CONTENT
1. The Role of the Incident Manager
2. Expected Outcomes
3. Best Practices
4. KPIs and Metrics to Track
3

Incident Manager
The RoleOversee all aspects of the incident management process, from evaluation to resolution. An Incident Manager records all issues and helps to design ways to prevent similar problems in the future. He or she manages technical support teams, creates procedures to resolve problems, and develops solutions.
Responsibilities
Monitor the effectiveness of
incident management and make
recommendations for improvement
Produce management information, such as
KPIs and reports
Drive, develop, manage, and maintain
the major incident process and
associated procedures
Develop and maintain the incident
management system
Ensure all IT teams follow the incident
management process for every incident
4

5
EXPECTEDOUTCOMES
Increase availability of services to reduce
downtime
Reduce costs associated with unplanned downtime
Improve customer satisfaction
Drive continuous service improvement
The purpose of Incident Management is to restore normal service operations as quickly as possible and to mitigate the negative impact on business operations, thus ensuring the agreed upon
levels of service quality are maintained.

6
BESTPRACTICES
§ Provide multi-channel support to enhance user experience and educate users about the availability of these channels
§ Drive self-service adoption through enablement
§ Gather user information to personalize user accounts, provide more context to each ticket, and thereby speed up the ticket resolution process
§ Configure Service Level Agreements (SLAs) to determine ticket response and resolution time by priorityo Priority should be based on two criteria - impact and
urgency. o End users should have the option to select the impact (# of
users affected) and urgency (how soon the issue must be resolved) when submitting their tickets.

7
BESTPRACTICES
§ Automate whenever possibleo Automate ticket assignment to the right agent based on
ticket attributes o Configure automation workflows to send notifications to end
users and agents
§ Keep users informed about ticket status to build trust between IT and end users
§ Advise agents (and users) to leverage the knowledge base when possible – no need to reinvent the wheel when solutions already exist
§ Incentivize agents to resolve tickets faster, to keep in line with SLAs, etc.

8
INCIDENT MANAGEMENTAutomation
Incident logging
Classification
Investigation & Diagnosis
Assignment or Escalation
Resolution
Inci
dent
Man
agem
ent P
roce
ss
Closure
Customer Satisfaction Survey
KPIs & Metrics to Track
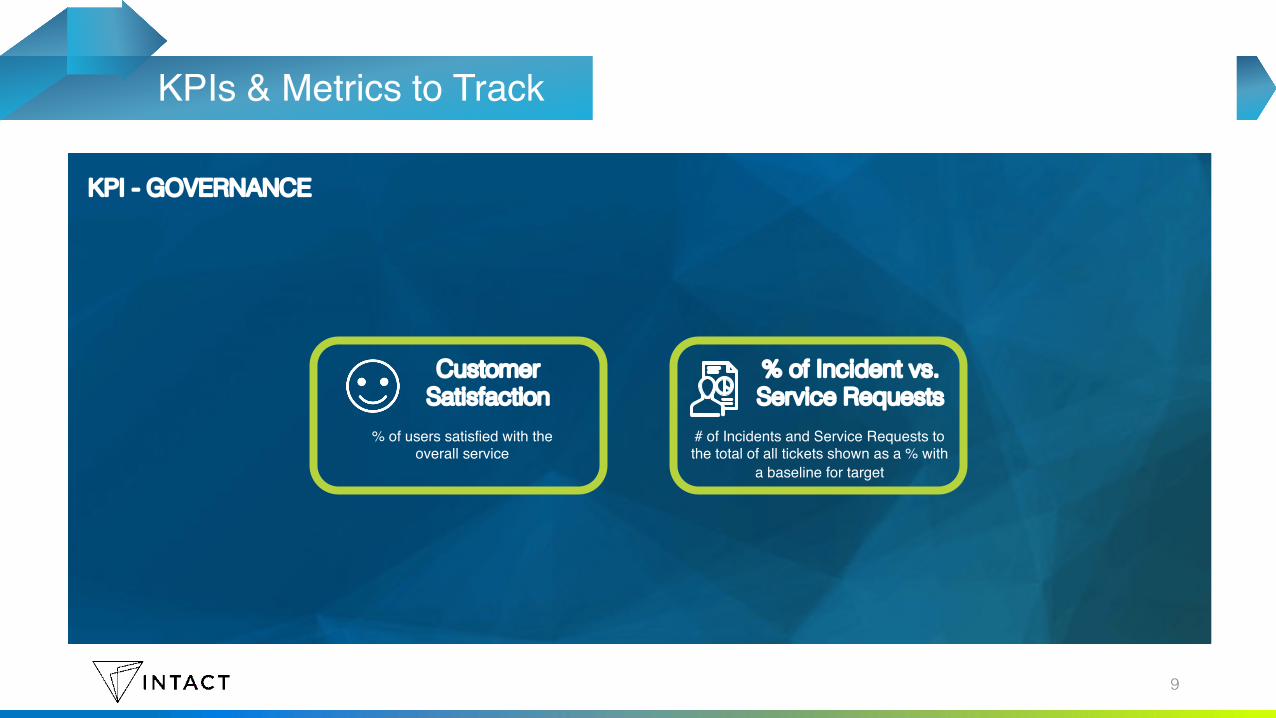
KPI - GOVERNANCE
% of Incident vs. Service Requests
Customer Satisfaction
# of Incidents and Service Requests to the total of all tickets shown as a % with
a baseline for target
% of users satisfied with the overall service
9

% of users satisfied with the overall service
Customer SatisfactionTarget: 90%
Governance Metric 1
1. Investigate 2. Analyze 3. Design 4. Build⇢ Start by looking into any negative or
below target metrics for Incident Management, as these are likely contributors
⇢ Follow up with survey responders to determine cause for dissatisfaction
⇢ Proactively eliminate negative trends in other Performance or Governance metrics before they impact Customer Satisfaction
⇢Follow guidelines for specific metrics in the Job Navigator Guide
⇢ Determine why the customer is dissatisfied
⇢ Is it people-related?
⇢ Is it service-related?
⇢ Is it communication-related?
⇢ Is it difficulty-related?
⇢Design plan to improve negative trend based on guidance in the Job Navigator Guide
⇢Design plan to improve future results
⇢ Execute and communicate what has been done and why it has been done that way, and communicate message of continued commitment to customer satisfaction
10

# of Incidents and Service Requests to the total of all tickets shown as a % with a baseline for target
% of Incident vs. Service Requests
Target: 15%
Governance Metric 2
1. Investigate 2. Analyze 3. Design 4. Build⇢On a monthly basis, review the
descriptions and detailed breakdowns of Incidents and Service Requests to make sure Incidents aren’t being misclassified as Service Requests.
⇢ Identify any Service Requests submitted that are break/fix, and thereby should be classified as Incidents
⇢Was there no defined Service Offering in the catalog?
⇢Was the request incorrectly submitted via the portal?
⇢ Is the Service Desk utilizing the catalog properly when contacted directly by phone?
⇢Meet with service owner to define/build a catalog offering
⇢Add additional descriptions in the catalog to better guide users
⇢Meet with the Service Desk to ensure proper knowledge exists
⇢ Execute and communicate the actions taken – new service offering, new KM article, etc.
11

12
§ Customer Satisfactiono Knowing and understanding what works and what doesn’t
from a customer’s perspective drives improvement and innovation
§ % of Incident vs. Service Requestso Service Requests can typically be solved by Tier 1 agents
and do not impact overall service. o As organizations mature, they see a decline in Incidents
and rise in Service Requests.
IMPORTANCE OF KPIs

KPIs & Metrics to Track
% of Incidents Open > 5 Days
Incident AgingUser Experience SLA by Priority
Backlog Breakdown Report
End to End (E2E) user-based SLA does not take “clocks” into consideration. It
measures ticket lifespan from submission to closure based on an average.
Total number of incidents that were opened, closed, and remain open
in a given period
KPI - PERFORMANCE
% First Attempt Resolution
% of incidents resolved on the first attempt, with no re-opens or repeat
incidents
Average time between ticket resolution and closure
Average Time to Close by Priority
13

Total number of incidents that were opened, closed, and remain open in a given period
Backlog Breakdown Report
Target: N/A
Performance Metric 1
1. Investigate 2. Analyze 3. Design 4. Build⇢ Increases in your backlog and ticket
aging indicate that agents are focused only on new tickets
⇢Work with ticket owners to determine why this is the case
⇢Filter data to identify trends or patterns by CI, Assignment Groups, etc.
⇢ Is it resource constraints?
⇢ Is it an operational practice to take from top first?
⇢ Is there something technically wrong with a ticket that’s hindering its progression?
⇢Design a corrective action plan ⇢ Implement and communicate these changes to policy, process, and operational procedures to decrease backlog
⇢Fix and release any technological issues preventing processing and progression
14
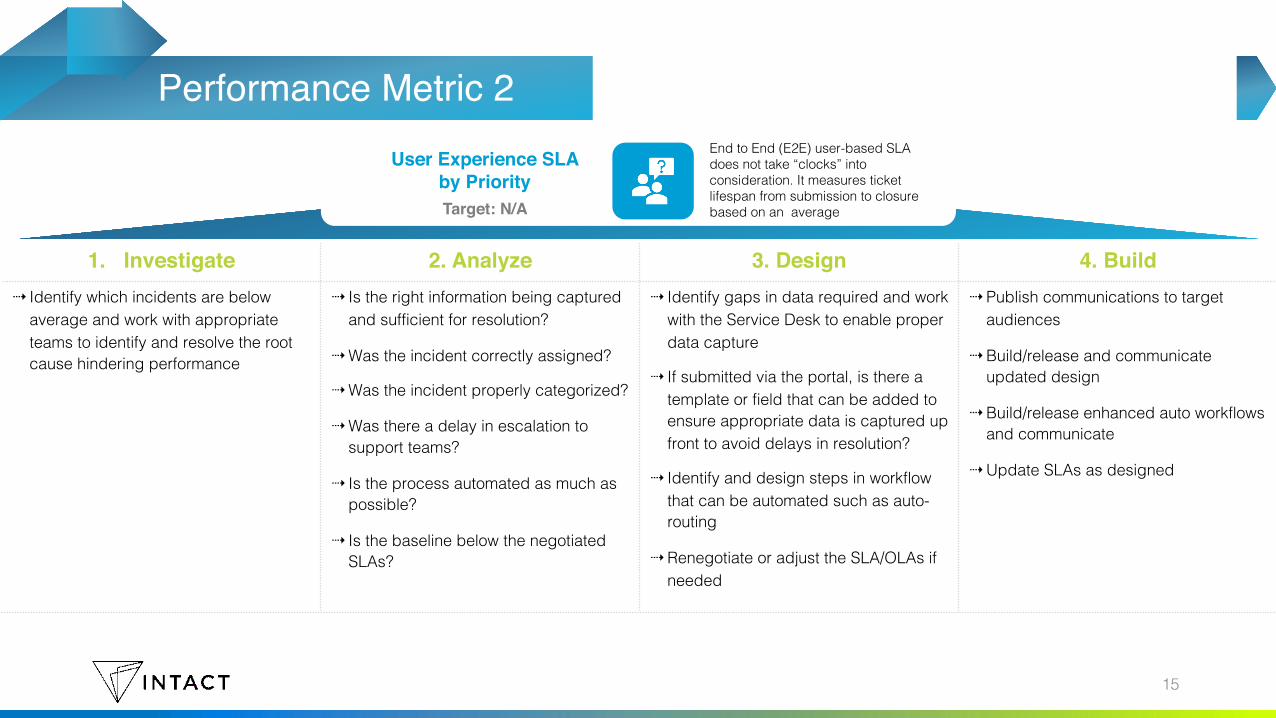
End to End (E2E) user-based SLA does not take “clocks” into consideration. It measures ticket lifespan from submission to closure based on an average
User Experience SLA by PriorityTarget: N/A
Performance Metric 2
1. Investigate 2. Analyze 3. Design 4. Build⇢ Identify which incidents are below
average and work with appropriate teams to identify and resolve the root cause hindering performance
⇢ Is the right information being captured and sufficient for resolution?
⇢Was the incident correctly assigned?
⇢Was the incident properly categorized?
⇢Was there a delay in escalation to support teams?
⇢ Is the process automated as much as possible?
⇢ Is the baseline below the negotiated SLAs?
⇢ Identify gaps in data required and work with the Service Desk to enable proper data capture
⇢ If submitted via the portal, is there a template or field that can be added to ensure appropriate data is captured up front to avoid delays in resolution?
⇢ Identify and design steps in workflow that can be automated such as auto-routing
⇢Renegotiate or adjust the SLA/OLAs if needed
⇢Publish communications to target audiences
⇢Build/release and communicate updated design
⇢Build/release enhanced auto workflows and communicate
⇢Update SLAs as designed
15

% of Incidents Open > 5 Days Incident Aging
Target: 5 Days
Performance Metric 3
1. Investigate 2. Analyze 3. Design 4. Build⇢First group the data by priority and
start with the higher priority incidents
⇢Then break down each incident by assignment group and focus on the largest contributors with the highest % of aged tickets
⇢Export ticket data sorted by priority and assignment group, and then follow up with assignment group owners to determine the cause
⇢Publish and follow up monthly on aged tickets with owners
⇢Communicate why this is important
⇢ Publish this Monthly Aging Report to managers
⇢Publish focused communications to assignment groups around the importance of aging
16

% of incidents resolved on the first attempt, with no re-opens or repeat incidents
% First AttemptResolutionTarget: 90%
Performance Metric 4
1. Investigate 2. Analyze 3. Design 4. Build⇢ Identify any incidents that have
required re-open and any incidents that are linked to multiple incidents or have a counter as a repeat incident
⇢Analyze solutions and resolutions in both the original and re-open ticket to determine:
⇢Was the resolution a technical one and not verified with the customer prior to closing?
⇢Was the initial fix temporary or no longer valid?
⇢ Was that result expected because it was a Known Error and a Work Around was provided?
⇢Build a verification process the customer must validate before ticket can close
⇢Open a Problem record to analyze the resolution process and determine the root cause
⇢Regularly review Known Errors to ensure that they can indeed not be resolved
⇢ Roll out and communicate process and/or system changes
17

Average time between ticket resolution and closure
Average Time to Close by Priority
Target: 2 Days
Performance Metric 5
1. Investigate 2. Analyze 3. Design 4. Build⇢ Identify tickets that don’t meet the
target to determine the cause⇢Was the incident resolution not verified
by the customer in a timely manner?
⇢Was there an increased demand that prevented and deprioritized this activity?
⇢Build a targeted communication that highlights the importance of timely verification
⇢Ensure sufficient attention is given to clean up the backlog to get the metric back on track
⇢Rollout communication for awareness
⇢Close orphaned tickets
18

19
§ Backlog Breakdown Reporto Monitoring the backlog ensures that not only the most recent tickets get
addressed, but also the leftover tickets from previous days
§ User Experience SLA by Priorityo This can be a leading indicator to a decrease in customer satisfaction; when
measured against contract SLAs, it can also highlight where there are gaps in service delivery expectations
§ Incident Agingo Aging incidents are a leading indicator of customer satisfaction, SLA
performance, and efficiency of ticket handling
§ % First Attempt Resolutiono The higher the percentage of tickets resolved on the first attempt, the higher
the customer satisfaction
§ Average Time to Close by Priorityo Monitoring time from ticket resolution to ticket closer ensures that tickets
aren’t left opened/orphaned and keeps the system searches efficient
IMPORTANCE OF KPIs

20
KPI Source Target Threshold Danger
Customer Satisfaction Survey 90% 85% 75%
% of Incidents vs. Service Requests
Ticket Data 15% 10% 5%
Backlog Breakdown Report
Ticket Data N/A N/A N/A
User Experience SLA by Priority
Ticket Data N/A N/A N/A
Incident Aging Ticket Data 5 days 8 Days > 10 Days
% First Attempt Resolution
Ticket Data 90% 80% <75%
Average Time to Close by Priority
Ticket Data 2 Days 3 Days >5 days
KPI Metrics and Sources

intact-tech.com
Recommended