JJEESJordan Journal of Earth and Environmental Sciences
Volume 6, Number 2, December, 2014ISSN 1995-6681
Pages 85- 92
Effects of the Upgrading of Al-Ramtha - Northern Jordan,Wastewater Treatment Plant on Quality of the Effluent and Environment
Alaa A. Mayyas; Hakam A. Mustafa* and Nigem El-Deen Yusuf
Abstract
1. Introduction
Wastewater is the water that carries the waste removed from residences, institutions, and commercial and industrial establishments. It can be subdivided on the basis of the levels of the major constituents into strong, medium and weak domestic wastewaters (Table 1) (FAO, 2008).
Currently available systems of treatment in Jordan need upgrades in capacity or supplementary systems. In the present study, Al-Ramtha wastewater treatment plant (WWTP) was selected to determine the effect of upgrading on the quality of effluent and whether the current effluent quality can be used in agriculture.
Al-Ramtha WWTP was constructed in 1988 on gently sloping plateau about 4km northwest of Al-Ramtha city, near the road leading to Turra (Fig. 1).
Wastewaters from homes, commercial buildings, hospitals (domestic sewage), etc. of about 70,000 people are collected via a collection system and flow to Al-Ramtha WWTP for treatment.
Keywords: Wastewater, Upgrading, Treatment Plant, Ramtha, Jordan.
The present study concludes that the wastewater generated in Al-Ramtha wastewater treatment plant is classified as strong in terms of the total dissolved solids (TDS) content, the total suspended solids (TSS) content, and the chemical and biochemical oxygen demands (COD and BOD5). The efficiency of the plant in removing total dissolved solids (TDS) from wastewater is still low, while it is reasonably high in terms of suspended solids, COD and BOD removal. The upgrading which took place in 2003 added a significant improvement in the process of plant treatment regarding the selected parameters (COD, BOD and TSS). Regarding these parameters, the new plant effluent complies with Jordanian standards for irrigation parks, reuse for irrigation of cooked vegetables, fruits, and trees, and for fodder crops, but not with respect to TDS concentration of effluent used for irrigation purposes. The obtained concentrations of all analyzed metals indicate that the studied soils are uncontaminated with respect to Cd, Zn, Mn, Pb, Cu and Fe.
© 2014 Jordan Journal of Earth and Environmental Sciences. All rights reserved
Received 19 May, 2013; Accepted 4 December, 2014
* Corresponding author. e-mail: [email protected]
Department of Earth & Environmental Sciences, Yarmouk University, Irbid, Jordan
Figure 1: Location map of the study area.
Table 1: Major constituents of typical domestic wastewater (FAO, 2008).
Major ConstituentsLevel of Major constituents
and their concentration in mg/lStrong Medium Weak
Total solids 1200 720 350Dissolved solids (TDS) 850 500 250
Suspended solids 350 220 100Nitrogen (as N) 85 40 20
Phosphorus (as P) 15 8 4Chloride 100 50 30
Alkalinity (as CaCO3) 200 100 50Grease 150 100 50
Biochemical Oxygen Demand( BOD5) 400 210 110
In the old stabilization ponds plant, three stages were used. In the first stage, settable organic materials are accumulated as sludge in the bottom of anaerobic ponds and decomposed to produce inorganic matter. In the second stage,

© 2014 Jordan Journal of Earth and Environmental Sciences . All rights reserved - Volume 6, Number 2 (ISSN 1995-6681) 86
facultative ponds which are divided into two zones upper aerobic and lower anaerobic, consumer and decomposer organisms mainly reduced organic material during two to three weeks to basic intracellular inorganic constituents. In the third stage, the shallow maturation ponds, where the water is light loaded with organic matter and contains dissolved oxygen; provide a high quality effluent (Parker, 1979; Rich 1980; Arceivala, 1981, and Gharaibeh et al., 2000). After the upgrading in 2003 an activated sludge process is in use. The treatment is divided into pretreatment, where coarse solids and other materials are removed using screens, aerated greave and grit chamber, in the secondary treatment activated sludge in the aeration tank is used, and in the tertiary treatment residual particles and parasites are removed.
The hydraulic design capacity for the new plant is 5400 m3/d and operating capacity 3492 m3/d. All effluent has to be reused throughout the year in order to eliminate effluent discharge to the wadi downstream of the plant.
Evaluation of several options for reuse of the reclaimed water showed that agricultural reuse was the most suitable alternative. The proposed agricultural lands irrigated with the reclaimed water are around 1 Km2 located adjacent to the WWTP.
The present research aims to achieve the main following goals:
A combination of both field and laboratory work were used to accomplish this study.
Determining of the effects of upgrading that was finished in 2003 on the quality of Al-Ramtha wastewater treatment plant effluent by measuring chemical oxygen demand (COD), biological oxygen demand (BOD), total suspended solids (TSS), total dissolved solids (TDS) and comparing the results with data available before upgrading.Determining the new plant effluent suitability for agricultural irrigation and comparing the new plant effluent properties with Jordanian standards and the international standards. Investigating the environmental impact of effluent in its current quality on irrigated soil by measuring the concentration of some heavy elements (Cd, Fe, Cu, Pb, and Zn) and comparing it with soil samples from non- irrigated profile.
•
•
•
2. Methodology
Sixteen water samples were collected from influent and effluent of the plant during the period from May to October 2009. The effluent samples used in analysis were taken from the plant after secondary treatment and before chlorination; the influent samples were taken from the plant inlet. The samples were preserved in bottles and transported to the laboratory for further analyses.Soil samples were collected from two profiles: The first profile (Coordinates 35.985744° N and 32.593295° E) represents soil irrigated by effluent, and the second profile (Coordinates 35.98129° N and 32.593580° E) represents a reference from non-irrigated soil. Soil samples were preserved in polyethylene bags to minimize contamination then transported to the laboratory for further analysis. Temperature, pH value and TDS were measured in the field by using thermometer, pH meter and conductivity meter, respectively.
Wastewater samples analysesSuspended Solids (TSS) A known volume of water sample was filtrated through a pre-weighed Whatman glass fiber filter (GFC), 47 mm in diameter. The filter was dried at 105ºC and reweighed. The amount of suspended solids was determined from the increase in weight of Whatman glass fiber filter.Chemical Oxygen-Demand (COD)The Chemical Oxygen Demand is used as a measure of the oxygen equivalent of the organic and inorganic matter content of a sample that is susceptible to oxidation by a strong chemical oxidant. The COD test was carried out by using Photolab S6 equipment (Fig. 2).
Biochemical Oxygen Demand (BOD)BOD is a measure of the amount of oxygen used by microbes to decompose organic matter in a wastewater.The sample is kept in a sealed container fitted with a pressure sensor. A substance that absorbs carbon dioxide (typically sodium hydroxide) is added in the container above the sample level. The sample is kept at 20 °C in darkness to prevent photosynthesis (and thereby the addition of oxygen) for five days. Oxygen is consumed, and carbon dioxide is released. The total amounts of gas, and thus the pressure, decrease because carbon dioxide is absorbed. From the drop of pressure, the sensor electronics compute and display the consumed quantity of oxygen.Heavy metals chemical analysisThe (Nov AA300 “Analytic Jena”) atomic absorption spectrophotometer (AAS) was used for the determination of Cd, Pb, Cu, Fe, Zn and Cr content in all analyzed water and soil samples.Soil samples analysesAll soil samples were dried at 110˚C, disaggregated, homogenized and sieved to discard coarse materials (>2mm). Representative subsamples were taken for each soil sample.Heavy metals chemical analysisThe same as the analysis of heavy metals in wastewater. Total Organic Matter Content (%TOM)The percentage of organic matter in the soil samples was measured by titration method which is based on the oxidation of organic matter by potassium dichromate, followed by chemical titration with ferrous sulphate until the color flashes to green, as suggested by Loring and Rantala (1992).
A)
B)
A.a)
b)
c)
d)
B.
a)
b)
Laboratory work was carried out at the Faculty of Science at Yarmouk University and laboratories of the Ramtha Wastewater Treatment Plant.
Field work
Laboratory work
Figure 2: Process of measuring COD.
© 2014 Jordan Journal of Earth and Environmental Sciences . All rights reserved - Volume 6, Number 2 (ISSN 1995-6681) 87
3. Results and Discussions
Data concerning Al-Ramtha WWTP were obtained from the Ministry of Water and Irrigation, and the chemical and physical analyses of the collected wastewater samples (Tables 5-7).
Data of chemical and physical analyses of the collected wastewater samples (Table 2) during the study period are divided into two groups (summer and winter).
The physical properties of interest here are the temperature and solids content of the wastewater. The waste water temperature is an important parameter because of its effects on type and rate of the biochemical reactions. The average influent wastewater temperatures in Al-Ramtha treatment plant is ranging from 15.4° to 20.4°C in winter, and from 21° to 26°C in summer (Table 2). The minimum temperature in winter is never less than 10°C. These temperature ranges are suitable for high bacterial activity. The temperature for optimal bacterial activity ranges from 25-35°C and this activity decreases to about the half when the temperature decreases by 10°C (Metcalf & Eddy1990).
The average effluent wastewater temperature ranges
from 15.17° to 22.8 °C in winter and from 25.4° to 27.9°C in summer (Table 2). The effluent temperature is significant because it can affect aquatic life upon discharge, and the sustainability of the water for beneficial uses. Also, oxygen is less soluble in warm water than in cold water.
The other important physical property of wastewater is the solids content. The average studied influent total dissolved solids range from 916 mg/l to 1176 mg/l in winter and from 1068 mg/l to 2068 mg/l in summer (Table 2). The average effluent total dissolved solids contents for the winter and summer range from 826 mg/l to 1400 mg/l and 806 mg/l to 1533 mg/l, respectively (Table 2). Accordingly, the treated wastewater is classified as strong wastewater (Table 1). The low efficiency of the used technologies in removing dissolved solids from wastewater is of concern because it affects the reuse of wastewater for agriculture.
In winter, the average influent of total suspended solid content (Silt, clay, algae, zooplankton, bacteria) of the studied wastewater is 628 mg/l, and in summer 725.8 mg/l (Table 2). Accordingly, this wastewater is classified as strong wastewater (Table 1). But the percentage removed of TSS from treated wastewater is 95.8% (Table 2) because solid particles precipitate throughout the treatment process, causing the water to become clear when it flows down and enters a reservoir.
- Properties of influent and effluent in the new plant
- Physical properties of influent and effluent
Table 2: Summary of statistical information of influent and effluent wastewater parameters of Al-Ramtha WWTP after upgrading.
**** TDS: Total Dissolved Solids, TSS: Total Suspended Solids, BOD5: Biochemical Oxygen Demand and COD: Chemical Oxygen Demand. Std: Standard Deviation
Parameter Unit SeasonInfluent Effluent
Ave. Std. Max. Min. Ave. Std. Max. Min.
Qave. M3/day ___ 3244 ___ ___ ___ ____ ____ ____ _____
Temp oCWinter 18 1.7 20.4 15.4 18.19 2.35 22.8 15.7
Summer 24.5 1.5 26 21 26.8 0.8 27.9 25.4
pHWinter 7.6 0.27 7.95 7.2 7.2 0.48 7.88 6.28
Summer 7.4 0.26 7.75 6.96 7.74 0.25 8.21 7.34
TDS mg/lWinter 1088.9 84.36 1176 916 1182,8 159.4 1400 826
Summer 1379.9 318.8 2068 1068 1143.9 251.2 1533 806
TSS mg/lWinter 628 341.7 1374 192 26.8 16.8 66 10
Summer 725.8 226 958 324 30.46 16.75 84 13
BOD5 mg/lWinter 924.4 488 1708 229 11 4 20 5
Summer 989 248 1310 580 13.45 5 20 5
COD mg/lWinter 1629.8 616.35 2590 799 58 34.6 156 24
Summer 2259.6 849 3651 1156 69.38 33.4 121 25
COD/BOD ratio ____Winter 1.76 1.26 3.48 1.5 5.3 8.65 7.8 4.8
Summer 2.28 3.42 2.78 1.99 5.4 6.48 6.05 5
The wastewater properties of interest here are the pH and the organic matter content; which include the biochemical oxygen demand (BOD5), the chemical oxygen demand (COD), and the ratio of COD to BOD5. The pH is an important parameter. Most biological life dislike pH outside the range 4 – 9. The well-being of microorganisms in the aerated tanks is of concern. Most bacteria cannot tolerate pH outside the range 4.0 - 9.5. Generally, pH for optimum bacterial growth lies in the range 6.5 - 7.5 (Sincero, 1996). The pH reported for Al-Ramtha treatment plant ranges from 6.28 to 8.21, (Table 2) they are well within the range favored by the bacteria.
Special consideration must be given to the organic matter content of the wastewater; it is characterized in terms of the biochemical oxygen demand (BOD5), the chemical oxygen demand (COD), and the ratio of the COD to the BOD5. The BOD5 by definition is the quantity of oxygen required for the stabilization of the oxidizable organic matter present after five days of incubation at 20°C. It is the amount of Oxygen used by microorganisms to decompose organic matter.
The average, studied influent BOD5 concentrations range from 229 mg/l to 1708 mg/l in the winter time and from 580 mg/l to 1310 mg/l in the summer time (Table 2). These numbers indicate that the wastewater being treated is classified as strong wastewater (Table 1). The percentage
- Chemical and biochemical properties of influent and effluent
© 2014 Jordan Journal of Earth and Environmental Sciences . All rights reserved - Volume 6, Number 2 (ISSN 1995-6681) 88
removals of BOD5 obtained for plant selected for the study averaged 98%.
The COD test measures the total organic content of a wastewater which is oxidizable by dichromate in acid solution (Eckenfelder, 1989). Certain aromatics such as benzene and straight chain carboxylic acids are not completely oxidized in the reaction, and on the other hand reduced substances, such as sulfides, sulfates, and ferrous iron, will also be oxidized and reported as COD.
The average influent COD concentrations of the studied wastewater range from 799 mg/l to 2590 mg/l in winter and from 1156 mg/l to 3651 mg/l in summer (Table 2).
These numbers indicate that the studied wastewater is strong (Table 1). Because the five-day BOD will represent a different proportion of the total oxygen demand for raw wastewater than for effluents, the COD/BOD5 ratio will frequently vary for effluents as compared with untreated wastes (Table 2). The influent wastewater of the plant is characterized as containing high percentage of nonbiodegradable organic matter; which can be concluded from the ratio of COD/ BOD5 (Table 2) which ranges from about 1.5 to about 3.48. These numbers are comparable to those presented by Metcalf and Eddy (1990) which state that the typical COD/BOD5 ratio of domestic wastewaters is usually in the range 1.25 to 2.5. The COD/BOD5 ratio becomes even more profound for treated effluents and ranges from 4.8 to 7.8. This indicates that the proportion of the nonbiodegradable content of treated effluent is relatively higher than that of raw wastewater and that the efficiency of BOD5 removal is higher than that of COD removal.
The Cd and Zn concentration in all analyzed samples lies below the detectable limit of the atomic absorption spectrophotometer used. Thus, the effluent can be classified as uncontaminated with Cd and Zn.
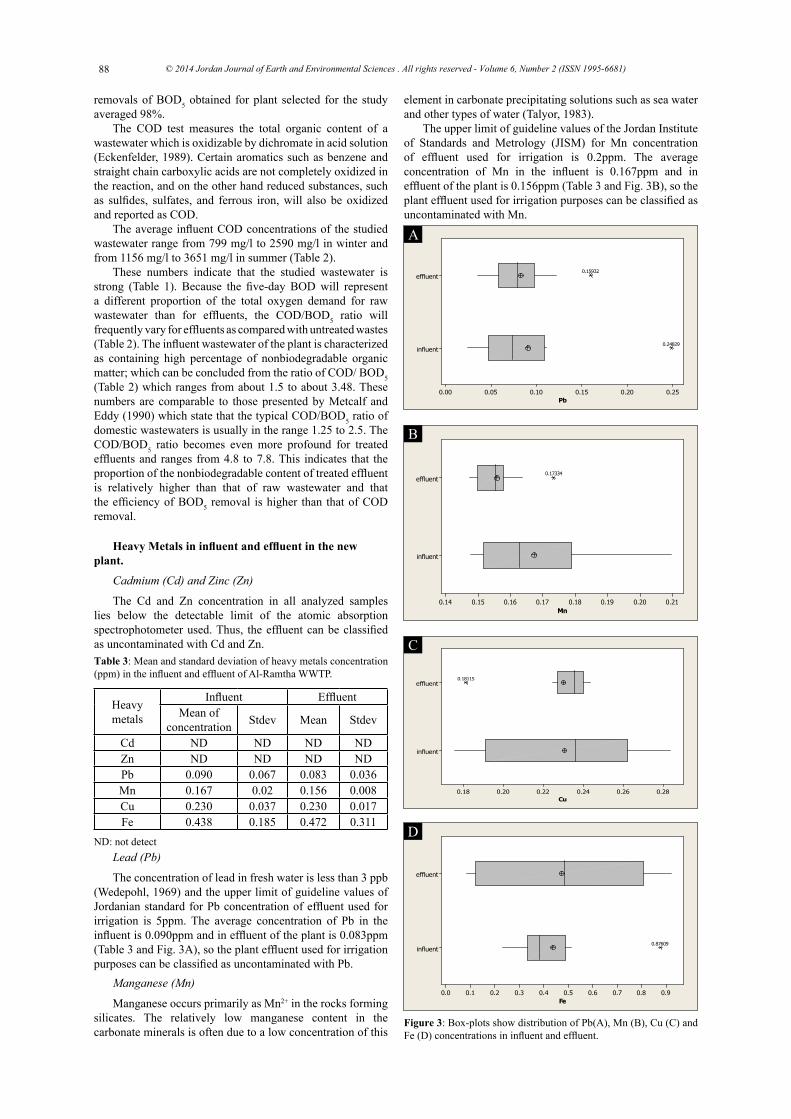
The concentration of lead in fresh water is less than 3 ppb (Wedepohl, 1969) and the upper limit of guideline values of Jordanian standard for Pb concentration of effluent used for irrigation is 5ppm. The average concentration of Pb in the influent is 0.090ppm and in effluent of the plant is 0.083ppm (Table 3 and Fig. 3A), so the plant effluent used for irrigation purposes can be classified as uncontaminated with Pb.
Manganese occurs primarily as Mn2+ in the rocks forming silicates. The relatively low manganese content in the carbonate minerals is often due to a low concentration of this
element in carbonate precipitating solutions such as sea water and other types of water (Talyor, 1983).
The upper limit of guideline values of the Jordan Institute of Standards and Metrology (JISM) for Mn concentration of effluent used for irrigation is 0.2ppm. The average concentration of Mn in the influent is 0.167ppm and in effluent of the plant is 0.156ppm (Table 3 and Fig. 3B), so the plant effluent used for irrigation purposes can be classified as uncontaminated with Mn.
Heavy Metals in influent and effluent in the new plant.
Lead (Pb)
Manganese (Mn)
Cadmium (Cd) and Zinc (Zn)
Table 3: Mean and standard deviation of heavy metals concentration (ppm) in the influent and effluent of Al-Ramtha WWTP.
Heavymetals
Influent EffluentMean of
concentration Stdev Mean Stdev
Cd ND ND ND NDZn ND ND ND NDPb 0.090 0.067 0.083 0.036Mn 0.167 0.02 0.156 0.008Cu 0.230 0.037 0.230 0.017Fe 0.438 0.185 0.472 0.311
ND: not detect
Pb
influent
effluent
0.250.200.150.100.050.00
0.24829
0.15932
Cu
influent
effluent
0.280.260.240.220.200.18
0.18115
Mn
influent
effluent
0.210.200.190.180.170.160.150.14
0.17334
Fe
influent
effluent
0.90.80.70.60.50.40.30.20.10.0
0.87609
A
B
C
D
Figure 3: Box-plots show distribution of Pb(A), Mn (B), Cu (C) and Fe (D) concentrations in influent and effluent.
© 2014 Jordan Journal of Earth and Environmental Sciences . All rights reserved - Volume 6, Number 2 (ISSN 1995-6681) 88
removals of BOD5 obtained for plant selected for the study averaged 98%.
The COD test measures the total organic content of a wastewater which is oxidizable by dichromate in acid solution (Eckenfelder, 1989). Certain aromatics such as benzene and straight chain carboxylic acids are not completely oxidized in the reaction, and on the other hand reduced substances, such as sulfides, sulfates, and ferrous iron, will also be oxidized and reported as COD.
The average influent COD concentrations of the studied wastewater range from 799 mg/l to 2590 mg/l in winter and from 1156 mg/l to 3651 mg/l in summer (Table 2).
These numbers indicate that the studied wastewater is strong (Table 1). Because the five-day BOD will represent a different proportion of the total oxygen demand for raw wastewater than for effluents, the COD/BOD5 ratio will frequently vary for effluents as compared with untreated wastes (Table 2). The influent wastewater of the plant is characterized as containing high percentage of nonbiodegradable organic matter; which can be concluded from the ratio of COD/ BOD5 (Table 2) which ranges from about 1.5 to about 3.48. These numbers are comparable to those presented by Metcalf and Eddy (1990) which state that the typical COD/BOD5 ratio of domestic wastewaters is usually in the range 1.25 to 2.5. The COD/BOD5 ratio becomes even more profound for treated effluents and ranges from 4.8 to 7.8. This indicates that the proportion of the nonbiodegradable content of treated effluent is relatively higher than that of raw wastewater and that the efficiency of BOD5 removal is higher than that of COD removal.
The Cd and Zn concentration in all analyzed samples lies below the detectable limit of the atomic absorption spectrophotometer used. Thus, the effluent can be classified as uncontaminated with Cd and Zn.
The concentration of lead in fresh water is less than 3 ppb (Wedepohl, 1969) and the upper limit of guideline values of Jordanian standard for Pb concentration of effluent used for irrigation is 5ppm. The average concentration of Pb in the influent is 0.090ppm and in effluent of the plant is 0.083ppm (Table 3 and Fig. 3A), so the plant effluent used for irrigation purposes can be classified as uncontaminated with Pb.
Manganese occurs primarily as Mn2+ in the rocks forming silicates. The relatively low manganese content in the carbonate minerals is often due to a low concentration of this
element in carbonate precipitating solutions such as sea water and other types of water (Talyor, 1983).
The upper limit of guideline values of the Jordan Institute of Standards and Metrology (JISM) for Mn concentration of effluent used for irrigation is 0.2ppm. The average concentration of Mn in the influent is 0.167ppm and in effluent of the plant is 0.156ppm (Table 3 and Fig. 3B), so the plant effluent used for irrigation purposes can be classified as uncontaminated with Mn.
Heavy Metals in influent and effluent in the new plant.
Lead (Pb)
Manganese (Mn)
Cadmium (Cd) and Zinc (Zn)
Table 3: Mean and standard deviation of heavy metals concentration (ppm) in the influent and effluent of Al-Ramtha WWTP.
Heavymetals
Influent EffluentMean of
concentration Stdev Mean Stdev
Cd ND ND ND NDZn ND ND ND NDPb 0.090 0.067 0.083 0.036Mn 0.167 0.02 0.156 0.008Cu 0.230 0.037 0.230 0.017Fe 0.438 0.185 0.472 0.311
ND: not detect
Pb
influent
effluent
0.250.200.150.100.050.00
0.24829
0.15932
Cu
influent
effluent
0.280.260.240.220.200.18
0.18115
Mn
influent
effluent
0.210.200.190.180.170.160.150.14
0.17334
Fe
influent
effluent
0.90.80.70.60.50.40.30.20.10.0
0.87609
A
B
C
D
Figure 3: Box-plots show distribution of Pb(A), Mn (B), Cu (C) and Fe (D) concentrations in influent and effluent.
© 2014 Jordan Journal of Earth and Environmental Sciences . All rights reserved - Volume 6, Number 2 (ISSN 1995-6681) 89
Copper is widely distributed in nature in free state as well as in sulfides, arsenide, chlorides and carbonates.
The concentration of copper in fresh water is 3 ppb (Wedepohl, 1969) and the upper limit of guideline values of the Jordan Institute of Standards and Metrology (JISM) for Cu concentration of effluent used for irrigation is 0.2ppm. The average concentration of Cu in influent is 0.230ppm and in effluent of the plant is 0.230ppm (Table 3 and Fig. 3C), so the plant effluent used for irrigation purposes can be classified as slightly contaminated with Cu.
Iron has several sources in sedimentary rocks. Iron minerals present in carbonate rocks are mostly ferric oxides formed by weathering.
The concentration of iron in river waters is 0.67ppm (Wedepohl,1969). The upper limit of guideline values of the Jordan Institute of Standards and Metrology (JISM) for Fe concentration of effluent used for irrigation is 5ppm. The average concentration of Fe in influent is 0.438ppm and in effluent of the plant is 0.472ppm (Table 3 and Fig. 3D), so the plant effluent used for irrigation purposes can be classified as uncontaminated with Fe.
The organic matter of soil consists of mixture of plant and animal remains in various stages of decomposition.
Organic matter of a soil affects its color; it increases its cation exchange capacity and accounts for 20-90% of the adsorbing power of the soil.
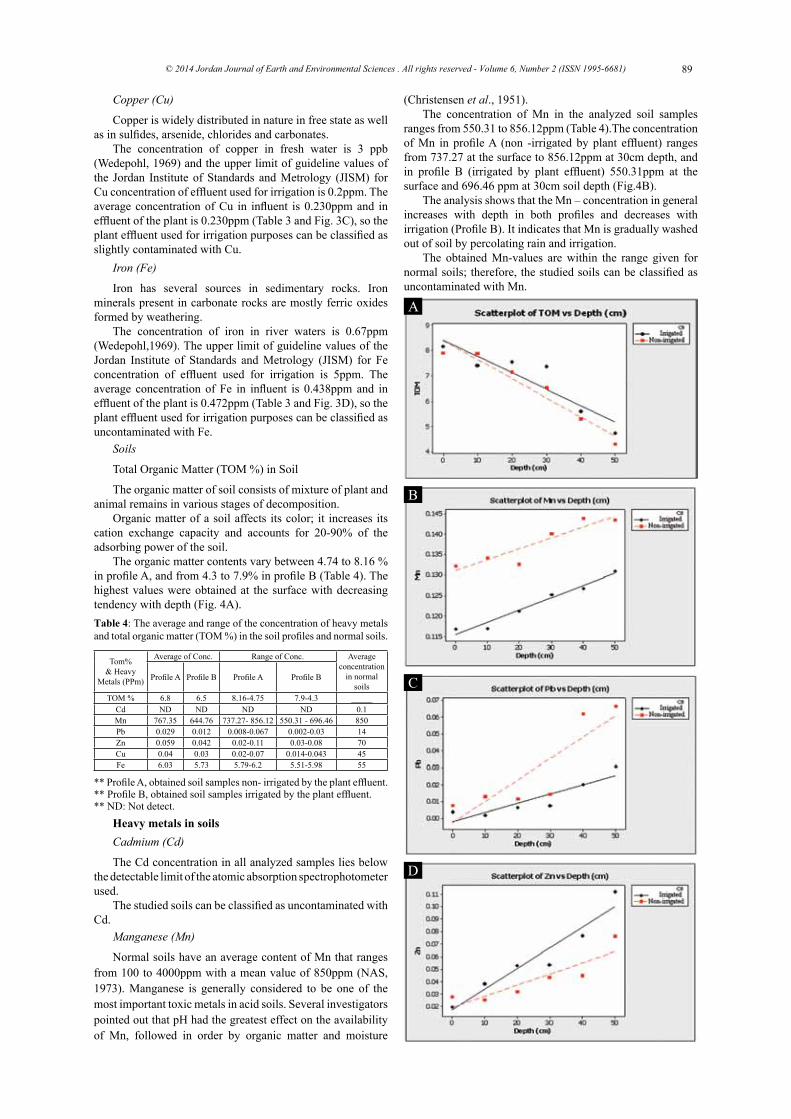
The organic matter contents vary between 4.74 to 8.16 % in profile A, and from 4.3 to 7.9% in profile B (Table 4). The highest values were obtained at the surface with decreasing tendency with depth (Fig. 4A).
(Christensen et al., 1951). The concentration of Mn in the analyzed soil samples
ranges from 550.31 to 856.12ppm (Table 4).The concentration of Mn in profile A (non -irrigated by plant effluent) ranges from 737.27 at the surface to 856.12ppm at 30cm depth, and in profile B (irrigated by plant effluent) 550.31ppm at the surface and 696.46 ppm at 30cm soil depth (Fig.4B).
The analysis shows that the Mn – concentration in general increases with depth in both profiles and decreases with irrigation (Profile B). It indicates that Mn is gradually washed out of soil by percolating rain and irrigation.
The obtained Mn-values are within the range given for normal soils; therefore, the studied soils can be classified as uncontaminated with Mn.
The Cd concentration in all analyzed samples lies below the detectable limit of the atomic absorption spectrophotometer used.
The studied soils can be classified as uncontaminated with Cd.
Normal soils have an average content of Mn that ranges from 100 to 4000ppm with a mean value of 850ppm (NAS, 1973). Manganese is generally considered to be one of the most important toxic metals in acid soils. Several investigators pointed out that pH had the greatest effect on the availability of Mn, followed in order by organic matter and moisture
Copper (Cu)
Iron (Fe)
Soils
Total Organic Matter (TOM %) in Soil
Table 4: The average and range of the concentration of heavy metals and total organic matter (TOM %) in the soil profiles and normal soils.
** Profile A, obtained soil samples non- irrigated by the plant effluent.** Profile B, obtained soil samples irrigated by the plant effluent.** ND: Not detect.
Tom%& Heavy
Metals (PPm)
Average of Conc. Range of Conc. Average concentration
in normal soils
Profile A Profile B Profile A Profile B
TOM % 6.8 6.5 8.16-4.75 7.9-4.3 _____Cd ND ND ND ND 0.1Mn 767.35 644.76 737.27- 856.12 550.31 - 696.46 850Pb 0.029 0.012 0.008-0.067 0.002-0.03 14Zn 0.059 0.042 0.02-0.11 0.03-0.08 70Cu 0.04 0.03 0.02-0.07 0.014-0.043 45Fe 6.03 5.73 5.79-6.2 5.51-5.98 55
Heavy metals in soilsCadmium (Cd)
Manganese (Mn)
A
B
C
D

© 2014 Jordan Journal of Earth and Environmental Sciences . All rights reserved - Volume 6, Number 2 (ISSN 1995-6681)
F
E
Figure 4: Variations of TOM(A), Mn(B), Pb(C), Zn(D), Cu(E) and Fe (F) in the studied profiles with depth.
The average of Pb content in the earth’s crust range from 13 to 16 ppm (Swaine, 1978).
Soils can have a wide range of Pb content, depending on a number of factors, such as the parent material and anthropogenic input (Adriano, 1986).
The concentration of Pb in the analyzed soil samples ranges from 0.002ppm to 0.067ppm (Table 4)
The increase tendency of lead with depth in both profiles (Fig. 4C) results from transport of lead from the surface probably at relatively lower pH to the bottom where higher pH-values are expected.
Comparison of the obtained Pb-values in the study area with Pb-values in normal soils indicated that the studied soils are uncontaminated with Pb.
The Zn-concentration in the study area ranges from 0.02 at the surface to 0.11ppm at 50cm depth in the non-irrigated soil, and from 0.03ppm at the surface to 0.08ppm at 50cm depth in the irrigated soil (Table 4 and Fig. 4D). This Soil can be classified as uncontaminated with Zn
Copper is one of the important essential elements for plants and animals.
The average concentration of Cu in soils of the study area is 0.04ppm in profile A and 0.03ppm in profile B (Table 4 and Fig. 4E), so these soils can be classified as uncontaminated with Cu.
ppm).The Paired T-Test analysis indicates significant difference
in the Fe values between the two profiles as well as with the depth in the soil profile (Fig. 4F).
Generally, the Fe content of soils ranges from 10.00 to 100.00ppm (Mitchell, 1964). The distribution pattern of all measured elements shows an increasing tendency of the concentration with depth in irrigated and non-irrigated studied soils (Fig. 4F). This is probably caused by relatively increasing of pH with depth. However the obtained results are much lower than that given by Al-Ghazzawi (2009) for soils along Zarqa river and than that reported by Al-Kailani (2005) for soils irrigated by King Talal dam water. This can be explained by anthropogenic inputs to the Zarqa river, through the effluent of Khirbet Assamra and industrial waste discharged to the river.
The low values obtained in this study points to noncontamination of soils as well as the absence of anthropogenic heavy metals source in the area. The obtained results of heavy elements analyses in Al-Ramtha area are comparable with those reported by Rusan et al. (2006).
Different packages of Microsoft Office Word 2003, Excel 2003 and SPSS 8.0, chemical and biochemical data that covers ten years (2000-2009) have been used to find out the effect of upgrading that has been finished 2003 on the quality of the plant effluent.
The average percent removal of BOD in the old plant was 70.1% in summer and 67.94% in winter. This indicates that the effluent was not in agreement with the Jordanian standards, while the average removing of BOD in the new plant is 98.53% in summer and 98.5% in winter (Table 5 and Fig. 5A1 & A2). This complies with the Jordanian standards for reclaimed wastewater discharge to streams, ground water recharge, irrigation parks, reuse for irrigation of cooked vegetables, fruits, and trees, and for reclaimed wastewater reuse for fodder crops.
The concentration of Fe in the analyzed soil samples ranges from 5.51 to 6.2ppm (Table 4). The concentration of Fe in profile A (non-irrigated by plant effluent) ranges from 5.79 at the surface to 6.2ppm at 50cm depth (average 6.03 ppm) and in profile B (irrigated by plant effluent) was 5.51ppm at the surface and 5.98ppm at 50cm soil depth (average 5.73
Lead (Pb)
Zinc (Zn)
Copper (Cu)
Iron (Fe)
The effects of the upgrading of Al-Ramtha wastewater treatment plant
BOD
Table 5: The range, mean, and the standard deviation values (stdev) of the removing percentage of BOD for new plant and old plant in summer and winter seasons in the years 2000-2009.
Plant name SeasonsNumber
of samples
Range of removing percentage Mean Stdev
New plant summer 9 98.1%-99.3% 98.53% 0.35
New plant winter 9 97.3%-98.9% 98.5% 0.49
Old plant summer 9 62.5%-75.6% 70.1% 4.40
Old plant winter 9 54.8%-75.3% 67.94% 6.43
BOD_old-Summer
BOD_New-Summer
10090807060
A1
90 © 2014 Jordan Journal of Earth and Environmental Sciences . All rights reserved - Volume 6, Number 2 (ISSN 1995-6681)
Figure 5: Box-plots show the removing percentages of BOD before and after upgrading in summer (A1) and in winter (A2), of COD before and after upgrading in summer (B1) and winter (B2) and of TSS before and after upgrading in summer (C1) and winter (C2).
The average removal of COD in the old plant was 65.07% in summer and 61.67% in winter. The old plant effluent was not in agreement with the Jordanian standards, while the percentage removal of COD in the new plant is 95.53% in summer and 95.3% in winter (Table 6 and Fig. 5B1 & B2). The new plant effluent complies with Jordanian standards for reclaimed wastewater discharge to streams, ground water recharge, irrigation parks, reuse for irrigation of cooked vegetables, fruits, and trees, and for reclaimed wastewater reuse for fodder crops.
The average removal of TSS in the old plant is 69.17% in summer and 72.78% in winter. This indicates that the old plant TSS effluent was not in agreement with the Jordanian standards, while the average % removal of TSS in the new plant is 96.06% in summer and 96.86% in winter (Table 7 and Fig. 5C1 & C2). Therefore, the new plant TSS effluent complies with Jordanian standards for reclaimed wastewater discharge to streams, and water body, as also determined by Al-Zboon et al. (2008).
COD
TSS
Table 6: The range, mean, and the standard deviation values of the removing percentage of COD for new plant and old plant in summer and winter seasons (2000-2009).
Table 7: The range, mean, and the standard deviation values of the removing percentage of TSS for new plant and old plant in summer and winter seasons (2000-2009).
BOD_old-Winter
BOD_New-Winter
1009080706050
97.3
COD_old-Summer
COD_New-Summer
100908070605040
COD_old-Winter
COD_New-Winter
100908070605040
TSS_old-Summer
TSS_New-Summer
1009080706050
91.1
TSS_old-Winter
TSS_New-Winter
10090807060
A2
B1
B2
C1
C2
91
Plant name
Seasons Number of samples
Range of removing percentage Of COD
Mean Stdev
New plant summer 9 94.1%-96.8% 95.53% 0.89New plant winter 9 92.3%-96.8% 95.3% 1.69Old plant summer 9 43.8%-74.3% 65.07% 9.81Old plant winter 9 39.9%-72.6% 61.67% 12.66
Plant name Seasons Number of
samplesRange of removing
percentage Mean Stdev
New plant summer 9 91.1%-97.7% 96.06% 1.97New plant winter 9 93.2%-99.3% 96.86% 1.75Old plant summer 9 50.6%-77.6% 69.17% 8.55Old plant winter 9 61.9%-85.3% 72.78% 8.32
4. ConclusionsThe average temperature of influent wastewater in the treatment plant ranges from 15.4 to 20.4°C in winter, and from 21 to 26°C in summer. The minimum temperature in winter time is never less than 10°C; this is suitable for biodegradation of organic matter.The wastewater generated in Al-Ramtha treatment plant is classified as strong in terms of total dissolved solid content, and the efficiency of the selected technologies in removing dissolved solids from wastewater is low. Also, the wastewater is classified as strong wastewater in terms of total suspended solid content, but the efficiency of the selected technologies in removing suspended solids is reasonably high (96.46%).The treated wastewater is classified as strong wastewater in terms of BOD and COD contents, and the percent removals of BOD and COD are high. The wastewater generated in Al-Ramtha is characterized as containing high nonbiodegradable organic matter, and there is a significant reduction of this matter in the treated wastewater in the treatment plant.
1.
2.
3.
4.
This work received financial support by the Yarmouk University (Project 2009/23); we wish to express our thanks for this support.
5. Recommendations
Acknowledgments
References
Adriano, D.C., 1986. Trace elements in the terrestrial environmental. Springer Verlag. New York, pp. 533.Al-Ghazzawi, 2009. Soil pollution with heavy metals in farms along the upper course of Zarqa River. Unpublished M.Sc. thesis, Yarmouk University.Alkailani, A., 2005. Major and trace elements in soil profiles from selected Farms irrigated with King Talal dam water. Unpublished M.Sc. thesis, Yarmouk University.
Al-Zboon, K., and Al-Ananzeh, N., 2008. Performance of wastewater treatment plants in Jordan and suitability for reuse. African Journal of Biotechnology, 7 (15): 2621-2629.Arceivala, S. J., 1981. Wastewater treatment and disposal: Engineering and ecology in pollution control. Marcel Dekker, New York. Pp. 53-600.Christensen, P.D., Toth, S. J., and Bear, F. E., 1951. Soil scisoc amproc 15: 279-282.Eckenfelder, W., 1989. Industrial water pollution control. McGraw-Hill Company, New York.FAO, 2008. Wastewater treatment. Corporate Document Repository. Food and Agriculture Organization of the United Nations. http://www.fao.org/docrep/T0551E/t0551e0b.htm. 25/4/2008.Gharaibeh, S., and Farhan, Y., 2000. Introduction to environmental science, Dar Ashoroq, pp. 415, (In Arabic).Loring, D. H. and Rantala, T. T., 1992. Manual for the geochemical analysis of marine sediments and suspended particulate matter. Earth science reviews, Vol.32, pp.235-263, Elsevier Science Publishers b. V., Amsterdam.Metcalf and Eddy, 1990. Wastewater engineering: Treatment, disposal, and reuse, McGraw-Hill Company, New York. pp. 56-118.Mitchell, R, L., 1964. Trace elements in soil. In: Chemistry of the soil. Ed. F. E. Bear. ACS monogragh No. 160. Reunhold Publishing, New York.National Academy of Science (NAS), 1973. Manganese. NAS, Washington, D.C. pp. 191.Parker, J.G., and Lyons, B.J., 1979. Factors influencing the treatment of food processing wastes by anaero-bic-aerobic lagoon systems. Progress in water technology, Volume 11, pp. 377-388.Rich, L., 1980. Low-maintenance and mechanically simple wastewater treatment systems. McGraw-Hill, New York, USA, pp. 53-129.Rusan, M., Hinnawi, S., Rusan, L., 2006. Long term effect of wastewater irrigation of forage crops on soil and plant quality parameters. Desalination, 215: 143–152.Sincero, A. and Sincero, G. 1996. Environmental engineering: A design Approach. Prentice Hall, New Jersey.Swaine, D. J., (1978): J. Royal Soc. new South Wales, 111: pp. 41-47.Talyor, J.H., 1983. The geochemistry of iron and manganese in the waters and sediments of bolstadfiord. Estuarine, Costal and shelf science, Volume 17, pp. 1-19.Wedepohl, K. H., 1969. Handbook of geochemistry. Springer Verlag, New York. pp. 297-319.
[1]
[2]
[3]
[4]
[5]
[6]
[7]
[8]
[9]
[10]
[11]
[12]
[13]
[14]
[15]
[16]
[17]
[18]
[19]
[20]
© 2014 Jordan Journal of Earth and Environmental Sciences . All rights reserved - Volume 6, Number 2 (ISSN 1995-6681) 92
Regards to the selected elements in this study, the new plant effluent complies with Jordanian standards for irrigation parks, reuse for irrigation of cooked vegetables, fruits, and trees, and for reclaimed wastewater reuse for fodder crops, exception the upper limit of guideline values of the Jordan standards for TDS concentration of effluent used for irrigation purposes.The effluent is not suitable for those vegetables that are eaten uncooked, such as tomato, carrot and green leaf vegetables.The obtained concentration of all analyzed metals indicate that the studied soils are uncontaminated with respect to Cd, Zn, Mn, Pb, Cu and Fe ( the soils are unpolluted in regarding to heavy metals). The upgrading which took place on 2003 adds significant improvement in the process of plant treatment with respect to TSS, BOD and COD, but not with respect to TDS.
Construction additional treatment stage to reduced TDS in the plant effluent.Further investigation is needed to study the effect of using treated water on food chain.Organizing programs to increase the farmer’s awareness for the right using of treated water, pesticides and fertilizers.
5.
6.
7.
8.
1.
2.
3.
Recommended