P
J
T
siP
ddt
v4
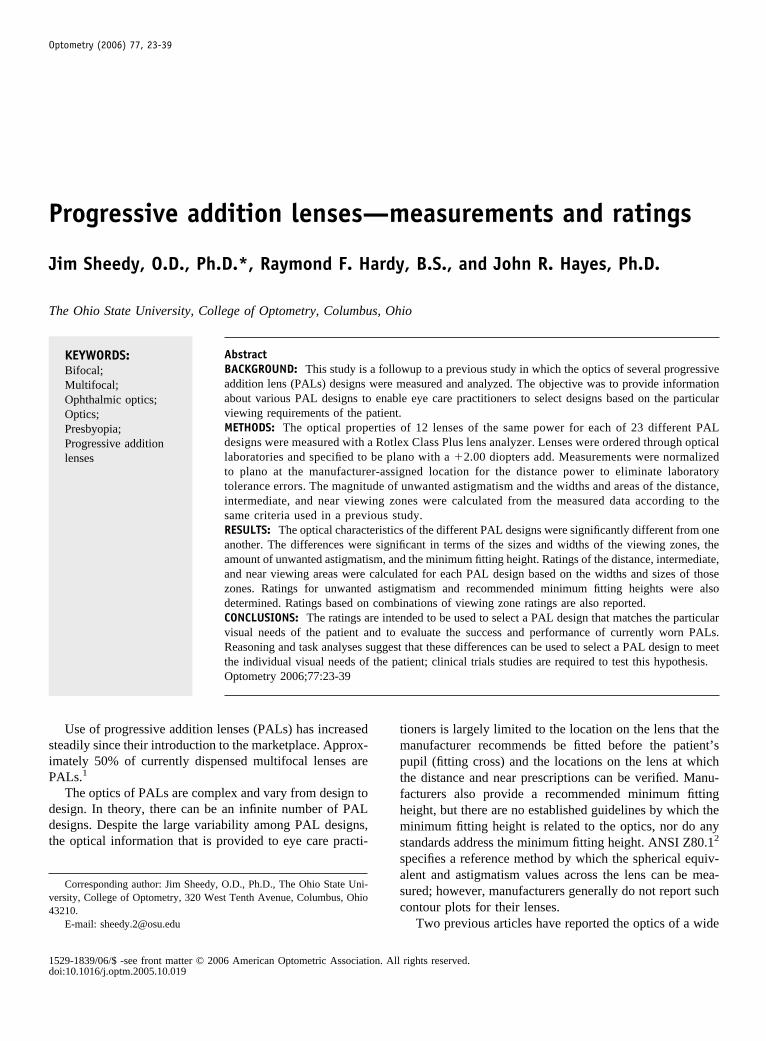
Optometry (2006) 77, 23-39
1d
rogressive addition lenses—measurements and ratings
im Sheedy, O.D., Ph.D.*, Raymond F. Hardy, B.S., and John R. Hayes, Ph.D.
he Ohio State University, College of Optometry, Columbus, Ohio
AbstractBACKGROUND: This study is a followup to a previous study in which the optics of several progressiveaddition lens (PALs) designs were measured and analyzed. The objective was to provide informationabout various PAL designs to enable eye care practitioners to select designs based on the particularviewing requirements of the patient.METHODS: The optical properties of 12 lenses of the same power for each of 23 different PALdesigns were measured with a Rotlex Class Plus lens analyzer. Lenses were ordered through opticallaboratories and specified to be plano with a �2.00 diopters add. Measurements were normalizedto plano at the manufacturer-assigned location for the distance power to eliminate laboratorytolerance errors. The magnitude of unwanted astigmatism and the widths and areas of the distance,intermediate, and near viewing zones were calculated from the measured data according to thesame criteria used in a previous study.RESULTS: The optical characteristics of the different PAL designs were significantly different from oneanother. The differences were significant in terms of the sizes and widths of the viewing zones, theamount of unwanted astigmatism, and the minimum fitting height. Ratings of the distance, intermediate,and near viewing areas were calculated for each PAL design based on the widths and sizes of thosezones. Ratings for unwanted astigmatism and recommended minimum fitting heights were alsodetermined. Ratings based on combinations of viewing zone ratings are also reported.CONCLUSIONS: The ratings are intended to be used to select a PAL design that matches the particularvisual needs of the patient and to evaluate the success and performance of currently worn PALs.Reasoning and task analyses suggest that these differences can be used to select a PAL design to meetthe individual visual needs of the patient; clinical trials studies are required to test this hypothesis.Optometry 2006;77:23-39
KEYWORDS:Bifocal;Multifocal;Ophthalmic optics;Optics;Presbyopia;Progressive additionlenses
tmptfhmssasc
Use of progressive addition lenses (PALs) has increasedteadily since their introduction to the marketplace. Approx-mately 50% of currently dispensed multifocal lenses areALs.1
The optics of PALs are complex and vary from design toesign. In theory, there can be an infinite number of PALesigns. Despite the large variability among PAL designs,he optical information that is provided to eye care practi-
Corresponding author: Jim Sheedy, O.D., Ph.D., The Ohio State Uni-ersity, College of Optometry, 320 West Tenth Avenue, Columbus, Ohio3210.
E-mail: [email protected]
529-1839/06/$ -see front matter © 2006 American Optometric Association. Alloi:10.1016/j.optm.2005.10.019
ioners is largely limited to the location on the lens that theanufacturer recommends be fitted before the patient’s
upil (fitting cross) and the locations on the lens at whichhe distance and near prescriptions can be verified. Manu-acturers also provide a recommended minimum fittingeight, but there are no established guidelines by which theinimum fitting height is related to the optics, nor do any
tandards address the minimum fitting height. ANSI Z80.12
pecifies a reference method by which the spherical equiv-lent and astigmatism values across the lens can be mea-ured; however, manufacturers generally do not report suchontour plots for their lenses.
Two previous articles have reported the optics of a wide
rights reserved.

sptudaophfttaopedtip
ohitrwceh
psmdov
wmsCsltlamtrttcpr
a
RblSst
M
M
ToCamawst
atsmssswtaLascfis
1(w0b
D
Iddimatd
24 Optometry, Vol 77, No 1, January 2006
election of PALs using systematic methods.3,4 One3 re-orted the optical measurements of 28 PAL designs; con-our plots were measured and analyzed for magnitude ofnwanted astigmatism and the widths and areas of theistance, intermediate, and near viewing zones. Visual tasknalyses indicated that the measured variances in the sizesf the viewing zones would affect vision; therefore, com-arison of PAL designs based on the measured zone sizesad reasoned validity. A lens rating system was developedor distance, intermediate, and near viewing zones based onhe measured characteristics for each lens compared withhe measured range across lenses. A rating for unwantedstigmatism was also developed. The ratings were on a scalef 0 to 100 and were intended to be used by eye carerofessionals to improve the visual care of their patients bynabling them to select a PAL design with viewing zone andistortion characteristics that match the viewing needs ofhe particular patient. Postpublication feedback to the authorndicates that numerous clinicians use the ratings for thaturpose.
There was also a strong, but mixed, response from thephthalmic industry to the publication.3 In the past, PALsave been marketed largely with nontechnical messagesntended to develop brand loyalty among eye care practi-ioners. The study results and the intended use of theeported ratings have potential to change the method byhich clinicians select PALs for their patients and hence to
hange the marketing paradigm. Some companies havembraced the results of the previous study, whereas othersave not.
The methods for measuring the sphere and cylinderowers used in the previous study3 and in this study aretraightforward. The methods of analyzing those measure-ents and the rationale for developing the ratings are
iscussed and specified. However, there can certainly bether methods of measuring, comparing, and analyzing thearious PAL designs.
The current study is a followup to the previous one,3 inhich one limitation was that only 1 lens of each design waseasured and analyzed. We have subsequently developed
oftware that enables us to analyze lenses in less time.onsequently, in this study, we are able to report mean and
tandard deviations based on measurements of severalenses of each design. The mean value is a better represen-ative of the PAL design than the value based on a singleens. Measurement of multiple lenses of each design alsollows statistical testing of the differences between theeasurements and ratings of the various PAL designs. Also,
he standard deviation of the measurements and ratings is aepresentative of the manufacturing consistency. Manufac-uring consistency is important for clinical care. Inconsis-ency can negatively affect vision in terms of matching theharacteristics of the right and left lenses, ordering a newrescription of the same PAL design for a patient, oreplacing a single lens for a patient.
In the current study, the measurement methods and
nalysis criteria are the same as those used previously.3 mesults are reported as the mean and standard deviationased on measurements of 12 lenses comprised of 6 right/eft pairs acquired separately through laboratory channels.everal of the measured PAL designs are newly introducedince the last study, and some of the measured designs arehe same as in the previous study.
ethods
easurement method
he lens measurement method was identical to that previ-usly reported.3 All lenses were measured using the Rotlexlass Plus lens analyzer to provide sphere, cylinder, andxis values across the surface of the lens. The lenses wereeasured by aligning the prism reference line markings
ppropriately in the instrument. All of the measurementsere made using the Rotlex “DST” mode; hence, all mea-
urements were normalized to an assigned power of plano athe location recommended by the manufacturer.
The criteria for determining zone width and area werelso the same as in the previous study,3 but the implemen-ation was different. In the previous study, the Rotlexoftware was used to analyze each lens file. Widths wereeasured by an operator who recorded each width in 1-mm
teps up and down the corridor. Areas were calculated byumming the widths, thereby integrating area in 1-mmteps. In the current study, the ASCII data file for each lensas exported into a parser software program developed for
his purpose. The data file contained X and Y coordinatesnd sphere, cylinder, and axis values in a 1/2-mm grid.inear interpolation was performed to create data points in1/32-mm grid. The data file could be parsed according to
pecific values or ranges of each of the values (X, Y, sphere,ylinder, or axis) separately or in combination. The datales were parsed using the same criteria as in the previoustudy3 to define zone widths and areas.
The distance zone widths and areas were constrained by.5 mm above the fitting cross, and by �0.25 dioptersphereDS) and 0.50 dioptercylinders (DC). The intermediate zoneas constrained by adds of �0.75 DS and �1.50 DS and by.50 DC. The near zone was constrained by �1.75 DS andy 0.50 DC.
etermining sample size
t was necessary to determine the number of lenses of eachesign that would be required for testing to achieve aesired level of confidence. There are 2 sources of variabil-ty when measuring several lenses of the same design: theethod variability is variability as determined by measuring
nd analyzing the same lens repeatedly and the manufac-uring variability is the variability in lenses of the sameesign and prescription. The method variance was tested by
easuring and calculating ratings twice for each of 10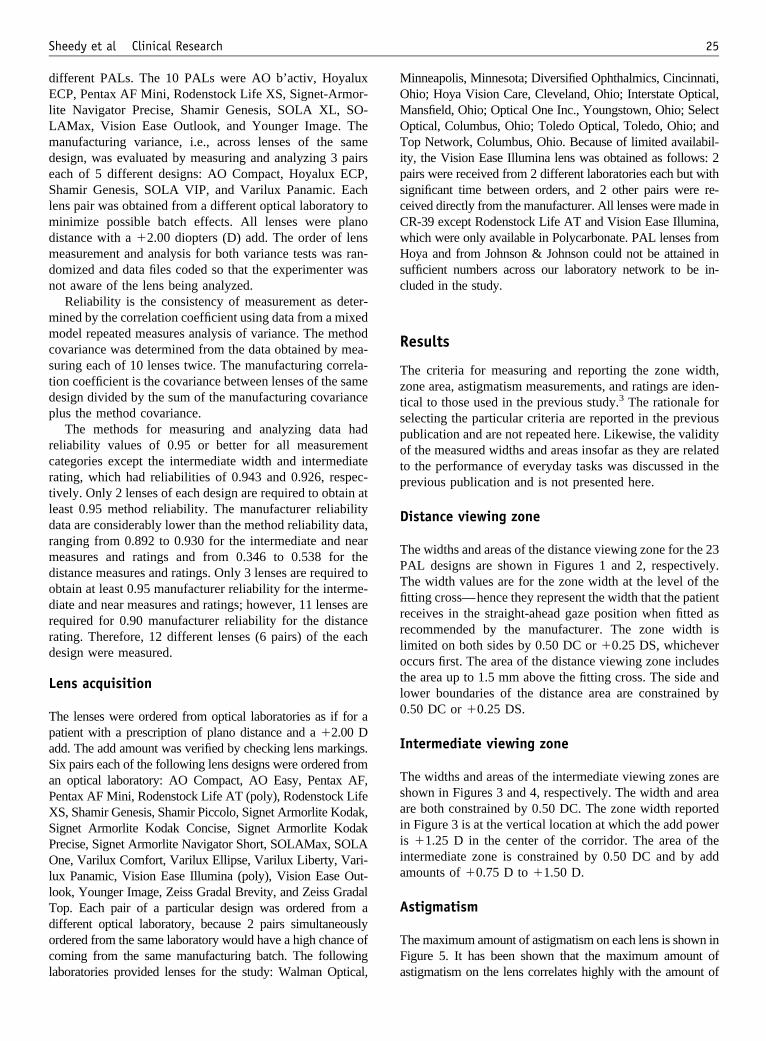
dElLmdeSlmdmdn
mmcstdp
rcrtldrmdodrrd
L
TpaSaPXSPOllTdocl
MOMOTipscCwHsc
R
Tztspotp
D
TPTfirrlotl0
I
Tsaiiia
A
TF
25Sheedy et al Clinical Research
ifferent PALs. The 10 PALs were AO b’activ, HoyaluxCP, Pentax AF Mini, Rodenstock Life XS, Signet-Armor-
ite Navigator Precise, Shamir Genesis, SOLA XL, SO-AMax, Vision Ease Outlook, and Younger Image. Theanufacturing variance, i.e., across lenses of the same
esign, was evaluated by measuring and analyzing 3 pairsach of 5 different designs: AO Compact, Hoyalux ECP,hamir Genesis, SOLA VIP, and Varilux Panamic. Each
ens pair was obtained from a different optical laboratory toinimize possible batch effects. All lenses were plano
istance with a �2.00 diopters (D) add. The order of lenseasurement and analysis for both variance tests was ran-
omized and data files coded so that the experimenter wasot aware of the lens being analyzed.
Reliability is the consistency of measurement as deter-ined by the correlation coefficient using data from a mixedodel repeated measures analysis of variance. The method
ovariance was determined from the data obtained by mea-uring each of 10 lenses twice. The manufacturing correla-ion coefficient is the covariance between lenses of the sameesign divided by the sum of the manufacturing covariancelus the method covariance.
The methods for measuring and analyzing data hadeliability values of 0.95 or better for all measurementategories except the intermediate width and intermediateating, which had reliabilities of 0.943 and 0.926, respec-ively. Only 2 lenses of each design are required to obtain ateast 0.95 method reliability. The manufacturer reliabilityata are considerably lower than the method reliability data,anging from 0.892 to 0.930 for the intermediate and neareasures and ratings and from 0.346 to 0.538 for the
istance measures and ratings. Only 3 lenses are required tobtain at least 0.95 manufacturer reliability for the interme-iate and near measures and ratings; however, 11 lenses areequired for 0.90 manufacturer reliability for the distanceating. Therefore, 12 different lenses (6 pairs) of the eachesign were measured.
ens acquisition
he lenses were ordered from optical laboratories as if for aatient with a prescription of plano distance and a �2.00 Ddd. The add amount was verified by checking lens markings.ix pairs each of the following lens designs were ordered fromn optical laboratory: AO Compact, AO Easy, Pentax AF,entax AF Mini, Rodenstock Life AT (poly), Rodenstock LifeS, Shamir Genesis, Shamir Piccolo, Signet Armorlite Kodak,ignet Armorlite Kodak Concise, Signet Armorlite Kodakrecise, Signet Armorlite Navigator Short, SOLAMax, SOLAne, Varilux Comfort, Varilux Ellipse, Varilux Liberty, Vari-
ux Panamic, Vision Ease Illumina (poly), Vision Ease Out-ook, Younger Image, Zeiss Gradal Brevity, and Zeiss Gradalop. Each pair of a particular design was ordered from aifferent optical laboratory, because 2 pairs simultaneouslyrdered from the same laboratory would have a high chance ofoming from the same manufacturing batch. The following
aboratories provided lenses for the study: Walman Optical, ainneapolis, Minnesota; Diversified Ophthalmics, Cincinnati,hio; Hoya Vision Care, Cleveland, Ohio; Interstate Optical,ansfield, Ohio; Optical One Inc., Youngstown, Ohio; Selectptical, Columbus, Ohio; Toledo Optical, Toledo, Ohio; andop Network, Columbus, Ohio. Because of limited availabil-
ty, the Vision Ease Illumina lens was obtained as follows: 2airs were received from 2 different laboratories each but withignificant time between orders, and 2 other pairs were re-eived directly from the manufacturer. All lenses were made inR-39 except Rodenstock Life AT and Vision Ease Illumina,hich were only available in Polycarbonate. PAL lenses fromoya and from Johnson & Johnson could not be attained in
ufficient numbers across our laboratory network to be in-luded in the study.
esults
he criteria for measuring and reporting the zone width,one area, astigmatism measurements, and ratings are iden-ical to those used in the previous study.3 The rationale forelecting the particular criteria are reported in the previousublication and are not repeated here. Likewise, the validityf the measured widths and areas insofar as they are relatedo the performance of everyday tasks was discussed in therevious publication and is not presented here.
istance viewing zone
he widths and areas of the distance viewing zone for the 23AL designs are shown in Figures 1 and 2, respectively.he width values are for the zone width at the level of thetting cross—hence they represent the width that the patienteceives in the straight-ahead gaze position when fitted asecommended by the manufacturer. The zone width isimited on both sides by 0.50 DC or �0.25 DS, whicheverccurs first. The area of the distance viewing zone includeshe area up to 1.5 mm above the fitting cross. The side andower boundaries of the distance area are constrained by.50 DC or �0.25 DS.
ntermediate viewing zone
he widths and areas of the intermediate viewing zones arehown in Figures 3 and 4, respectively. The width and areare both constrained by 0.50 DC. The zone width reportedn Figure 3 is at the vertical location at which the add powers �1.25 D in the center of the corridor. The area of thentermediate zone is constrained by 0.50 DC and by addmounts of �0.75 D to �1.50 D.
stigmatism
he maximum amount of astigmatism on each lens is shown inigure 5. It has been shown that the maximum amount of
stigmatism on the lens correlates highly with the amount of
aud
N
TFctimnd
pfr6fitcfi
M
Tfi
r is sta
26 Optometry, Vol 77, No 1, January 2006
stigmatism elsewhere on the lens and that the magnitude ofnwanted astigmatism is a fundamental measure of the lensesign.5
ear viewing zone
he widths and areas of the near viewing zone are shown inigures 6 and 7, respectively. The near widths and areas areonstrained to have less than 0.50 DC and also to have morehan a �1.75 D add. An add level of �1.75 D was usednstead of the nominal add power of �2.00 D, becauseany lenses do not attain an add amount of �2.00 D.3 The
ear zone width and area values depend on the downwardistance from the fitting cross.
0 5
Pentx AF MiniPentx AF
Shamir PiccoloSig Nav Short
SOLA OneSOLAMax
AO CompactSig Kod Concise
Varlx EllipseAO Easy
Rdnstk Life XSZei Gradal Brevity
Varlx PanamicVis Ease Illumina
Varlx LibertyVarlx Comfort
Sig Kod PreciseSig Kodak
Zei Gradal TopYounger Image
Rdnstk Life AT polyVis Ease Outlk
Shamir Genesis
D
Figure 1 Width of the distance zone (error ba
0 10 20
Pentx AF MiniPentx AF
Shamir PiccoloSig Nav Short
SOLA OneSOLAMax
Sig Kod ConciseAO CompactVarlx Ellipse
Rdnstk Life XSAO Easy
Zei Gradal BrevityVarlx Liberty
Varlx PanamicVis Ease Illumina
Varlx ComfortSig Kod Precise
Sig KodakYounger ImageZei Gradal Top
Rdnstk Life AT polyVis Ease Outlk
Shamir Genesis
Figure 2 Area of the dis
In practical use, the amount of the near zone available to theatient depends on the fitting height of the lens in the spectaclerame. Because any given PAL design can be fitted over aange of fitting heights, the widths and areas shown in Figuresand 7 are reported for 3 representative distances from the
tting cross. Fitting height, however, must also include addi-ional height for the frame bevel and to allow for some pupiloverage. Therefore, 2 mm is added to the distance from thetting cross to derive fitting height values.
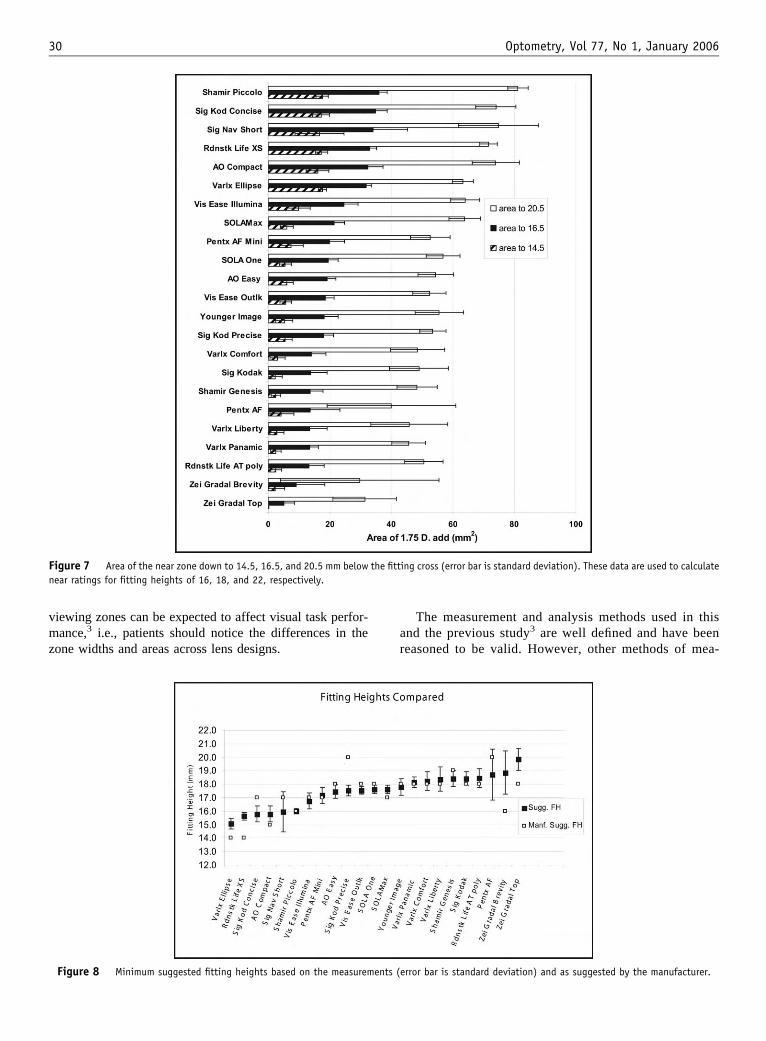
inimum fitting heights
he manufacturer specifies the minimum recommendedtting height for each PAL design. The specific methods for
10 15 20
Zone Width (mm)
ndard deviation) at the level of the fitting cross.
30 40 50 60 70
ance Area (mm2)
istance
Dist
tance viewing zone.

dnct
Dfi�mfdss
mdmmhmtbl�hfF
ate zon
27Sheedy et al Clinical Research
etermining the minimum recommended fitting height areot revealed by the manufacturer nor are there standards orommonly recognized methods that apply to determininghe claimed minimum fitting height.
In this study, we measured the highest level at which �1.75add occurred in each lens design. Of course, the minimum
tting height will be greater than the highest occurrence of the1.75 D add because of the frame bevel and the fact that someinimum amount of the near zone must be exposed above the
rame to enable a minimum level of functional near vision. Toetermine the amount by which the minimum fitting heighthould exceed the highest occurrence of the �1.75 D add, weubtracted the highest occurrence of the �1.75 D from the
0 1
Varlx Ellipse
Sig Kod Concise
Rdnstk Life XS
AO Compact
Sig Nav Short
Vis Ease Illumina
Sig Kod Precise
Varlx Comfort
Shamir Piccolo
Vis Ease Outlk
AO Easy
Shamir GenesisSOLA One
Younger Image
Varlx Liberty
Rdnstk Life AT poly
Varlx Panamic
Sig Kodak
SOLAMax
Zei Gradal Top
Zei Gradal Brevity
Pentx AF Mini
Pentx AF
In
Figure 3 Width of the intermedi
0 5 10
Varlx EllipseRdnstk Life XS
AO CompactSig Kod Concise
Vis Ease IlluminaSig Nav Short
Shamir PiccoloVis Ease Outlk
Shamir GenesisSig Kod Precise
AO Easy Varlx Comfort
SOLA OneVarlx Panamic
Rdnstk Life AT polyYounger Image
SOLAMaxSig Kodak
Varlx LibertyZei Gradal Top
Zei Gradal BrevityPentx AF Mini
Pentx AF
I
Figure 4 Area of the intermediate zone
anufacturer recommended minimum fitting height across allesigns. Across all designs, the average difference was 4.1m. Therefore, the criterion we used to develop our recom-ended minimum fitting height was to add 4.0 mm to the
ighest occurrence of the �1.75 D add. In this manner, theinimum fitting heights recommended herein are, on average,
he same as those currently recommended by manufacturers,ut the minimum fitting height recommended for any particu-ar design is related to the measured highest occurrence of1.75 add for that design. The recommended minimum fitting
eights based on measurements herein, along with the manu-acturer recommended minimum fitting heights are shown inigure 8.
3 4 5 6ate Zone Width (mm)
e (error bar is standard deviation).
20 25 30 35 40 45
diate Area (mm2)
2termedi
15
nterme
(error bar is standard deviation).

S
RzmTfTaomgmTrmvoar
a
tlabm
zoowtttfi
r4bdtf
tigmat
28 Optometry, Vol 77, No 1, January 2006
ingle attribute lens ratings
atings for the distance, intermediate, and near viewingones and also for astigmatism were derived for eacheasured lens from the data shown in Figures 1 through 7.he basis for establishing the ratings are identical to those
rom the previous study3 and are summarized in Table 1.he viewing zone ratings are comprised of equal parts widthnd area. For each the width and the area, a rating on a scalef 0 to 100 is calculated based on the location of theeasured value within the range shown in Table 1. Ratings
reater than 100 or less than zero are possible when theeasured value is outside of the range shown in Table 1.he ratings for width and area are averaged to determine the
ating for the viewing zone. The 0 to 100 rating for astig-atism is entirely based on the location of the measured
alue within the range specified in Table 1. Lower amountsf astigmatism result in higher rating values. Further detailsbout the conversion of measurements to ratings have beeneported previously.3
The single-attribute ratings for various aspects of PALs
0
Rdnstk Life AT poly
Varlx Comfort
Vis Ease Outlk
Sig Nav Short
Rdnstk Life XS
Sig Kodak
Zei Gradal Top
Sig Kod Concise
Varlx Liberty
Younger Image
Varlx Ellipse
Pentx AF
Shamir Genesis
SOLAMax
Sig Kod Precise
Shamir Piccolo
Vis Ease Illumina
Pentx AF Mini
SOLA One
AO Compact
Zei Gradal Brevity
AO Easy
Varlx Panamic
Highest ma
Figure 5 Greatest magnitude of as
re presented in Tables 2 through 4. Each table also shows l
he lens ratings, which, based on the measurements on 12enses of each design, are not statistically different from onenother. Lenses in those tables with nonoverlapping sym-ols (black circle) were significantly different at p � 0.05 aseasured by adjusted Tukey B paired comparisons.6
The ratings for the distance and intermediate viewingones are shown in Table 2. Near ratings for fitting heightsf 16 and 18 mm are shown in Table 3 and for fitting heightf 22 in Table 4. The same 0 to 100 ranges are used for nearidth and area regardless of the fitting height. As a result,
he ratings can also be compared across fitting heights, i.e.,he increased ratings for higher fitting heights reflect the facthat more near viewing zone is attained with the greatertting height. Astigmatism ratings are shown in Table 4.
The PAL designs that are the “highest” and “lowest”ated in each category are shown in bold in Tables 2 through. Lens designs are categorized into the highest-rated groupy either exceeding the grand mean by more than 1 standardeviation or by being in a grouping of lenses at the top ofhe ratings that are not statistically significantly differentrom one another. The lowest category is determined simi-
2 3
e unwanted astigmatism (D)
ism (error bar is standard deviation).
1
gnitud
arly except for being lower than 1 standard deviation from
tt
C
Iptpoifd(na
odcw
Twlctaii
D
Taittostc
Fr
29Sheedy et al Clinical Research
he grand mean or not significantly different from others athe bottom of the list.
ombination categories
t is possible that optimal lens selection for individualatients might be best accomplished by taking into accounthe ratings in more than one of the above attributes. Theseatients will benefit from good characteristics in more thanne viewing zone. For this reason, the single-attribute rat-ngs in Tables 2 through 4 were combined to create theollowing combined categories: (1) Distance and interme-iate vision (Table 5); (2) intermediate and near visionTable 6); (3) general purpose—distance, intermediate, andear vision (Table 7); and (4) general purpose—distancend near vision (Table 8).
For each combined usage category, a rating value basedn an average of the component ratings (distance, interme-iate, near, and/or astigmatism) appropriate to that usageategory was calculated for each lens. Astigmatism was
igure 6 Width of the near zone at 14, 16, and 20 mm below the fittiatings for fitting heights of 16, 18, and 22, respectively.
eighted 25% in those categories for which it is included. t
he mean and standard deviation for each lens designithin each category was computed. This resulted in calcu-
ated means, standard deviations, and ranges of nonsignifi-ant differences similar to the data presented in Tables 2hrough 4. The lens ratings, the results of statistical testing,nd calculations of those with the highest and lowest ratingsn each of Tables 5 through 8 are calculated and presentedn the same manner as in Tables 2 through 4.
iscussion
he measurements and analyses of the PALs in this studyre performed with the goal of providing clinicians withnformation that will assist them in providing appropriatereatment options for their patients. There are tradeoffs inhe design of a PAL5; therefore, no single design can beptimized for all characteristics. The measurements in thistudy show that the balance of tradeoffs can vary widely forhe various PAL designs in the market. Previous analyses ofommon visual tasks show that the measured variances in
s (error bar is standard deviation). These data are used to calculate near
ng croshe widths and areas of the distance, intermediate, and near
vmz
ar
Fn
30 Optometry, Vol 77, No 1, January 2006
iewing zones can be expected to affect visual task perfor-ance,3 i.e., patients should notice the differences in the
one widths and areas across lens designs.
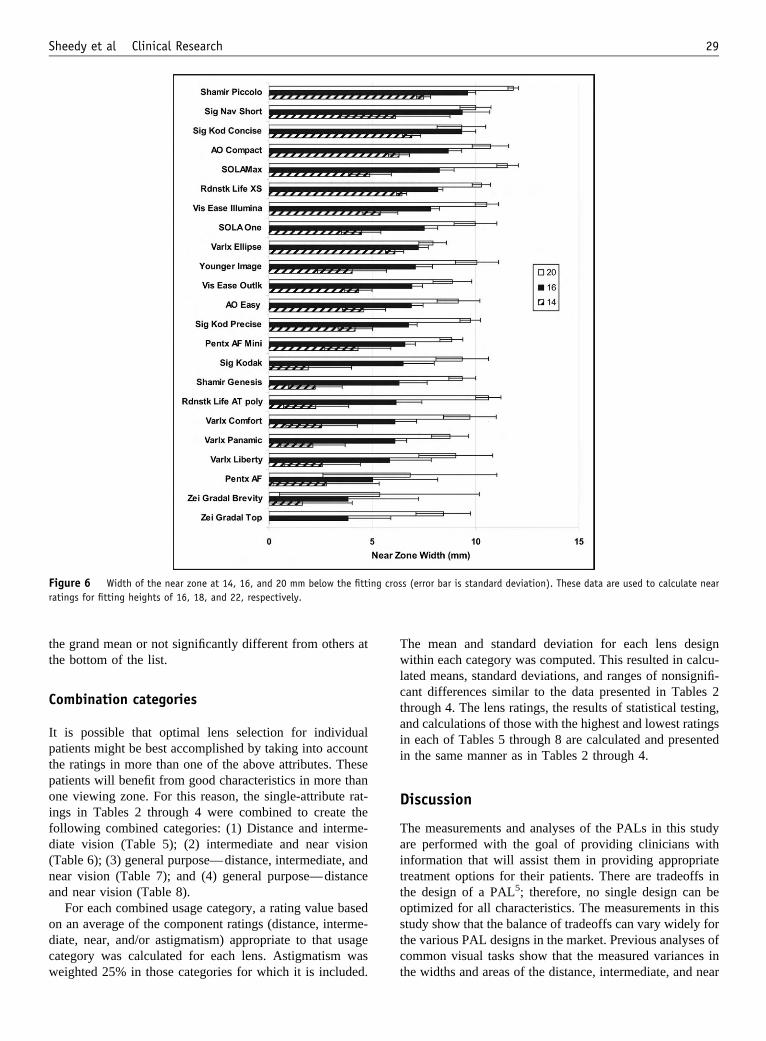
igure 7 Area of the near zone down to 14.5, 16.5, and 20.5 mm belowear ratings for fitting heights of 16, 18, and 22, respectively.
Figure 8 Minimum suggested fitting heights based on the measurements (e
The measurement and analysis methods used in thisnd the previous study3 are well defined and have beeneasoned to be valid. However, other methods of mea-
ing cross (error bar is standard deviation). These data are used to calculate
the fittrror bar is standard deviation) and as suggested by the manufacturer.
sUwua
M
Bmitt(tt
epllimmssTt
issdmuplat
psw
1wgpAdaa
U
Dmtipl
u
tdpdsttltfsseaps
31Sheedy et al Clinical Research
urement and analysis could certainly be developed.ltimately, the true test of any PAL assessment systemill be patient performance and acceptance. Plans arenderway to test both performance and lens preference inclinical trials study.
ethodology
ecause of the measurement methodology, the measure-ents represent the PAL optics that are “in addition” to the
ntended prescription and, therefore, can reasonably applyo all distance prescriptions fabricated from the base curvehat was tested. Only one base curve was tested in this studythe base curve that is used for a plano prescription);herefore, consistency of design across base curves was notested.
The data in the current study are based on 12 lenses ofach design; this offers advantages over the data in therevious study, which were based on measurements of 1ens of each design.3 First, values based on an average of 12enses enables a better estimate of the population mean, i.e.,t gives a truer measure of the design characteristic. Also,ultiple lenses of each enables statistical testing to deter-ine if measurements and ratings of one lens design are
ignificantly different from others. The results of suchtatistical testing are shown in the ratings presented inables 2 through 8 and have also been used to help identify
he highest and lowest rated lenses in each category.The standard deviations shown in Tables 2 through 4
ndicate the spread of the data for each lens design. Lowertandard deviations are better because they indicate greaterimilarity among the 12 lenses of each design. The standardeviation of measurement could be used as a measure of theanufacturing consistency; however, the sample selection
sed in this study is probably inadequately sized for thisurpose. Although lenses were obtained from differentaboratories or over different time periods to avoid batchffects, our sample size is relatively small compared withhe entire population of lenses in the marketplace.
Another area of improvement of the current study over therevious one is in the calculation of zone areas. In the previoustudy,3 the areas were integrated in 1-mm vertical steps. This
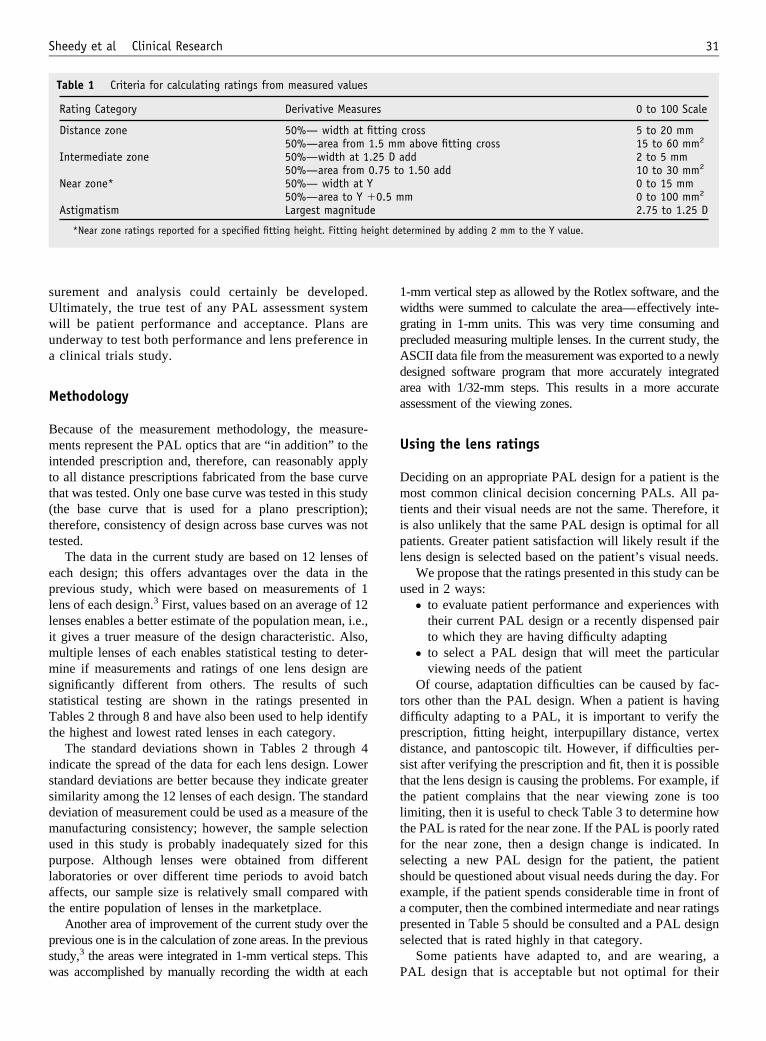
Table 1 Criteria for calculating ratings from measured values
Rating Category Derivative Measur
Distance zone 50%— width at fi50%—area from
Intermediate zone 50%—width at 150%—area from
Near zone* 50%— width at Y50%—area to Y �
Astigmatism Largest magnitud
*Near zone ratings reported for a specified fitting height. Fitting he
as accomplished by manually recording the width at each P
-mm vertical step as allowed by the Rotlex software, and theidths were summed to calculate the area—effectively inte-rating in 1-mm units. This was very time consuming andrecluded measuring multiple lenses. In the current study, theSCII data file from the measurement was exported to a newlyesigned software program that more accurately integratedrea with 1/32-mm steps. This results in a more accuratessessment of the viewing zones.
sing the lens ratings
eciding on an appropriate PAL design for a patient is theost common clinical decision concerning PALs. All pa-
ients and their visual needs are not the same. Therefore, its also unlikely that the same PAL design is optimal for allatients. Greater patient satisfaction will likely result if theens design is selected based on the patient’s visual needs.
We propose that the ratings presented in this study can besed in 2 ways:
● to evaluate patient performance and experiences withtheir current PAL design or a recently dispensed pairto which they are having difficulty adapting
● to select a PAL design that will meet the particularviewing needs of the patient
Of course, adaptation difficulties can be caused by fac-ors other than the PAL design. When a patient is havingifficulty adapting to a PAL, it is important to verify therescription, fitting height, interpupillary distance, vertexistance, and pantoscopic tilt. However, if difficulties per-ist after verifying the prescription and fit, then it is possiblehat the lens design is causing the problems. For example, ifhe patient complains that the near viewing zone is tooimiting, then it is useful to check Table 3 to determine howhe PAL is rated for the near zone. If the PAL is poorly ratedor the near zone, then a design change is indicated. Inelecting a new PAL design for the patient, the patienthould be questioned about visual needs during the day. Forxample, if the patient spends considerable time in front ofcomputer, then the combined intermediate and near ratingsresented in Table 5 should be consulted and a PAL designelected that is rated highly in that category.
Some patients have adapted to, and are wearing, a
0 to 100 Scale
cross 5 to 20 mmabove fitting cross 15 to 60 mm2
dd 2 to 5 mm1.50 add 10 to 30 mm2
0 to 15 mmm 0 to 100 mm2
2.75 to 1.25 D
termined by adding 2 mm to the Y value.
es
tting1.5 mm.25 D a0.75 to
0.5 me
ight de
AL design that is acceptable but not optimal for their
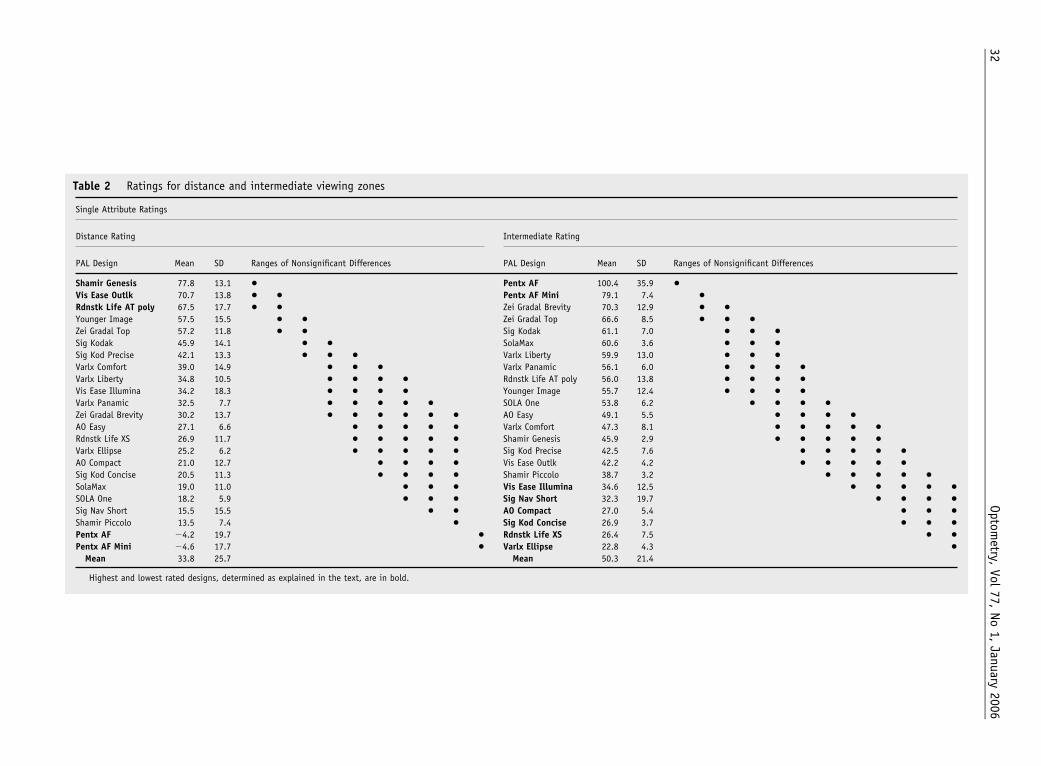
Table 2 Ratings for distance and intermediate viewing zones
Single Attribute Ratings
Distance Rating Intermediate Rating
PAL Design Mean SD Ranges of Nonsignificant Differences PAL Design Mean SD Ranges of Nonsignificant Differences
Shamir Genesis 77.8 13.1 ● Pentx AF 100.4 35.9 ●
Vis Ease Outlk 70.7 13.8 ● ● Pentx AF Mini 79.1 7.4 ●
Rdnstk Life AT poly 67.5 17.7 ● ● Zei Gradal Brevity 70.3 12.9 ● ●
Younger Image 57.5 15.5 ● ● Zei Gradal Top 66.6 8.5 ● ● ●
Zei Gradal Top 57.2 11.8 ● ● Sig Kodak 61.1 7.0 ● ● ●
Sig Kodak 45.9 14.1 ● ● SolaMax 60.6 3.6 ● ● ●
Sig Kod Precise 42.1 13.3 ● ● ● Varlx Liberty 59.9 13.0 ● ● ●
Varlx Comfort 39.0 14.9 ● ● ● Varlx Panamic 56.1 6.0 ● ● ● ●
Varlx Liberty 34.8 10.5 ● ● ● ● Rdnstk Life AT poly 56.0 13.8 ● ● ● ●
Vis Ease Illumina 34.2 18.3 ● ● ● ● Younger Image 55.7 12.4 ● ● ● ●
Varlx Panamic 32.5 7.7 ● ● ● ● ● SOLA One 53.8 6.2 ● ● ● ●
Zei Gradal Brevity 30.2 13.7 ● ● ● ● ● ● AO Easy 49.1 5.5 ● ● ● ●
AO Easy 27.1 6.6 ● ● ● ● ● Varlx Comfort 47.3 8.1 ● ● ● ● ●
Rdnstk Life XS 26.9 11.7 ● ● ● ● ● Shamir Genesis 45.9 2.9 ● ● ● ● ●
Varlx Ellipse 25.2 6.2 ● ● ● ● ● Sig Kod Precise 42.5 7.6 ● ● ● ● ●
AO Compact 21.0 12.7 ● ● ● ● Vis Ease Outlk 42.2 4.2 ● ● ● ● ●
Sig Kod Concise 20.5 11.3 ● ● ● ● Shamir Piccolo 38.7 3.2 ● ● ● ● ●
SolaMax 19.0 11.0 ● ● ● Vis Ease Illumina 34.6 12.5 ● ● ● ● ●
SOLA One 18.2 5.9 ● ● ● Sig Nav Short 32.3 19.7 ● ● ● ●
Sig Nav Short 15.5 15.5 ● ● AO Compact 27.0 5.4 ● ● ●
Shamir Piccolo 13.5 7.4 ● Sig Kod Concise 26.9 3.7 ● ● ●
Pentx AF �4.2 19.7 ● Rdnstk Life XS 26.4 7.5 ● ●
Pentx AF Mini �4.6 17.7 ● Varlx Ellipse 22.8 4.3 ●
Mean 33.8 25.7 Mean 50.3 21.4
Highest and lowest rated designs, determined as explained in the text, are in bold.
32Optom
etry,Vol
77,No
1,January
2006

Table 3 Ratings for near viewing zones—fitting heights of 16 and 18 Single Attribute Ratings
Near Zone Rating
Fitting Height 16 Fitting Height 18
PAL Design Mean SD Ranges of Nonsignificant Differences PAL Design Mean SD Ranges of Nonsignificant Differences
Shamir Piccolo 33.7 2.1 ● Shamir Piccolo 50.1 2.5 ●Sig Kod Concise 31.6 2.7 ● Sig Kod Concise 48.5 4.0 ● ●Rdnstk Life XS 30.0 1.5 ● ● Sig Nav Short 48.2 10.0 ● ●Varilux Ellipse 29.1 1.8 ● ● AO Compact 45.1 4.5 ● ● ●AO Compact 29.0 3.4 ● ● Rdnstk Life XS 43.7 1.7 ● ● ● ●Sig Nav Short 28.7 12.7 ● ● Varlx Ellipse 40.0 2.3 ● ● ● ●Vis Ease Illumina 22.8 4.7 ● ● Vis Ease Illumina 38.3 3.6 ● ● ●SolaMax 19.3 4.5 ● ● SolaMax 38.2 4.0 ● ● ● ●AO Easy 18.4 4.4 ● ● ● SOLA One 34.8 3.8 ● ● ● ●Pentax AF Mini 18.1 7.2 ● ● ● Younger Image 32.7 4.9 ● ● ● ●SOLA One 17.7 4.1 ● ● ● AO Easy 32.5 3.2 ● ● ● ●Vis Ease Outlk 17.3 3.2 ● ● ● Vis Ease Outlk 32.3 3.1 ● ● ● ●Sig Kod Precise 16.7 4.0 ● ● ● ● Pentx AF Mini 31.9 4.1 ● ● ● ●Younger Image 16.1 6.9 ● ● ● ● Sig Kod Precise 31.5 2.8 ● ● ● ●Pentax AF 11.3 10.5 ● ● ● ● Sig Kodak 28.6 7.5 ● ● ●Varilux Comfort 10.1 6.9 ● ● ● Shamir Genesis 27.8 6.6 ● ●Varilux Liberty 10.0 7.2 ● ● ● Varlx Comfort 27.4 5.7 ● ●Rdnstk Life AT poly 8.8 6.1 ● ● Rdnstk Life AT poly 27.2 6.5 ● ●Shamir Genesis 8.6 5.1 ● ● Varlx Panamic 27.1 3.3 ● ● ●Varilux Panamic 8.3 6.0 ● ● Varlx Liberty 26.2 9.3 ● ● ●Sig Kodak 7.5 8.1 ● ● Pentx AF 23.5 15.2 ● ● ●Zei Gradal Brevity 6.5 9.5 ● ● Zei Gradal Brevity 17.3 15.9 ● ●Zei Gradal Top 0.0 0.0 ● Zei Gradal Top 15.3 8.5 ●
Mean 17.4 11.0 Mean 33.3 11.5
Highest and lowest rated designs, determined as explained in the text, are in bold.
33Sheedy
etal
ClinicalResearch

Table 4 Ratings for unwanted astigmatism and for near zone—fitting height of 22
Single Attribute Ratings
Astigmatism Rating Rating Fit Height 22
PAL Design Mean SD Ranges of Nonsignificant Differences PAL Design Mean SD Ranges of Nonsignificant Differences
Varlx Panamic 73.9 2.3 ● Shamir Piccolo 79.9 2.1 ●AO Easy 67.9 2.5 ● ● AO Compact 72.7 6.5 ● ●Zei Gradal Brevity 67.7 4.0 ● ● Sig Nav Short 70.7 6.6 ● ● ●AO Compact 67.4 4.0 ● ● SolaMax 70.4 3.9 ● ● ●SOLA One 66.6 3.1 ● ● Rdnstk Life XS 70.1 2.5 ● ● ● ●Pentx AF Mini 64.2 4.4 ● ● Sig Kod Concise 68.0 6.8 ● ● ● ● ●Vis Ease Illumina 64.0 7.6 ● ● Vis Ease Illumina 67.1 2.9 ● ● ● ● ●Shamir Piccolo 57.9 2.1 ● ● SOLA One 61.7 5.6 ● ● ● ● ●Sig Kod Precise 56.3 4.8 ● Younger Image 61.3 7.3 ● ● ● ● ●SolaMax 56.1 2.8 ● Rdnstk Life AT poly 60.7 4.2 ● ● ● ● ●Pentx AF 55.3 20.0 ● ● Sig Kod Precise 59.2 3.4 ● ● ● ● ●Shamir Genesis 55.3 3.2 ● ● Varilux Ellipse 58.1 3.7 ● ● ● ●Varlx Ellipse 54.6 4.5 ● ● ● AO Easy 57.8 6.0 ● ● ● ●Younger Image 52.3 3.1 ● ● ● Varilux Comfort 56.7 8.5 ● ● ● ●Varlx Liberty 51.1 3.3 ● ● ● ● Vis Ease Outlk 55.8 5.7 ● ● ● ●Sig Kod Concise 51.0 3.5 ● ● ● ● Sig Kodak 55.7 8.6 ● ● ● ●Zei Gradal Top 47.5 2.7 ● ● ● ● Pentax AF Mini 55.7 4.7 ● ● ● ●Sig Kodak 46.9 3.1 ● ● ● Shamir Genesis 55.4 4.8 ● ● ● ●Rdnstk Life XS 46.6 3.2 ● ● ● Varilux Liberty 53.1 12.0 ● ● ●Sig Nav Short 46.3 10.9 ● ● ● Varilux Panamic 52.0 5.6 ● ● ●Vis Ease Outlk 43.5 2.4 ● ● Zei Gradal Top 43.8 8.5 ● ● ●Varlx Comfort 42.7 6.3 ● Pentax AF 42.7 23.3 ● ●Rdnstk Life AT poly 19.4 4.5 ● Zei Gradal Brevity 32.7 28.8 ●
Mean 54.5 12.8 Mean 59.2 14.0
Highest and lowest rated designs, determined as explained in the text, are in bold.
34Optom
etry,Vol
77,No
1,January
2006

Table 5 Distance-oriented visual usage, based on combined ratings for distance and intermediate zones
Distance and Intermediate Combined
Without Astigmatism With Astigmatism
PAL Design Mean SD Ranges of Nonsignificant Differences PAL Design Mean SD Ranges of Nonsignificant Differences
Rdnstk Life AT poly 62.8 9.6 ● Shamir Genesis 60.2 4.5 ●Shamir Genesis 61.9 6.3 ● Zei Gradal Top 58.3 5.5 ●Zei Gradal Top 61.9 6.8 ● Zei Gradal Brevity 56.4 13.5 ● ●Younger Image 56.6 8.7 ● ● Younger Image 55.5 6.9 ● ●Vis Ease Outlk 56.4 6.3 ● ● Vis Ease Outlk 53.2 4.8 ● ● ●Sig Kodak 53.5 8.1 ● ● ● Rdnstk Life AT poly 52.0 7.1 ● ● ● ●Zei Gradal Brevity 52.7 17.4 ● ● ● ● Sig Kodak 51.9 6.2 ● ● ● ●Pentax AF 50.3 24.8 ● ● ● ● ● Varilux Panamic 51.7 4.3 ● ● ● ●Varilux Liberty 47.4 5.9 ● ● ● ● ● Pentax AF 51.6 15.3 ● ● ● ●Varilux Panamic 44.3 5.9 ● ● ● ● ● Varilux Liberty 48.3 4.5 ● ● ● ●Varilux Comfort 43.2 9.9 ● ● ● ● ● Sig Kod Precise 45.8 5.0 ● ● ●Sig Kod Precise 42.3 6.2 ● ● ● ● AO Easy 45.5 2.7 ● ● ●SolaMax 39.8 5.1 ● ● ● Pentax AF Mini 44.0 6.9 ● ● ● ●AO Easy 38.1 3.3 ● ● ● SolaMax 43.8 3.6 ● ● ● ●Pentax AF Mini 37.3 8.5 ● ● ● ● SOLA One 43.6 3.5 ● ● ● ●SOLA One 36.0 4.2 ● ● ● Varilux Comfort 43.0 7.9 ● ● ●Vis Ease Illumina 34.4 13.8 ● ● ● Vis Ease Illumina 41.8 8.7 ● ● ●Rdnstk Life XS 26.6 8.7 ● ● AO Compact 34.8 6.3 ● ● ●Shamir Piccolo 26.1 3.6 ● ● Shamir Piccolo 34.1 2.8 ● ●AO Compact 24.0 7.5 ● Varilux Ellipse 31.7 3.3 ●Varilux Ellipse 24.0 3.5 ● Rdnstk Life XS 31.6 6.5 ●Sig Nav Short 23.9 15.5 ● Sig Kod Concise 30.5 5.2 ●Sig Kod Concise 23.7 6.3 ● Sig Nav Short 29.5 9.4 ●
Mean 42.0 16.1 Mean 45.2 11.4
Highest and lowest rated designs, determined as explained in the text, are in bold.
35Sheedy
etal
ClinicalResearch
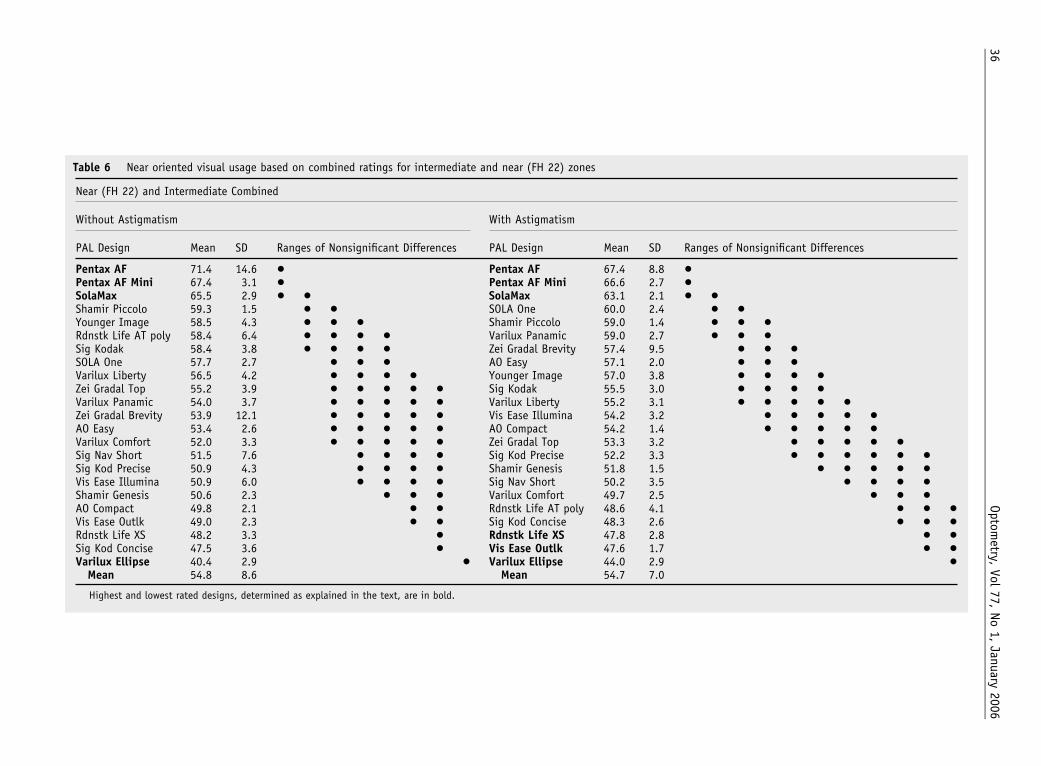
Table 6 Near oriented visual usage based on combined ratings for intermediate and near (FH 22) zones
Near (FH 22) and Intermediate Combined
Without Astigmatism With Astigmatism
PAL Design Mean SD Ranges of Nonsignificant Differences PAL Design Mean SD Ranges of Nonsignificant Differences
Pentax AF 71.4 14.6 ● Pentax AF 67.4 8.8 ●Pentax AF Mini 67.4 3.1 ● Pentax AF Mini 66.6 2.7 ●SolaMax 65.5 2.9 ● ● SolaMax 63.1 2.1 ● ●Shamir Piccolo 59.3 1.5 ● ● SOLA One 60.0 2.4 ● ●Younger Image 58.5 4.3 ● ● ● Shamir Piccolo 59.0 1.4 ● ● ●Rdnstk Life AT poly 58.4 6.4 ● ● ● ● Varilux Panamic 59.0 2.7 ● ● ●Sig Kodak 58.4 3.8 ● ● ● ● Zei Gradal Brevity 57.4 9.5 ● ● ●SOLA One 57.7 2.7 ● ● ● AO Easy 57.1 2.0 ● ● ●Varilux Liberty 56.5 4.2 ● ● ● ● Younger Image 57.0 3.8 ● ● ● ●Zei Gradal Top 55.2 3.9 ● ● ● ● ● Sig Kodak 55.5 3.0 ● ● ● ●Varilux Panamic 54.0 3.7 ● ● ● ● ● Varilux Liberty 55.2 3.1 ● ● ● ● ●Zei Gradal Brevity 53.9 12.1 ● ● ● ● ● Vis Ease Illumina 54.2 3.2 ● ● ● ● ●AO Easy 53.4 2.6 ● ● ● ● ● AO Compact 54.2 1.4 ● ● ● ● ●Varilux Comfort 52.0 3.3 ● ● ● ● ● Zei Gradal Top 53.3 3.2 ● ● ● ● ●Sig Nav Short 51.5 7.6 ● ● ● ● Sig Kod Precise 52.2 3.3 ● ● ● ● ● ●Sig Kod Precise 50.9 4.3 ● ● ● ● Shamir Genesis 51.8 1.5 ● ● ● ● ●Vis Ease Illumina 50.9 6.0 ● ● ● ● Sig Nav Short 50.2 3.5 ● ● ● ●Shamir Genesis 50.6 2.3 ● ● ● Varilux Comfort 49.7 2.5 ● ● ●AO Compact 49.8 2.1 ● ● Rdnstk Life AT poly 48.6 4.1 ● ● ●Vis Ease Outlk 49.0 2.3 ● ● Sig Kod Concise 48.3 2.6 ● ● ●Rdnstk Life XS 48.2 3.3 ● Rdnstk Life XS 47.8 2.8 ● ●Sig Kod Concise 47.5 3.6 ● Vis Ease Outlk 47.6 1.7 ● ●Varilux Ellipse 40.4 2.9 ● Varilux Ellipse 44.0 2.9 ●
Mean 54.8 8.6 Mean 54.7 7.0
Highest and lowest rated designs, determined as explained in the text, are in bold.
36Optom
etry,Vol
77,No
1,January
2006

Table 7 General vision usage category using combined ratings for distance, intermediate, and near (FH 18) zones
Distance, Intermediate, and Near (FH 18) Combined
Without Astigmatism With Astigmatism
PAL Design Mean SD Ranges of Nonsignificant Differences PAL Design Mean SD Ranges of Nonsignificant Differences
Rdnstk Life AT poly 50.9 5.7 ● Shamir Genesis 51.7 3.5 ●Shamir Genesis 50.5 5.0 ● Younger Image 49.6 4.1 ● ●Younger Image 48.6 5.0 ● Zei Gradal Brevity 47.6 6.5 ● ● ●Vis Ease Outlk 48.4 4.2 ● Varilux Panamic 47.4 2.5 ● ● ●Zei Gradal Top 46.4 3.3 ● ● Vis Ease Outlk 47.2 3.2 ● ● ●Sig Kodak 45.2 4.1 ● ● ● Zei Gradal Top 46.6 2.7 ● ●Pentax AF 41.4 11.9 ● ● ● Sig Kodak 45.6 3.0 ● ●Zei Gradal Brevity 40.9 8.0 ● ● ● Pentax AF 44.9 6.1 ● ● ●Varilux Liberty 40.3 3.5 ● ● ● AO Easy 44.2 1.7 ● ● ●SolaMax 39.2 3.0 ● ● ● SolaMax 43.4 2.0 ● ● ●Sig Kod Precise 38.7 4.0 ● ● ● SOLA One 43.3 2.0 ● ● ●Varilux Panamic 38.6 3.5 ● ● ● Rdnstk Life AT poly 43.1 4.4 ● ● ●Varilux Comfort 37.9 6.2 ● ● ● Sig Kod Precise 43.1 3.3 ● ● ●AO Easy 36.2 2.0 ● ● ● ● Varilux Liberty 43.0 2.3 ● ● ●Vis Ease Illumina 35.7 8.2 ● ● ● ● Vis Ease Illumina 42.8 4.5 ● ● ●SOLA One 35.6 2.2 ● ● ● ● Pentax AF Mini 42.6 4.0 ● ● ●Pentax AF Mini 35.5 4.7 ● ● ● ● Shamir Piccolo 40.1 1.6 ● ● ●Shamir Piccolo 34.1 2.0 ● ● ● ● AO Compact 40.1 3.6 ● ● ●Rdnstk Life XS 32.3 5.6 ● ● ● Varilux Comfort 39.1 5.0 ● ●Sig Kod Concise 32.0 3.3 ● ● ● Sig Kod Concise 36.7 2.8 ●Sig Nav Short 32.0 7.2 ● ● ● Rdnstk Life XS 35.9 4.2 ●AO Compact 31.0 4.0 ● ● Sig Nav Short 35.6 3.6 ●Varilux Ellipse 29.3 2.5 ● Varilux Ellipse 35.6 2.6 ●
Mean 39.2 8.1 Mean 43.0 5.6
Highest and lowest rated designs, determined as explained in the text, are in bold.
37Sheedy
etal
ClinicalResearch

viwnrbaddlit
otpvFcawir
t
rmTca
fsgrtvbcaie
M
WidL
38 Optometry, Vol 77, No 1, January 2006
iewing needs. Upon questioning, these patients willndicate that they have noticed limitations of their visionith their current PALs, even though the problems areot large enough for them to complain. In these cases, theatings can be used to select a new PAL that will provideetter correction than their previous lenses. For example,
patient may report noticing field limitations whenriving. In this case, Table 2 should be consulted toetermine the distance rating. If the distance rating isow, then the distance vision of the patient can bemproved by prescribing a new PAL with a higher dis-ance rating.
Many patients are more oriented toward either distancer near tasks. Commercial drivers, physical laborers, orhose involved with mostly outdoor or driving activities arerimarily oriented toward using distance and intermediateision, and near vision is not as important for these patients.or such patients, the distance lens ratings in Table 2 or theombined distance and intermediate ratings in Table 5pply. Many other patients largely work indoors and other-ise live in indoor environments. Distance vision is not as
mportant for these patients. For such patients, the lensatings in Tables 3 or 6 apply.
An identical approach can be used to troubleshoot adap-
Table 8 General vision usage category using combined rating
Distance and Near (FH18) Combined
Without Astigmatism
PAL Design Mean SD
Ranges ofNonsignificantDifferences
Shamir Genesis 52.8 8.1 ●Vis Ease Outlk 51.5 7.1 ●Rdnstk Life AT poly 48.4 11.4 ●Younger Image 45.1 8.3 ●Sig Kodak 37.2 6.4 ●Sig Kod Precise 36.8 6.5 ●Zei Gradal Top 36.3 6.6 ●Vis Ease Illumina 36.3 8.0 ●Rdnstk Life XS 35.3 5.5 ● ●Sig Kod Concise 34.5 4.4 ● ●Varilux Comfort 33.2 7.9 ● ●AO Compact 33.1 5.3 ● ●Varilux Ellipse 32.6 3.3 ● ● ●Shamir Piccolo 31.8 3.4 ● ● ●Sig Nav Short 31.8 5.2 ● ● ●Varilux Liberty 30.5 8.7 ● ● ●Varilux Panamic 29.8 3.5 ● ● ●AO Easy 29.8 3.4 ● ● ●SolaMax 28.6 4.8 ● ● ●SOLA One 26.5 2.9 ● ●Zei Gradal Brevity 23.8 4.5 ●Pentax AF Mini 13.6 7.9 ●Pentax AF 12.0 9.0 ●
Mean 33.5 11.6
Highest and lowest rated designs, determined as explained in the te
ation difficulties to newly dispensed PALs. For patients t
eporting distortions as an adaptation difficulty, the astig-atism ratings in Table 2 or the vision usage ratings inables 5 through 8 that include the astigmatism weightingan be used to identify whether the design contains morestigmatism compared with others.
Many other patients do not seem to have greater needsor either distance or near vision—their daily visual needseem to require a balance of the two. For such patients, theeneral visual usage ratings in Tables 7 and 8 apply. Theatings in Table 7 are based on all 3 viewing zones (dis-ance, intermediate, and near) and apply to patients withiewing needs at all 3 distances. The ratings in Table 8 areased on only the distance and near ratings and optimize theombination of the two without considering the intermedi-te rating. These ratings would apply to people with fewntermediate visual needs. Computer work is a commonxample of the need for intermediate vision.
inimum fitting heights
hen a patient desires a small frame and the fitting heights 18 mm or less, consideration should be given to a PALesign in which the near addition occurs higher in the lens.enses designed for short fitting heights are usually referred
istance and near (FH 18) zones
h Astigmatism
Design Mean SDRanges of NonsignificantDifferences
mir Genesis 53.4 5.7 ●Ease Outlk 49.5 5.2 ● ●nger Image 46.9 6.0 ● ●Ease Illumina 43.2 4.6 ● ●Kod Precise 41.7 4.9 ● ● ●Compact 41.6 4.3 ● ● ●stk Life AT poly 41.1 9.1 ● ● ●ilux Panamic 40.8 2.7 ● ● ●Kodak 39.7 4.3 ● ●Easy 39.3 2.2 ● ●Gradal Top 39.1 4.7 ● ●Kod Concise 38.6 3.5 ● ●mir Piccolo 38.3 2.6 ● ●ilux Ellipse 38.1 3.1 ● ●stk Life XS 38.1 4.0 ● ●A One 36.5 1.9 ● ●ilux Liberty 35.7 5.9 ●Nav Short 35.5 4.8 ●ilux Comfort 35.5 5.7 ●aMax 35.4 3.3 ●Gradal Brevity 34.7 3.1 ●tax AF Mini 26.3 6.1 ●tax AF 22.9 9.0 ●ean 38.8 7.9
in bold.
s for d
Wit
PAL
ShaVisYouVisSigAORdnVarSigAOZeiSigShaVarRdnSOLVarSigVarSolZeiPenPen
M
xt, are
o as “short corridor” PALs. The minimum fitting heights
fmFfsaarmo
C
Tsszmttc
A
TOvtsa
R
12
3
4
5
6
39Sheedy et al Clinical Research
or the PALs measured in this study, along with the recom-endation suggested by the manufacturer, are shown inigure 8. These data can be used to select lenses when therame selection dictates a short fitting height. Some cautionhould be exercised, however, because the data in Figure 8re based on the sole attribute of the height of the neardd—other design attributes are not considered. Short cor-idor lenses should be selected on the basis of the minimumeasured fitting height in Figure 8 along with consideration
f the vision usage ratings in Tables 2 through 8.
onclusions
he optical characteristics of the different PAL designs areignificantly different from one another. The differences areignificant in terms of the sizes and widths of the viewingones, the amount of unwanted astigmatism, and the mini-um fitting height. Reasoning and task analyses3 suggest
hat these differences can be used to select a PAL designhat matches the particular visual needs of the patient;
linical trials studies are required to test this hypothesis.cknowledgment
his research is supported by the Center for Ophthalmicptics Research, a research consortium at Ohio State Uni-ersity. All ophthalmic companies are eligible and invitedo join the consortium. The authors do not have any per-onal, financial, ownership, or consulting relationships withny of the companies in this study.
eferences
. Karp A. Lenses by the numbers. Lenses and Technology 2004:50-4.
. American National Standard for Ophthalmics. Prescription ophthalmiclenses—recommendations. Merrifield, VA: Optical Laboratories Asso-ciation; 1999.
. Sheedy J. Progressive addition lenses—matching the specific lens topatient needs. Optometry 2004;75:83-102.
. Sheedy JE, Buri M, Bailey IL, et al. Optics of progressive additionlenses. Am J Optom Physiol Opt 1987;64:90-9.
. Sheedy JE. Correlation analysis of the optics of progressive additionlenses. Optom Vis Sci 2004;81:350-61.
. SAS. SAS/Stat user’s guide, version 9. Cary, NC: Institute Publications;
2002.Recommended