January 2010 Slide 1

Slide 2January 2010
ISDBISDB--T T SignalSignal AnalysisAnalysis
Cell MasterCell Master™™ MT8212/3EMT8212/3ECompact Handheld Base Station AnalyserCompact Handheld Base Station Analyser
Spectrum MasterSpectrum Master™™ MS2712/3EMS2712/3ESpectrum AnalyserSpectrum Analyser

January 2010 Slide 3
What are measurement items required?What are measurement items required?
*The following are useful measurement items.*The following are useful measurement items.
Frequency ResponseFrequency Response
Multipath Profile(Delay Profile)Multipath Profile(Delay Profile)
Spectrum Mask Spectrum Mask
SpuriousSpurious
Carrier Frequency OffsetCarrier Frequency Offset
FFT Frequency OffsetFFT Frequency Offset
Phase noise (for Continuous Wave)Phase noise (for Continuous Wave)
Spectrum Monitor (Spectrum Analyzer)Spectrum Monitor (Spectrum Analyzer)
Tra
nsm
itter
Tra
nsm
itter
Fie
ldFie
ld
Gap
Fille
rG
ap
Fille
r
Sub Carrier MER GraphSub Carrier MER Graph
Constellation DiagramConstellation Diagram
MERMER
BERBER
Rece
iver
Rece
iver
Rep
eate
rR
ep
eate
r
Measurement itemsMeasurement items
Signal Power (Field Strength)Signal Power (Field Strength)
Recommended

January 2010 Slide 4
Broadcaster and/or Vendor needs the T&M equipment in several phases.
Product ManufacturingInstallationOperation and maintenanceField Check
In each case, it is needed to check different parameters.<Example>
•Transmitter : MER for high signal quality ( e.g. 45dB< )•Maintenance : Accurate measurement (Frequency Offset etc)•Trouble shooting : Constellation, Sub carrier MER etc.•Field Check : Multipath Profile etc.
Why do we need T&M equipments?Why do we need T&M equipments?

January 2010 Slide 5
ISDBISDB--T Signal AnalysisT Signal Analysis
RF QualityRF Quality
RF MeasurementsRF Measurements
Modulation QualityModulation Quality
Modulation MeasurementsModulation Measurements
Delay ProfileDelay Profile
Delay MeasurementsDelay Measurements
Multiple Measurement ModesMultiple Measurement Modes
Custom, Easy, BatchCustom, Easy, Batch
Single Frequency Network (SFN)Single Frequency Network (SFN)
Extended Delay ProfileExtended Delay Profile
InIn--band Spectrum Measurementband Spectrum Measurement
MS2712E Spectrum MasterMS2712E Spectrum Master

January 2010 Slide 6
ISDBISDB--T RF QualityT RF Quality
Signal PowerSignal Power
Channel Power (Channel Power (dBmdBm))
Termination Voltage (dBTermination Voltage (dBμμV)V)
Open Terminal Voltage (dBOpen Terminal Voltage (dBμμVemfVemf))
Field Strength (dBField Strength (dBμμV/m)V/m)
11--seg and Fullseg and Full--segseg MeasurementsMeasurements
Spectrum MonitorSpectrum Monitor
1 Channel to 51 Channel View1 Channel to 51 Channel View
Channel Selection with MarkerChannel Selection with Marker
Channel Power and Peak PowerChannel Power and Peak Power
Signal Power MeasurementSignal Power Measurement
Spectrum MonitorSpectrum Monitor

January 2010 Slide 7
ISDBISDB--T RF QualityT RF Quality
Spectrum MaskSpectrum Mask
ARIB (Japan)ARIB (Japan)Mask Standard AMask Standard A
Mask Standard BMask Standard B
Antenna Power CompensationAntenna Power Compensation
ABNT (Brazil)ABNT (Brazil)Mask CriticalMask Critical
Mask SubMask Sub--criticalcritical
Mask NonMask Non--criticalcritical
TxTx BPF CompensationBPF Compensation
ARIB Mask A MeasurementARIB Mask A Measurement
ABNT Mask Critical MeasurementABNT Mask Critical Measurement

January 2010 Slide 8
ISDBISDB--T RF QualityT RF Quality
Phase NoisePhase Noise
Fixed Offset MeasurementsFixed Offset Measurements1, 2, 4, 10, 100 kHz1, 2, 4, 10, 100 kHz
Arbitrary Offset with MarkerArbitrary Offset with Marker
Integrated MeasurementIntegrated Measurement100 Hz to 6 MHz Standard100 Hz to 6 MHz Standard
Arbitrary Range with MarkerArbitrary Range with Marker
Spurious EmissionsSpurious Emissions
Records 5 Largest SpuriousRecords 5 Largest SpuriousdBmdBm and and dBcdBc
HPF Loss CompensationHPF Loss Compensation
Phase Noise with Integration MarkerPhase Noise with Integration Marker
Spurious Emissions MeasurementSpurious Emissions Measurement

January 2010 Slide 9
ISDBISDB--T RF Quality IssuesT RF Quality Issues
Transmitter Power AdjustmentTransmitter Power Adjustment
Interference CheckingInterference Checking
EgEg Adjacent Analogue Signals Adjacent Analogue Signals
Field Strength MonitoringField Strength Monitoring
Receive Antenna AlignmentReceive Antenna Alignment
Transmitter Conformance TestingTransmitter Conformance Testing
Direct Direct TxTx ConnectionConnection
TxTx PowerPower
Spectrum MaskSpectrum Mask
Phase NoisePhase Noise
Spurious EmissionsSpurious Emissions
OverOver--thethe--air (OTA)air (OTA)
InterferenceInterference
Field StrengthField Strength
Antenna Alignment Antenna Alignment
ConsequencesConsequences
Interference with Adjacent ChannelsInterference with Adjacent Channels
Interference from Adjacent ChannelsInterference from Adjacent Channels
Intermittent Reception (Block Noise)Intermittent Reception (Block Noise)
No ReceptionNo Reception
Common FaultsCommon Faults
TxTx Filter Filter
Power AmplifierPower Amplifier
Mast and Antenna Mast and Antenna
RF QualityRF Quality

January 2010 Slide 10
How to find errorsHow to find errors
Analog Signal
ISDB-T/ISDB-TB (SBTVD)
Mixing
If both analog signal and digital signal exist simultaneously, wIf both analog signal and digital signal exist simultaneously, we can not e can not often observe their both spectrums because of hiding under the ooften observe their both spectrums because of hiding under the other ther signal.signal.

January 2010 Slide 11
How to find errorsHow to find errors
Digital broadcast signals can be observed with a spectrum analyzDigital broadcast signals can be observed with a spectrum analyzer (SA), er (SA), but when there is a heavy interference, observation by using an but when there is a heavy interference, observation by using an SA is very SA is very difficult. In these circumstances, it is possible to find out thdifficult. In these circumstances, it is possible to find out the hidden ine hidden in--band interference over an ISDBband interference over an ISDB--T signal by analyzing each subcarrier.T signal by analyzing each subcarrier.
<Finding Analog Interference in ISDB-T Waveform>
<MX890120B Subcarrier MER Measurement Example>

January 2010 Slide 12
<Waveform> <BER>
Video = OK, Waveform = OK, Level = OK, BER = OK
<Video>
But what about MER and Constellation?
Good Signal Quality Bad Signal Quality
Signal quality is unknown until analyzed!
Signal Analysis: Determining Signal Quality Signal Analysis: Determining Signal Quality

January 2010 Slide 13
BER (Bit Error Rate) :BER is the ratio of the number of bits incorrectly to the total
number of bits
MER (Modulation Error Ratio) :MER can be used like SNR (Signal to Noise Ratio)MER can be calculated with a figure. The sum of the squares of
the magnitudes of ideal symbol vectors is divided by the sum of the squares of the magnitudes of the symbol error vectors.
What is BER? What is MER?What is BER? What is MER?
Reference : ETSI TR 101 290
( )( ) dB
QIQI
MERjj
jj
⎪⎭
⎪⎬⎫
⎪⎩
⎪⎨⎧
+
+×=
∑∑
22
22
10log10δδ
( )QI δδ ,
( )QI ,
Constellation

January 2010 Slide 14
What is the What is the ““QualityQuality”” of digital broadcasting?of digital broadcasting?
BER, MER deteriorating parameters
(For example, Large ← field level → Small
Good ← CN → Bad )
Bad
←M
ER
→G
ood
Does not depend on modulation
parameter↓
Evaluate using a fixed indicator
Large measurement coverage & easy to
see deterioration
Bad
←B
ER
→G
ood
Error free range Error occurring range This range is too narrow!
[Merits of measuring MER]•MER shows the signal deterioration even if BER can't detect errors(Error free range).→ Possible to maintain margin quality•MER is the same for any modulation used, so MER result is easily comparable toother MER results.

January 2010 Slide 15
ISDBISDB--T Modulation QualityT Modulation Quality
Frequency and Frequency ErrorFrequency and Frequency Error
Constellation with ZoomConstellation with Zoom
Layer A, B, C and TMCCLayer A, B, C and TMCC
Modulation Error Ratio (MER)Modulation Error Ratio (MER)
Total, Layers A, B, C, TMCC, AC1Total, Layers A, B, C, TMCC, AC1
Modulation TypeModulation Type
Layers A, B, CLayers A, B, C
Automatic Parameter DetectionAutomatic Parameter Detection
Mode, GI, Modulation, LayersMode, GI, Modulation, Layers
SubSub--carrier MER with Markercarrier MER with Marker
Modulation with SubModulation with Sub--carrier MERcarrier MER
Modulation with All Layer ConstellationModulation with All Layer Constellation

January 2010 Slide 16
Some ISDBSome ISDB--T Modulation Quality ScreensT Modulation Quality Screens
Constellation with ZoomConstellation with Zoom
Single Constellation DisplaySingle Constellation Display
Layer A, B, C, or TMCCLayer A, B, C, or TMCC
All Layer Constellation (not All Layer Constellation (not shown)shown)
4 quadrant display4 quadrant display
Layer A, B, C, and TMCCLayer A, B, C, and TMCC
Constellation w/ SubConstellation w/ Sub--carrier MERcarrier MER
Layer A and B ConstellationLayer A and B Constellation
Full band subFull band sub--carrier MERcarrier MERWith MarkerWith Marker
Constellation Zoom on Layer AConstellation Zoom on Layer A
Constellation View with SubConstellation View with Sub--carrier MERcarrier MER

January 2010 Slide 17
ISDBISDB--T Modulation Quality IssuesT Modulation Quality Issues
MERMER
The ratio of errors in the The ratio of errors in the actual signal compared with a actual signal compared with a perfect signalperfect signal
Some correlation with C/N and Some correlation with C/N and EVMEVM
Direct Direct TxTx ConnectionConnection
MER >42 dB TypicalMER >42 dB Typical
OverOver--thethe--air (OTA)air (OTA)
MER >10 dBMER >10 dB
Consequences of Bad MERConsequences of Bad MER
Intermittent ReceptionIntermittent Reception
No ReceptionNo Reception
Common FaultsCommon Faults
Distortion in ModulatorDistortion in Modulator
FFT Sampling Frequency ErrorFFT Sampling Frequency Error
Power Amplifier DistortionPower Amplifier Distortion
TX FilterTX Filter
Modulation Modulation -- Sampling Frequency ErrorSampling Frequency Error
January 2010 Slide 18
How to find errorsHow to find errors
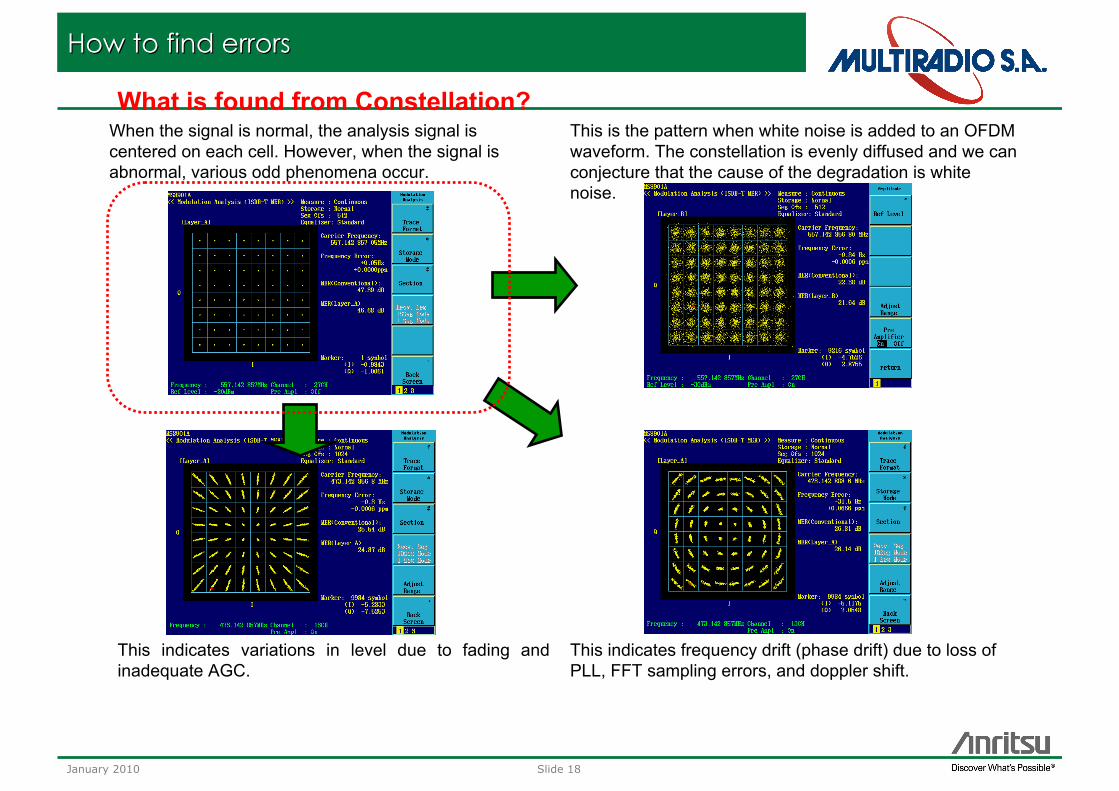
This is the pattern when white noise is added to an OFDM waveform. The constellation is evenly diffused and we can conjecture that the cause of the degradation is white noise.
This indicates frequency drift (phase drift) due to loss of PLL, FFT sampling errors, and doppler shift.
This indicates variations in level due to fading and inadequate AGC.
What is found from Constellation?When the signal is normal, the analysis signal is centered on each cell. However, when the signal is abnormal, various odd phenomena occur.

January 2010 Slide 19
ISDBISDB--T Modulation Quality T Modulation Quality –– SubSub--carrier MERcarrier MER
Direct Direct TxTx ConnectConnect
Carrier MER >42 dB TypicalCarrier MER >42 dB Typical
OverOver--thethe--air (OTA)air (OTA)
Identify Narrowband Identify Narrowband InterferenceInterference
ConsequencesConsequences
If Interference Coincides with If Interference Coincides with Continual Pilot or TPS CarrierContinual Pilot or TPS Carrier
Degraded ReceptionDegraded Reception
No ReceptionNo Reception
Common FaultsCommon Faults
Nearby TransmitterNearby Transmitter
External External IntermodulationIntermodulation
Carrier MERCarrier MER
Measures MER for each SubMeasures MER for each Sub--carriercarrier
Identifies Narrowband Identifies Narrowband InterferersInterferers
Modulation Quality Modulation Quality –– SubSub--carrier MERcarrier MER

January 2010 Slide 20
ISDBISDB--T Modulation Quality T Modulation Quality –– The Anritsu AdvantageThe Anritsu Advantage
Most ISDBMost ISDB--T Analysers are Based on Demodulation ChipsetsT Analysers are Based on Demodulation Chipsets
Similar to TV ReceiversSimilar to TV Receivers
Equalise Received Signals to Remove Signal DegradationsEqualise Received Signals to Remove Signal Degradations
Unable to Detect Some FaultsUnable to Detect Some Faults
Anritsu Does NOT Use Demodulation ChipsetsAnritsu Does NOT Use Demodulation Chipsets
Able to See and Measure All FaultsAble to See and Measure All Faults
Fluctuating Signal AmplitudeFluctuating Signal Amplitude Fluctuating Signal FrequencyFluctuating Signal Frequency FFT Sampling Frequency Error CausingFFT Sampling Frequency Error CausingInaccurate BandwidthInaccurate Bandwidth

January 2010 Slide 21
How to find errorsHow to find errors
Flow Sample of Finding Errors with Constellation
BER/MERThreshold
Track(like circles)
Divergence(only a part)
Divergence(like clouds)
Track(like stars)
ConstellationCheck
Degradation
•Intermodulation•Level fall
MER(per Subcarrier)
•Failure of Gain control•Fading
•LO stability•Hum mixing•Fading
•Lock failureof FFT clock
•Inband inteference•Analog-Digitalinterference
MER(per Subcarrier)

January 2010 Slide 22
ISDBISDB--T Delay ProfileT Delay ProfileDual DisplayDual Display
Full WidthFull Width
Zone Marker ZoomZone Marker Zoom
ColourColour Coded Delay RegionsCoded Delay Regions
Blue Blue –– PrePre-- Guard IntervalGuard Interval
Yellow Yellow –– Within Guard IntervalWithin Guard Interval
Purple Purple –– Beyond Guard IntervalBeyond Guard Interval
MarkerMarker
Relative LevelRelative Level
Time DelayTime Delay
Relative DistanceRelative Distance
Frequency Response TraceFrequency Response Trace
Marker and Delta MarkerMarker and Delta Marker
MER and Frequency Parameters ShownMER and Frequency Parameters Shown
Delay Profile MeasurementDelay Profile Measurement

January 2010 Slide 23
ISDBISDB--T Delay Profile IssuesT Delay Profile Issues
OverOver--thethe--air (OTA)air (OTA)
< GI Interval< GI Interval
ConsequencesConsequences
InterInter--symbol Interferencesymbol Interference
Increased MERIncreased MER
Increased BERIncreased BER
Poor ReceptionPoor Reception
Common FaultsCommon Faults
Repeater Time Delay Faults Repeater Time Delay Faults
BuildingsBuildings
Mountains Mountains
Delay Profile MeasurementDelay Profile Measurement
Symbol 1GI Symbol 2GI
Symbol 1GI Symbol 2GI
Symbol 1GI Symbol 2GI
Desired SignalDesired Signal
MultiMulti--path Apath A
MultiMulti--path Bpath B
Interferer Echo SignalInterferer Echo Signal
63 63 μμss--1/161/16
126 126 μμss63 63 μμss1/81/8
252 252 μμss126 126 μμss1/41/4
Mode 3Mode 3Mode 2Mode 2LengthLength

January 2010 Slide 24
Multiple Measurement ModesMultiple Measurement Modes
““Custom” ModeCustom” Mode
User Specifies all Setup Parameters and MeasurementsUser Specifies all Setup Parameters and Measurements
Most FlexibleMost Flexible
“Easy” Mode“Easy” Mode
User Specifies MeasurementsUser Specifies Measurements
Most Setup Parameters Automatically SetMost Setup Parameters Automatically Set
Reduces Possible User ErrorReduces Possible User Error
“Batch” Mode“Batch” Mode
User specifies measurements and channels for automatic measurement, display of results and storage
Field Strength, Channel Power, Modulation Analysis, Spectrum Mask and Spectrum Monitor Can be User Selected

January 2010 Slide 25
ISDBISDB--T Single Frequency Networks (SFN) T Single Frequency Networks (SFN)
SFN Impulse Response MeasurementSFN Impulse Response Measurement
Dual DisplayDual Display
Full Screen (Full Screen (±±1008 1008 μμs s –– 6 MHz BW)6 MHz BW)
»» No Aliasing!No Aliasing!
Zone Marker ZoomZone Marker Zoom
DelayDelay
Relative and Absolute Level Relative and Absolute Level
Field Strength with Antenna Field Strength with Antenna
CompensationCompensation
Power and Transfer Method Power and Transfer Method
Calculation Calculation
SFN InSFN In--band Spectrum Measurementband Spectrum Measurement
Frequency ResponseFrequency Response
Simultaneous Display of Impulse DataSimultaneous Display of Impulse Data
SFN Delay Profile MeasurementsSFN Delay Profile Measurements
SFN InSFN In--band Spectrum Measurementsband Spectrum Measurements

January 2010 Slide 26
ISDBISDB--T SFN IssuesT SFN Issues
OverOver--thethe--air (OTA)air (OTA)
Significant Echoes <GISignificant Echoes <GI
ConsequencesConsequences
InterInter--symbol Interferencesymbol Interference
Increased MERIncreased MER
Increased BERIncreased BER
Poor ReceptionPoor Reception
Common FaultsCommon Faults
SFN SFN TxTx Timing Incorrectly SetTiming Incorrectly Set
SFN Repeater Timing Incorrectly SetSFN Repeater Timing Incorrectly Set
SFN Gap Filler Timing Incorrectly SetSFN Gap Filler Timing Incorrectly Set
Long Delay Echo from Building/Mountain Long Delay Echo from Building/Mountain
SFN Impulse Response MeasurementSFN Impulse Response Measurement
T1 T2
A B
““A” receives the signal from A” receives the signal from transmitter T1 as principal and transmitter T1 as principal and from T2 delayed and attenuatedfrom T2 delayed and attenuated
““B” receives signals from both B” receives signals from both transmitters T1 and T2 with no transmitters T1 and T2 with no differential delaydifferential delay

January 2010 Slide 27
ISDBISDB--T Measurement AvailabilityT Measurement AvailabilityModelsModels
MS2712/3E, MT8212/3EMS2712/3E, MT8212/3E
Option 30 Signal AnalysisOption 30 Signal Analysis
Option 32 SFN AnalysisOption 32 SFN Analysis
100 kHz to 4/6 GHz SPA100 kHz to 4/6 GHz SPA
Large 8.4” Large 8.4” TouchscreenTouchscreen
3 USB Ports3 USB Ports
Additional Cable and Antenna Additional Cable and Antenna Measurements with Cell MasterMeasurements with Cell Master
Also S21 GainAlso S21 Gain
2 MHz to 4/6 GHz2 MHz to 4/6 GHz
All Other Signal Analysis Options All Other Signal Analysis Options Available AlsoAvailable Also
MS2712/3E Spectrum Master
MT8212/3E Cell Master

January 2010 Slide 28
Key General SpecificationsKey General Specifications
Cable and Antenna Analyzer Cable and Antenna Analyzer (MT8212/3E)(MT8212/3E)
MeasurementsMeasurements
RL, VSWR, Cable Loss, DTF, PhaseRL, VSWR, Cable Loss, DTF, Phase
22--port Transmission Measurementport Transmission Measurement
Sweep SpeedSweep Speed
1 msec/data point1 msec/data point
Data PointsData Points
137, 275, 551, 1102, 2204137, 275, 551, 1102, 2204
DisplayDisplay
Dual Trace MeasurementsDual Trace Measurements
CalibrationCalibration
OSL, InstaCalOSL, InstaCal™™ and FlexCaland FlexCal™™
Bias TeeBias Tee
32 V internal 32 V internal
Spectrum Analyzer (MT8212/3E, Spectrum Analyzer (MT8212/3E, MS2712/3E)MS2712/3E)
Spectrum AnalyzerSpectrum Analyzer
Field Strength, Occupied B/W, Channel Field Strength, Occupied B/W, Channel Power, ACPR, C/IPower, ACPR, C/I
Interference AnalyzerInterference Analyzer
Spectrogram, Signal Strength, RSSI, Spectrogram, Signal Strength, RSSI, Signal IDSignal ID
Dynamic RangeDynamic Range
> 95 dB in 10 Hz RBW> 95 dB in 10 Hz RBW
DANLDANL
--152 dBm in 10 Hz RBW152 dBm in 10 Hz RBW
Phase NoisePhase Noise
--100 dBc/Hz @ 10 kHz offset100 dBc/Hz @ 10 kHz offset
Frequency AccuracyFrequency Accuracy
<±50 ppb with GPS On<±50 ppb with GPS On

January 2010 Slide 29
SummarySummary
ISDB-T Signal Analysis Functions
Spectrum Analyser
Compact: 273 x 199 x 91mm273 x 199 x 91mm
Lightweight: 3.45 kg3.45 kg
Large Colour Touchscreen (8.4”)
Upgrade with Many Cellular Standards
GSM, CDMA2000, WCDMA, LTE, etc
Antenna/Transmission Cable Measurement (MT8212/3E)
The MS2712/3E and MT8212/3E are the The MS2712/3E and MT8212/3E are the best performingbest performing ISDBISDB--T T field analysers based on a field analysers based on a handheld, battery operatedhandheld, battery operated spectrum spectrum analyser enabling analyser enabling highhigh--accuracyaccuracy ISDBISDB--T physicalT physical--layer layer measurementsmeasurements

Slide 30January 2010
Muchas Gracias.Muchas Gracias.
Ing. Carlos José Ing. Carlos José RodriguezRodriguez
GciaGcia. . AreaArea Comercial ANRITSUComercial ANRITSU
[email protected]@multiradio.com.ar
011 4779011 4779--55295529
Recommended