James L Kennedy MD, FRCPCJames L Kennedy MD, FRCPC
I’Anson Professor of Psychiatry and Medical Science
Head, Neurogenetics Section, Clarke Division,
Director, Department of Neuroscience Research
Centre for Addiction and Mental Health (CAMH),
University of Toronto & SG Potkin, D Mueller, M Masellis,
N Potapova, F Macciardi
Genetics and Neuroimaging: Genetics and Neuroimaging: Current Findings and Future StrategiesCurrent Findings and Future Strategies

How do genes determine brain characteristics?How do genes determine brain characteristics?

Molecular Genetic Approach
Gene Variants
Pharmacology
Phenotype
Sub-pheno
Endophenotype
Neurobiology
Pharmacogenetics
Gene Expression
-Psychophysiology;
Neuroimaging

Candidate gene selection for schizophrenia
• Neurotransmitter system genes– e.g. dopamine receptors, transporter
• Neurodevelopmental genes– Cortical development, patterning
– Neuronal differentiation, migration
– Synaptic protein genes
• Human post-mortem expression studies (Mirnics et al, 2000; Vawter et al, 2001)
• Animal model expression studies (Wong et al, 2002; Barrett et al, 2003)
Dissect the neurotransmitter, synaptic machinery, myelin system, etc, with molecular genetics… Neuroimaging will help both hypothesis generation and validation of new genetic findings

Cytoarchitectural abnormalities
Control
Schizophrenia
Comparison of hippocampal pyramids at the CA1 and CA2 interface between control and schizophrenic.
Cresyl violet stain, original magnification X250
Conrad et al. (1991) Arch Gen Psychiatry
TARDIVE DYSKINESIA

Symptoms of TDSymptoms of TD
TD is characterized by abnormal involuntary TD is characterized by abnormal involuntary movements of the lip, jaw and tongue.movements of the lip, jaw and tongue.
Choreoathetoid movements of the extremitiesChoreoathetoid movements of the extremitiesand/or trunk may occur as well.and/or trunk may occur as well.
- Symptoms are measured using scales such as : the Abnormal Involuntary Movement Scale (AIMS) and the Rockland Simpson Scale (RSS).
- The AIMS scale ranges from 0 - 40 and patients with higher AIMS scores have more severe symptoms.

Motor effects
Cognitive effects

Why DRD3 ?• D3 mRNA and protein have been localized to the ventral side of the striatum and the ventral putamen (motor control) (Joyce & MeadorWoodruff, 1997)
• D3 receptors have been shown to have an inhibitory effect on locomotor activity in rats. (Kling-Peterson et al, 1995)
•Evidence that the Msc I polymorphism of DRD3 is functional: allelic differences display different affinities for dopamine in vitro. (Lundstrom & Turpin, 1996)

Neuroanatomical Distributions of Neuroanatomical Distributions of Dopamine ReceptorsDopamine Receptors
(Seeman etal, 1995)

Mean AIMS Scores for DRD3 Msc I Polymorphism after Typical Neuroleptic Treatment
0
2
4
6
8
10
12
14
16
Ser/Ser Ser/Gly Gly/Gly
CorrectedMean AIMSscore
DRD3 Genotype
F[2,95] = 8.25, p < 0.0005 ( n = 112 ), Power = 0.568, r-square=0.297(Bonferroni p < 0.0015) (Basile et al, 1999)
n=34 n=53 n=25
Mean14.20
Mean3.920
Mean3.470

Ethnically Stratified Means
0
2
4
6
8
10
12
14
Mea
n A
IMS
Ser/Ser Ser/Gly Gly/Gly
Genotype
Caucasian Means (N=85)
02468
10121416
Mea
n A
IMS
Ser/Gl Gly/Gl
Genotype
Afro-American Means (N=25)
33 43
9
9
16
F[2,83]=3.85, p = 0.026 (Bonferroni p = 0.078)
F[1,23]=8.10, p = 0.0091 (Bonferroni p = 0.009)

BaselineHaloperidol (5wks) Baseline
Gly-Gly (n=5)
Gly-Ser & Ser-Ser (n=9)
Brain Metabolism Following Haloperidol Treatment by D3 Genotype (FDG, n=14)
(UCI Brain Imaging Centre; Potkin, Kennedy & Basile, 2003)

CYP2D6 vs 1A2
CYP2C
CYP2E1CYP3A
Other
CYP1A2
CYP2D6
CYP2B6
CYP2A6
(12.7%)
(1.5%)
(Shimoda et al, 1994) - Metabolism is determined by both affinity and abundance relative to the total liver P450 content.
- 2D6 has a higher affinity for most typicals, but it accounts for only 2% of total liver content. 2D6 is “high affinity-low capacity”
-2D6 is not inducible; 1A2 is
Note: CYP2D6 also expressed in brain – neuroimaging may capture some of this variance

0
5
10
15
20
25
Gly/Gly Ser/Gly Ser/Ser
A/A
A/C
C/C
Mean AIMS Scale Scores for DRD3 by CYP1A2 Genotype
DRD3 Genotype
CYP1A2 Genotype
Mean AIMS Score
Additive recessive model strongly supported compared to alternative models

Tardive Dyskinesia Summary :
- Given the numerous replications of the DRD3-TD finding, and the PET neuroimaging validation, it appears that the dopamine D3 receptor is involved in TD susceptibility.
- The interaction between DRD3 and CYP1A2 genes fits a recessive - recessive model with each gene interacting additively.
- The DRD3 and CYP1A2 results account for ~55% of the variance in TD; other genes and environment may account for the rest.
??Clinical genetic test for TD risk in the future??

DOPAMINE D1 RECEPTOR

Dopamine D1 Receptor
(Missale 1998)
D1 concentration in PFC 10X greater than D2 (Lidow 1991)…
Important for antipsychotic action?
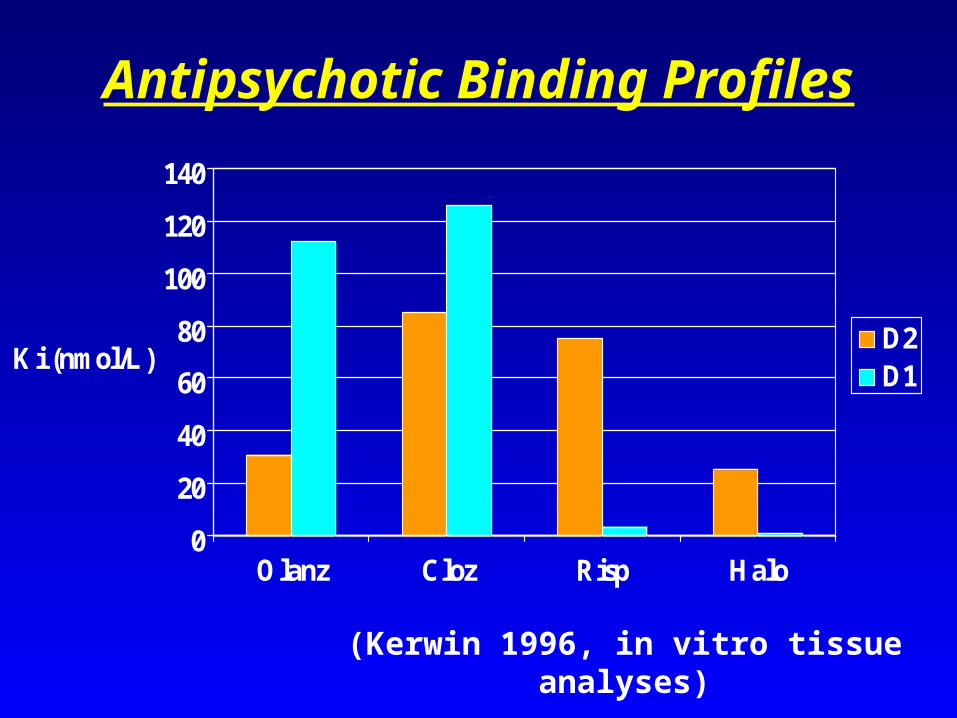
Antipsychotic Binding Profiles
0
20
40
60
80
100
120
140
Ki (nmol/L)
Olanz Cloz Risp Halo
D2D1
(Kerwin 1996, in vitro tissue analyses)

Tauscher et al., 2004

D1 Receptor Blockade:• D1 blockade by antipsychotics may
potentiate activity in the PFC by disinhibiting NMDA receptor (Williams 1995)
D1 NMDA Cognition?
Improvement of Symptoms
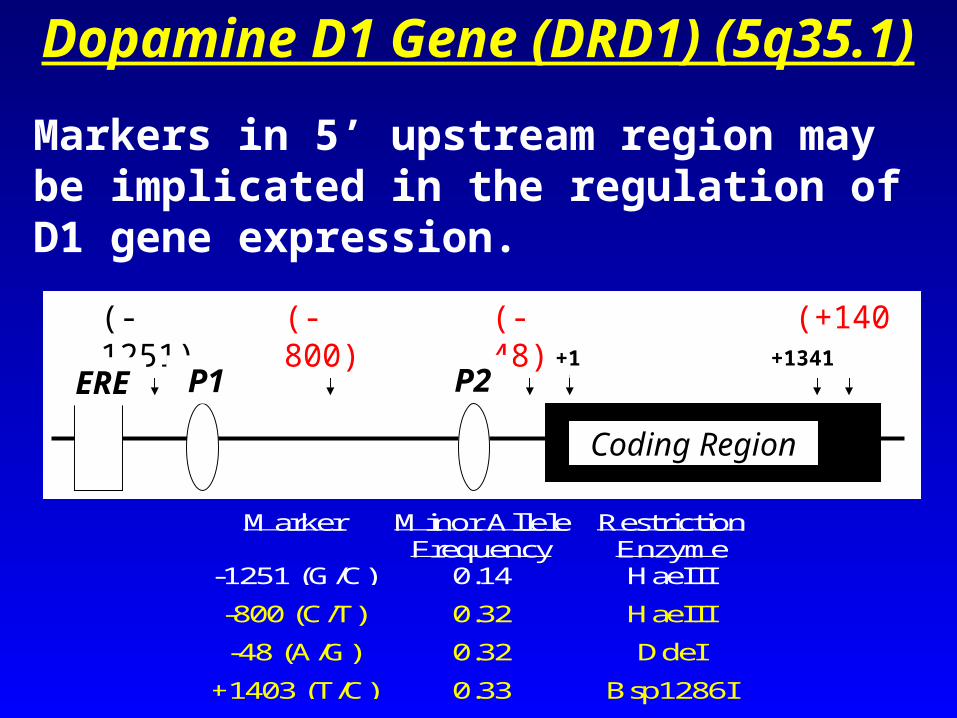
Dopamine D1 Gene (DRD1) (5q35.1)
Marker Minor AlleleFrequency
RestrictionEnzyme
-1251 (G/C) 0.14 HaeIII
-800 (C/T) 0.32 HaeIII
-48 (A/G) 0.32 DdeI
+1403 (T/C) 0.33 Bsp1286I
Coding Region
(-1251) (-800) (-48) (+1403)+1 +1341
ERE P1 P2
Markers in 5’ upstream region may be implicated in the regulation of D1 gene expression.
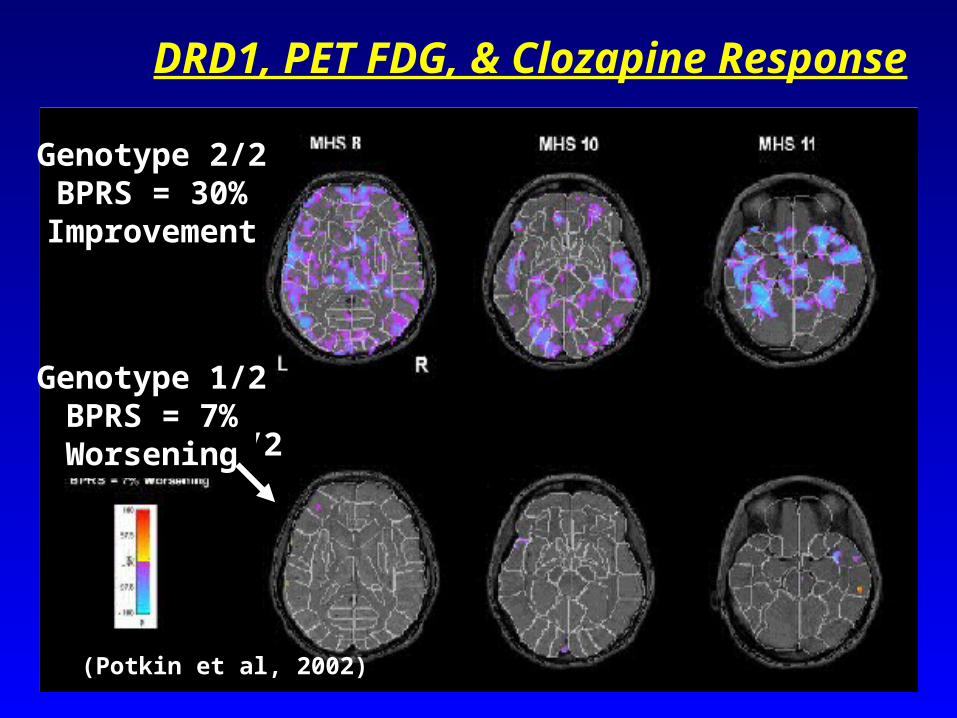
DRD1, PET FDG, & Clozapine Response
Genotype 2/2BPRS = 30%Improvement
Genotype 1/2
Genotype 1/2BPRS = 7%Worsening
(Potkin et al, 2002)

Clozapine Response Prediction Algorithm?
• Arranz et al (2000) have reported a multi-gene (n = 10+ markers) model for clozapine response in one sample. Includes: D2, D4; 5HT1A, 2A, 2C, 4, 6; H1, H3,…
• Model must be replicated in a new sample to be meaningful
• Neuroimaging as a augmenting phenotype in each patient may provide valuable intermediary information from the brain, allowing more biologically meaningful subtyping.

Serotonin Transporter
5HTT specific ligand in PET
• 5HTT specific ligand for PET [11C]DASB optimized in Toronto by radiochemist Alan Wilson
• N = 20 medication-free depressed patients, 20 anxiety disorder, and 20 normal controls underwent PET imaging with [11C]DASB ligand; blood for genetics
• 5HTT gene typed for ins/del in promoter and the VNTR in intron II

[11C] DASB Binding to 5HTT in Depressives vs Normals by Genotype:
Frontal Region
0
2
4
6
8
10
12
14
del/del del/ins ins/ins
DepressedNormals
nM

PET Ligand (DASB) 5HTT Binding Potential correlates with Dysfunctional Attitude
Serotonin Transporter Ligand Binding Potential
Dysfunctional Attitude Scale Score
[Meyer et al, Toronto PET Group, Arch Gen Psych, 2004]
5HTTLPR genetic marker does not predict 5HTT Binding (Kennedy et al, in prep)
N=20 Major Depressives P < .001

Will the Brain Derived Neurotrophic Factor (BDNF) Gene Predict Grey Matter Volume?
Val-66-met
(GT)n repeat (function? mRNA stability)
Exon 11
BDNF-1 SNP BDNF-2 BDNF-3 BDNF-4
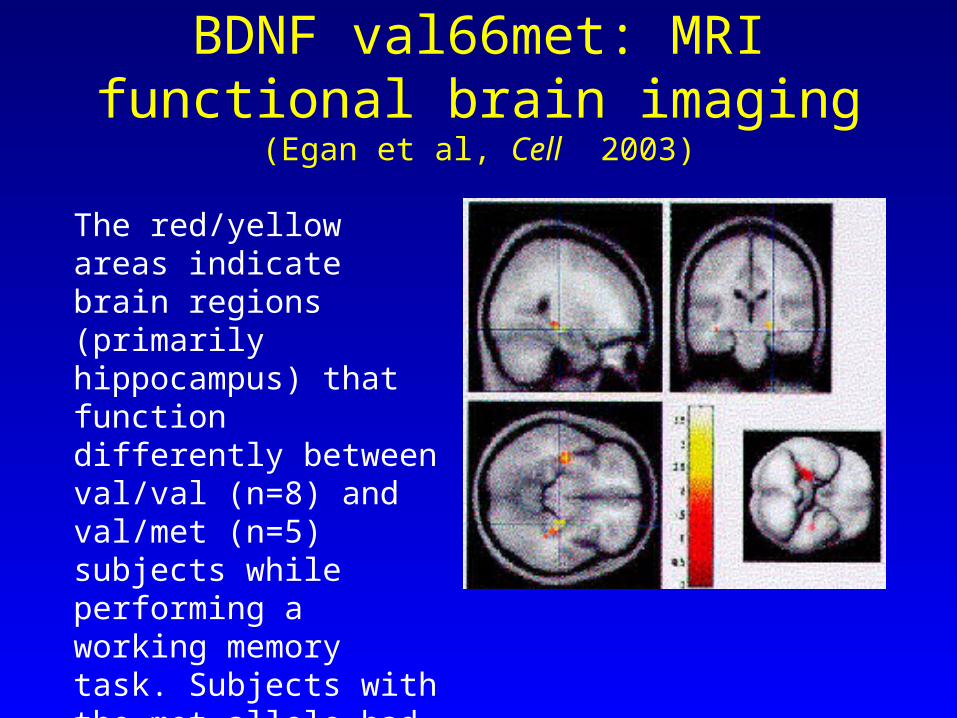
BDNF val66met: MRI functional brain imaging (Egan et al, Cell 2003)
The red/yellow areas indicate brain regions (primarily hippocampus) that function differently between val/val (n=8) and val/met (n=5) subjects while performing a working memory task. Subjects with the met allele had more abnormal function.

Haplotype TDT: BDNF (GT)n repeat & val66met in schizophrenia
2
7
26
10
5 5 6
12
0
5
10
15
20
25
30
TransmissionsNon Trans
** HTDT for 170-val66
2 = 7.11; 1 df; p = 0.007
Muglia et al, (2002)
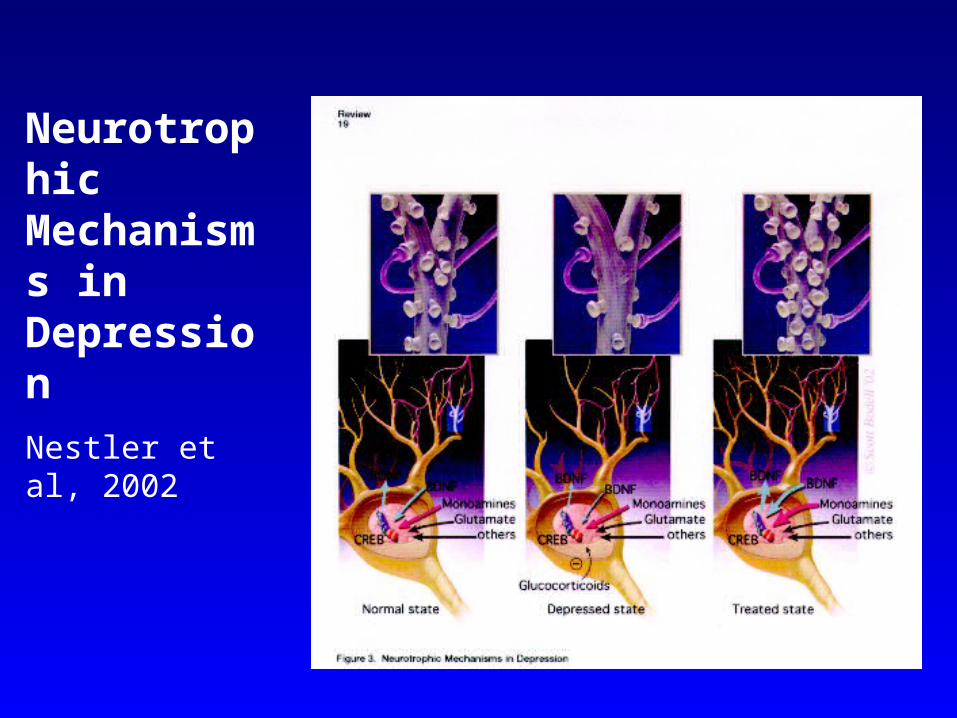
Neurotrophic Mechanisms in Depression
Nestler et al, 2002

Bipolar Disorder: TDT studies show robust effect of BDNF gene
• Combined Toronto sample (Neves-Pereira et al,
2002; N=300) plus MIT (Sklar et al, 2003) (N=200 + 150 NIMH) for val66met yields p = .0000001
• Phenotype dissection of our Toronto bipolar sample shows association with rapid cycling, non-suicidal, non-psychotic, earlier age at onset subjects (Mueller et al, in preparation)

BDNF polymorphisms in Childhood Onset Depression: Pittsburgh Sample
0
10
20
30
40
50
60
70
80
90
met val
CasesControls
0
20
40
60
80
100
120
140
174 172 170 168 166
Cases
Controls
N=104 pairs; 2= 17.8; df=5; p= 0.0032
172 bp allele: OR = 0.55
168 bp allele: OR = 3.94
N=104 pairs; 2=4.7;df=1; p=0.03
Haplotype p = 0.001
GT repeat alleles

Figure 1d: Principal deformation for the right hippocampus for normal controls (top) and schizophrenia patients (bottom). Four views (front, lateral, back, medial) of each shape are shown. The color indicates the direction and the magnitude of the deformation, changing from blue (inwards) to green (no deformation) to red (outwards).
Hippocampal shape as a phenotype for genetic studies
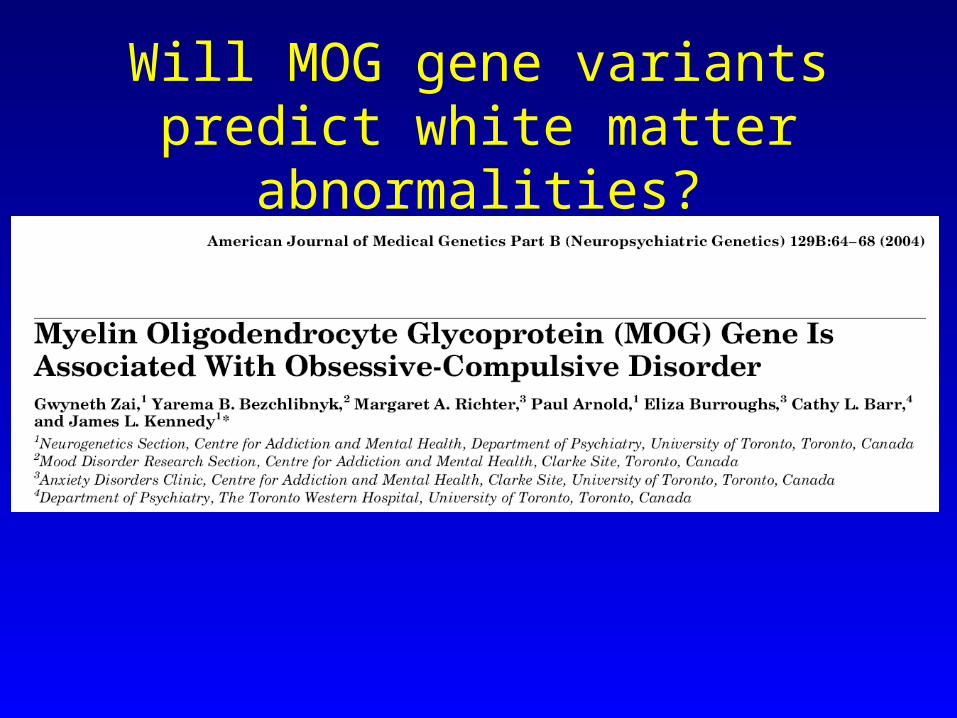
Will MOG gene variants predict white matter abnormalities?
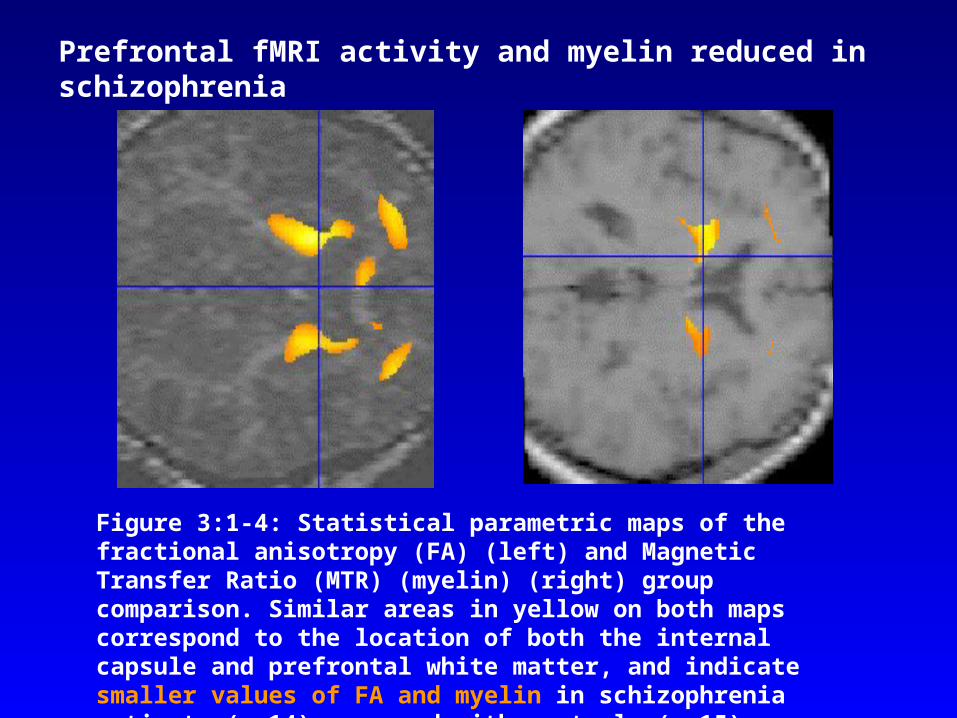
Figure 3:1-4: Statistical parametric maps of the fractional anisotropy (FA) (left) and Magnetic Transfer Ratio (MTR) (myelin) (right) group comparison. Similar areas in yellow on both maps correspond to the location of both the internal capsule and prefrontal white matter, and indicate smaller values of FA and myelin in schizophrenia patients (n=14) compared with controls (n=15).
Prefrontal fMRI activity and myelin reduced in schizophrenia

UNC
clustering
Bundle selection
Measurement along tract
Fractional Anisotropy
Hypothesis: MOG, MAG, MBP genes will predict quantity or distribution of myelinated tracts
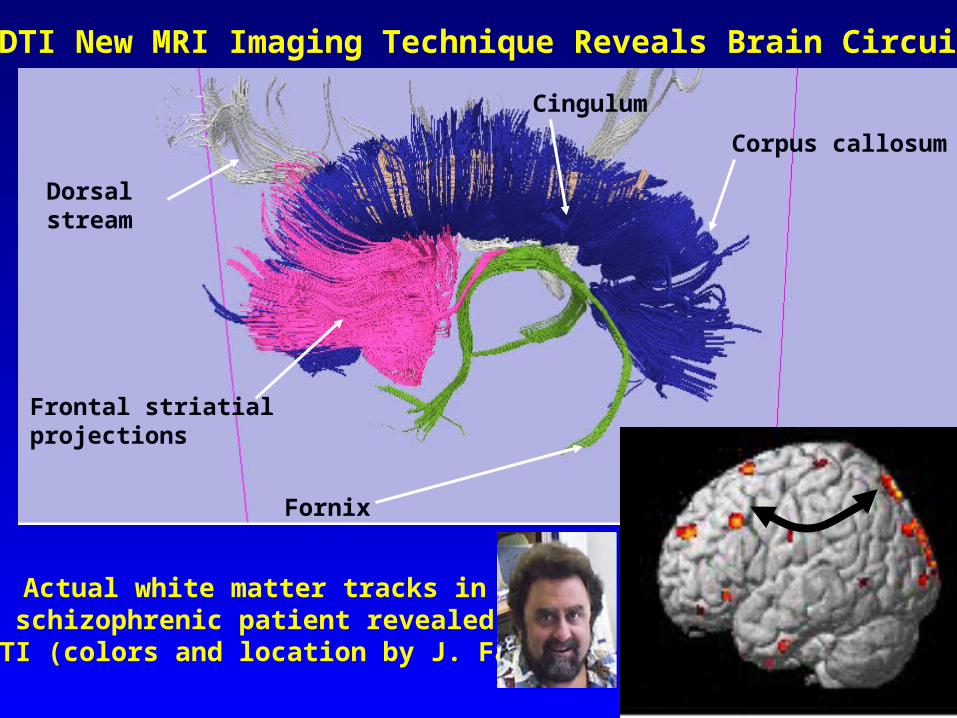
Fornix
Dorsal stream
Corpus callosum
Cingulum
Frontal striatial projections
DTI New MRI Imaging Technique Reveals Brain Circuits
Actual white matter tracks in schizophrenic patient revealed
by DTI (colors and location by J. Fallon)

Complexities in Genetics & Neuroimaging
• Genetic variants express themselves in many ways – singularly, or combined (haplotypes, epistasis, partial penetrance…)
• What are the appropriate phenotypes to use from brain imaging data?
• How to control massive multiple testing of genome scan x brain voxels (millions x millions)?

Summary• D3 gene link to tardive dyskinesia validated by
PET imaging• D1 role in schizophrenia and clozapine response
supported by genetic variants and PET activity pre/post clozapine
• BDNF gene candidate for grey matter measures?• MOG gene candidate for white matter?• Vast expanses of quality data await us: we only
need to develop our informatics sophistication…
National Alliance for Medical Imaging and Computing:
NAMICwww.na-mic.org

Recommended