iv
PRODUCTIVITY IMPROVEMENT FOR FURNITURE INDUSTRY BY USING
WITNESS SIMULATION SOFTWARE
TEE CHUN TECK
Thesis submitted in fulfillment of the requirements
for the award of the degree of
Bachelor of Mechanical Engineering with Manufacturing Engineering
Faculty of Mechanical Engineering
UNIVERSITI MALAYSIA PAHANG
DECEMBER 2010
ii
SUPERVISOR’S DECLARATION
I hereby declare that I have checked this project and in my opinion, this project is
adequate in terms of scope and quality for the award of the degree of Bachelor of
Mechanical Engineering with Manufacturing Engineering.
Signature:
Name of Supervisor: HADI BIN ABDUL SALAAM
Position: LECTURER
Date: 6 DECEMBER 2010
iii
STUDENT’S DECLARATION
I hereby declare that the work in this project is my own except for quotations and
summaries which have been duly acknowledged. The project has not been accepted for
any degree and is not concurrently submitted for award of other degree.
Signature:
Name: TEE CHUN TECK
ID Number: ME07060
Date: 6 DECEMBER 2010
v
ACKNOWLEDGMENTS
First of all, I would like to express my sincere gratitude to my supervisor, Mr.
Hadi Bin Abdul Salaam for his germinal ideas, invaluable guidance, continuous
encouragement and constant support in making this research possible. He has always
impressed me with his passion towards his job and his tolerance of my naïve mistakes. I
would also like to thank him for the time spent proofreading and correcting my many
mistakes.
Furthermore, I would like to thank the director or owner of Lein Hua Furniture
Industry Sdn. Bhd., Mr. Wan Hassan Bin Wan Omar who willing to share information
about his company and allowing me to undergo this project at the company. With his
kindness on letting me visit the company at anytime during operation hours directly
sped up the completion of my data collection. In addition, the appreciation is dedicated
to the supervisor and workers of the company as the co-operation from them is of
utmost importance, too.
I acknowledge my sincere indebtedness and gratitude to my parents, family
members, and friends for their love, dream and sacrifice throughout my life. Special
thanks to my parents who always supporting me along my study life and whenever I
face difficulties. Anyway, the love from GOD will always be remembered as I was
given the chance to complete my project smoothly without any hardship.
vi
ABSTRACT
A furniture industry typically involves a number of stages, including receiving raw
materials, cutting, sanding, laminating, shaping, drilling, brushing, assembly, and
finishing. The longer of process cycle time, the frequent of machine downtime, and the
poor layout of the factory have added to the complexity and challenges of furniture
industry. With respect to the project title, Productivity Improvement for Furniture
Industry by using WITNESS Simulation Software, Lein Hua Furniture Industry Sdn.
Bhd. (LHF) has been selected to be improved. The objective for LHF has always been
to achieve better productivity, reduce the processing time, minimize the machine
downtime, and meet regulatory requirements. This study focuses on applying simulation
method to improve the operations in the LHF industry. Therefore, the project objectives
can be briefly explained as to design and improve the floor layout of LHF, analyze the
designed layout and select the best solution. The project is started by evaluating and
identifying the problems existed in the industry, continued by data collection for the
data analysis and proceeds to applying simulation modelling step. Meantime, there are
three alternatives for improving productivity are suggested and the best of it to be
chosen. By running an experiment on the suggested alternatives to improve the output
of chairs, these alternatives are modeled in the WITNESS Simulation software and run
for the experimental time of 8 hours. These results are analyzed by Kruskal-Wallis and
one way ANOVA test for the best solution selection. The experimented results are then
being compared with the Cost-Effectiveness Analysis to determine the most efficient
layout that are able to produce high output of chairs with lowest cost. From the findings,
the most productivity improvement method is the Alternative 3, which is additional of a
Laminating machine and reduction of a Brushing machine, as well as combination of
Sanding II and Sanding III process after Drilling process. This approach increases the
daily output of chairs from 44 to 46 units and the cost of chair per unit from RM45.53
reduced to RM43.63. Therefore, the objectives of this project have been achieved and
the selected alternative will be proposed to the LHF for implementation.
vii
ABSTRAK
Lazimnya sebuah industri perabot memerlukan beberapa peringkat, termasuk
penerimaan bahan mentah, pemotongan, pelicinan, pelapisan, pembentukan,
pelubangan, pemberusan, pemasangan, dan penyelesaian. Kitaran masa proses yang
lama, kebarangkalian kerosakan mesin yang tinggi, serta kelemahan susun atur kilang,
sememangnya menyumbang kepada kerumitan dan sebagai cabaran terhadap kilang
perabot. Dengan tajuk projek yang berbunyi “Peningkatan penghasilan produk di kilang
perabot melalui perisian simulasi WITNESS”, Lein Hua Furniture Industry Sdn. Bhd.
(LHF) telah dipilih untuk ditingkatkan penghasilan produknya. Objektif LHF selama ini
adalah untuk mencapai penghasilan produk yang baik, mengurangkan masa
pemprosesan, mengurangkan kekerapan kerosakan mesin, serta menepati syarat
keperluan. Tesis ini menfokus kepada pengaplikasi kaedah simulasi untuk
menambahbaik operasi-operasi di industri LHF. Oleh demikian, objektif projek boleh
diringkas seperti mana untuk reka dan menambahbaik susun atur kilang LHF, analisis
terhadap susun atur yang direka serta memilih antara yang terbaik. Projek ini dimula
dengan penelitian dan penentuan masalah yang terdapat di industri, kemudian
mengambil data untuk analisis serta diteruskan dengan mengaplikasi kaedah simulasi.
Pada masa yang sama, tiga alternatif disaran dan antara yang terbaik akan dipilih.
Dengan menjalankan ujian terhadap alternatif yang bertujuan untuk meningkat jumlah
kerusi dihasil, kesemua model alternatif akan diuji dengan perisian simulasi WITNESS
untuk 8 jam simulasi. Keputusan yang diperoleh akan dianalisis dengan Kruskal-Wallis
dan ujian one way ANOVA untuk pilihan alternatif terbaik. Keputusan eksperimen inin
kemudian dibanding dengan Cost-Effectiveness Analysis untuk menentukan tapak susun
atur yang paling efisien dan mampu menghasilkan jumlah kerusi yang tinggi malah
dengan kos terendah. Dari penemuan, kaedah yang paling berkesan dalam peningkatan
produktiviti merupakan kaedah ketiga dimana ia adalah penambahan satu mesin
pelapisan dengan pengurangan satu mesin pemberusan, serta penggabungan proses
pelicinan II dan pelicinan III selepas proses pelubangan. Kaedah ini meningkat
penghasilan kerusi harian dari 44 kepada 46 serta kos satu kerusi dari RM45.53 menjadi
RM43.63. Justeru, tujuan projek ini telah dicapai dan alternatif yang dipilih akan
dicadangkan kepada LHF untuk pelaksanaannya.
viii
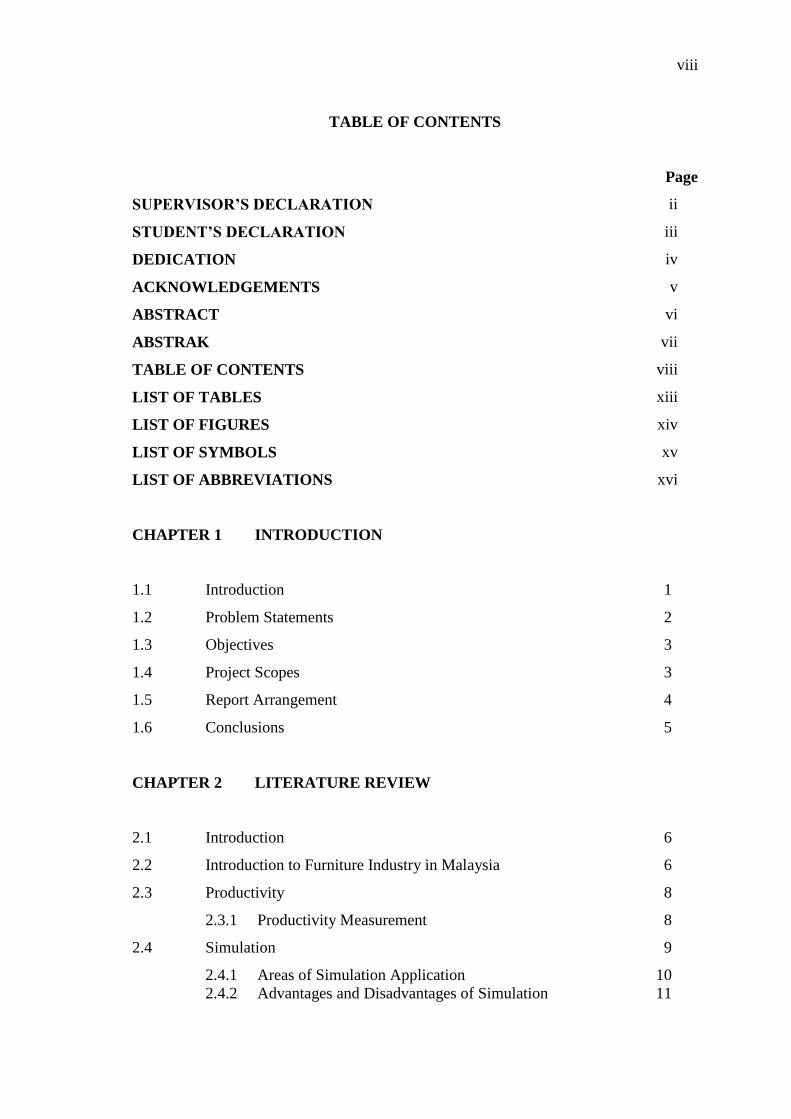
TABLE OF CONTENTS
Page
SUPERVISOR’S DECLARATION ii
STUDENT’S DECLARATION iii
DEDICATION iv
ACKNOWLEDGEMENTS v
ABSTRACT vi
ABSTRAK vii
TABLE OF CONTENTS viii
LIST OF TABLES xiii
LIST OF FIGURES xiv
LIST OF SYMBOLS xv
LIST OF ABBREVIATIONS xvi
CHAPTER 1 INTRODUCTION
1.1 Introduction 1
1.2 Problem Statements 2
1.3 Objectives 3
1.4 Project Scopes 3
1.5 Report Arrangement 4
1.6 Conclusions 5
CHAPTER 2 LITERATURE REVIEW
2.1 Introduction 6
2.2 Introduction to Furniture Industry in Malaysia 6
2.3 Productivity 8
2.3.1 Productivity Measurement 8
2.4 Simulation 9
2.4.1 Areas of Simulation Application 10
2.4.2 Advantages and Disadvantages of Simulation 11
ix
2.4.3 The Importance of Modelling and Simulation 12
2.5 Simulation Methodology 13
2.5.1 Problem Formulation 13
2.5.2 Setting Objectives and Overall Project Plan 14
2.5.3 Model Conceptualization 14
2.5.4 Data Collection 14
2.5.5 Model Translation 15
2.5.6 Verification 15
2.5.7 Validation 15
2.5.8 Experimental Design 16
2.5.9 Production Run and Analysis 16
2.5.10 More Runs? 16
2.5.11 Documentation and Reporting 16
2.5.12 Implementation 17
2.6 Model Verification 19
2.6.1 Verification Techniques 19
2.7 Model Validation 20
2.7.1 Validation Techniques 21
2.8 Previous Research in Manufacturing Industry 22
2.9 Conclusions 29
CHAPTER 3 COMPANY BACKGROUND
3.1 Introduction 30
3.2 Company Profile 30
3.3 Company Logo 31
3.4 Company Objectives 31
3.5 Company Vision 31
3.6 Company Missions 32
3.7 LHF Organization Chart 32
3.8 LHF Production Floor Layout 34
3.9 Process Flow Description 35
3.10 Conclusions 36
CHAPTER 4 METHODOLOGY
x
4.1 Introduction 37
4.2 Design of Project Study 37
4.2.1 Project Flow Chart for Final Year Project 40
4.3 Conclusions 42
CHAPTER 5 DATA ANALYSIS AND MODELLING
5.1 Introduction 43
5.2 Conceptual Model 43
5.3 Performance Measure 44
5.4 Decision Variables 45
5.5 Data Analysis 45
5.6 Model Description 47
5.7 Model Assumptions 48
5.8 Model Construction 48
5.9 Determining Required Number of Replications 49
5.10 Conclusions 51
CHAPTER 6 RESULTS AND DISCUSSIONS
6.1 Introduction 52
6.2 Evaluation for the Existing Production Floor Layout 53
6.3 Alternative 1: Additional of 1 Laminating Machine and Reduction
of 1 Brushing Machine
55
6.4 Alternative 2: Combining of Sanding II and Sanding III Process
after Drilling Process
57
6.5 Alternative 3: Combination of Alternative 1 and Alternative 2 59
6.6 Result Analysis 60
6.7 Cost-Effectiveness Analysis 61
6.7.1 Assumptions for Cost-Effectiveness Analysis 62
6.7.2 Cost Estimation for Existing Layout 63
6.7.3 Cost Estimation for Alternative 1 Layout 64
6.7.4 Cost Estimation for Alternative 2 Layout 65
6.7.5 Cost Estimation for Alternative 3 Layout 66
xi
6.7 6 Results on Cost-Effectiveness Analysis 67
6.8 Discussions 67
6.9 Conclusions 69
CHAPTER 7 CONCLUSIONS
7.1 Introduction 70
7.2 Project Summary 70
7.3 Findings 71
7.4 Further Recommendations 71
7.5 Conclusions 72
REFERENCES 73
APPENDICES
A Project Gantt Chart 76
B Example of Sample Size Calculation (Process Cycle Time) 81
C Summary of Cycle Time Data and Sample Size 82
D Data Analysis with Chi-Square Test (Process Cycle Time) 83
D1 Chi-Square Test Calculation for Cutting Process 84
D2 Chi-Square Test Calculation for Sanding I Process 87
D3 Chi-Square Test Calculation for Laminating Process 90
D4 Chi-Square Test Calculation for Shaping Process 93
D5 Chi-Square Test Calculation for Sanding II Process 96
D6 Chi-Square Test Calculation for Drilling / Boring Process 99
D7 Chi-Square Test Calculation for Sanding III Process 102
D8 Chi-Square Test Calculation for Brushing Process 105
D9 Chi-Square Test Calculation for Assembly Process 108
D10 Chi-Square Test Calculation for Finishing Process 111
E Example of Sample Size Calculation (Machine Downtime) 114
F Summary of Machine Downtime Data and Sample Size 115
G Data Analysis with Chi-Square Test (Machine Downtime) 116
G1 Chi-Square Test Calculation for Cutting Process 117
G2 Chi-Square Test Calculation for Sanding I Process 120
xii
G3 Chi-Square Test Calculation for Laminating Process 123
G4 Chi-Square Test Calculation for Shaping Process 126
G5 Chi-Square Test Calculation for Sanding II Process 129
G6 Chi-Square Test Calculation for Drilling / Boring Process 132
G7 Chi-Square Test Calculation for Sanding III Process 135
G8 Chi-Square Test Calculation for Brushing Process 138
G9 Chi-Square Test Calculation for Assembly Process 141
G10 Chi-Square Test Calculation for Finishing Process 144
H Actual Daily Production Output Data 147
xiii
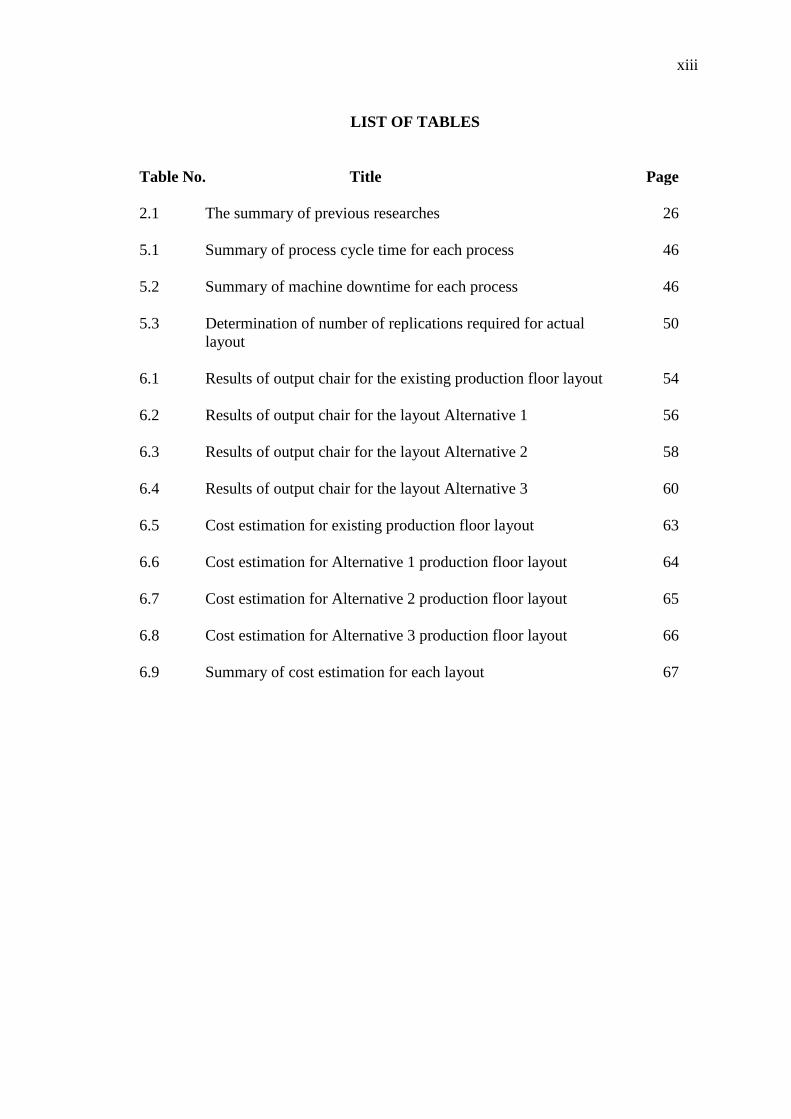
LIST OF TABLES
Table No. Title Page
2.1 The summary of previous researches 26
5.1 Summary of process cycle time for each process 46
5.2 Summary of machine downtime for each process 46
5.3 Determination of number of replications required for actual
layout
50
6.1 Results of output chair for the existing production floor layout 54
6.2 Results of output chair for the layout Alternative 1 56
6.3 Results of output chair for the layout Alternative 2 58
6.4 Results of output chair for the layout Alternative 3 60
6.5 Cost estimation for existing production floor layout 63
6.6 Cost estimation for Alternative 1 production floor layout 64
6.7 Cost estimation for Alternative 2 production floor layout 65
6.8 Cost estimation for Alternative 3 production floor layout 66
6.9 Summary of cost estimation for each layout 67
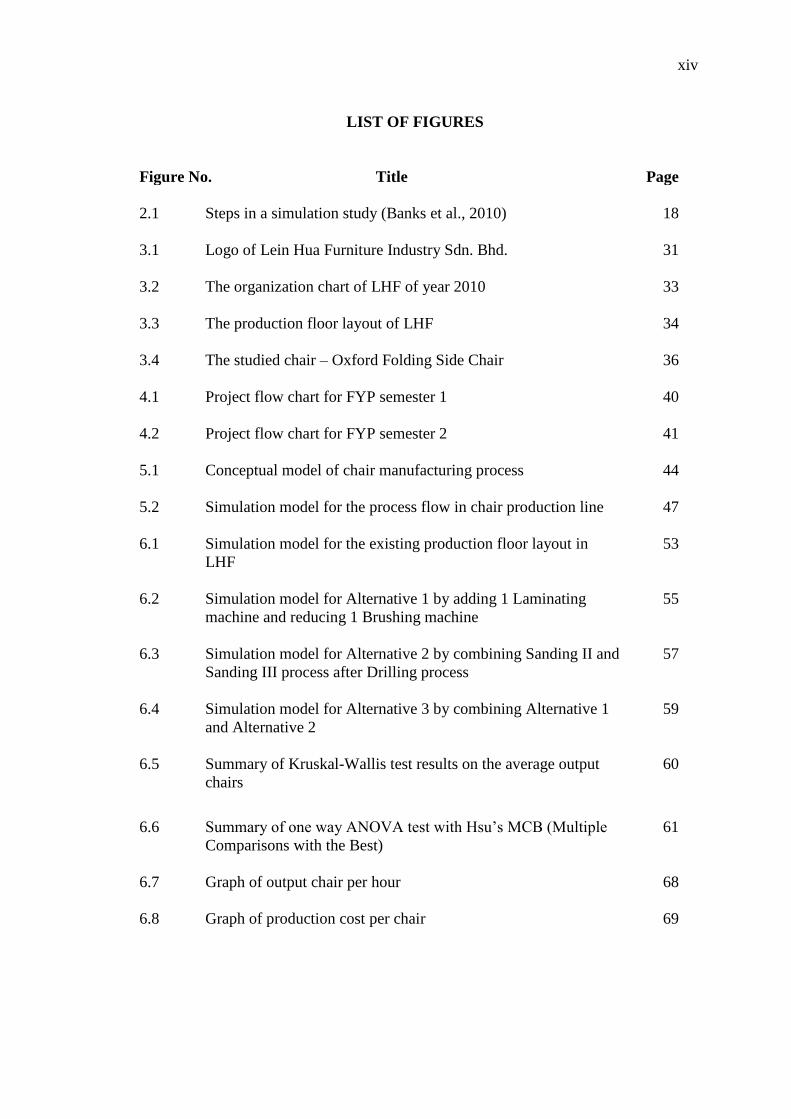
xiv
LIST OF FIGURES
Figure No. Title Page
2.1 Steps in a simulation study (Banks et al., 2010) 18
3.1 Logo of Lein Hua Furniture Industry Sdn. Bhd. 31
3.2 The organization chart of LHF of year 2010 33
3.3 The production floor layout of LHF 34
3.4 The studied chair – Oxford Folding Side Chair 36
4.1 Project flow chart for FYP semester 1 40
4.2 Project flow chart for FYP semester 2 41
5.1 Conceptual model of chair manufacturing process 44
5.2 Simulation model for the process flow in chair production line 47
6.1 Simulation model for the existing production floor layout in
LHF
53
6.2 Simulation model for Alternative 1 by adding 1 Laminating
machine and reducing 1 Brushing machine
55
6.3 Simulation model for Alternative 2 by combining Sanding II and
Sanding III process after Drilling process
57
6.4 Simulation model for Alternative 3 by combining Alternative 1
and Alternative 2
59
6.5 Summary of Kruskal-Wallis test results on the average output
chairs
60
6.6 Summary of one way ANOVA test with Hsu’s MCB (Multiple
Comparisons with the Best)
61
6.7 Graph of output chair per hour 68
6.8 Graph of production cost per chair 69
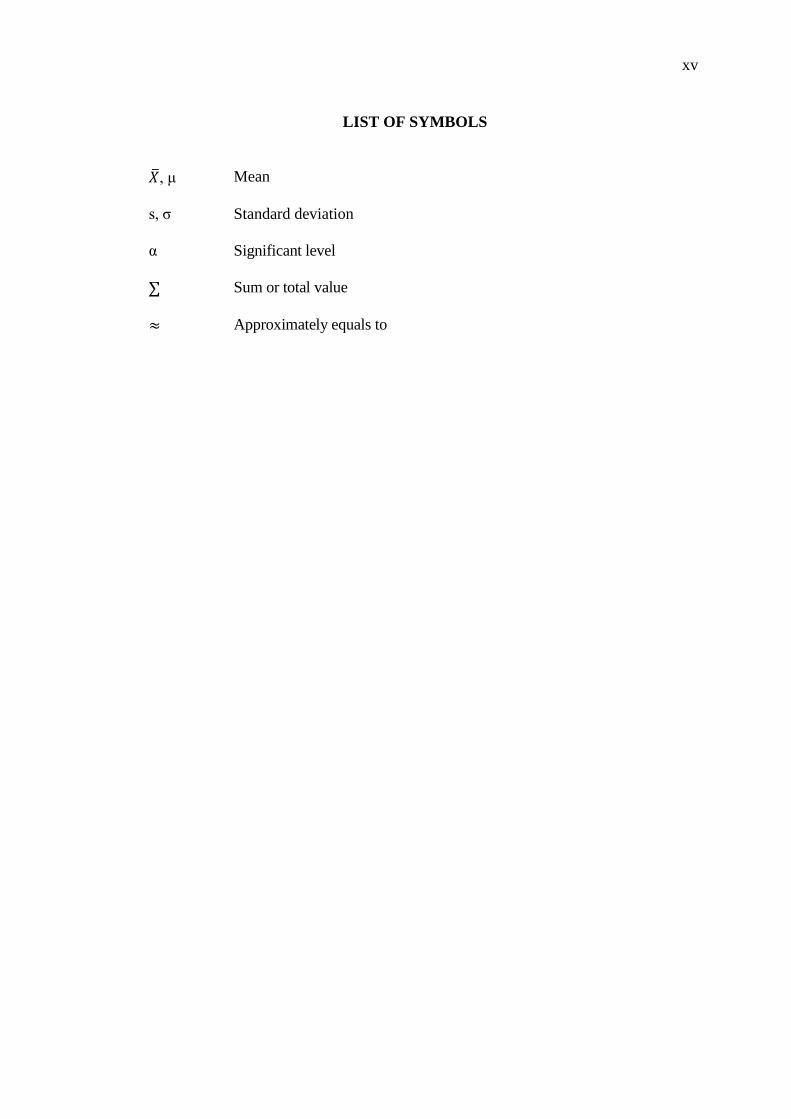
xv
LIST OF SYMBOLS
, μ Mean
s, σ Standard deviation
α Significant level
Sum or total value
Approximately equals to
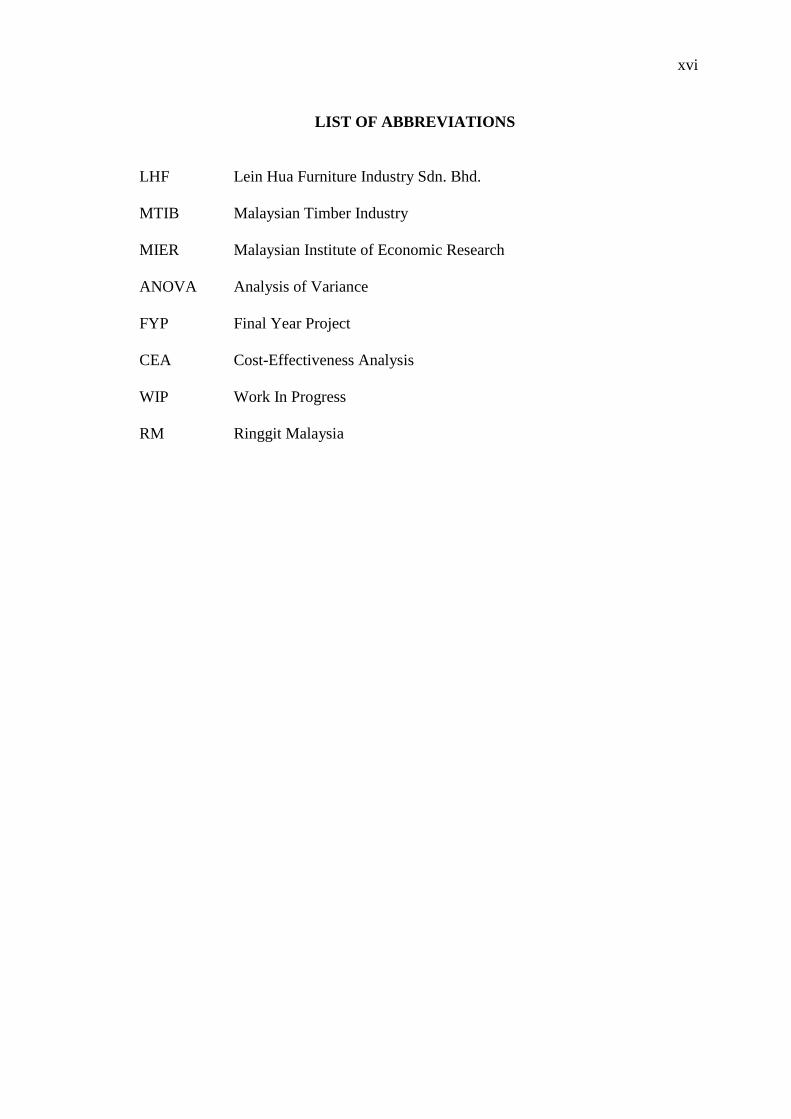
xvi
LIST OF ABBREVIATIONS
LHF Lein Hua Furniture Industry Sdn. Bhd.
MTIB Malaysian Timber Industry
MIER Malaysian Institute of Economic Research
ANOVA Analysis of Variance
FYP Final Year Project
CEA Cost-Effectiveness Analysis
WIP Work In Progress
RM Ringgit Malaysia
1
CHAPTER 1
INTRODUCTION
1.1 INTRODUCTION
In today competitive market, the survival of any industry is greatly depends on
response time, production costs and flexibility in manufacturing (Chase et al. 2001). For
almost all manufacturing industry, an increased productivity and better overall
efficiency of the production line are the most important goals. Most industries would
like to find the recipe for the ultimate productivity improvement strategy. However,
those same industries that are searching for this holy grail are likely to have found
themselves unable to take full advantage of the methodologies and techniques so far
tried. Part of this is because many of them simply do not understand what productivity
really means. (Baines A., 1997).
In order to overcome the lower productivity problem, a thorough understanding
and research of the process in the existing company is necessary so that an efficient
improvement can be generated to increase the productivity in the researched company.
In fact, there is a good number of management techniques such as zero inventory (ZI),
just-in-time (JIT), flexible manufacturing system (FMS), optimized production
technology (OPT) and total quality management (TQM) that support the
implementation of productivity improvement plans. (McTavish R. et al. 1996).
However, there is another method which is the most welcoming among these methods –
productivity improvement via simulation method.
Simulation is a process of building a model that mimics reality. It provides a
greater understanding of the company layout or system being studied. In a
2
manufacturing industry, simulation is a concept of creating the existing production floor
using simulation software. The reason of creating the existing production floor is to
analyze and evaluate the existing production floor performance which in turn, leads to
cost and time reduction, increment of revenue as well as production productivity.
This chapter provides an overview of the case study titled “Productivity
Improvement for Furniture Industry by using WITNESS Simulation Software”.
Generally, problem statements will briefly discuss about the problems that furniture
industry faced during the production of a product.
In this chapter, an overview of the objectives of this case study and scope of this
case study will be reviewed. Basically, the objective of this study is to find an
alternative way to increase productivity. This study will be done in one of the furniture
industries in Malaysia. In this chapter, the review of the report arrangement will be
discussed in general.
1.2 PROBLEM STATEMENTS
In furniture industry, production floor layout involves the arrangement of
machines that used to produce a product, the buffer that used in the production floor to
store the parts temporarily, and the raw material storage that will be sent to manufacture
products. There are several methods available to design, analyze and redesign of
production floor layout to improve productivity of a production line.
The furniture industry of Lein Hua Furniture Industry Sdn. Bhd. is selected after
some inspection is due to the unsatisfactory of the existing floor layout that causes the
low daily production. Therefore, analysis and improvement for the production floor
layout will be done in this project in order to enhance the productivity of the industry.
Today, there are plenty of simulation software such as ARENA, Quest,
ProModel and WITNESS were developed to allow users to model current existing
production floor layout for evaluation. By applying simulation software, the actual
3
problems can be modeled in the software rather than rearranging the actual machine
first before evaluation as it might be risky.
This study would illustrate the process flow of the current existing production
floor layout to evaluate the current production performance. Designs of a few more
alternatives will be proposed to assist the company to improve the productivity
maintaining or even reducing the operating cost.
1.3 OBJECTIVES
The objectives of this study are:
1. To identify problems in existing production floor layout.
2. To design and improve manufacturing production floor layout by using
simulation software and by observation during the collection data of cycle time
as well as machine downtime.
3. To measure manufacturing performance such as production quantity, lead time,
bottle neck and by using cost effectiveness analysis.
1.4 PROJECT SCOPES
This study will analyze an industry specific problem of production floor layout
in order to increase the productivity and solve it through several alternative production
floor layouts.
i. This study is conducted at Lein Hua Furniture Industry Sdn. Bhd. (LHF) which
located at Semambu, Kuantan, Pahang.
ii. One production line involved, which is the chair production.
iii. Production floor layout evaluation will be done with WITNESS Simulation
Software and results analysis will be done by using Cost-effectiveness Analysis
and Minitab Software.
iv. This study evaluates daily output of production and average processing time
generated from the simulation experimentation.
4
1.5 REPORT ARRANGEMENT
This study is divided into seven chapters. In the first chapter, the introduction of
the study will be discussed. This chapter will be provided with the problem statements
and objectives of the study. An overview of scopes of the study will be discussed. Then,
the report arrangement of this project also will be reviewed in this chapter.
For chapter two, the literature review of the study will be discussed. This chapter
provides with the introduction to furniture industry in Malaysia. Besides, the definition
of productivity will be discussed. The interpretation of simulation and simulation
methodology will be reviewed in this chapter. Lastly, the previous researches that
related to this study will be included in this chapter.
In chapter three, the introduction of the furniture industry background is to be
reviewed. The company profile including organization history of establishment,
company logo, company objectives, vision and mission are shown in this chapter. In
addition, the company organization chart and its production floor layout are attached for
reference. Lastly, the process flow of the chair production line is described in detail.
In chapter four, the flow of methodology will be reviewed. The discussion of the
methodology used in conducting this study from the beginning until the study is
completed is shown in this chapter. The design of the study and the framework of the
study will be reviewed at first. Then, the project flow chart for final year project
semester 1 and semester 2 also will be included in this chapter.
In chapter five, a conceptual model is included as to reflect the pre-model of the
production floor layout. Then, the performance measure and the decision variables are
discussed. It proceeds with the discussion of method used to analyze data. Furthermore,
the model description, model assumptions, and model construction are included and
explained in details. Lastly, this chapter ends with determining the required number of
replications before proceed to ANOVA analysis.
5
Chapter six, on the other hand, consists of the discussion of the existing layout
performance and the proposed alternatives layout results. Three alternatives have been
suggested in this chapter in order to improve the low productivity of the existing layout.
The results generated from the WITNESS Simulation software is tested using Minitab
software. The result analysis is then discussed in general. Lastly, the cost-effectiveness
analysis for the existing layout and proposed layouts is determined in this chapter.
In chapter seven, it summarizes the results that obtained in previous chapter. The
project summary and project findings are discussed in this chapter. The most efficiency
layout among the suggested alternatives will be proposed to the LHF. Further
improvement and recommendations for this company is also included in this chapter.
1.6 CONCLUSIONS
As a conclusion, the overview of this project is reviewed. It introduces a brief
concept of the project by developing the idea of the problems faced by the furniture
industry. The problem statements are identified after selecting the suitable researched
company. The objectives and scopes of the project are stated to specify the boundary of
the study to avoid any deviation from the title of the project. Lastly, the arrangement of
report displayed the summary of each chapter discussed in this project.
6
CHAPTER 2
LITERATURE REVIEW
2.1 INTRODUCTION
This chapter discussed about literature review of simulation study in improving
the productivity of a furniture industry, which is Lein Hua Furniture Industry Sdn. Bhd.
(LHF). It began with the introduction to furniture industry and the definition of
productivity. The simulation including its areas of application, advantages and
disadvantages, and its importance are discussed in general. This followed by the general
procedure for simulation methodology. Finally, a total of ten previous researches that
are related to this study are included as references.
2.2 INTRODUCTION TO FURNITURE INDUSTRY IN MALAYSIA
The furniture industry in Malaysia plays a key role in the country economy.
Since the late of 1970s, the government has considered it as a strategic one and
encouraged its development with investment in infrastructures and incentives to export.
Therefore, a traditional sector based on small craftsmanship enterprises has gradually
transformed into a major industry.
In 2007, there were about 2,965 furniture plants in Malaysia, with 2,630 in
Peninsular Malaysia, 120 in Sabah and 215 in Sarawak. It is estimated that 70% were
small scale plants such as workshops and backyard factories using low level production
technology and catering to domestic markets (MTIB, 2007). The remaining 30% were
large and medium sized furniture plants which have penetrated the export markets
7
(MTIB, 2007). In terms of ownership, it is estimated that more than 75% of the furniture
companies are either wholly or majority Malaysia owned (MIER, 2008).
Generally, the Malaysian furniture manufacturers can be categorized into four
categories:
i. Small and medium scale industries established and operating in the furniture
village.
ii. Small scale industries established and operating outside the furniture village.
iii. Medium and large manufacturing companies – local owned.
iv. Large manufacturing companies – joint venture and foreign owned.
The furniture mills in Peninsular Malaysia are more developed and most of these
mills are located on the West Coast (MIER, 2008). The highest number of furniture
exporter manufacturing plants are in the state of Johor, followed by Selangor, Perak,
and Kedah (MTIB, 2009). In Johor, the highest concentration and most productive
manufacturing plants are in Muar, while in Selangor they are in the Klang Valley area.
The location of furniture establishments in these states are greatly influenced by
proximity to the supply, distance to the export exit points, access to labors, and the
availability of good infrastructure, supporting industries, and facilities.
Furniture of both wood and rattan are the stars of the timber sector. Under the
concerted efforts of the various development agencies, exports of furniture have
increased tremendously nowadays. The United States represents the largest single
market for Malaysian furniture, in which in the year of 2007, the United States
accounted for 42% of Malaysian furniture exports. The U.S. imports from Malaysia
consisted mainly of wooden chairs and miscellaneous wooden furniture, dining tables,
and furniture parts.
Japan is the second largest wood furniture importing country after the United
States. The European furniture market is the largest in terms of consumption and value
in the world. However, the European Union remains a difficult market for Malaysian
furniture exporters to penetrate. The United Kingdom and the Netherlands are the two
largest markets for Malaysian furniture, too. Other major markets are Singapore and
8
Taiwan. Currently, most of the furniture is segmented for the medium and lower end
market.
Nonetheless, there are factors affecting the export of furniture from a country,
which can be divided into domestic and international trade factors. The domestic factors
include the supply of raw materials from both domestic log productions and import
sources, and the export levy and quota rules. International trade factors, on the other
hand, are the currency exchange rates and import price indexes. All in all, the most
important factors influencing the success of a furniture mill are the mill’s primary
characteristics, decision maker’s expectation of exporting and global marketing
strategy.
2.3 PRODUCTIVITY
Productivity can be defined as the application of the various resources or inputs
of an organization, industry or country, in order to achieve certain planned and desired
results or outputs. In other words, productivity more broadly means production rate per
unit of input, especially per unit of labor, for goods or services (Young and Murray,
2005). It is one of the key factors affecting the overall competitiveness of an
organization, in such a way that by improving productivity means improving efficiency.
Productivity improvement can be considered as a process to achieve higher
levels of output while consuming same or lesser amounts of input resources.
Additionally, if the same output level is reached in a shorter time period, it indicates
improved productivity as well. Today’s global competition requires increased
throughput levels over lesser time horizons.
2.3.1 Productivity Measurement
Productivity can be measured in two ways: single-factor productivity and
multifactor productivity. By definition, the use of just one resource input to measure
productivity, as shown in Eq. (2.1), is known as single-factor productivity. Multifactor
productivity, however, is defined as a broader view of productivity, which includes all
9
inputs, such as labor, material, capital, energy, and miscellaneous. It is also known as
total factor productivity and is calculated by combining the inputs units as shown in Eq.
(2.2). (Heizer and Render, 2008).
The two productivity measurements above help in determining the production
performance. However, the results can be expected to vary. This is because if labor
productivity growth is entirely the results of capital spending, measuring just labor
distorts the results. Therefore, multifactor productivity is usually more suitable to use
although it is more complicated. The measure of multifactor productivity provides better
information about the trade-offs among factors, but substantial measurement problems
remain. According to Heizer and Render (2008), the measurement problems include the
change of quality when the quantity of inputs and outputs remains constant, external
elements may cause an increase or decrease in productivity for which the system under
study may not be directly responsible, and also the precise units of measure may be
lacking.
2.4 SIMULATION
Simulation is an important problem-solving methodology for the solution of
many real-world problems in the manufacturing industry. A traditional definition of
simulation is the act or process of simulating, feigning, the imitative representation of
the functioning of one system or process by means of the functioning of another, which
the examination of a problem often not subject to direct experimentation by means of a
simulating device. However, simulation software designers generally define simulation
as imitating the operations of various kinds of real-world facilities or processes, the
process of designing a mathematical-logical model of a real system and experimenting
with this model on a computer.
Recommended