Its Still The Prices Stupid: Observations on Health Care Spending in the US
Niall Brennan CEO, HCCI @N_Brennan March, 2020
HCCI’s Mission
HCCI’s mission is to get to the heart of the key issues impacting the U.S. health care system — by using the best data to get the best answers.
Our values are simple: § Health care claims data should be accessible to all those who have
important questions to ask of it.
§ Health care information should be transparent and easy to understand.
§ All stakeholders in the health care system can drive improvements in quality and value with robust analytics.
HCCI reports cost trends and facilitates informed debate about the less-understood commercially-insured population

HCCI 1.0 Data Holdings
ESI42M
Medicare Fee-For-Service Claims
• National Qualified Entity (QE) • Years: 2012-2017 • 100% Parts A & B & D
Commercial Claims • Years: 2008-2017 • All 50 states and D.C. • Updated annually • De-identified, HIPAA and anti-trust compliant
FFSMedicare40M
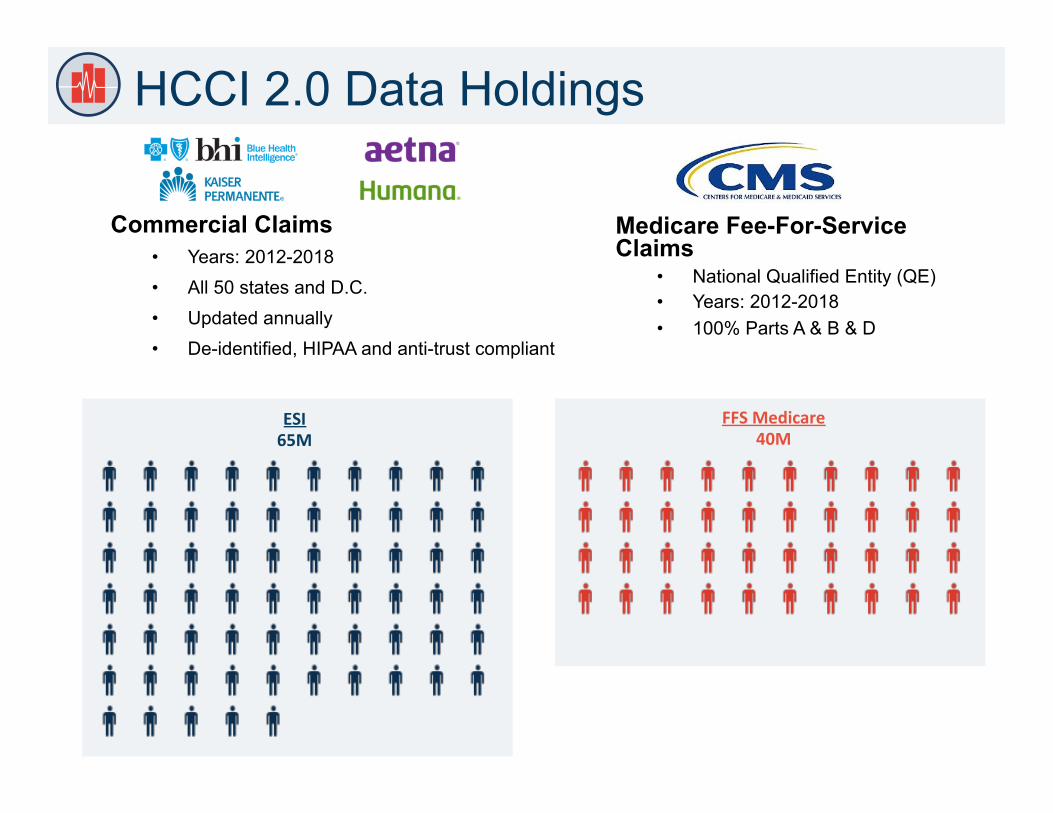
HCCI 2.0 Data Holdings
ESI65M
Medicare Fee-For-Service Claims
• National Qualified Entity (QE) • Years: 2012-2018 • 100% Parts A & B & D
Commercial Claims • Years: 2012-2018 • All 50 states and D.C. • Updated annually • De-identified, HIPAA and anti-trust compliant
FFSMedicare40M
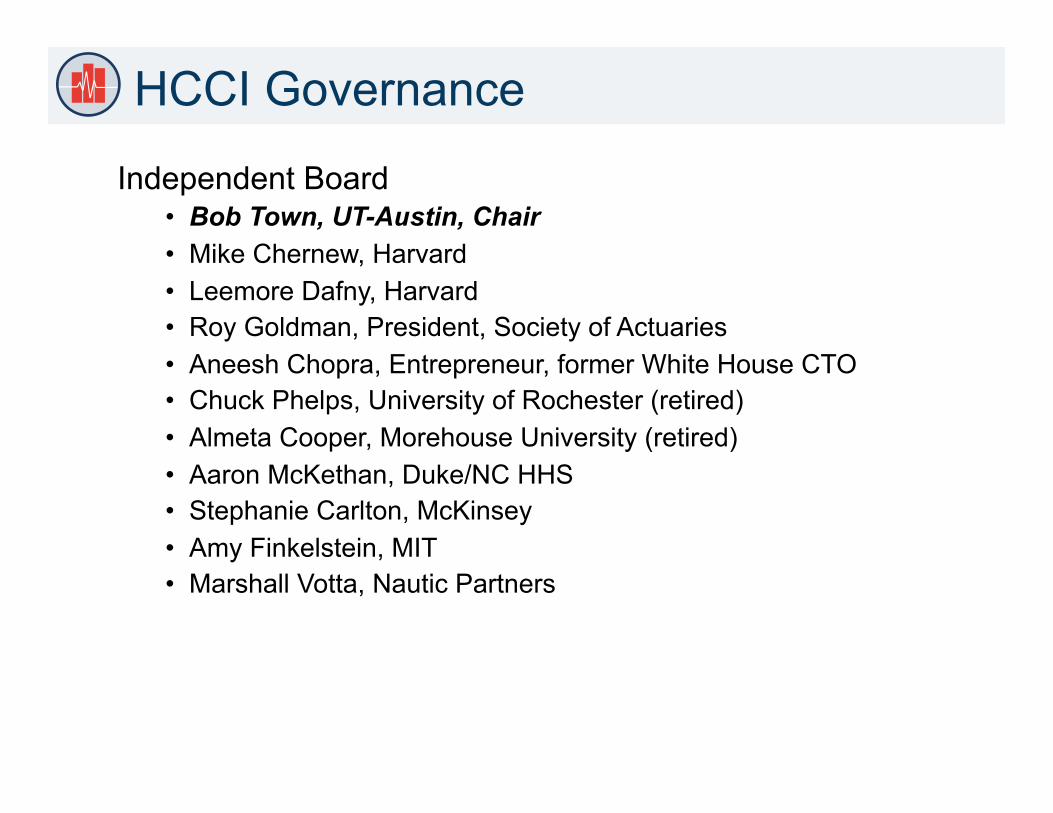
HCCI Governance
Independent Board • Bob Town, UT-Austin, Chair • Mike Chernew, Harvard • Leemore Dafny, Harvard • Roy Goldman, President, Society of Actuaries • Aneesh Chopra, Entrepreneur, former White House CTO • Chuck Phelps, University of Rochester (retired) • Almeta Cooper, Morehouse University (retired) • Aaron McKethan, Duke/NC HHS • Stephanie Carlton, McKinsey • Amy Finkelstein, MIT • Marshall Votta, Nautic Partners

Enabling World Class Research
HCCI’s current research partners include:
HCCI also facilitates data access and research through foundation partnerships:
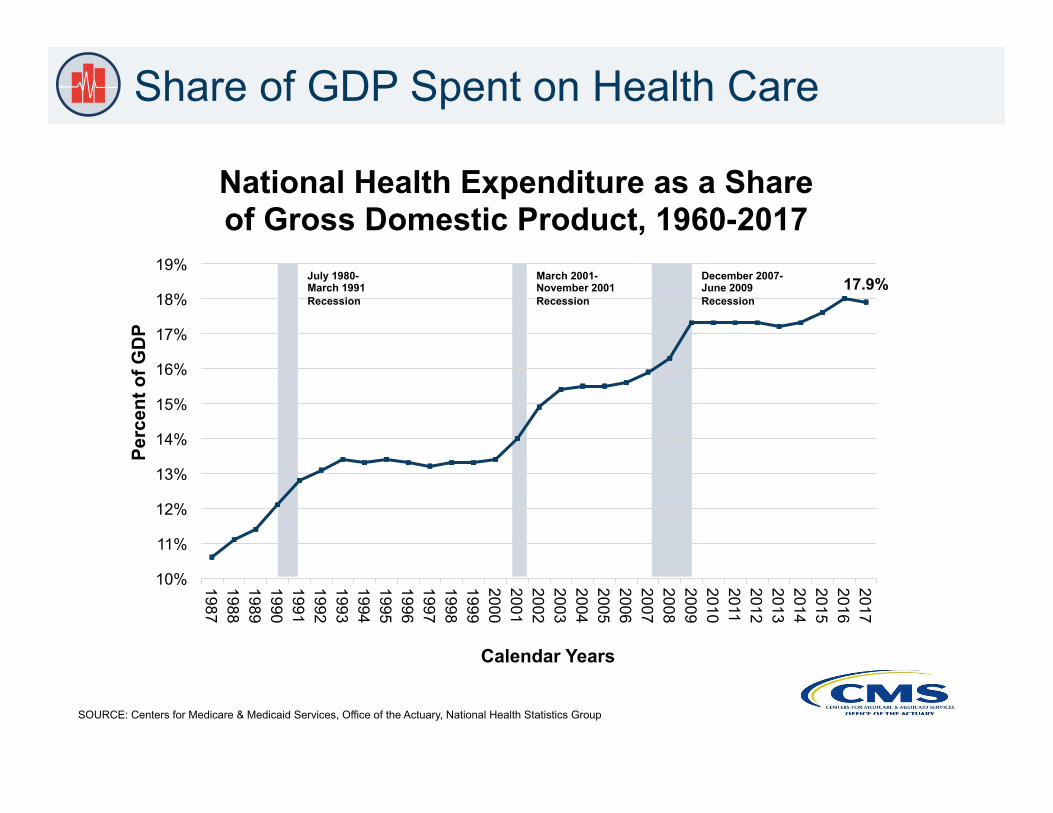
SOURCE: Centers for Medicare & Medicaid Services, Office of the Actuary, National Health Statistics Group
Share of GDP Spent on Health Care
17.9%
10%
11%
12%
13%
14%
15%
16%
17%
18%
19%
1987 1988 1989 1990 1991 1992 1993 1994 1995 1996 1997 1998 1999 2000 2001 2002 2003 2004 2005 2006 2007 2008 2009 2010 2011 2012 2013 2014 2015 2016 2017
Perc
ent o
f GD
P
Calendar Years
National Health Expenditure as a Share of Gross Domestic Product, 1960-2017
March 2001-November 2001 Recession
December 2007-June 2009 Recession
July 1980-March 1991 Recession

US Health Care Employment 1998-2018
Health Care Reform Efforts in the US
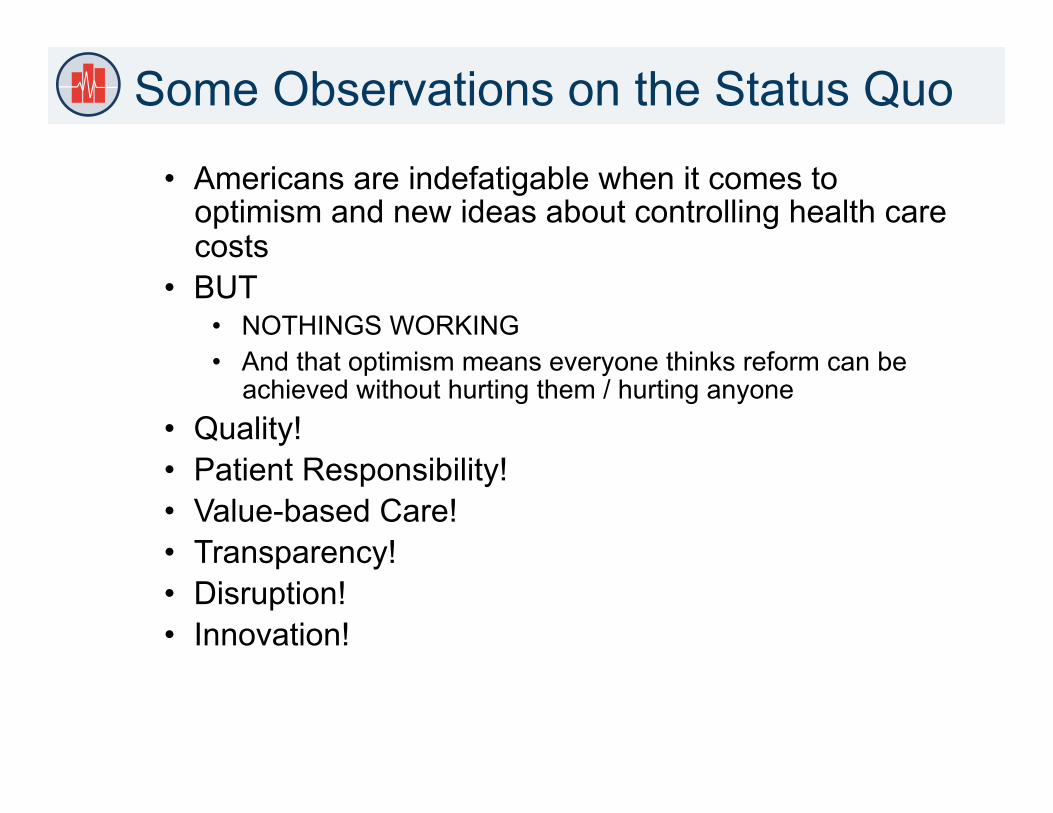
Some Observations on the Status Quo
• Americans are indefatigable when it comes to optimism and new ideas about controlling health care costs
• BUT • NOTHINGS WORKING • And that optimism means everyone thinks reform can be
achieved without hurting them / hurting anyone • Quality! • Patient Responsibility! • Value-based Care! • Transparency! • Disruption! • Innovation!
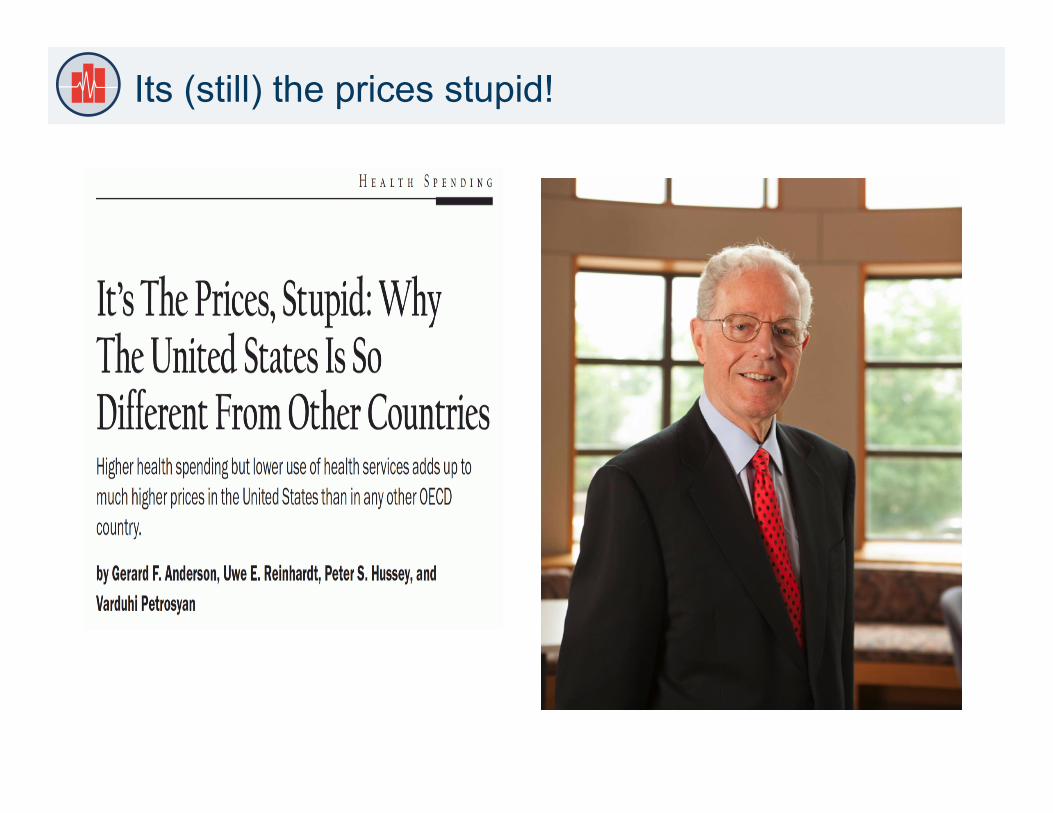
Its (still) the prices stupid!
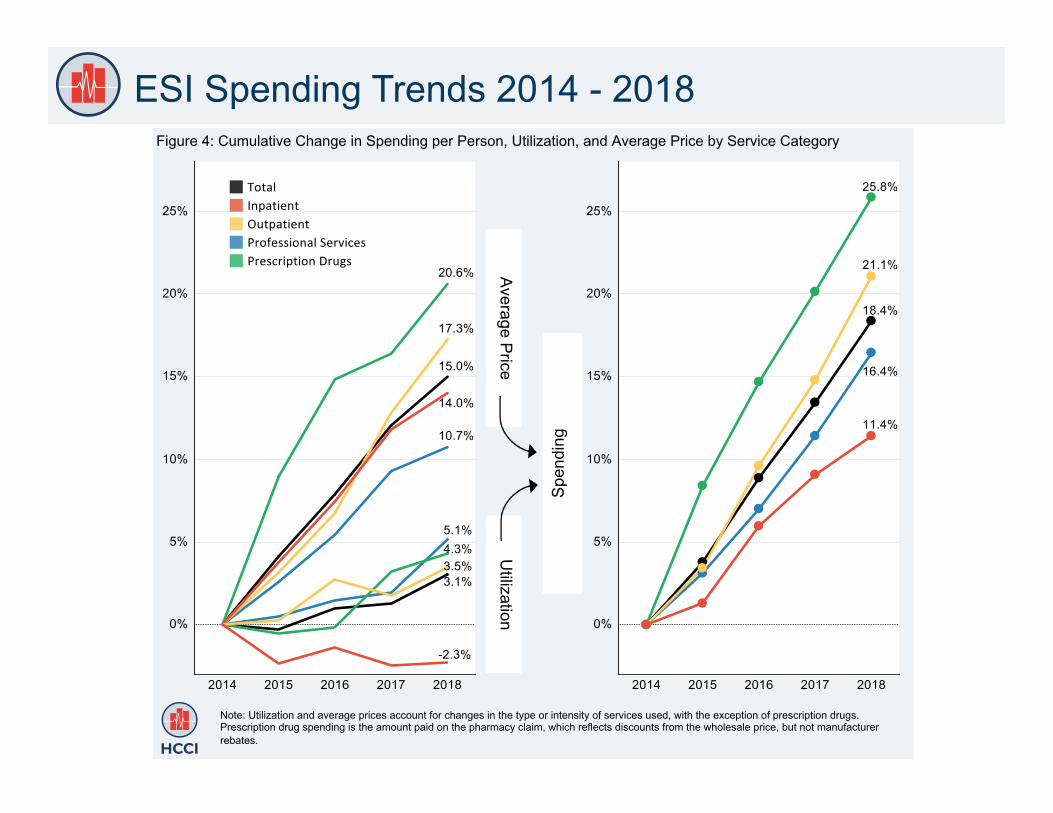
ESI Spending Trends 2014 - 2018 Figure 4: Cumulative Change in Spending per Person, Utilization, and Average Price by Service Category
Average P
rice U
tilization S
pend
ing
Note: Utilization and average prices account for changes in the type or intensity of services used, with the exception of prescription drugs. Prescription drug spending is the amount paid on the pharmacy claim, which reflects discounts from the wholesale price, but not manufacturer rebates.

What Factors Drove Health Care Spending Increases?
Figure 2: Factors Contributing to Growth in Spending per Person (2018 dollars) • A#eraccoun+ngforinfla+on,
healthcarespendingincreased$610overthefive-yearperiod.
• Pricegrowthaccountedforjustaboutthree-quarters($453)ofthecumula+veincreaseaboveinfla+onoverthefive-yearperiod.
• Increasesinthequan+tyofservicesusedaccountedfor21%($130)ofthecumula+veincreasebeyondinfla+on,withmuchofthatcontribu+oncominginthelastyearoftheperiod.
• Thepopula+onwithemployer-sponsoredinsurancegotslightlyolderandslightlymorefemaleonaveragebetween2014and2018,whichaccountedforjustover4%($27)ofthegrowthaboveinfla+oninspendingperperson.
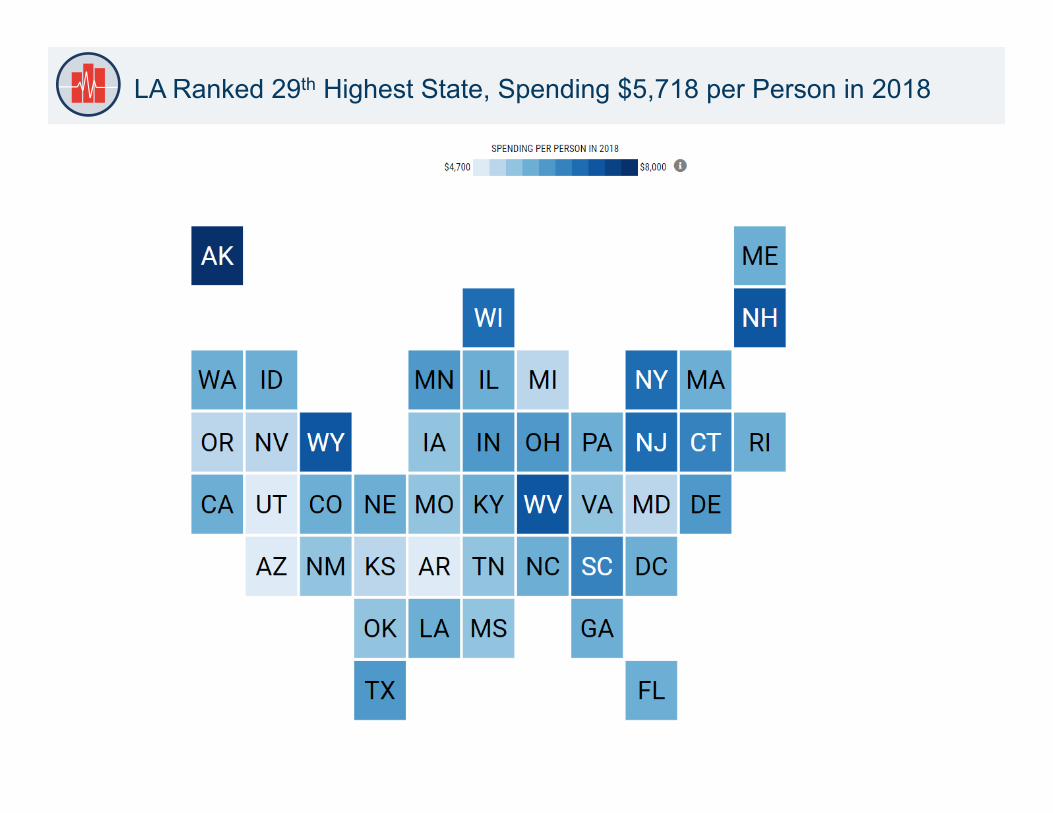
LA Ranked 29th Highest State, Spending $5,718 per Person in 2018

15
Spending Growth in LA was lower than the National Average from 2014 to 2018
16
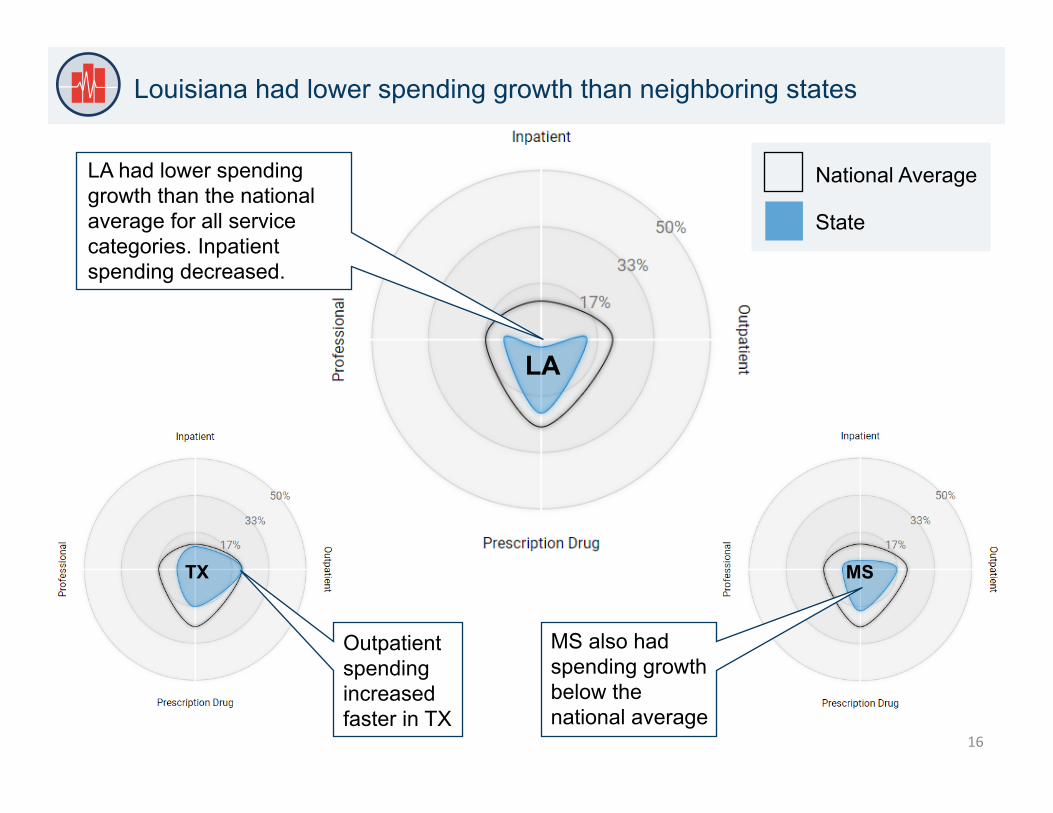
Louisiana had lower spending growth than neighboring states
LA
TX MS
State
National Average
Outpatient spending increased faster in TX
LA had lower spending growth than the national average for all service categories. Inpatient spending decreased.
MS also had spending growth below the national average
17
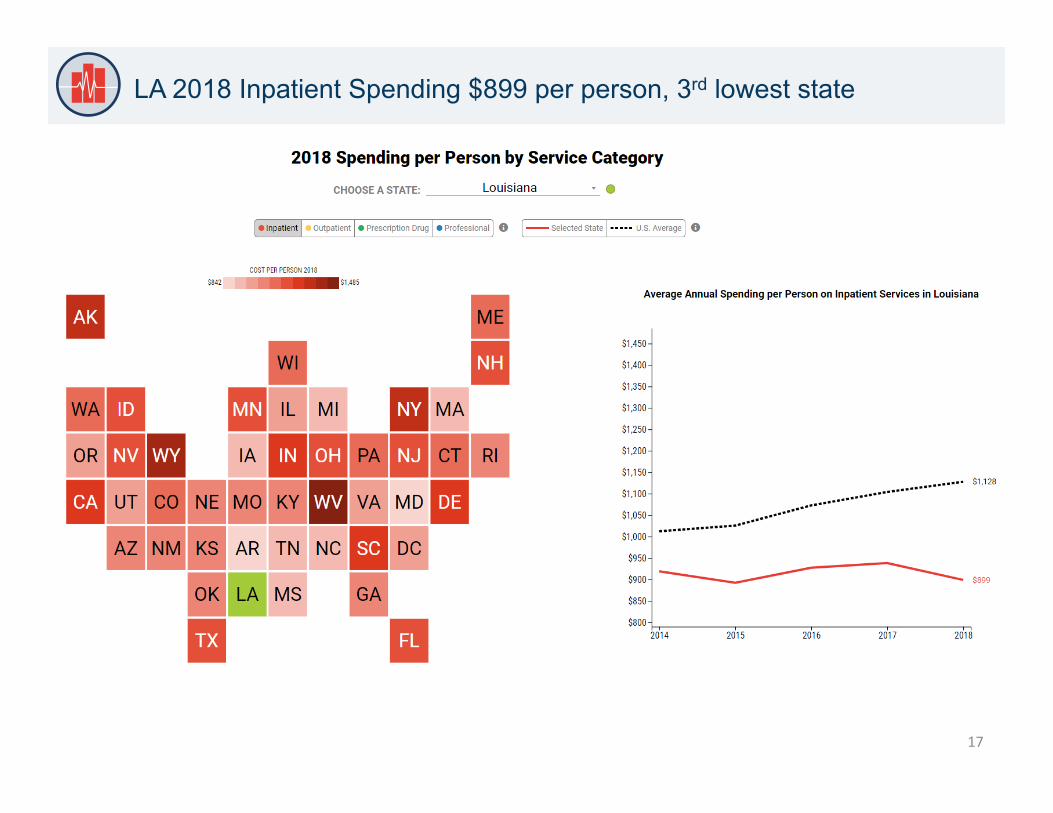
LA 2018 Inpatient Spending $899 per person, 3rd lowest state

18
LA 2018 Outpatient Spending $1,671 per person, 25th highest state

19
LA 2018 Professional Spending $1,830 per person, 24th highest state
HCCI: Healthy Marketplace Index
Project Overview: § Compare how local health care markets function throughout the country
§ Analyzed over 1.8 billion commercial claims from 2012-2016
§ Develop, publicly report a standard set of replicable measures: § Service Price, Service Use, Hospital Market Competition
§ For each measure: interactive web articles, dashboards, public use files § Explore trends across 112 metro areas in 43 States
§ Including 4 metros within the state of Louisiana

Wide Variation in Prices Across U.S.
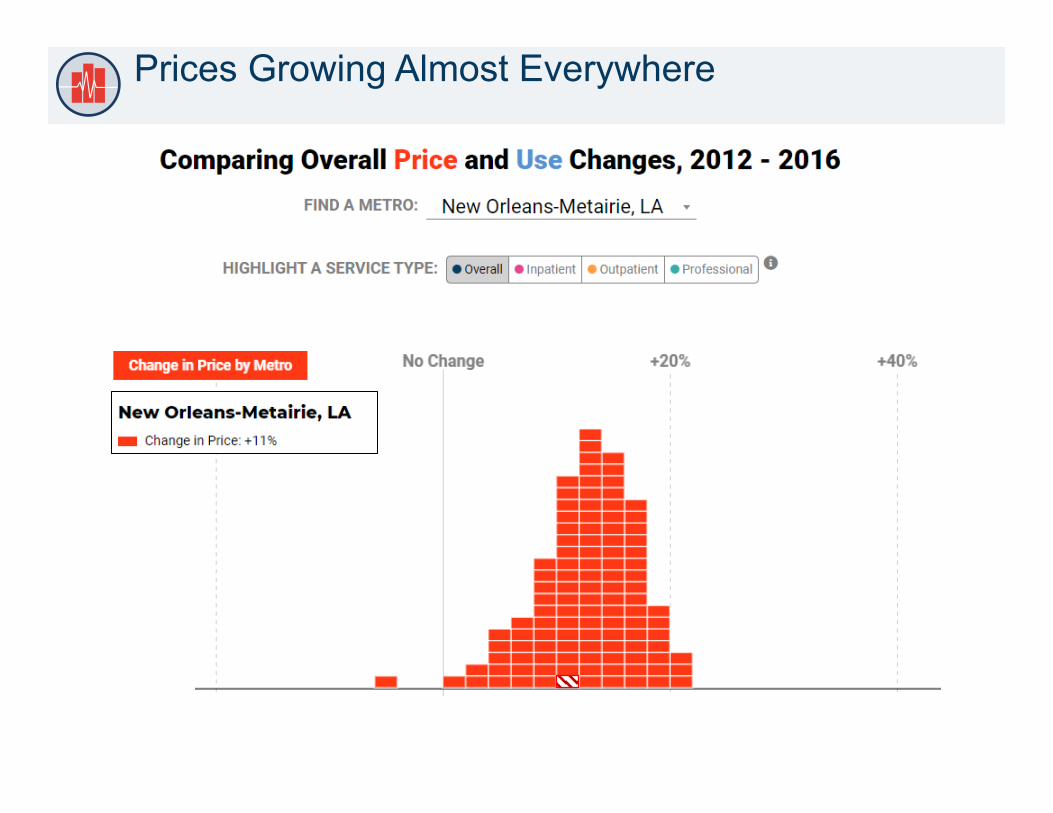
Prices Growing Almost Everywhere

However, Use Declining Largely Everywhere

Held True throughout Louisiana
Metro Area % Change in Price % Change in Use
Baton Rouge +9% -16%
Lafayette +5% -23%
New Orleans-Metairie +11% -25%
Shreveport-Bossier City +11% -8%
All 4 metro areas in Louisiana experienced a growth in prices & decline in use § Prices
§ Lafayette (+5%) lowest growth rate, New Orleans & Shreveport (+11%) both had highest
§ Use § Shreveport (-8%) smallest decline, New Orleans (-25%) largest

Compare Price & Use by Metro and Over Time
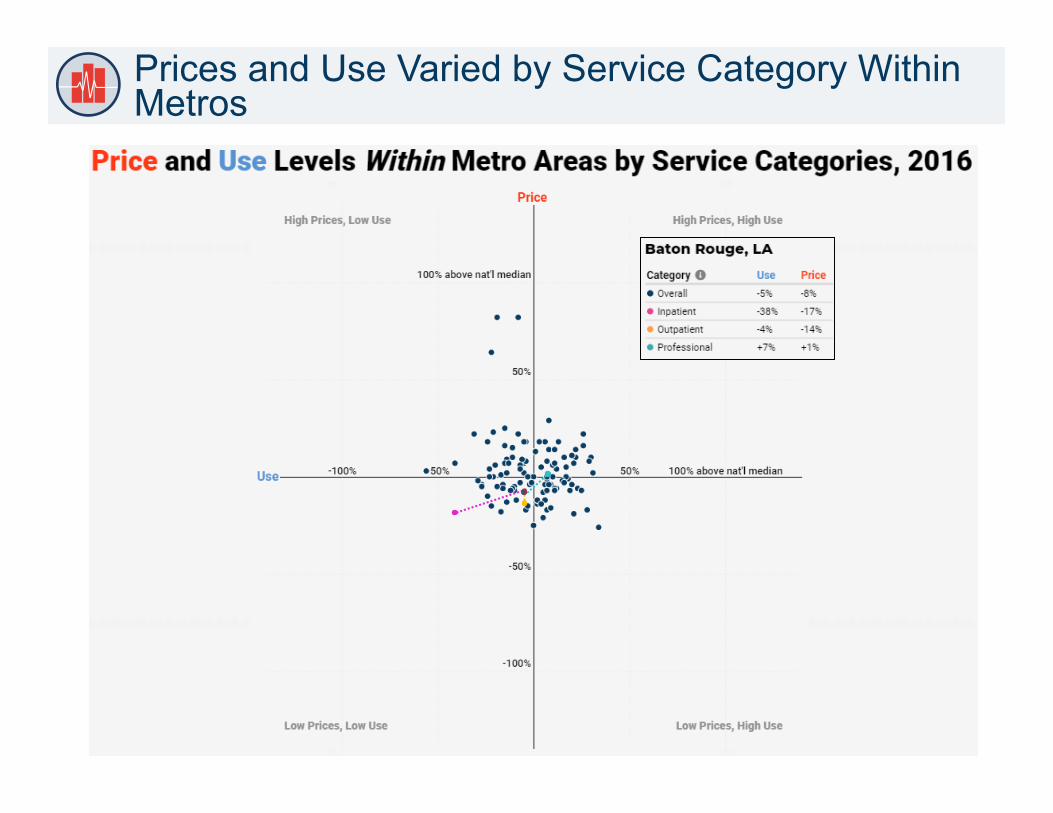
Prices and Use Varied by Service Category Within Metros
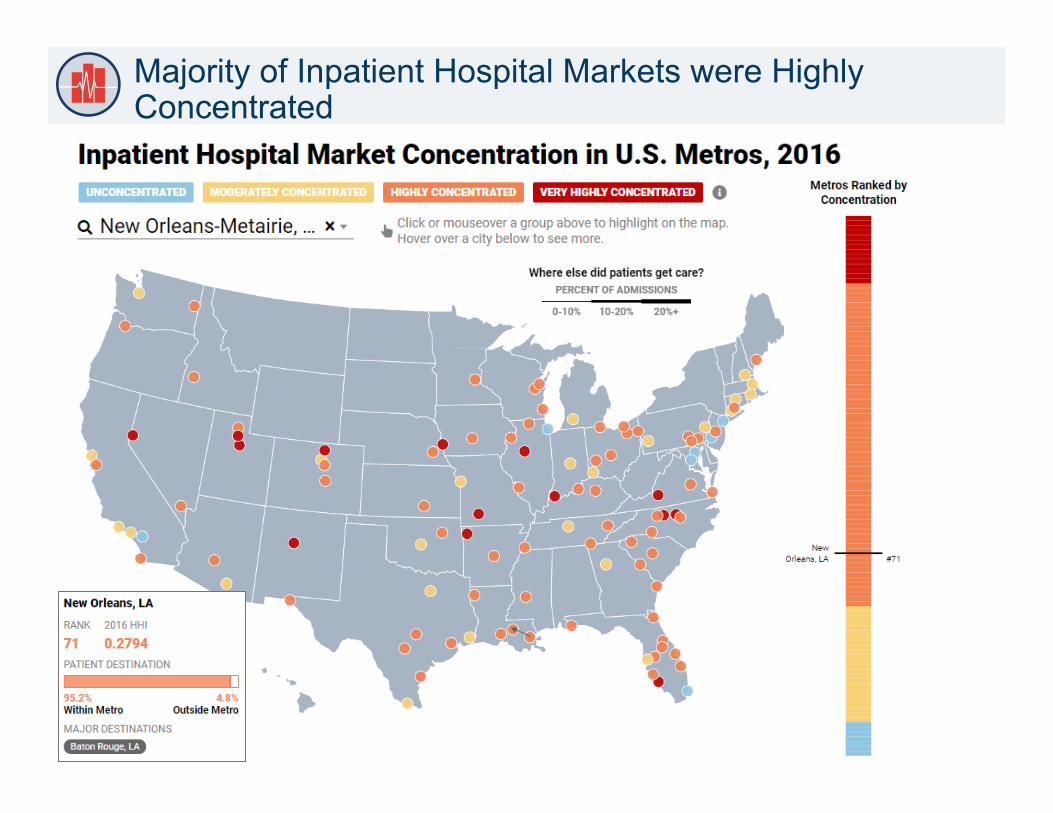
Majority of Inpatient Hospital Markets were Highly Concentrated
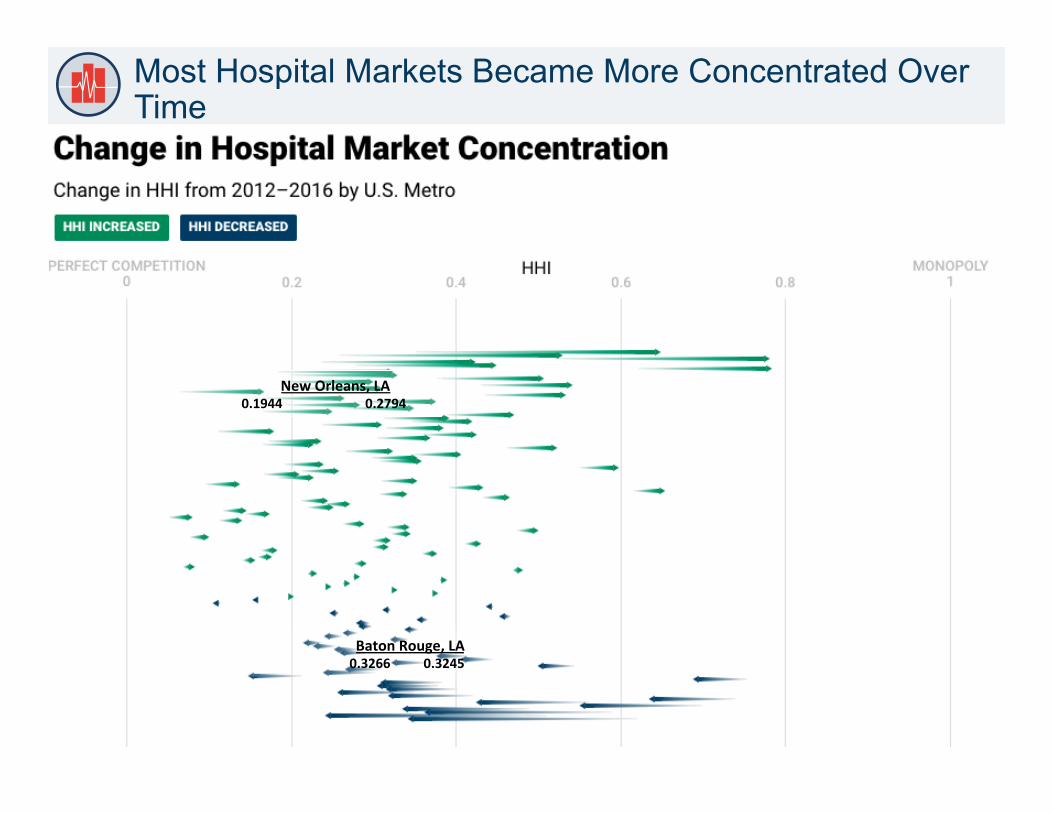
Most Hospital Markets Became More Concentrated Over Time
NewOrleans,LA0.19440.2794
BatonRouge,LA0.32660.3245

Compare Market Concentration Level by Metro and Over Time

Price Levels Don’t Necessarily Capture Variation in Prices of Different Services Within Areas
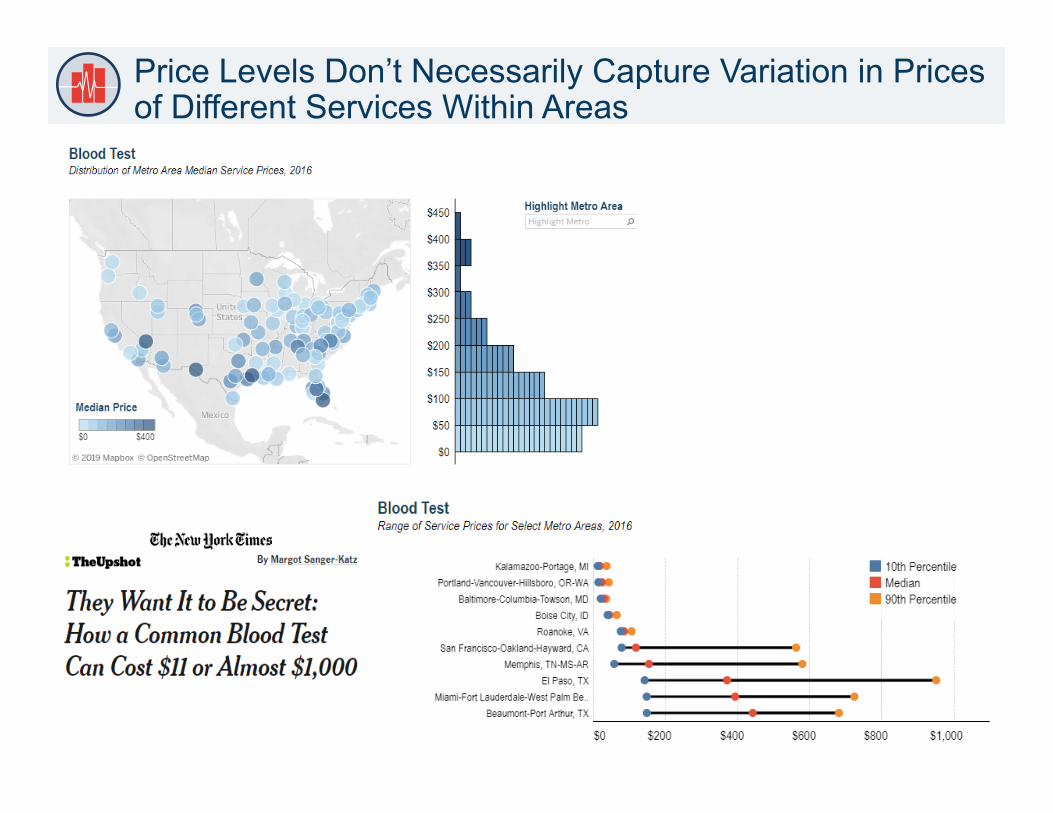
Price Levels Don’t Necessarily Capture Variation in Prices of Different Services Within Areas

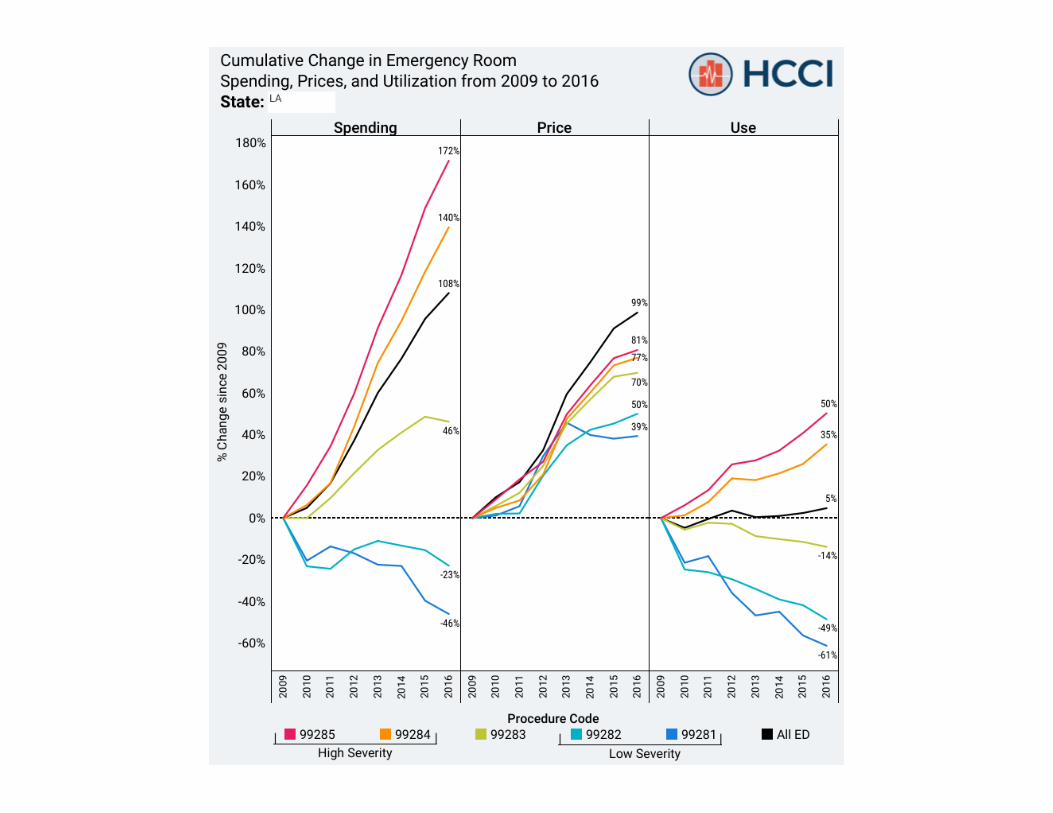
10 Years of ER Spending – prices and coding
Spending per Person more than doubled in 10 years
2008 2017
All 99281 99282 99283 99284 99285 }High
Severity
Low Severity }
Overall ER Use did not change over the 10 years, but the mix of CPT codes billed did
99281
99282
99283
99284
99285

Median increase in point-of-sales prices for common insulin products between 2012 and 2016 was 92%
Average Price per Product ($) 5-yr Chg. (%) Product Delivery Description 2012 2013 2014 2015 2016
Bas
al
Humulin N Vial 10mL, 100 units/mL 68 79 95 116 131 93% Pen 5 pens, 3mL each, 100 units/mL 219 257 290 KwikPen 5 pens, 3mL each, 100 units/mL 314 370 415
Novolin N Vial 10mL, 100 units/mL 67 75 89 108 Lantus Vial 10mL, 100 units/mL 123 152 211 244 243 98%
SoloStar Pen 5 pens, 3mL each, 100 units/mL 217 258 325 368 367 69% Levemir Vial 10mL, 100 units/mL 124 152 216 252 264 113%
FlexPen 5 pens, 3mL each, 100 units/mL 217 253 315 FlexTouch 5 pens, 3mL each, 100 units/mL 353 380 398
Toujeo SoloStar Pen 3 pens, 1.5mL each, 300 units/mL 333 328
Tresiba U-100 Pen 5 pens, 3mL each, 100 units/mL 440 U-200 Pen 3 pens, 3mL each, 200 units/mL 524
Mea
ltim
e
Humulin R Vial 10mL, 100 units/mL 68 80 96 116 132 94% U-500 Vial 20mL, 500 units/mL 563 804 961 1152 1319 134% U-500 KwikPen 2 pens, 3mL each, 500 units/mL 513
Novolin R Vial 10mL, 100 units/mL 68 79 93 Apidra Vial 10mL, 100 units/mL 97 124 169 209 240 147%
SoloStar Pen 5 pens, 3mL each, 100 units/mL 196 244 332 408 466 138% Humalog Vial 10mL, 100 units/mL 127 147 178 213 241 90%
Cartridge 5 cart., 3mL each, 100 units/mL 235 271 334 398 449 91% Pen 5 pens, 3mL each, 100 units/mL 247 285 346 415 469 90% KwikPen 2 pens, 3mL each, 200 units/mL 381
Novolog Vial 10mL, 100 units/mL 127 146 176 209 237 87% Cartridge 5 cart., 3mL each, 100 units/mL 242 275 333 397 443 83% FlexPen 5 pens, 3mL each, 100 units/mL 247 286 344 409 461 87%
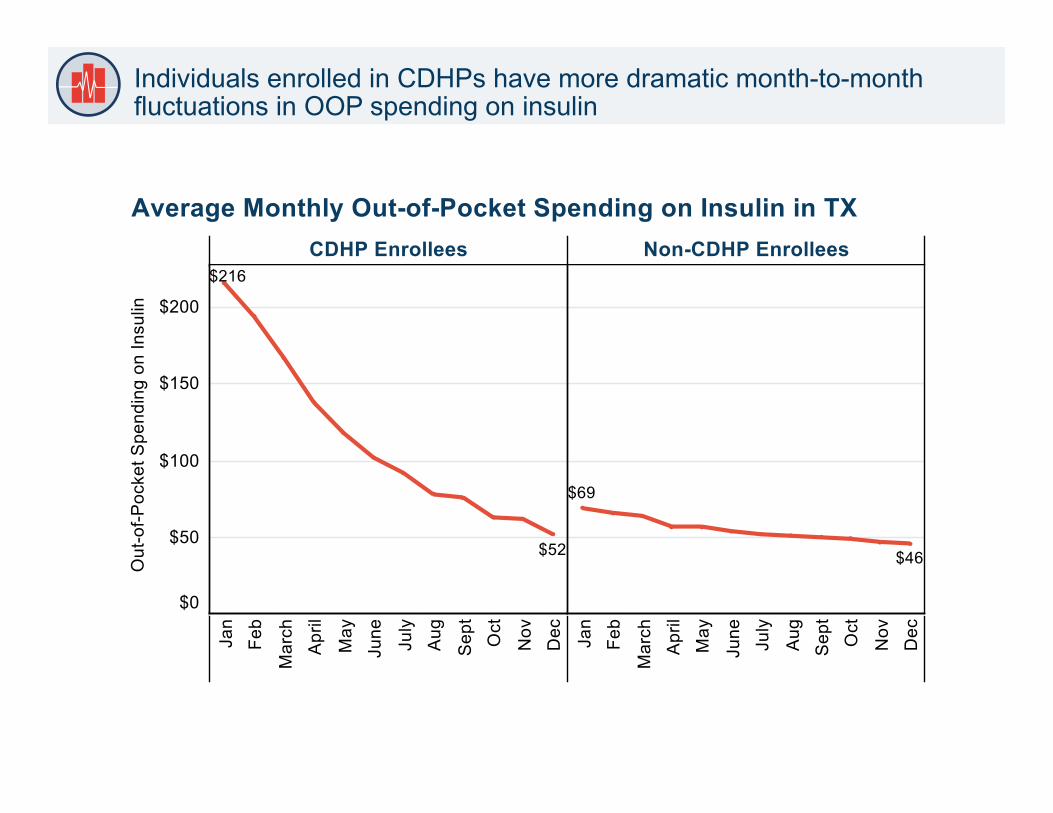
Individuals enrolled in CDHPs have more dramatic month-to-month fluctuations in OOP spending on insulin
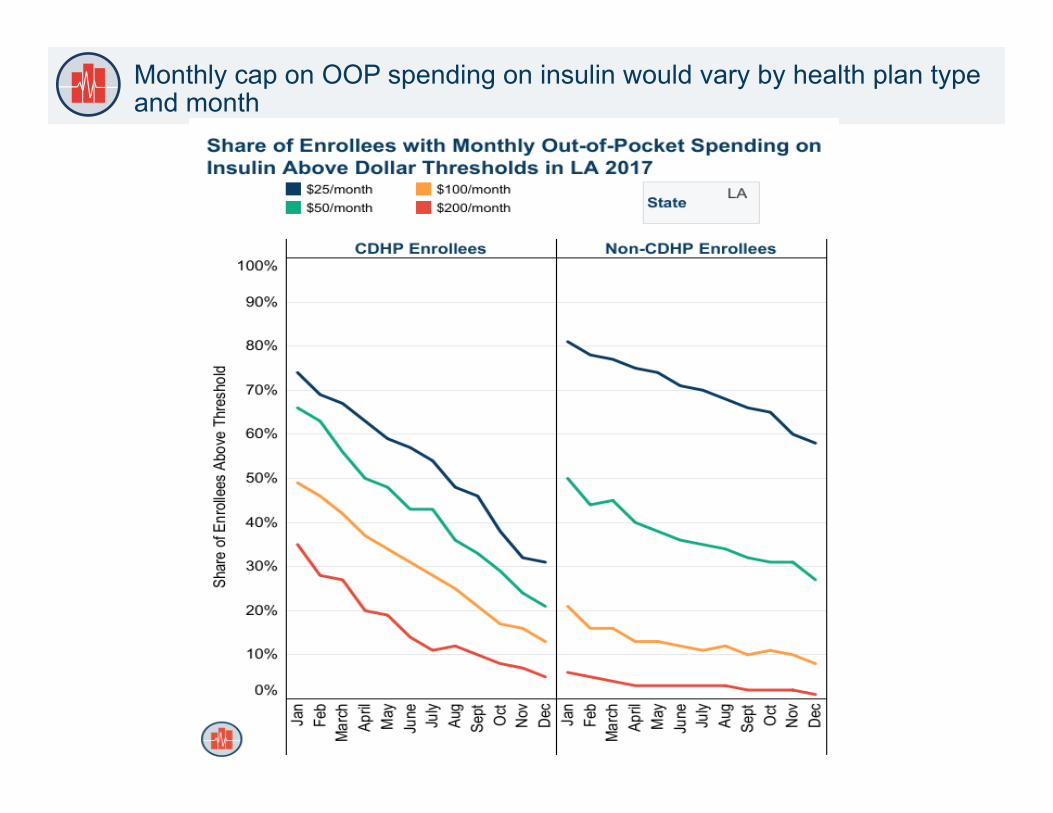
Monthly cap on OOP spending on insulin would vary by health plan type and month
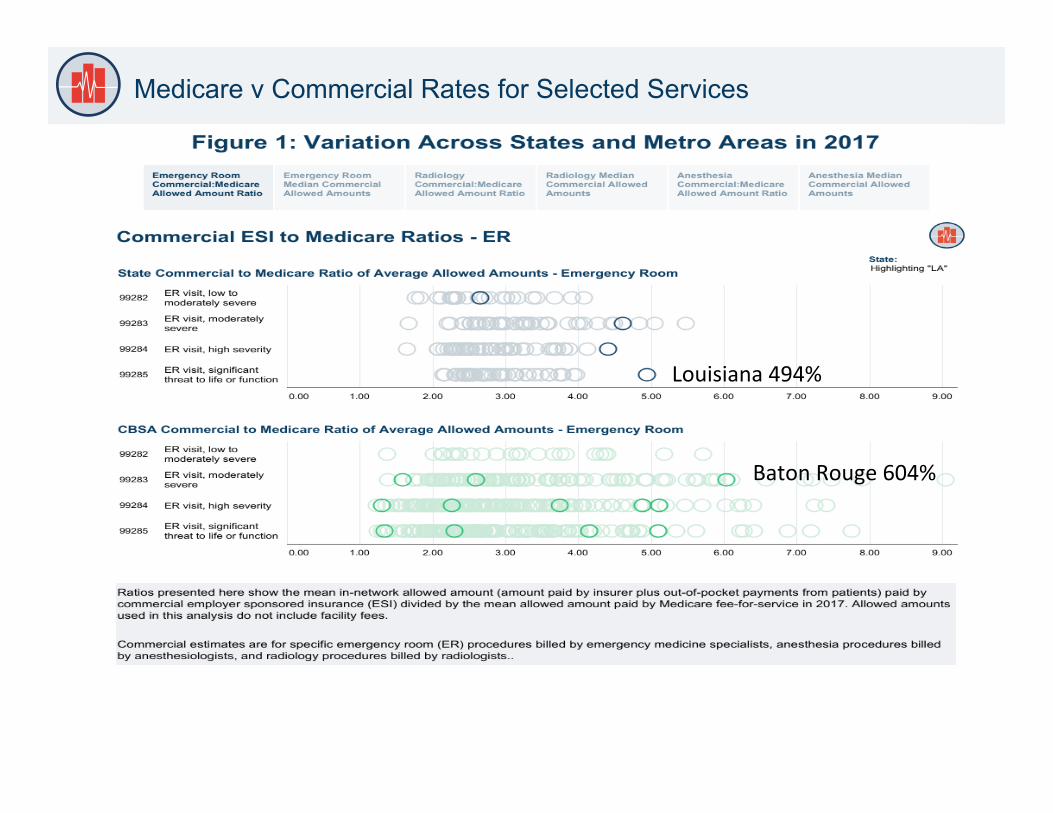
Medicare v Commercial Rates for Selected Services
BatonRouge604%
Louisiana494%
38
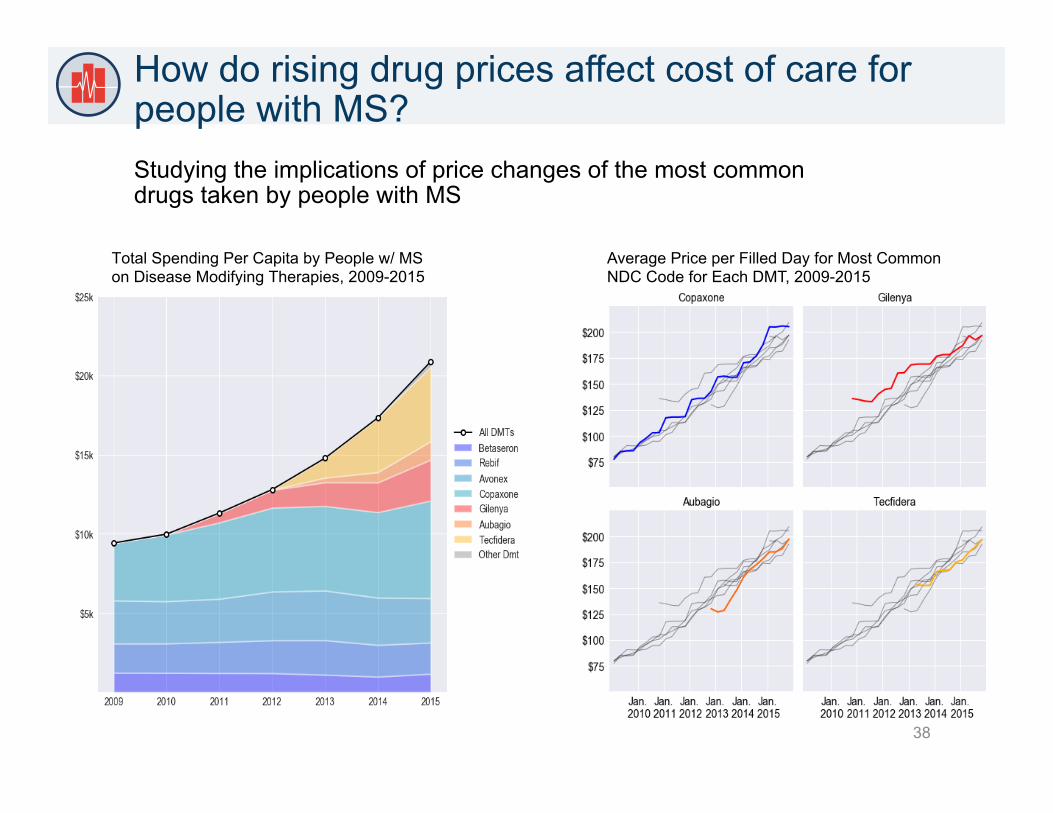
Studying the implications of price changes of the most common drugs taken by people with MS
Total Spending Per Capita by People w/ MS on Disease Modifying Therapies, 2009-2015
Average Price per Filled Day for Most Common NDC Code for Each DMT, 2009-2015
How do rising drug prices affect cost of care for people with MS?

39
Health care is the only sector of the American economy where you can lose market share and gain revenue
Recommended