ITEM ANALYSIS Ann Meredith Garcia, MD
What is item analysis? • Judging the quality of test items by examining the students’ responses
• Competent vs. less competent students?
• Difficulty of items?
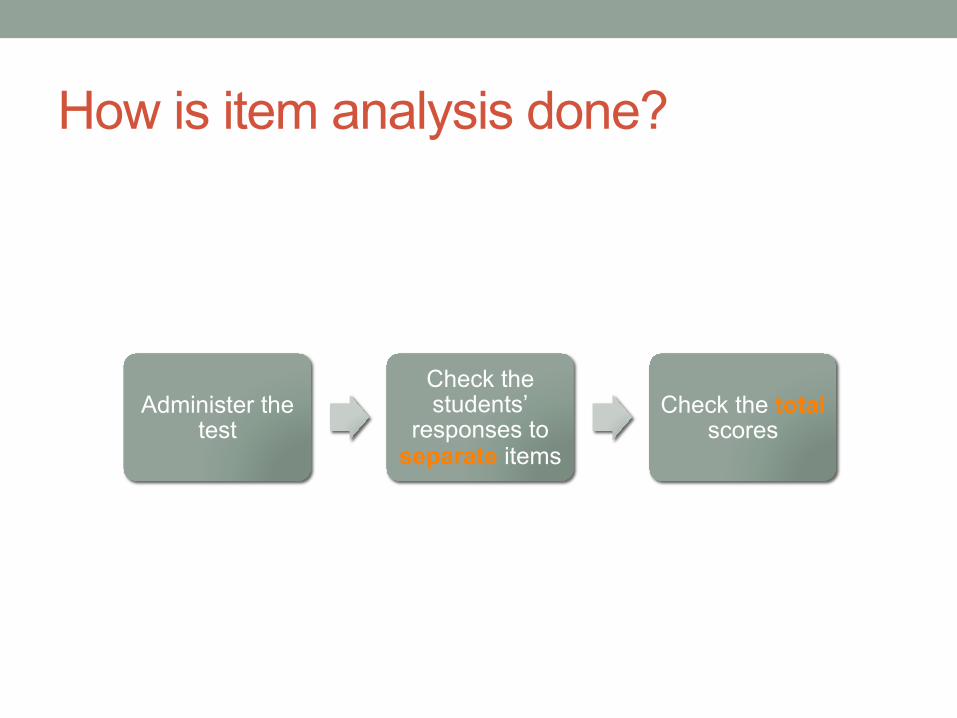
How is item analysis done?
Administer the test
Check the students’
responses to separate items
Check the total scores
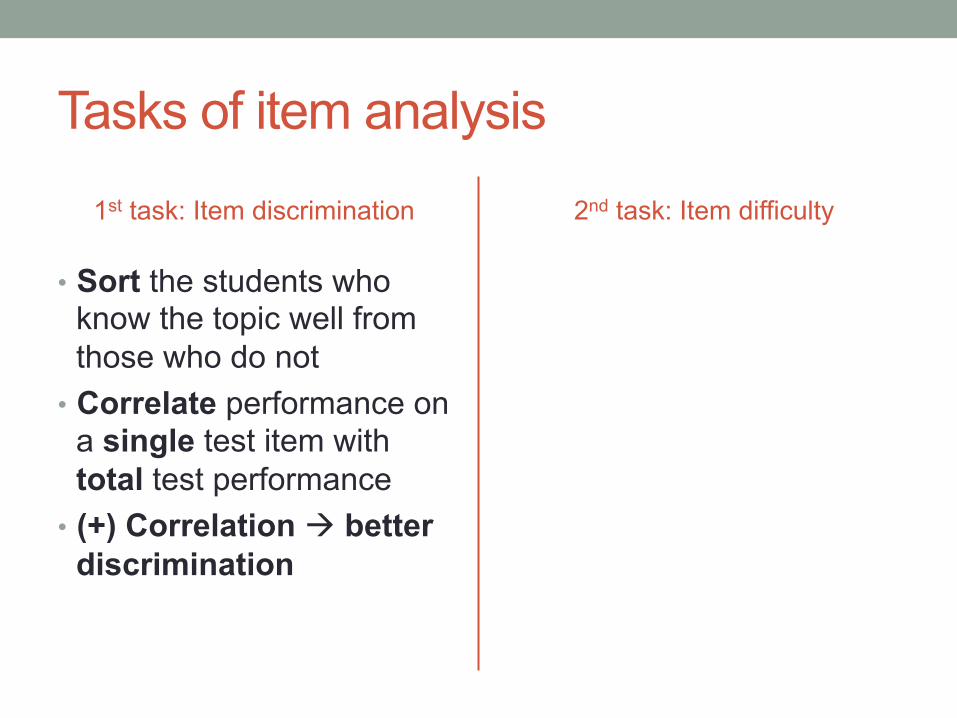
Tasks of item analysis
1st task: Item discrimination
• Sort the students who know the topic well from those who do not
• Correlate performance on a single test item with total test performance
• (+) Correlation à better discrimination
2nd task: Item difficulty
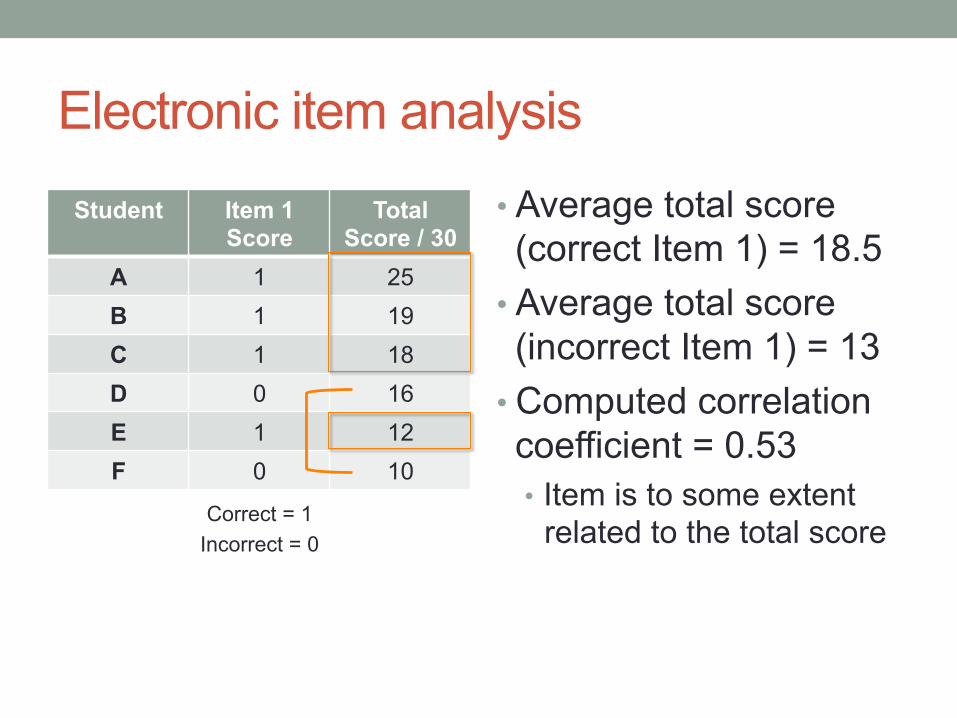
Electronic item analysis
Student Item 1 Score
Total Score / 30
A 1 25 B 1 19 C 1 18 D 0 16 E 1 12 F 0 10
• Average total score (correct Item 1) = 18.5
• Average total score (incorrect Item 1) = 13
• Computed correlation coefficient = 0.53 • Item is to some extent
related to the total score Correct = 1
Incorrect = 0
Electronic item analysis
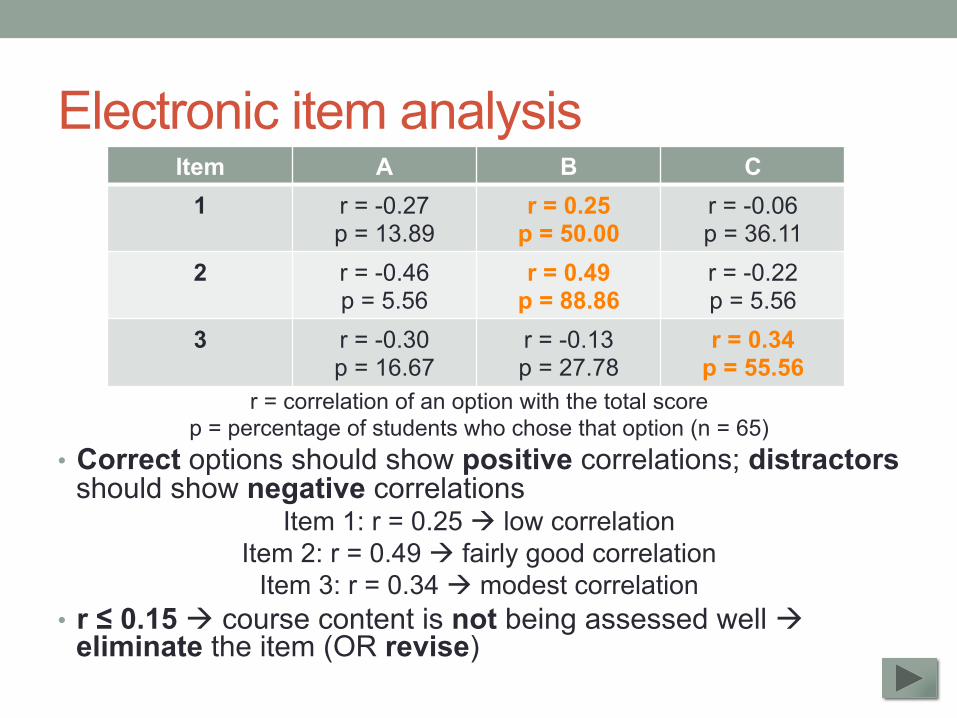
r = correlation of an option with the total score p = percentage of students who chose that option (n = 65)
• Correct options should show positive correlations; distractors should show negative correlations
Item 1: r = 0.25 à low correlation Item 2: r = 0.49 à fairly good correlation
Item 3: r = 0.34 à modest correlation • r ≤ 0.15 à course content is not being assessed well à
eliminate the item (OR revise)
Item A B C 1 r = -0.27
p = 13.89 r = 0.25
p = 50.00 r = -0.06 p = 36.11
2 r = -0.46 p = 5.56
r = 0.49 p = 88.86
r = -0.22 p = 5.56
3 r = -0.30 p = 16.67
r = -0.13 p = 27.78
r = 0.34 p = 55.56
Electronic item analysis
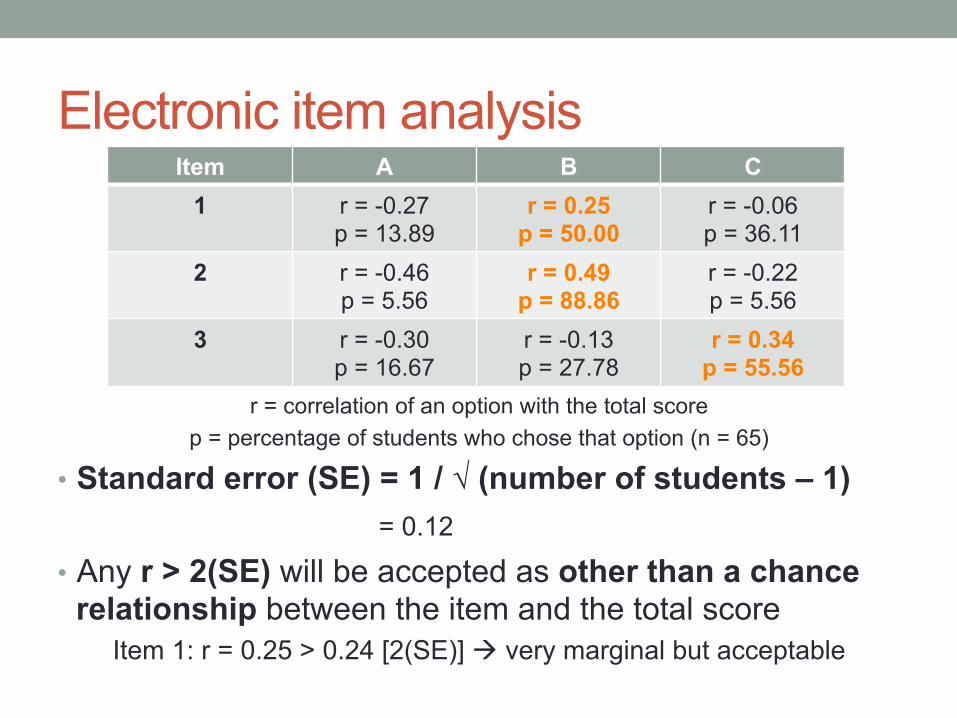
r = correlation of an option with the total score p = percentage of students who chose that option (n = 65)
• Standard error (SE) = 1 / √ (number of students – 1) = 0.12
• Any r > 2(SE) will be accepted as other than a chance relationship between the item and the total score
Item 1: r = 0.25 > 0.24 [2(SE)] à very marginal but acceptable
Item A B C 1 r = -0.27
p = 13.89 r = 0.25
p = 50.00 r = -0.06 p = 36.11
2 r = -0.46 p = 5.56
r = 0.49 p = 88.86
r = -0.22 p = 5.56
3 r = -0.30 p = 16.67
r = -0.13 p = 27.78
r = 0.34 p = 55.56
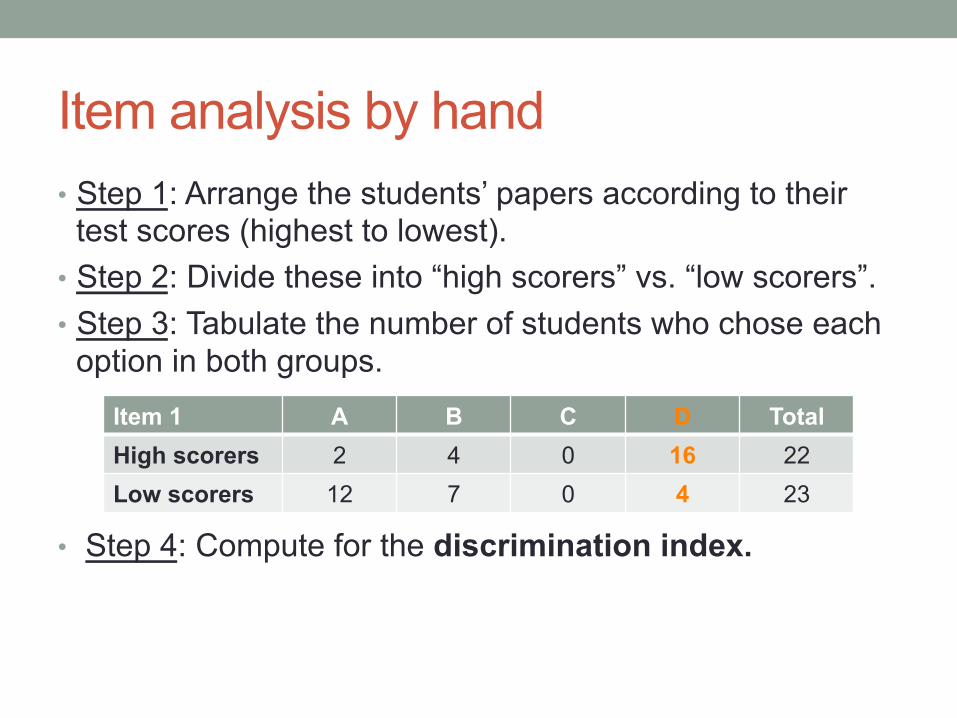
Item analysis by hand • Step 1: Arrange the students’ papers according to their
test scores (highest to lowest). • Step 2: Divide these into “high scorers” vs. “low scorers”. • Step 3: Tabulate the number of students who chose each
option in both groups.
• Step 4: Compute for the discrimination index.
Item 1 A B C D Total High scorers 2 4 0 16 22 Low scorers 12 7 0 4 23
Item analysis by hand
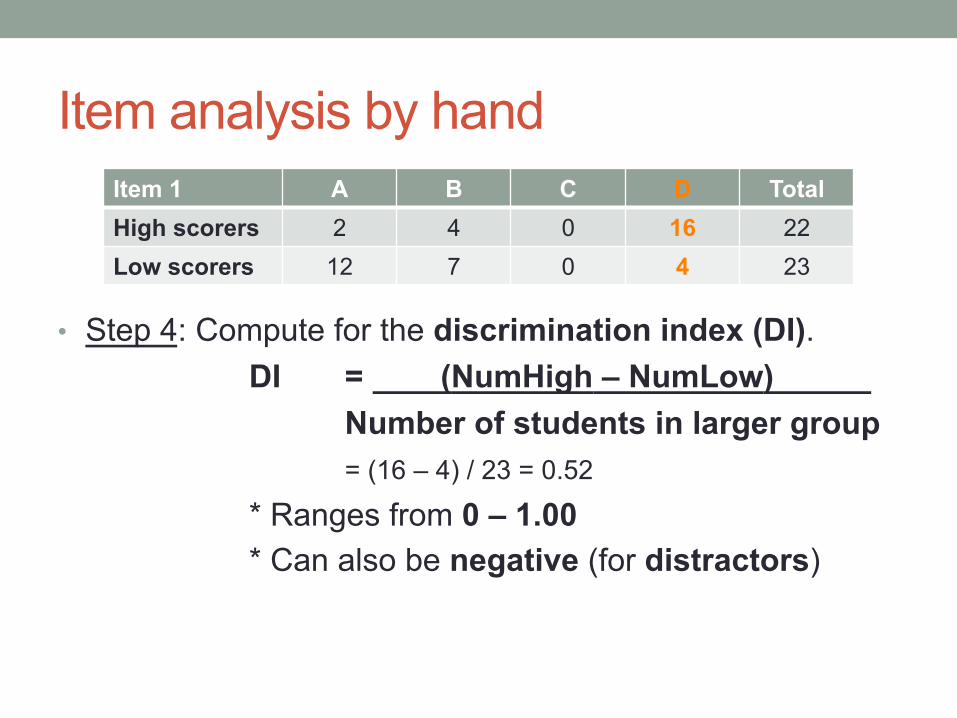
• Step 4: Compute for the discrimination index (DI).
DI = (NumHigh – NumLow) x Number of students in larger group = (16 – 4) / 23 = 0.52
* Ranges from 0 – 1.00 * Can also be negative (for distractors)
Item 1 A B C D Total High scorers 2 4 0 16 22 Low scorers 12 7 0 4 23
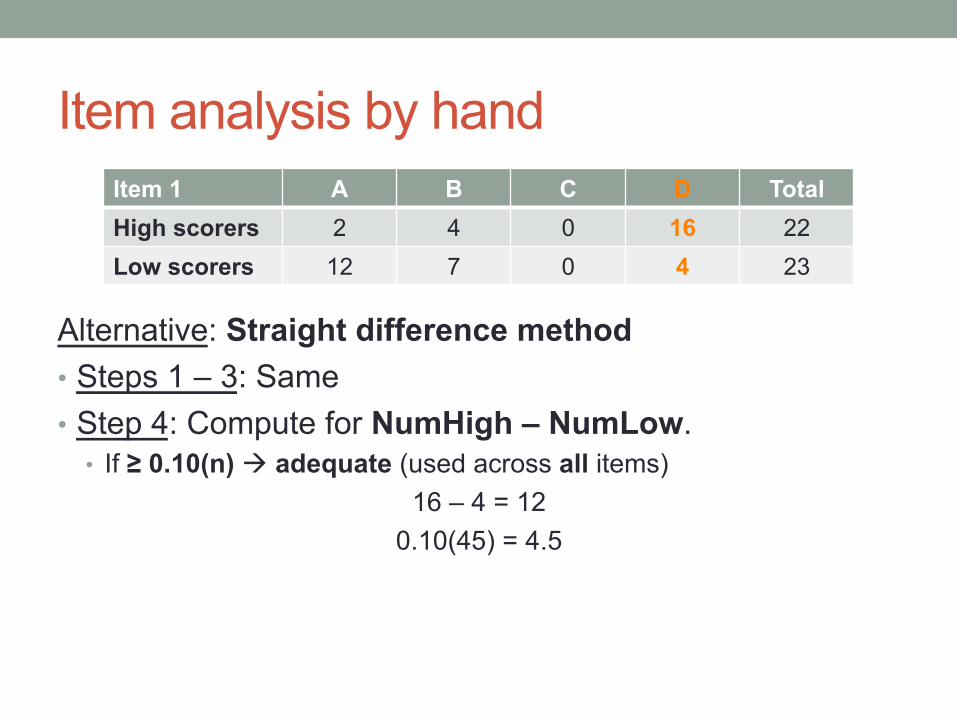
Item analysis by hand
Alternative: Straight difference method • Steps 1 – 3: Same • Step 4: Compute for NumHigh – NumLow.
• If ≥ 0.10(n) à adequate (used across all items) 16 – 4 = 12
0.10(45) = 4.5
Item 1 A B C D Total High scorers 2 4 0 16 22 Low scorers 12 7 0 4 23
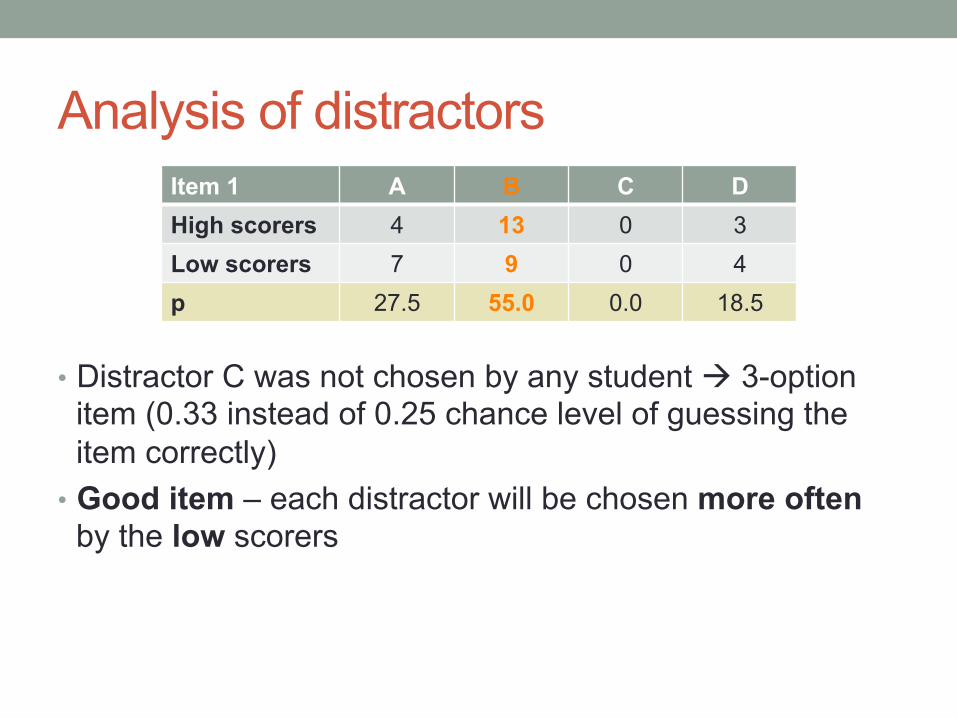
Analysis of distractors
• Distractor C was not chosen by any student à 3-option item (0.33 instead of 0.25 chance level of guessing the item correctly)
• Good item – each distractor will be chosen more often by the low scorers
Item 1 A B C D High scorers 4 13 0 3 Low scorers 7 9 0 4 p 27.5 55.0 0.0 18.5
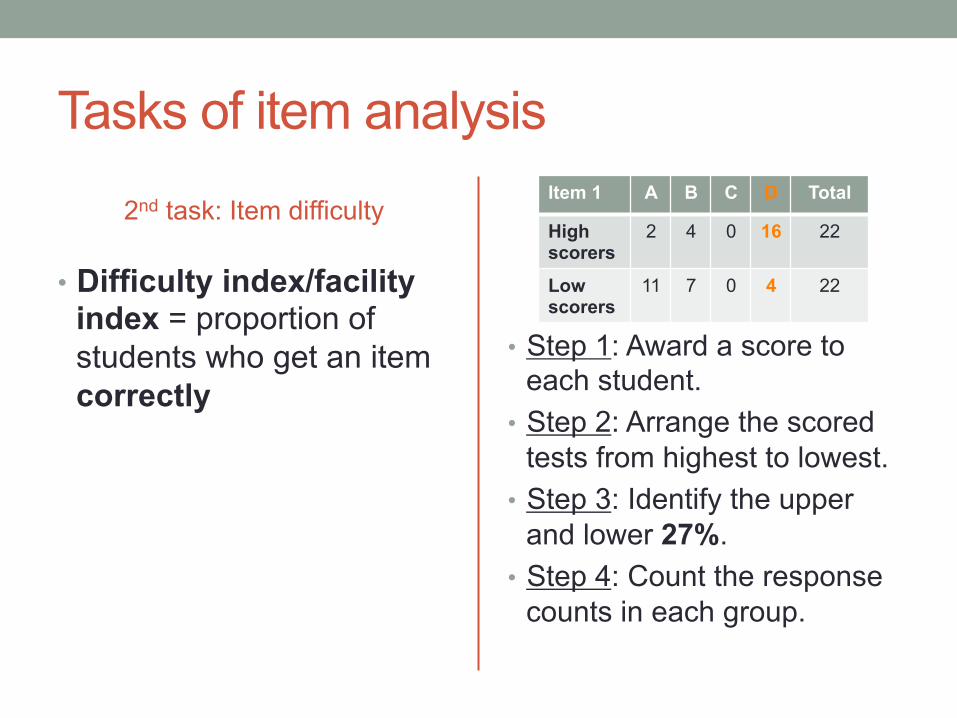
Tasks of item analysis
2nd task: Item difficulty
• Difficulty index/facility index = proportion of students who get an item correctly
• Step 1: Award a score to each student.
• Step 2: Arrange the scored tests from highest to lowest.
• Step 3: Identify the upper and lower 27%.
• Step 4: Count the response counts in each group.
Item 1 A B C D Total
High scorers
2 4 0 16 22
Low scorers
11 7 0 4 22
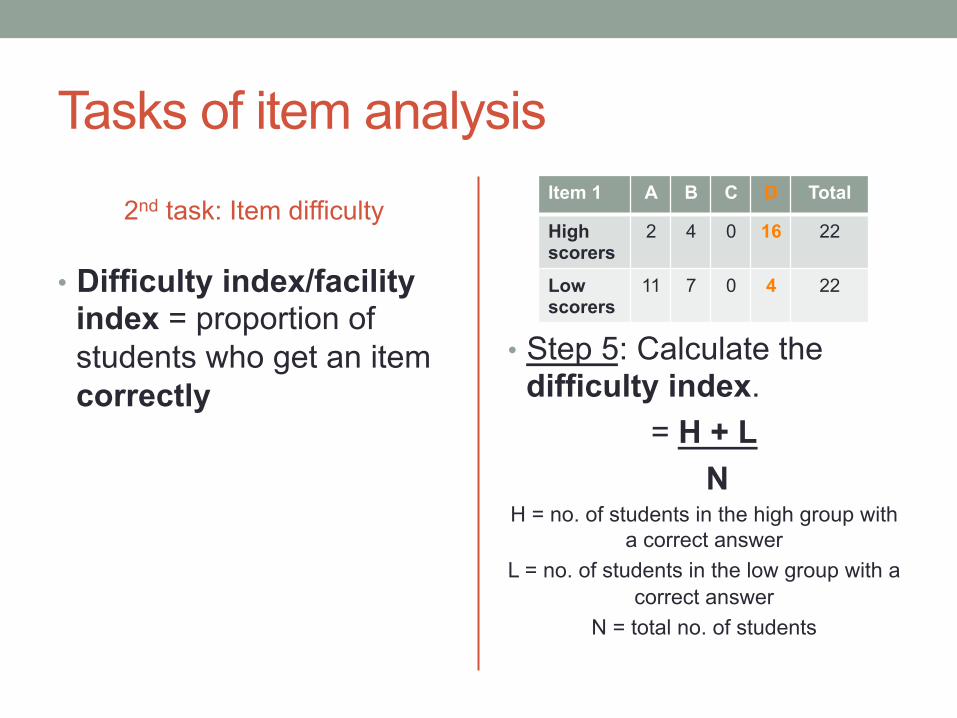
Tasks of item analysis
2nd task: Item difficulty
• Difficulty index/facility index = proportion of students who get an item correctly
• Step 5: Calculate the difficulty index.
= H + L N
H = no. of students in the high group with a correct answer
L = no. of students in the low group with a correct answer
N = total no. of students
Item 1 A B C D Total
High scorers
2 4 0 16 22
Low scorers
11 7 0 4 22
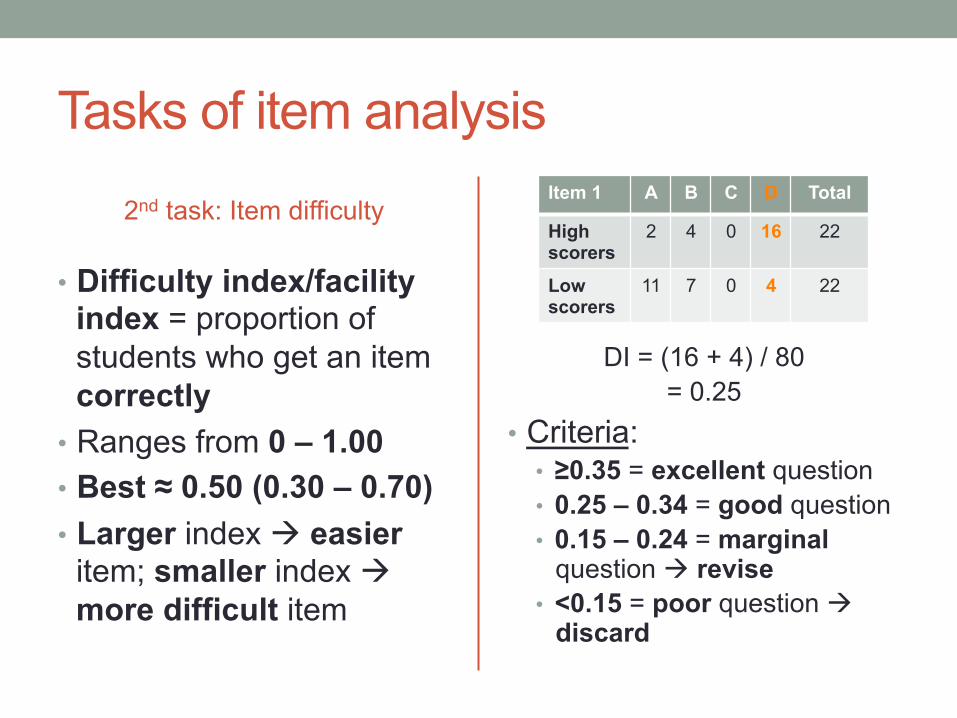
Tasks of item analysis
2nd task: Item difficulty
• Difficulty index/facility index = proportion of students who get an item correctly
• Ranges from 0 – 1.00 • Best ≈ 0.50 (0.30 – 0.70) • Larger index à easier
item; smaller index à more difficult item
DI = (16 + 4) / 80
= 0.25 • Criteria:
• ≥0.35 = excellent question • 0.25 – 0.34 = good question • 0.15 – 0.24 = marginal
question à revise • <0.15 = poor question à
discard
Item 1 A B C D Total
High scorers
2 4 0 16 22
Low scorers
11 7 0 4 22
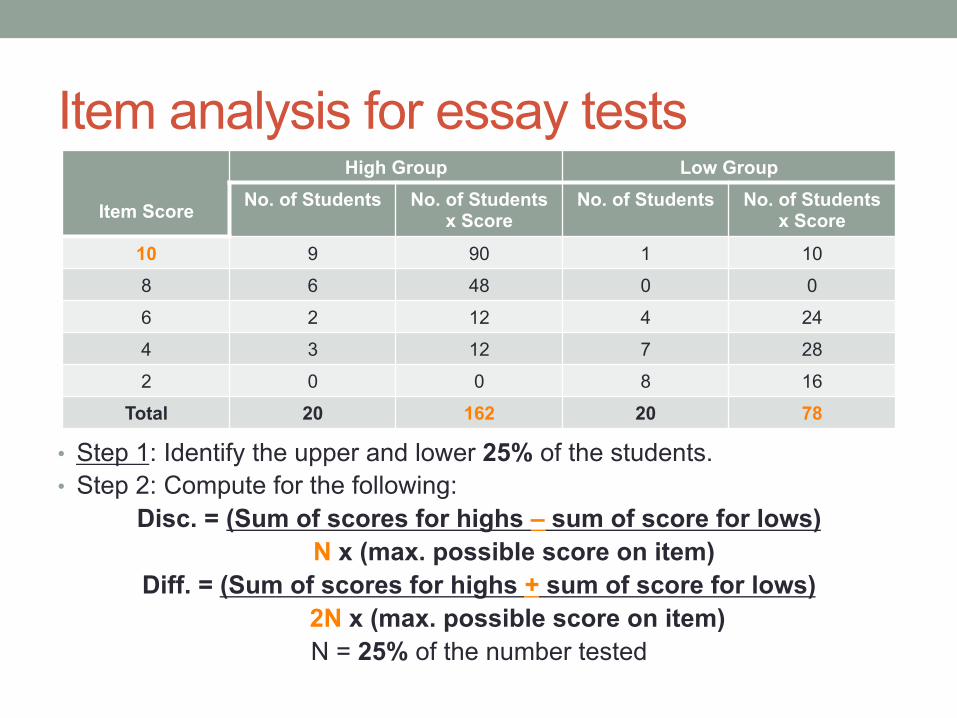
Item analysis for essay tests
• Step 1: Identify the upper and lower 25% of the students. • Step 2: Compute for the following:
Disc. = (Sum of scores for highs – sum of score for lows) N x (max. possible score on item)
Diff. = (Sum of scores for highs + sum of score for lows) 2N x (max. possible score on item) N = 25% of the number tested
Item Score
High Group Low Group No. of Students No. of Students
x Score No. of Students No. of Students
x Score
10 9 90 1 10
8 6 48 0 0
6 2 12 4 24
4 3 12 7 28
2 0 0 8 16
Total 20 162 20 78
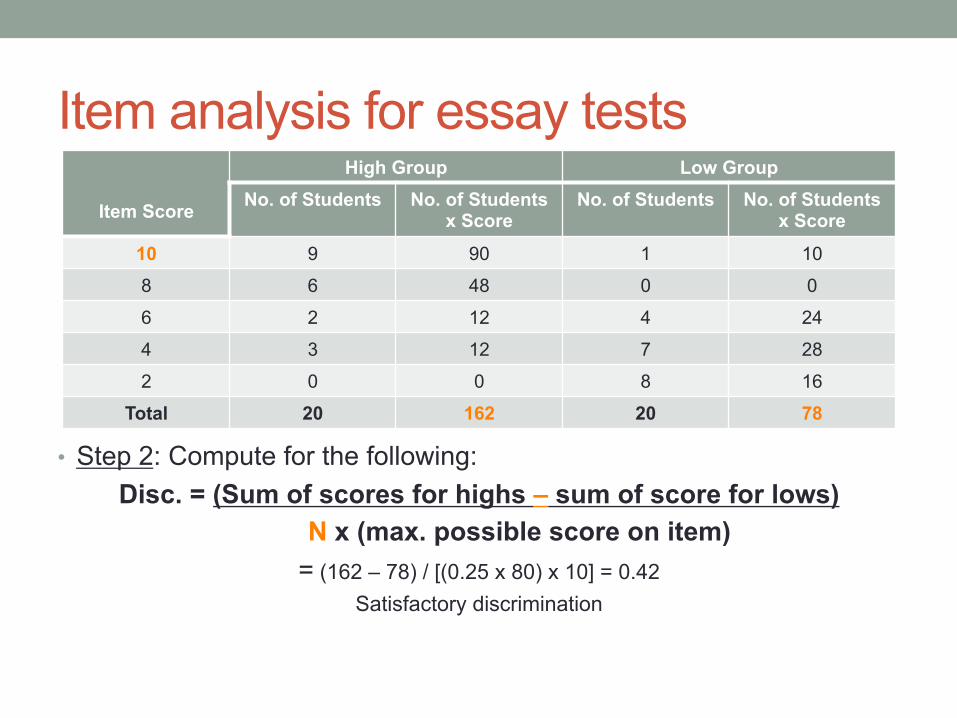
Item analysis for essay tests
• Step 2: Compute for the following: Disc. = (Sum of scores for highs – sum of score for lows)
N x (max. possible score on item) = (162 – 78) / [(0.25 x 80) x 10] = 0.42
Satisfactory discrimination
Item Score
High Group Low Group No. of Students No. of Students
x Score No. of Students No. of Students
x Score
10 9 90 1 10
8 6 48 0 0
6 2 12 4 24
4 3 12 7 28
2 0 0 8 16
Total 20 162 20 78
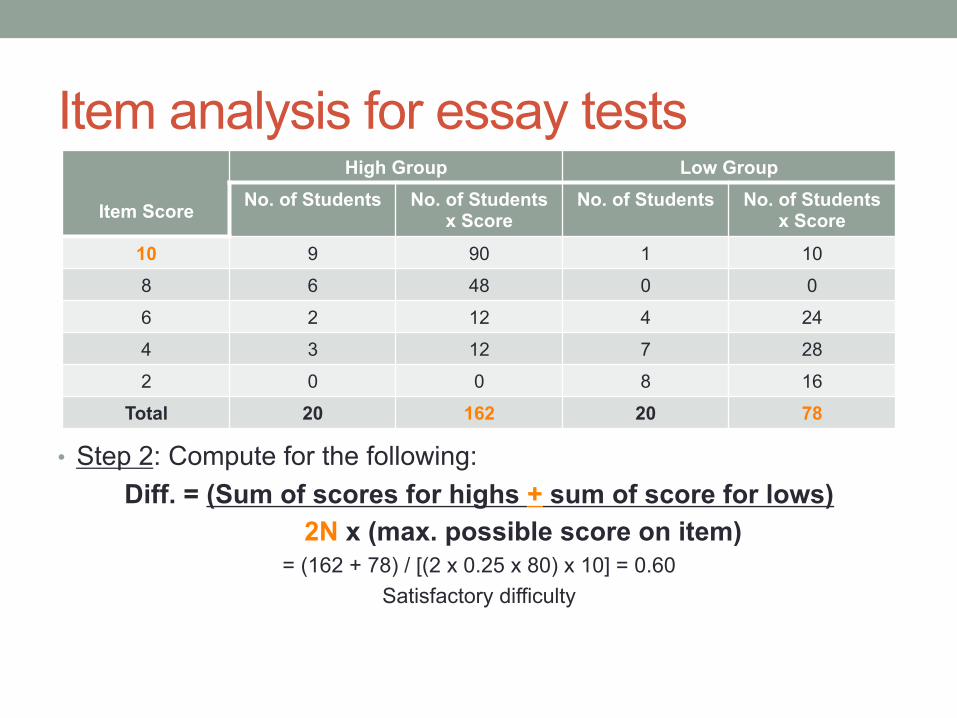
Item analysis for essay tests
• Step 2: Compute for the following: Diff. = (Sum of scores for highs + sum of score for lows)
2N x (max. possible score on item) = (162 + 78) / [(2 x 0.25 x 80) x 10] = 0.60
Satisfactory difficulty
Item Score
High Group Low Group No. of Students No. of Students
x Score No. of Students No. of Students
x Score
10 9 90 1 10
8 6 48 0 0
6 2 12 4 24
4 3 12 7 28
2 0 0 8 16
Total 20 162 20 78
Item response theory and item analysis • Calculates the odds of getting an item right à converts
this number to a natural logarithm • Allows faculty to equate the item difficulty scale on one
test to the scale of another test and across different student groups
• Useful system for building item banks

Thank you! J
Recommended