Issues in the Comparison of Issues in the Comparison of Welfare Between EuropeWelfare Between Europe
and the United Statesand the United States
Robert J. GordonRobert J. GordonNAPW IV Conference,NAPW IV Conference,
NYU Stern School, New York CityNYU Stern School, New York CityKeynote Speech, June 28, 2006Keynote Speech, June 28, 2006

22
What are the Substantive What are the Substantive Issues?Issues?
““Why is Europe so Productive yet so Poor?”Why is Europe so Productive yet so Poor?” If Y/H caught up but Y/N languished, then the If Y/H caught up but Y/N languished, then the
superficial Answer is H/N has been fallingsuperficial Answer is H/N has been falling Why?Why?
– Blanchard (Blanchard (JEP, JEP, p. 4): “The main difference is p. 4): “The main difference is that Europe has used some of the increase in that Europe has used some of the increase in productivity to increase leisure rather than productivity to increase leisure rather than income, while the United States has done the income, while the United States has done the opposite.” opposite.”
Blanchard will be the straw man in this Blanchard will be the straw man in this discussion of more subtle interpretationsdiscussion of more subtle interpretations
33
Outline of the PaperOutline of the Paper Interpretation of falling Interpretation of falling relativerelative hours per hours per
capita in Europe vs. U. S.capita in Europe vs. U. S.– Major hypothesis: only a Major hypothesis: only a small portionsmall portion of of
falling relative hours per capita represents falling relative hours per capita represents welfare value of leisurewelfare value of leisure
– Addressing the current debatesAddressing the current debates Blanchard – it’s all the taste for leisure in EuropeBlanchard – it’s all the taste for leisure in Europe Prescott – taxes explain everythingPrescott – taxes explain everything Ljungvist-Sargent – welfare state is more importantLjungvist-Sargent – welfare state is more important Alesina – Politics and unionsAlesina – Politics and unions
An Independent Issue: Is GDP in US An Independent Issue: Is GDP in US overstated?overstated?
44
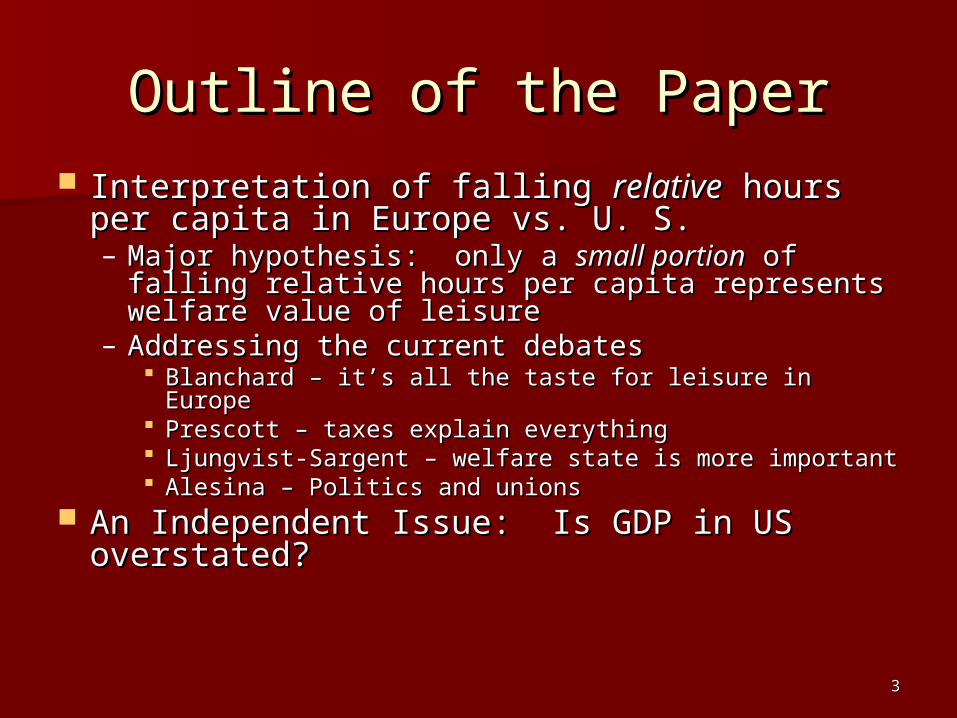
An Opposing ViewAn Opposing View
By definition the decline in Europe’s By definition the decline in Europe’s Y/N related to Y/H can be divided Y/N related to Y/H can be divided into:into:– Decline in relative H/E (35% 1960-95)Decline in relative H/E (35% 1960-95)– Decline in relative E/N (65% 1960-95)Decline in relative E/N (65% 1960-95)
Voluntary Leisure?Voluntary Leisure?– Some of decline in H/E is not voluntarySome of decline in H/E is not voluntary– Most of decline in E/N is not voluntaryMost of decline in E/N is not voluntary

55
Part #1: Part #1: What are the Data Issues?What are the Data Issues?
How to Compare Europe GDP vs. US GDPHow to Compare Europe GDP vs. US GDP Thanks to Peter Neary AER Dec 2004:Thanks to Peter Neary AER Dec 2004:
– Geary vs. EKS vs. “QUAIDS”Geary vs. EKS vs. “QUAIDS” Alternative methods of converting Ypc to Alternative methods of converting Ypc to
international PPPinternational PPP– Maddison and PWT use Geary-KhamisMaddison and PWT use Geary-Khamis– OECD and Eurostat use EKS (Eltetö, Köves, and OECD and Eurostat use EKS (Eltetö, Köves, and
Szulc), a multilateral extension of Fisher Szulc), a multilateral extension of Fisher “ideal”“ideal”
– Groningen web site gives bothGroningen web site gives both

66
An Operational ProcedureAn Operational Procedure
My calculations from Neary for EU-15 / US My calculations from Neary for EU-15 / US 19801980– Neary preferred QUAIDS = 74.3Neary preferred QUAIDS = 74.3– GK 71.4, EKS 77.5GK 71.4, EKS 77.5– Average Groningen GK and EKS = 74.4Average Groningen GK and EKS = 74.4
Hence all charts from here on use average Hence all charts from here on use average of GK & EKSof GK & EKS
This applies only to GDP, not to This applies only to GDP, not to population, hours, employment, labor population, hours, employment, labor forceforce

77
Other Data IssuesOther Data Issues
Hedonic Price Indexes: Data Hedonic Price Indexes: Data Noncomparable?Noncomparable?
Studies for Germany show difference Studies for Germany show difference in AAGR productivity of ~0.2in AAGR productivity of ~0.2
Some EU countries use hedonics for Some EU countries use hedonics for computers so overall EU difference computers so overall EU difference would be lesswould be less– Groningen data use US price computer Groningen data use US price computer
price deflators for all European countriesprice deflators for all European countries

88
A Preview of A Preview of ALL THESE ALL THESE SLIDESSLIDES
Slides of Europe vs. U. S., 1820-2004 for Slides of Europe vs. U. S., 1820-2004 for Y/N, 1870-2004 for Y/HY/N, 1870-2004 for Y/H
Maddison through 1950, ratio-linked to Maddison through 1950, ratio-linked to Groningen 1950+, average GK and EKSGroningen 1950+, average GK and EKS– Maddison piecewise loglinear trends. Years for Maddison piecewise loglinear trends. Years for
Y/N: 1820, 1870, 1913, 1923, 1929, 1941, Y/N: 1820, 1870, 1913, 1923, 1929, 1941, 19501950
– Y/H 1870, 1913, 1929, 1938, 1950Y/H 1870, 1913, 1929, 1938, 1950 Each slide, a wide angle back to the start, Each slide, a wide angle back to the start,
then a “close-up” 1960-2004then a “close-up” 1960-2004 Ratios, then Ratios of RatiosRatios, then Ratios of Ratios

99
The Broad Sweep of 2 The Broad Sweep of 2 Centuries:Centuries:
Income per CapitaIncome per Capita
1000
10000
100000
1820 1830 1840 1850 1860 1870 1880 1890 1900 1910 1920 1930 1940 1950 1960 1970 1980 1990 2000
Europe - 15
United States

1010
Since 1960: Europe Fails Since 1960: Europe Fails to Converge and then Falls to Converge and then Falls
BehindBehind
1000
6000
11000
16000
21000
26000
31000
36000
1960 1965 1970 1975 1980 1985 1990 1995 2000
Europe - 15
United States

1111
Productivity since 1870:Productivity since 1870:Almost Catching Up is Not Almost Catching Up is Not
EnoughEnough
1
10
100
1870 1880 1890 1900 1910 1920 1930 1940 1950 1960 1970 1980 1990 2000
Europe - 15
United States

1212
Productivity Post-1960:Productivity Post-1960:The Ratio Reaches 96.9% in The Ratio Reaches 96.9% in
19951995
0
5
10
15
20
25
30
35
40
45
1960 1965 1970 1975 1980 1985 1990 1995 2000
Europe - 15
United States

1313
The Europe / US Ratios The Europe / US Ratios Are Much More DramaticAre Much More Dramatic
0
20
40
60
80
100
120
1820 1830 1840 1850 1860 1870 1880 1890 1900 1910 1920 1930 1940 1950 1960 1970 1980 1990 2000
Output per hourOutput per capita
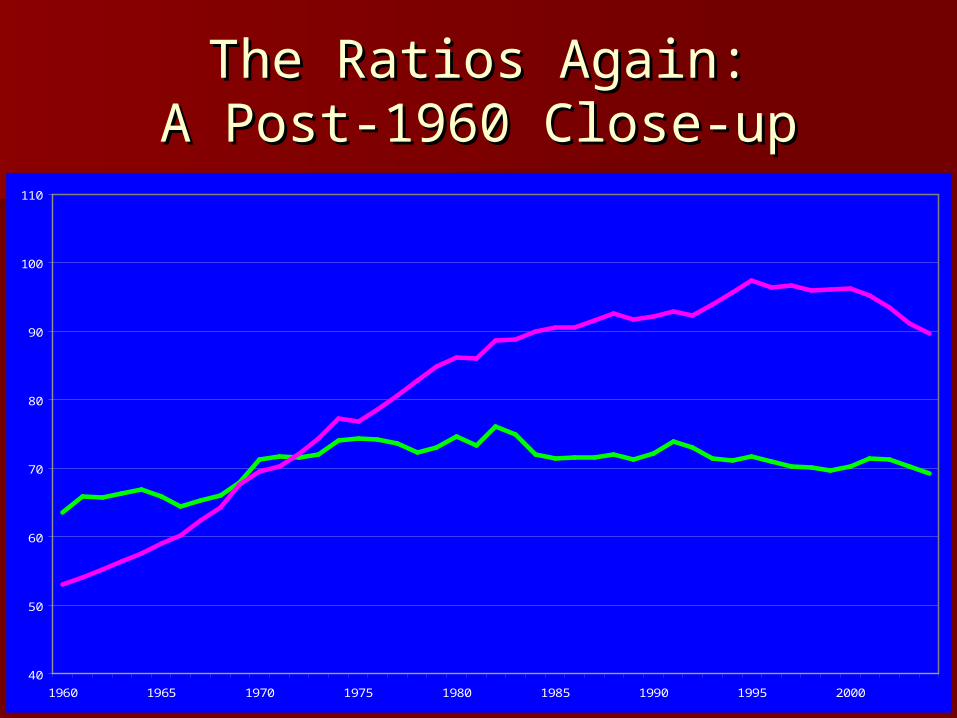
1414
The Ratios Again:The Ratios Again:A Post-1960 Close-upA Post-1960 Close-up
40
50
60
70
80
90
100
110
1960 1965 1970 1975 1980 1985 1990 1995 2000
Output per hour
Output per capita
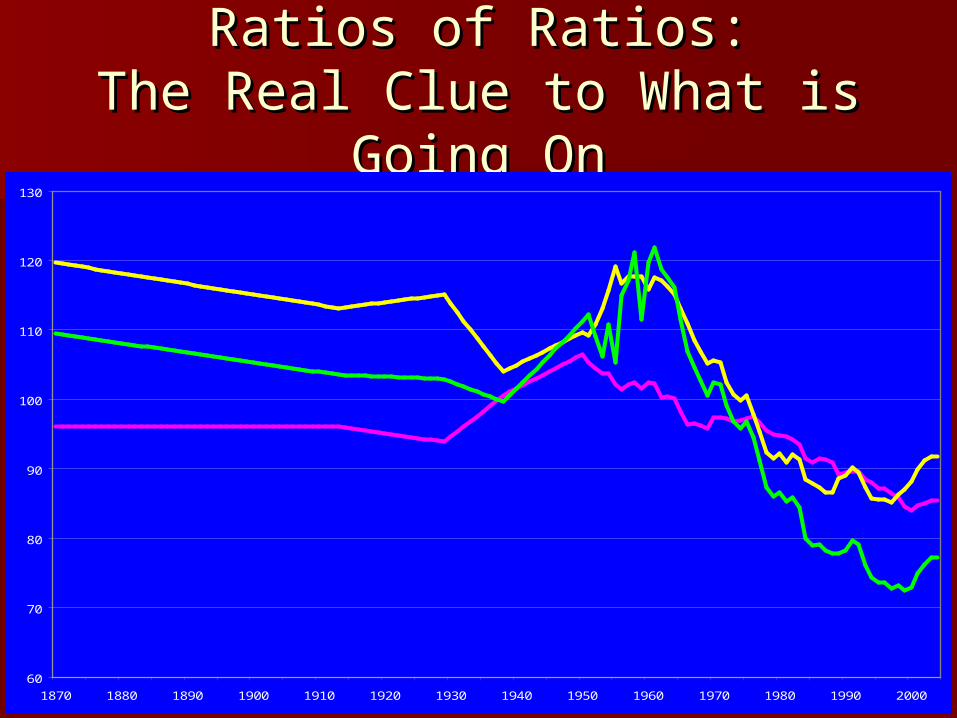
1515
Ratios of Ratios:Ratios of Ratios:The Real Clue to What is Going The Real Clue to What is Going
OnOn
60
70
80
90
100
110
120
130
1870 1880 1890 1900 1910 1920 1930 1940 1950 1960 1970 1980 1990 2000
Hours per employee
Employee to population ratio
Output per capita tooutput per hour ratio

1616
Ratios of Ratios: Ratios of Ratios: The Post-1960 Close-upThe Post-1960 Close-up
60
70
80
90
100
110
120
130
1960 1965 1970 1975 1980 1985 1990 1995 2000
Hours per employee
Employee to population ratio
Output per capita tooutput per hour ratio
1717
What the RecentWhat the RecentMacro AnnualMacro Annual Debate has Debate has
MissedMissed The EU/US Ratio for Employment-The EU/US Ratio for Employment-
Population turned around in 1995Population turned around in 1995 Why?Why?
– A reversal of labor market regulations?A reversal of labor market regulations?– A reversal of product market regulations?A reversal of product market regulations?– A reversal of labor taxes?A reversal of labor taxes?
But the decline in hours/employee did But the decline in hours/employee did not turn aroundnot turn around

1818
Hours per Employee Declined Hours per Employee Declined in Tandem until 1970, then in Tandem until 1970, then
divergeddiverged
0
500
1000
1500
2000
2500
3000
3500
1870 1880 1890 1900 1910 1920 1930 1940 1950 1960 1970 1980 1990 2000
Europe - 15
United States
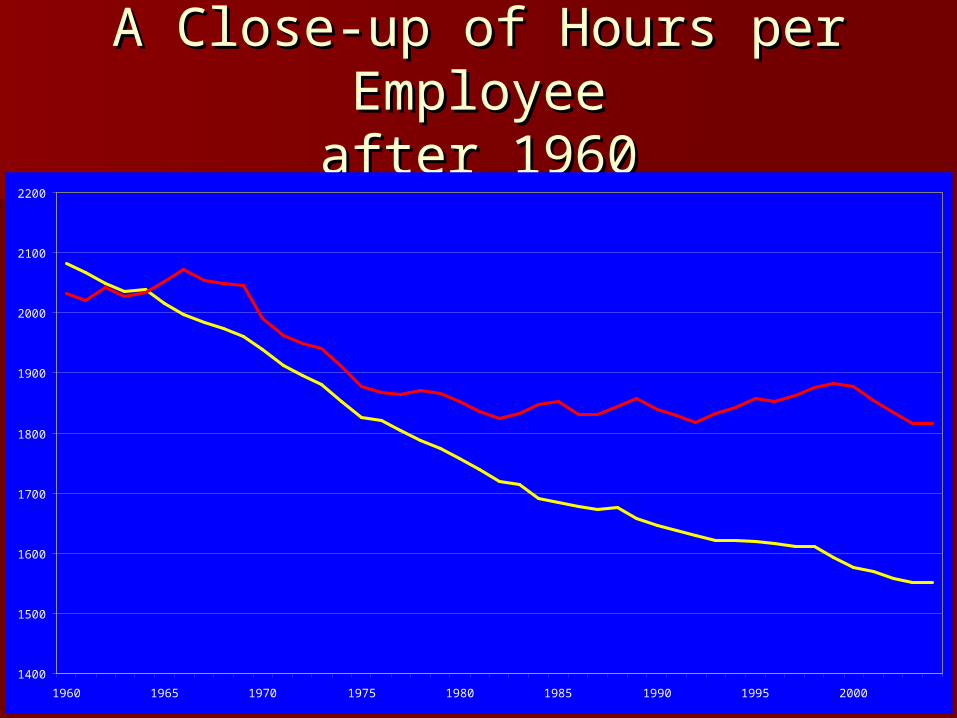
1919
A Close-up of Hours per A Close-up of Hours per EmployeeEmployeeafter 1960after 1960
1400
1500
1600
1700
1800
1900
2000
2100
2200
1960 1965 1970 1975 1980 1985 1990 1995 2000
Europe - 15
United States

2020
Employment per CapitaEmployment per Capitaback to 1870back to 1870
30%
35%
40%
45%
50%
55%
1870 1880 1890 1900 1910 1920 1930 1940 1950 1960 1970 1980 1990 2000
Europe - 15
United States

2121
Employment per Capita after Employment per Capita after 1960:1960:
U.S. Women and Teens U.S. Women and Teens Marched Off to Work 1965-Marched Off to Work 1965-
19901990
30%
35%
40%
45%
50%
55%
1960 1965 1970 1975 1980 1985 1990 1995 2000
Europe - 15
United States

2222
Summary of Turnaround inSummary of Turnaround inE/N vs. H/EE/N vs. H/E
Table 1
Levels and Growth Rates of Three Ratios of Europe to the United States, 1960-2004, percent
Hours Hours Employees
per Capita per Employee per Capita
1960 119.8 102.4 115.9
1970 102.4 97.4 105.6
1995 73.6 87.1 85.7
2004 77.2 85.4 91.7
Annual
Growth Rates
1960-70 -1.6 -0.5 -0.9
1970-95 -1.3 -0.4 -0.8
1995-2004 0.5 -0.2 0.8

2323
An Outline of Issues for An Outline of Issues for DiscussionDiscussion
Europe’s failure to converge is not just a Europe’s failure to converge is not just a matter of voluntary vacationsmatter of voluntary vacations
Much more of the change 1960-95 was the Much more of the change 1960-95 was the decline in employment per capitadecline in employment per capita
Even lower hours are not entirely voluntaryEven lower hours are not entirely voluntary– ““If the French really wanted to work only 35 If the French really wanted to work only 35
hours, why do they need the hours police?”hours, why do they need the hours police?” Alesina: Alesina:
Short hours are a victory for unions and parliamentary Short hours are a victory for unions and parliamentary politics, not for free choicepolitics, not for free choice
So is early retirement, a major source of falling E/NSo is early retirement, a major source of falling E/N
2424
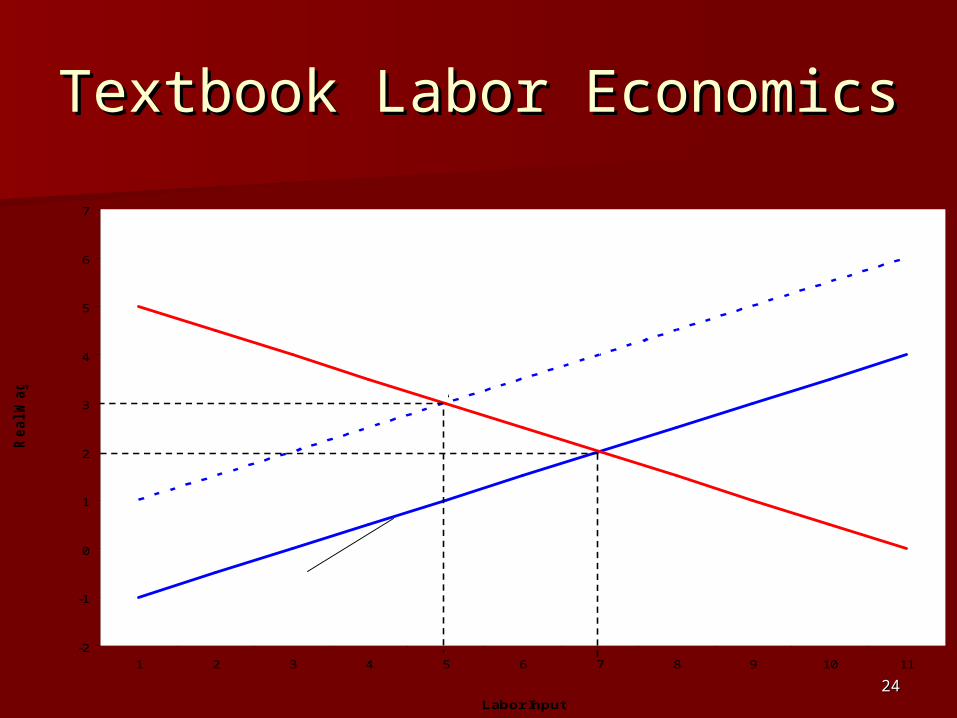
Textbook Labor EconomicsTextbook Labor Economics
-2
-1
0
1
2
3
4
5
6
7
1 2 3 4 5 6 7 8 9 10 11
Labor Input
Re
al W
ag
e
Labor Demand Curve
High-Cost LaborSupply Curve
Low-Cost LaborSupply Curve
(W/P)0
(W/P)1
N0 N1
Downward shift in labor supply curve reduces real wage and productivity
A
B

2525
Welfare Valuation of LeisureWelfare Valuation of Leisure
Work time is chosen to equate marginal Work time is chosen to equate marginal utility of leisure to after-tax wageutility of leisure to after-tax wage
Diminishing marginal utility of leisureDiminishing marginal utility of leisure– Infra-marginal leisure valued > wageInfra-marginal leisure valued > wage– Extra-marginal leisure valued < wageExtra-marginal leisure valued < wage
Back-of-envelope. Back-of-envelope. – Value weekday and weekend leisure of both Value weekday and weekend leisure of both
workers and retired = 4/3 after-tax wageworkers and retired = 4/3 after-tax wage– Value hours switched from work to retirement Value hours switched from work to retirement
= 2/3 after-tax wage= 2/3 after-tax wage

2626
What Matters for Welfare is Y/NWhat Matters for Welfare is Y/N + Differential Leisure, not Y/H + Differential Leisure, not Y/H
Europeans have “bought” their high Europeans have “bought” their high productivity ratio with every productivity ratio with every conceivable way of making labor conceivable way of making labor expensiveexpensive– High marginal tax rates (payroll and High marginal tax rates (payroll and
income taxes)income taxes)– Firing restrictionsFiring restrictions– Early retirement (55! 58!) with pensions Early retirement (55! 58!) with pensions
paid for by working peoplepaid for by working people– Lack of encouragement of market Lack of encouragement of market
involvement by teens and youthinvolvement by teens and youth
2727
The Decline in Europe’s E/N The Decline in Europe’s E/N Matters more than H/EMatters more than H/E
First, which age groups are suffering First, which age groups are suffering from higher unemployment in Europe?from higher unemployment in Europe?
Second, which age groups experience Second, which age groups experience lower labor force participation in Europe?lower labor force participation in Europe?
Third, how does it come together in the Third, how does it come together in the distribution of low E/N by age group?distribution of low E/N by age group?
Note: These graphs are for total Note: These graphs are for total population by age and blur male/female population by age and blur male/female differences.differences.

2828
Unemployment by Age:Unemployment by Age:EU vs. USEU vs. US
0
5
10
15
20
25
15-19 20-24 25-29 30-34 35-39 40-44 45-49 50-54 55-59 60-64 65-69 70-74
2929
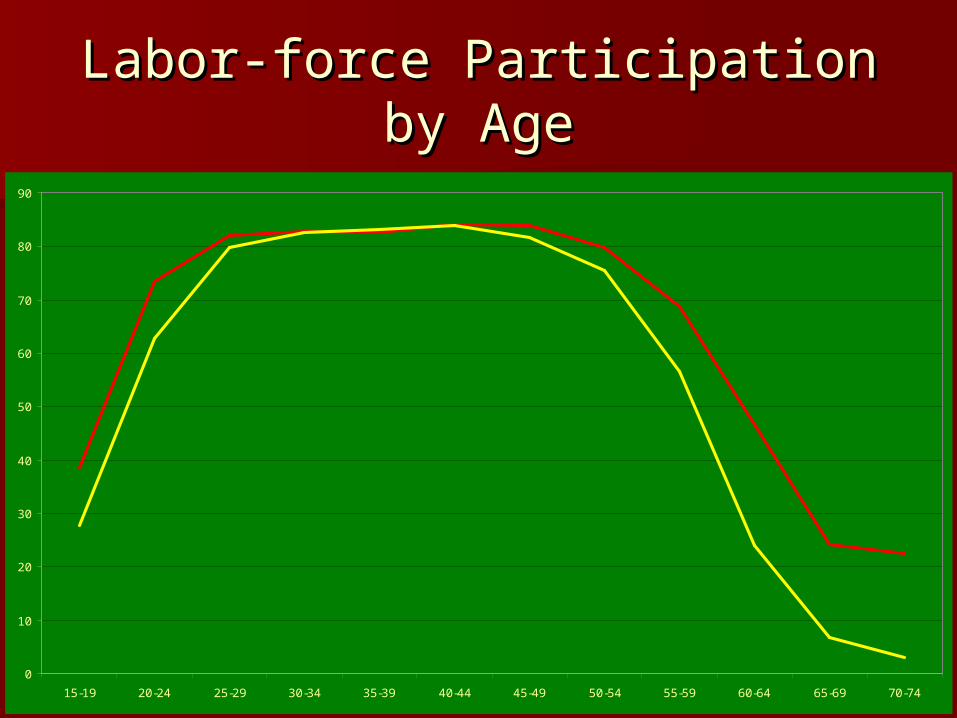
Labor-force ParticipationLabor-force Participationby Ageby Age
0
10
20
30
40
50
60
70
80
90
15-19 20-24 25-29 30-34 35-39 40-44 45-49 50-54 55-59 60-64 65-69 70-74

3030
Putting it Together:Putting it Together:Europe vs. US E/N by Age Europe vs. US E/N by Age
GroupGroup
0
10
20
30
40
50
60
70
80
90
15-19 20-24 25-29 30-34 35-39 40-44 45-49 50-54 55-59 60-64 65-69 70-74
3131
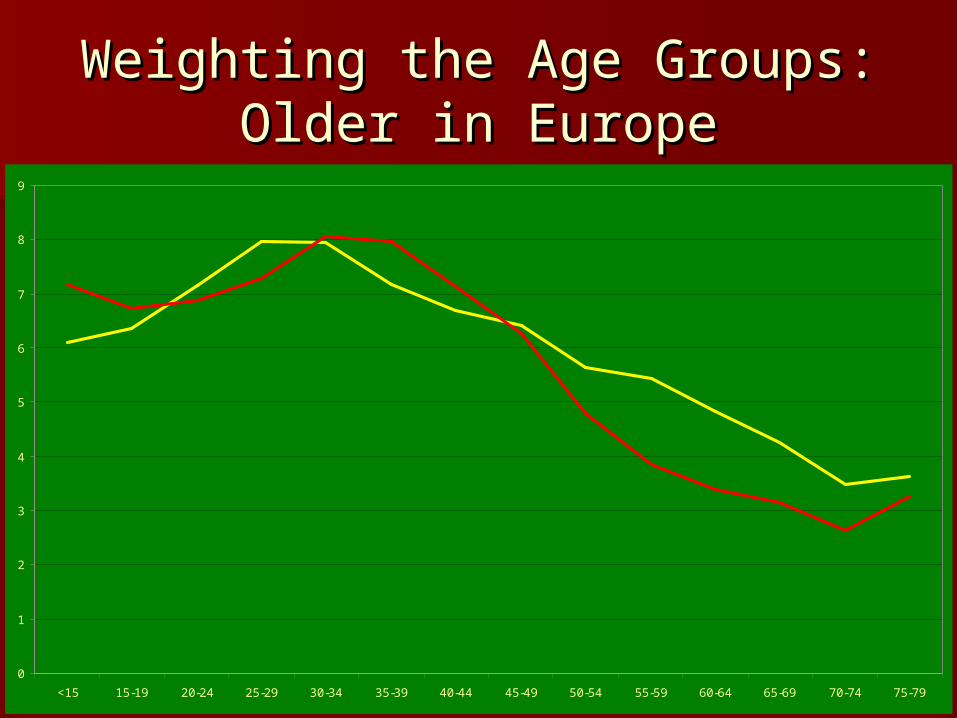
Weighting the Age Groups:Weighting the Age Groups:Older in EuropeOlder in Europe
0
1
2
3
4
5
6
7
8
9
<15 15-19 20-24 25-29 30-34 35-39 40-44 45-49 50-54 55-59 60-64 65-69 70-74 75-79
3232
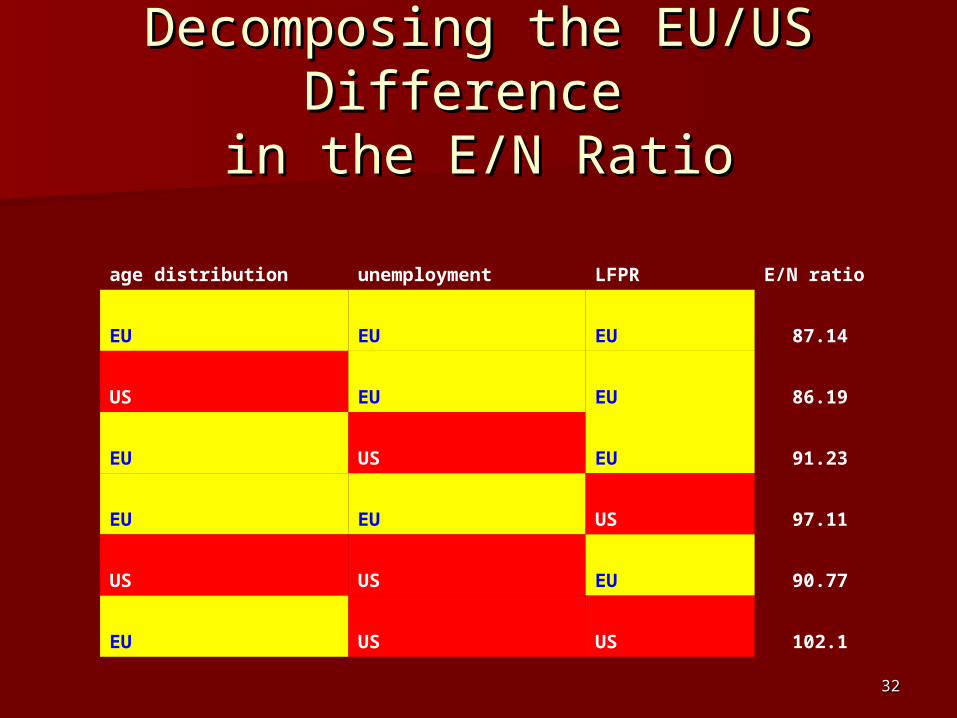
Decomposing the EU/US Decomposing the EU/US Difference Difference
in the E/N Ratioin the E/N Ratio
age distribution unemployment LFPR E/N ratio
EU EU EU 87.14
US EU EU 86.19
EU US EU 91.23
EU EU US 97.11
US US EU 90.77
EU US US 102.1

3333
Big Issues: Low LFPR of OldBig Issues: Low LFPR of Oldand low E/N of Youngand low E/N of Young
About the old, why have European About the old, why have European state-supported pension plans state-supported pension plans encouraged early retirement (age 58 in encouraged early retirement (age 58 in France and NL)?France and NL)?
Alesina (2006) cites this as a prime Alesina (2006) cites this as a prime example of the work-sharing philosophy example of the work-sharing philosophy of unions and European leftist partiesof unions and European leftist parties
Unions and leftists also responsible for Unions and leftists also responsible for long vacations and short work weeks, long vacations and short work weeks, esp. in Franceesp. in France
3434
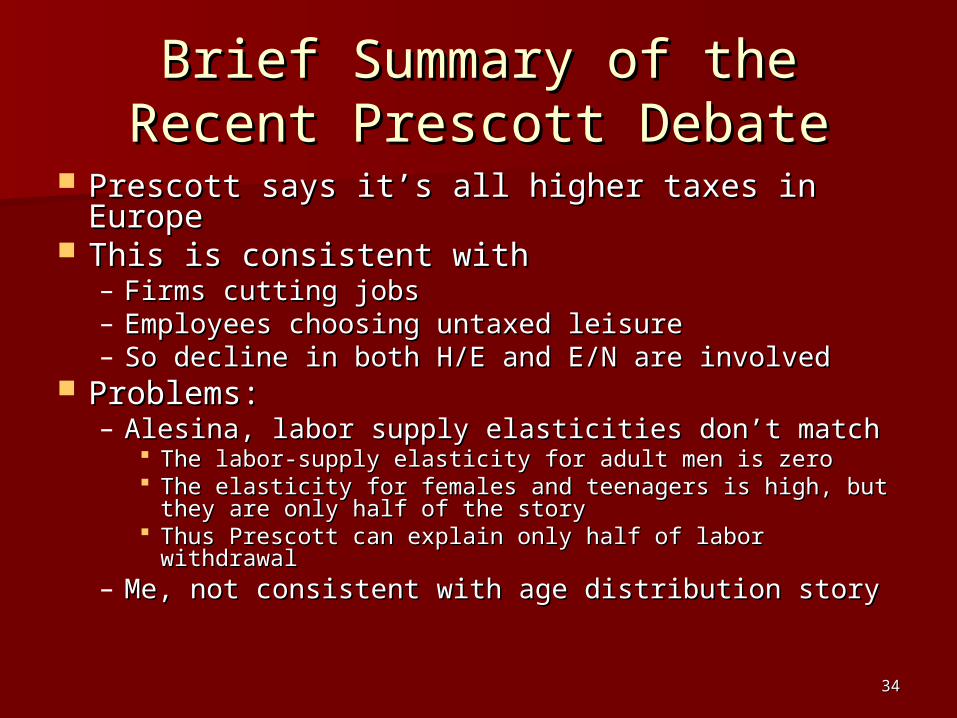
Brief Summary of theBrief Summary of theRecent Prescott DebateRecent Prescott Debate
Prescott says it’s all higher taxes in EuropePrescott says it’s all higher taxes in Europe This is consistent with This is consistent with
– Firms cutting jobsFirms cutting jobs– Employees choosing untaxed leisureEmployees choosing untaxed leisure– So decline in both H/E and E/N are involvedSo decline in both H/E and E/N are involved
Problems:Problems:– Alesina, labor supply elasticities don’t matchAlesina, labor supply elasticities don’t match
The labor-supply elasticity for adult men is zeroThe labor-supply elasticity for adult men is zero The elasticity for females and teenagers is high, but The elasticity for females and teenagers is high, but
they are only half of the storythey are only half of the story Thus Prescott can explain only half of labor Thus Prescott can explain only half of labor
withdrawalwithdrawal– Me, not consistent with age distribution storyMe, not consistent with age distribution story

3535
Ljungqvist-Sargent’s Ljungqvist-Sargent’s skepticismskepticism
on the “national family”on the “national family” Prescott assumes national family, Prescott assumes national family,
voluntary redistribution to those who voluntary redistribution to those who withdraw labor because of high taxeswithdraw labor because of high taxes
In reality most of those who withdraw In reality most of those who withdraw labor supply because of high taxes are not labor supply because of high taxes are not supported by voluntary family transferssupported by voluntary family transfers
Are supported by government transfer Are supported by government transfer payments that “strain social insurance payments that “strain social insurance systems”; “government expenditures were systems”; “government expenditures were poor substitutes for private consumption”poor substitutes for private consumption”

3636
Alesina on UnionsAlesina on Unionsand Regulationand Regulation
Contrast between U. S. and EUContrast between U. S. and EU U. S. union penetration peaked in late U. S. union penetration peaked in late
30s, 1940s, declined after 1950s30s, 1940s, declined after 1950s Europe peaked in late 1970s, early Europe peaked in late 1970s, early
1980s1980s No disagreement about what unions No disagreement about what unions
do to the labor supply and demand do to the labor supply and demand diagramsdiagrams– Unions push the economy northwestUnions push the economy northwest
3737
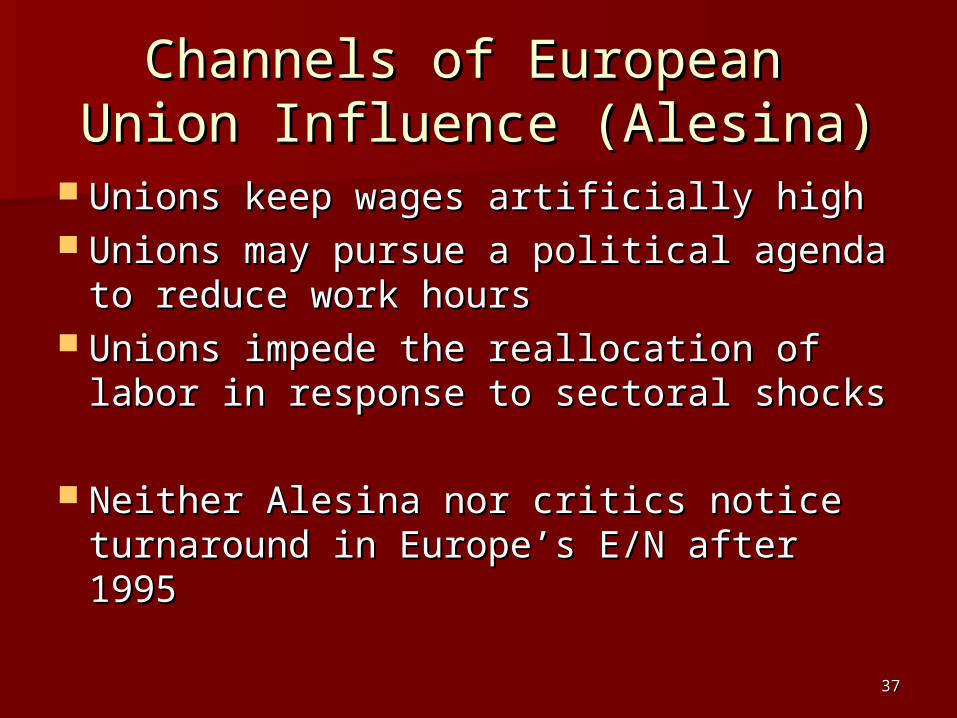
Channels of European Channels of European Union Influence (Alesina)Union Influence (Alesina)
Unions keep wages artificially highUnions keep wages artificially high Unions may pursue a political agenda Unions may pursue a political agenda
to reduce work hoursto reduce work hours Unions impede the reallocation of Unions impede the reallocation of
labor in response to sectoral shockslabor in response to sectoral shocks
Neither Alesina nor critics notice Neither Alesina nor critics notice turnaround in Europe’s E/N after 1995turnaround in Europe’s E/N after 1995

3838
Alesina Examples of Union Alesina Examples of Union PowerPower
Reducing hours per week and raising Reducing hours per week and raising wage per hourwage per hour
Examples of defending “the welfare Examples of defending “the welfare state and public pension systems”state and public pension systems”
Pushing Early RetirementPushing Early Retirement– In GeneralIn General– As a solution to plant closingsAs a solution to plant closings

3939
Critique of Modern MacroCritique of Modern MacroInterpretationsInterpretations
About Alesina, timing is wrong. Union About Alesina, timing is wrong. Union density increased 1960-80, but then density increased 1960-80, but then fell to 1995 to about the same level as fell to 1995 to about the same level as 19601960
This argument from Rogerson (2006) This argument from Rogerson (2006) ignores inertia in political processignores inertia in political process
None of theories have provided an None of theories have provided an explanation of the EU post-1995 explanation of the EU post-1995 turnaround in E/Nturnaround in E/N

4040
A Broader View:A Broader View:The Welfare Cost of HigherThe Welfare Cost of Higher
UnemploymentUnemployment
The distinction between marginal hours The distinction between marginal hours of leisure (40 work, 80 leisure) vs. of leisure (40 work, 80 leisure) vs. inframarginal hours (20 work, 100 inframarginal hours (20 work, 100 leisure)leisure)
Gordon (1973) distinction temporary Gordon (1973) distinction temporary vs. permanent increase in Uvs. permanent increase in U– Output loss 2.7 vs. 2.3 for temporary caseOutput loss 2.7 vs. 2.3 for temporary case– Output loss 0.7 for permanent case Output loss 0.7 for permanent case

4141
The Welfare Effect of EarlyThe Welfare Effect of EarlyRetirement: Back-of-EnvelopeRetirement: Back-of-Envelope
Baseline: work age 20-65, retire 65-84Baseline: work age 20-65, retire 65-84 No saving, investmentNo saving, investment 30% tax finances pay-as-you-go pensions 30% tax finances pay-as-you-go pensions
with balanced govt budgetwith balanced govt budget– Tax finances equality of consumption in Tax finances equality of consumption in
retirement to consumption during work yearsretirement to consumption during work years Alternative retirement age at 55 requires Alternative retirement age at 55 requires
tax increase to 45.6%, 25.1% decline in tax increase to 45.6%, 25.1% decline in consumption during work years and consumption during work years and retirementretirement
4242
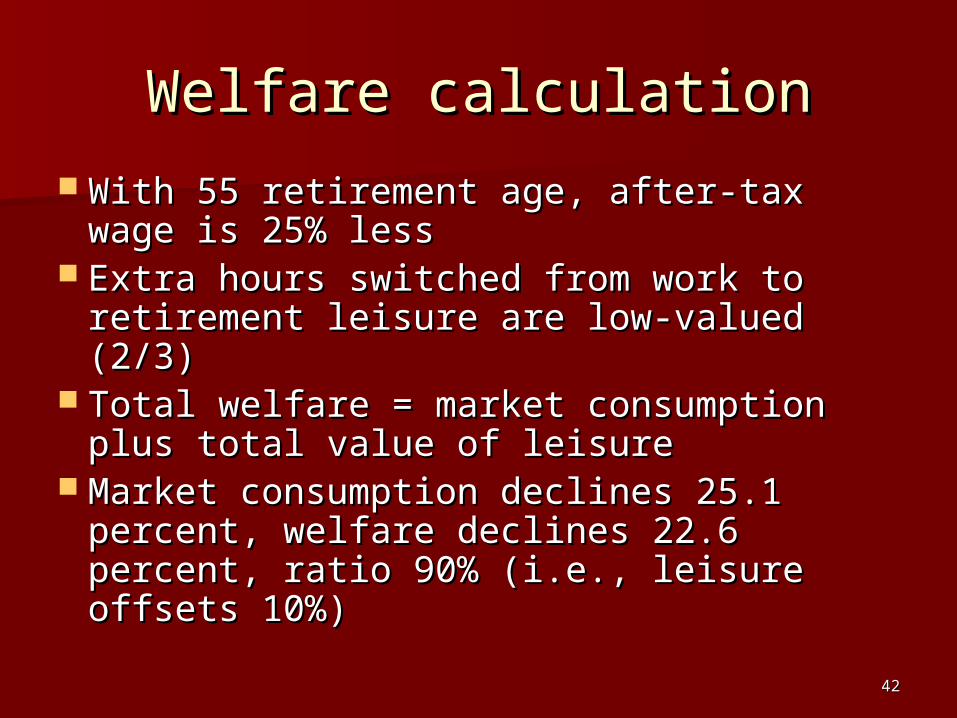
Welfare calculationWelfare calculation
With 55 retirement age, after-tax With 55 retirement age, after-tax wage is 25% lesswage is 25% less
Extra hours switched from work to Extra hours switched from work to retirement leisure are low-valued (2/3)retirement leisure are low-valued (2/3)
Total welfare = market consumption Total welfare = market consumption plus total value of leisure plus total value of leisure
Market consumption declines 25.1 Market consumption declines 25.1 percent, welfare declines 22.6 percent, welfare declines 22.6 percent, ratio 90% (i.e., leisure offsets percent, ratio 90% (i.e., leisure offsets 10%)10%)

4343
Time Allocation from Time Allocation from Freeman-SchettkatFreeman-Schettkat
Freeman average males & females, Freeman average males & females, workdayworkday
M=market, H=home production, M=market, H=home production, L=leisure, P=personal time (sleep)L=leisure, P=personal time (sleep)
I set P>9.0 as LeisureI set P>9.0 as Leisure
M H L PM H L P
Employed 8.0 2.5 4.5 9Employed 8.0 2.5 4.5 9
Unemployed 1.0 4.5 9.5 9Unemployed 1.0 4.5 9.5 9

4444
What’s Wrong with What’s Wrong with European Youth?European Youth?
Youth enter late into Market EmploymentYouth enter late into Market Employment If we are assessing extra European If we are assessing extra European
“leisure”, how much if any credit do we “leisure”, how much if any credit do we give to youth? give to youth? – Disconnected from the market economyDisconnected from the market economy– American youth are expected to workAmerican youth are expected to work
Link with government support of higher Link with government support of higher education: tuition grants in Europe vs. education: tuition grants in Europe vs. peer-reviewed research grants in US peer-reviewed research grants in US – Plus state university subsidiesPlus state university subsidies

4545
Turn the Tables on the U. S.:Turn the Tables on the U. S.:The “Disconnect” between The “Disconnect” between
Welfare and PPP-Adjusted GDPWelfare and PPP-Adjusted GDP
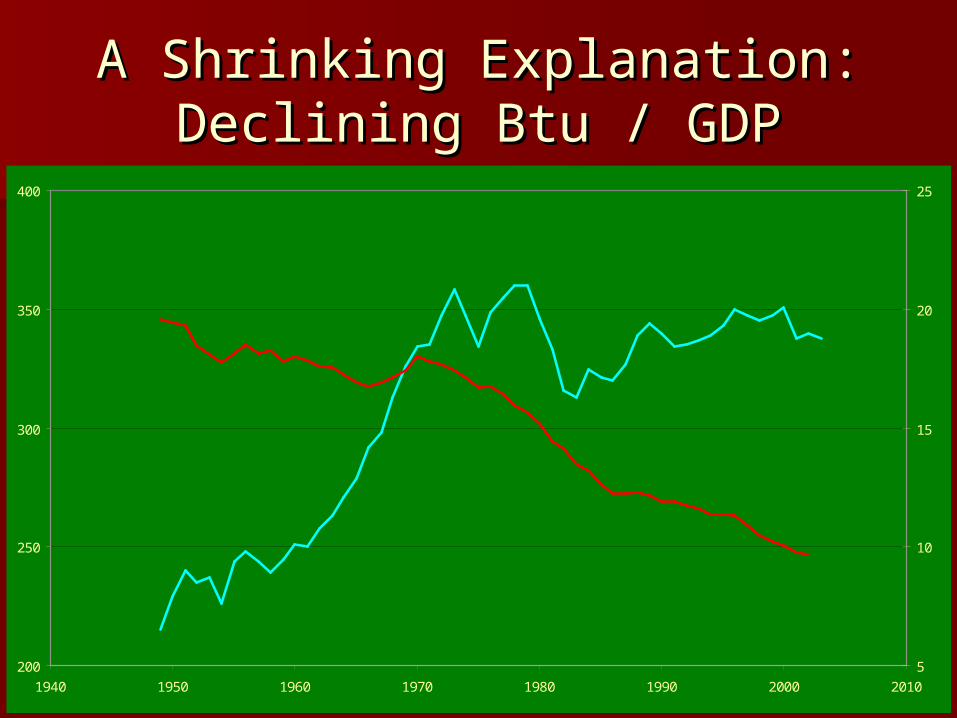
GDP Exaggerates U. S. GDP per CapitaGDP Exaggerates U. S. GDP per Capita– Extreme climate, lots of air conditioning, Extreme climate, lots of air conditioning,
low petrol prices, huge excess energy uselow petrol prices, huge excess energy use– U. S. urban sprawl: energy use, U. S. urban sprawl: energy use,
congestioncongestion– Crime, 2 million in prisonCrime, 2 million in prison– Insecurity, lack of employment protection, Insecurity, lack of employment protection,
lack of citizen’s right to medical carelack of citizen’s right to medical care How much is this worth?How much is this worth?
4646
A Shrinking Explanation:A Shrinking Explanation:Declining Btu / GDPDeclining Btu / GDP
200
250
300
350
400
1940 1950 1960 1970 1980 1990 2000 2010
5
10
15
20
25
Btu/GDP
Btu per capita
4747
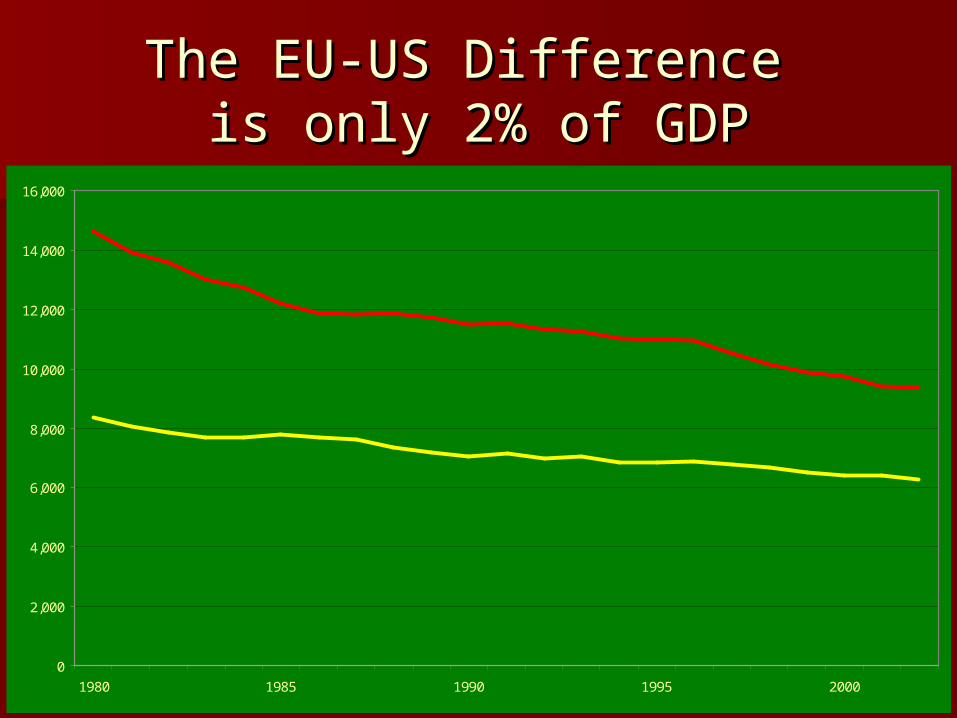
The EU-US Difference The EU-US Difference is only 2% of GDPis only 2% of GDP
0
2,000
4,000
6,000
8,000
10,000
12,000
14,000
16,000
1980 1985 1990 1995 2000
4848
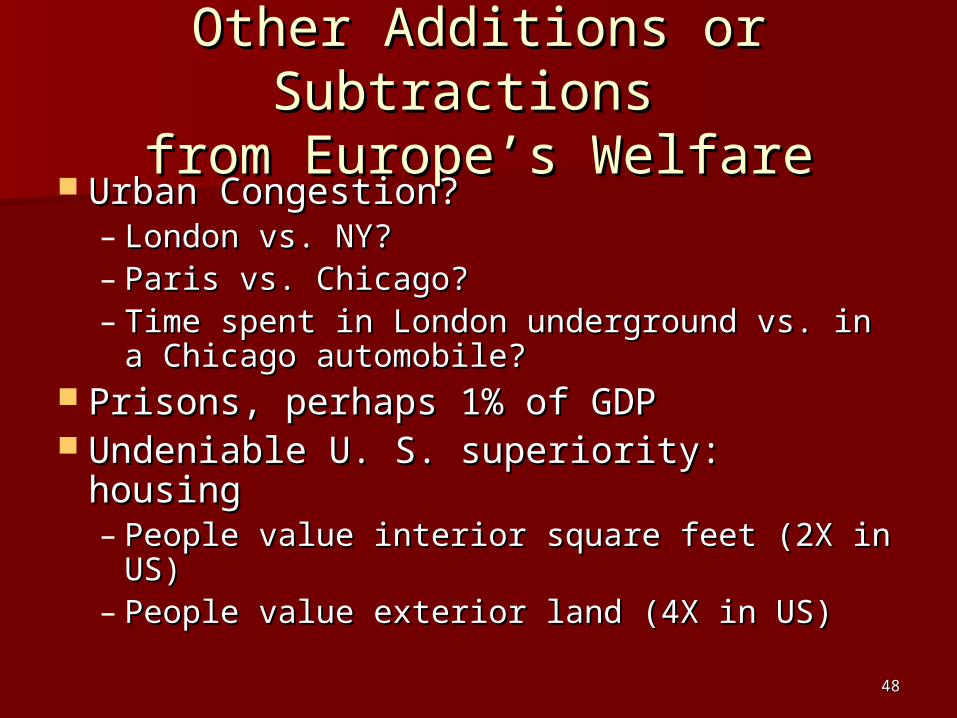
Other Additions or Subtractions Other Additions or Subtractions
from Europe’s Welfarefrom Europe’s Welfare Urban Congestion? Urban Congestion?
– London vs. NY?London vs. NY?– Paris vs. Chicago?Paris vs. Chicago?– Time spent in London underground vs. in Time spent in London underground vs. in
a Chicago automobile?a Chicago automobile? Prisons, perhaps 1% of GDPPrisons, perhaps 1% of GDP Undeniable U. S. superiority: housingUndeniable U. S. superiority: housing
– People value interior square feet (2X in People value interior square feet (2X in US)US)
– People value exterior land (4X in US)People value exterior land (4X in US)

4949
The Intangible andThe Intangible andUnknowableUnknowable
The value of security in EuropeThe value of security in Europe Prescott counts only the substitution Prescott counts only the substitution
effects of higher labor taxeseffects of higher labor taxes Europeans get full value back per tax Europeans get full value back per tax
dollar in valued government servicesdollar in valued government services– U comp, maternity leave, pensions, U comp, maternity leave, pensions,
severance payseverance pay
5050
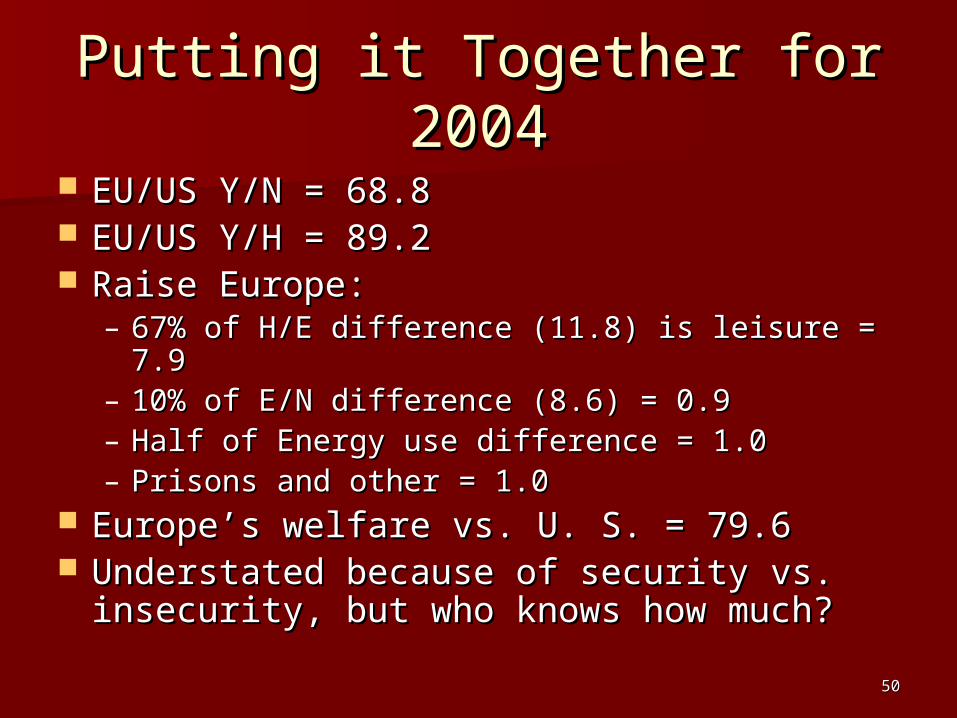
Putting it Together for 2004Putting it Together for 2004
EU/US Y/N = 68.8EU/US Y/N = 68.8 EU/US Y/H = 89.2EU/US Y/H = 89.2 Raise Europe:Raise Europe:
– 67% of H/E difference (11.8) is leisure = 7.967% of H/E difference (11.8) is leisure = 7.9– 10% of E/N difference (8.6) = 0.910% of E/N difference (8.6) = 0.9– Half of Energy use difference = 1.0Half of Energy use difference = 1.0– Prisons and other = 1.0Prisons and other = 1.0
Europe’s welfare vs. U. S. = 79.6Europe’s welfare vs. U. S. = 79.6 Understated because of security vs. Understated because of security vs.
insecurity, but who knows how much?insecurity, but who knows how much?

5151
Table 2
Summary of Adjustments to the Europe-to-U.S. Ratio of Per-capita Income, 2004
Europe-to-U. S. Adjustment toAdjustment
to
Ratio of Real GDP per
CapitaLeisure Component of
Hours GDP
Market PPP Ratio of Y per Capita 68.8
Add: 2/3 of Difference
in Hours per Employee (11.8) 7.9
Add: 1/10 of Difference
in Employment per Capita (8.6) 0.9
Add: Half of Energy Use Difference 1.0
Add: Prisons and Other 1.0
Sum of Market PPP Ratio and
above Additions 79.6
Market PPP Ratio of Y per Hour 89.2
Percent Prody Gap Explained 52.9
Percent Total Gap Explained 30.8
Recommended