Israel Today: Society, Identity, and Political Affinities
Pluralism and Democracy in Israel Program
Supported by the William Davidson Foundation
Uzi Rebhun*
1
Israel Today: Society, Identity, and Political Affinities
1. Introduction
One of the central characteristics of Israeli society is its diversity. Jews and
non-Jews; citizens and foreign workers; immigrants and natives, with a
broad range of ethnicities; secular and religious, including those belonging
to Judaism’s main streams (Orthodox, Conservative, and Reform);
different socio-economic strata; and of varying political positions, live
alongside one another. These differences come on top of the population’s
basic demographic characteristics, such as age, gender, and place of
residence. The appearance of groups with different social and cultural
characteristics in the public sphere, and the discourse regarding them, has
become more pronounced in recent years with the strengthening of
individualism and pluralism gradually replacing the ‘melting pot’
paradigm with the ethos of multiculturalism. This trend is likely to increase
internal tensions, but at the same time allow each individual and group
greater expression of its particularity and open opportunities for mutual
recognition and respect.
This paper presents and analyzes the social, identity, and political
preferences of Israeli society while mainly focusing on Israel’s Jews. It
portrays the development of these traits over Israel's existence, with a
special emphasis on the past 25 years. Although each of these
characteristics stands on its own, this analysis connects each examined
characteristic with what preceded it. This approach allows detailed insights
into the pieces that together compose Israel’s human mosaic.
Changes in a population’s characteristics generally occur as a result of two
main factors. The first is a non-uniform change in the size of its sub-groups
due to selective natural growth or immigration rates; the second is the
2
shifting patterns of behavior that result from personal achievement or
changes in social and cultural preferences. Often, both factors are at play as
a population’s composition and characteristics changes. As much as it is
possible, we will attempt to point to each factor’s influence and discuss its
significance for public policy.
2. Population Size and Place of Birth
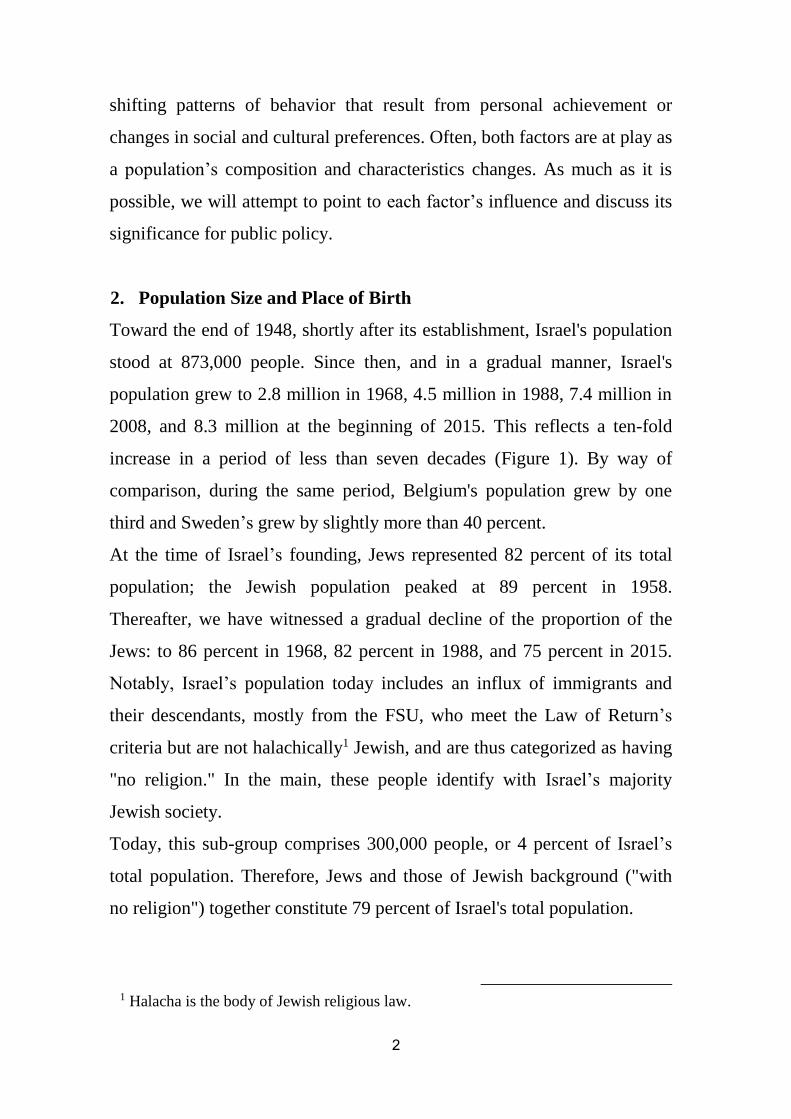
Toward the end of 1948, shortly after its establishment, Israel's population
stood at 873,000 people. Since then, and in a gradual manner, Israel's
population grew to 2.8 million in 1968, 4.5 million in 1988, 7.4 million in
2008, and 8.3 million at the beginning of 2015. This reflects a ten-fold
increase in a period of less than seven decades (Figure 1). By way of
comparison, during the same period, Belgium's population grew by one
third and Sweden’s grew by slightly more than 40 percent.
At the time of Israel’s founding, Jews represented 82 percent of its total
population; the Jewish population peaked at 89 percent in 1958.
Thereafter, we have witnessed a gradual decline of the proportion of the
Jews: to 86 percent in 1968, 82 percent in 1988, and 75 percent in 2015.
Notably, Israel’s population today includes an influx of immigrants and
their descendants, mostly from the FSU, who meet the Law of Return’s
criteria but are not halachically1 Jewish, and are thus categorized as having
"no religion." In the main, these people identify with Israel’s majority
Jewish society.
Today, this sub-group comprises 300,000 people, or 4 percent of Israel’s
total population. Therefore, Jews and those of Jewish background ("with
no religion") together constitute 79 percent of Israel's total population.
.he body of Jewish religious lawHalacha is t 1
3
82.2 85.7 81.7 79.5 78.9
17.8 14.3 18.3 20.5 21.1
0102030405060708090
100
Figure 1. Jews and Non-Jews in Israel, 1948-2015
Jews Non-Jews
Size: 873.0 2.8M 4.5M 7.4M 8.3M
Adopted from: Central Bureau of Statistics, Statistical Abstract for Israel, for various
years. Jews include those of "no religion."
The growth of the number of Jews in Israel is attributed to natural
increase on one hand, and a positive immigration balance on the other
(immigrants vs. emigrants). For the entire period since Israel's founding,
natural increase has contributed 60 percent of its growth, and immigration
the remaining 40 percent. In certain periods, especially immediately after
the establishment of the state, but also during the last decade of the 20th
century, immigration was a paramount factor in Jewish population
growth. Therefore, Israel is defined as an immigrant country, and one of
the important distinctions of the Jewish population in Israel is its nativity
status, namely those born in Israel vs. the foreign-born.
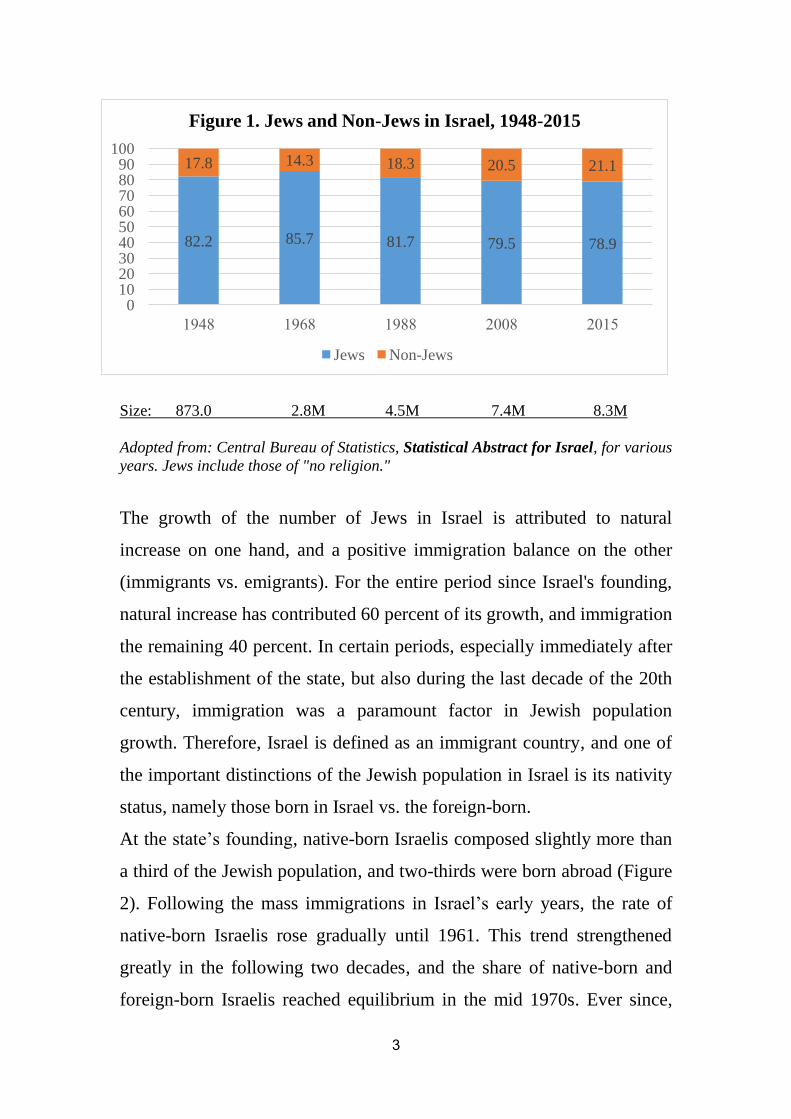
At the state’s founding, native-born Israelis composed slightly more than
a third of the Jewish population, and two-thirds were born abroad (Figure
2). Following the mass immigrations in Israel’s early years, the rate of
native-born Israelis rose gradually until 1961. This trend strengthened
greatly in the following two decades, and the share of native-born and
foreign-born Israelis reached equilibrium in the mid 1970s. Ever since,
4
most of the population has been native-born. In a clear growth trajectory,
the proportion of native-born Israelis was slightly less than two-thirds in
1995, and is three-fourths today. In other words, since Israel's founding,
the nativity composition of its Jewish population has shifted from a
foreign-born majority to a native-born majority. From a social vantage
point, the majority of Israeli Jews today have been raised in an Israeli
milieu, and at similar life stages have undergone shared social processes
in the education system (in its various forms), fulfill, with some notable
exceptions, the civic duty of military/national service, have Hebrew as
their mother-tongue, and experience times of crisis together.
35.447.3 57.5 61.7
74.7
64.652.7 42.5 38.3
25.3
0102030405060708090
100
Figure 2. The Jewish Population in Israel by Place of
Birth (Nativity Status), 1948-2013
Native-Born Foreign-Born
Adopted from: Central Bureau of Statistics, Statistical Abstract of Israel, 2014.
3. Ethnic Origin
Aliyah (immigration to Israel) has brought Jews from all over the world to
Israel. Jews have come to Israel from Asia, Africa, Europe (East and
West), America, and Oceana. In social research, it is common practice to
distinguish between immigrants, and their Israel-born offspring, from Asia
5
and Africa and those from Europe and America; those born in Israel to an
Israeli-born father are categorized as "Israeli."
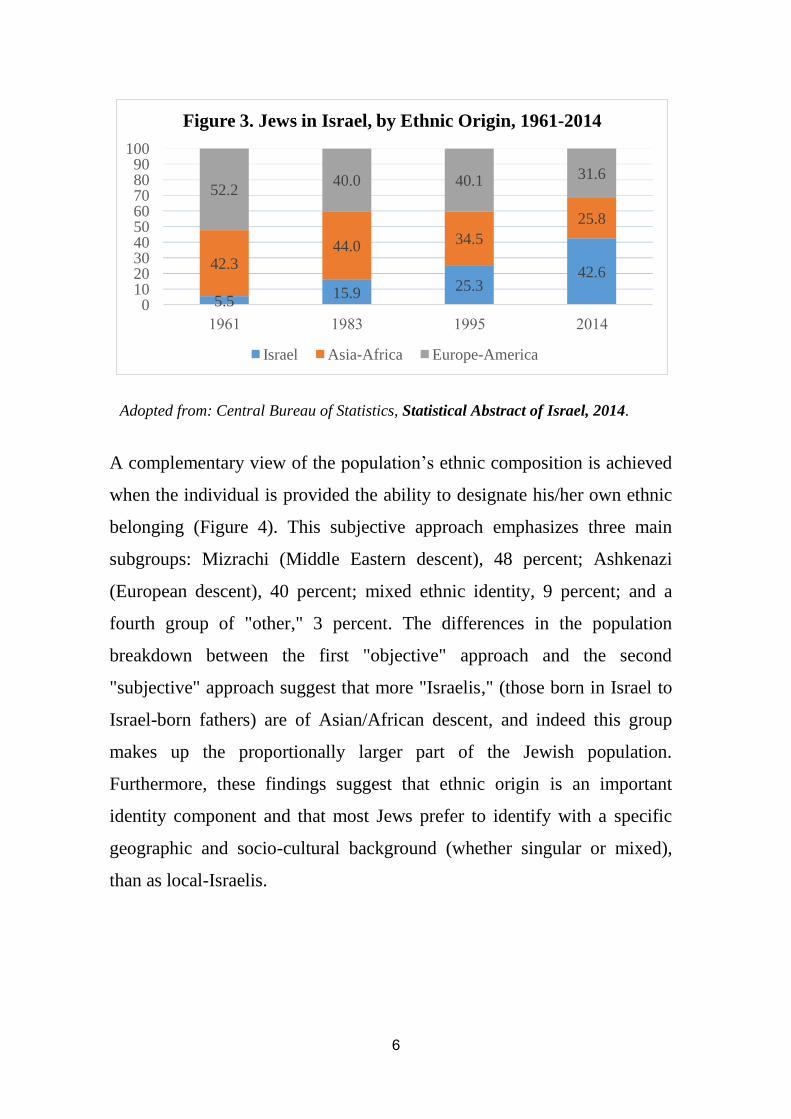
Following the post-founding large wave of immigration, only 5 percent of
Israeli Jews were the second generation of native-born Israelis; much of
the Jewish population were immigrants and their descendants, with over
half of European or American origin (52.2 percent), and four of ten (42.3
percent) of Asian or African descent (Figure 3). The trend in the following
two decades, and until 1983, was in a clear direction of growth for the
Israeli-born group; stability in the growth rate of those from Asia and
Africa (mostly due to significant immigration in the early 1960s and high
birth rates); and a dwindling of the proportion of those from Europe and
America. In the next decade, alongside the population growth of Israelis,
the trends reversed for each of the other groups: the rate of those from Asia
and Africa diminished; the rate of those from Europe and America
remained fairly stable, due to the large FSU immigration wave (meaning
that the immigration compensated for the aging and mortality in the
population from Europe and the rapid growth of the other two sub-groups).
Since then and through 2014, as immigration rates to Israel were low
overall, and birth rates for those of Asian or African origin and those of
European or America origin converged, the share of each of the African-
Asian and European-American ethnic groups decreased and the share of
the Israelis grew. Overall, the growth trend of native-born Israelis
described above is also expressed in the permutation of the ethnic make-up
of the total Israeli Jewish population.
6
5.515.9
25.342.6
42.344.0
34.5
25.8
52.240.0 40.1 31.6
0102030405060708090
100
Figure 3. Jews in Israel, by Ethnic Origin, 1961-2014
Israel Asia-Africa Europe-America
Adopted from: Central Bureau of Statistics, Statistical Abstract of Israel, 2014.
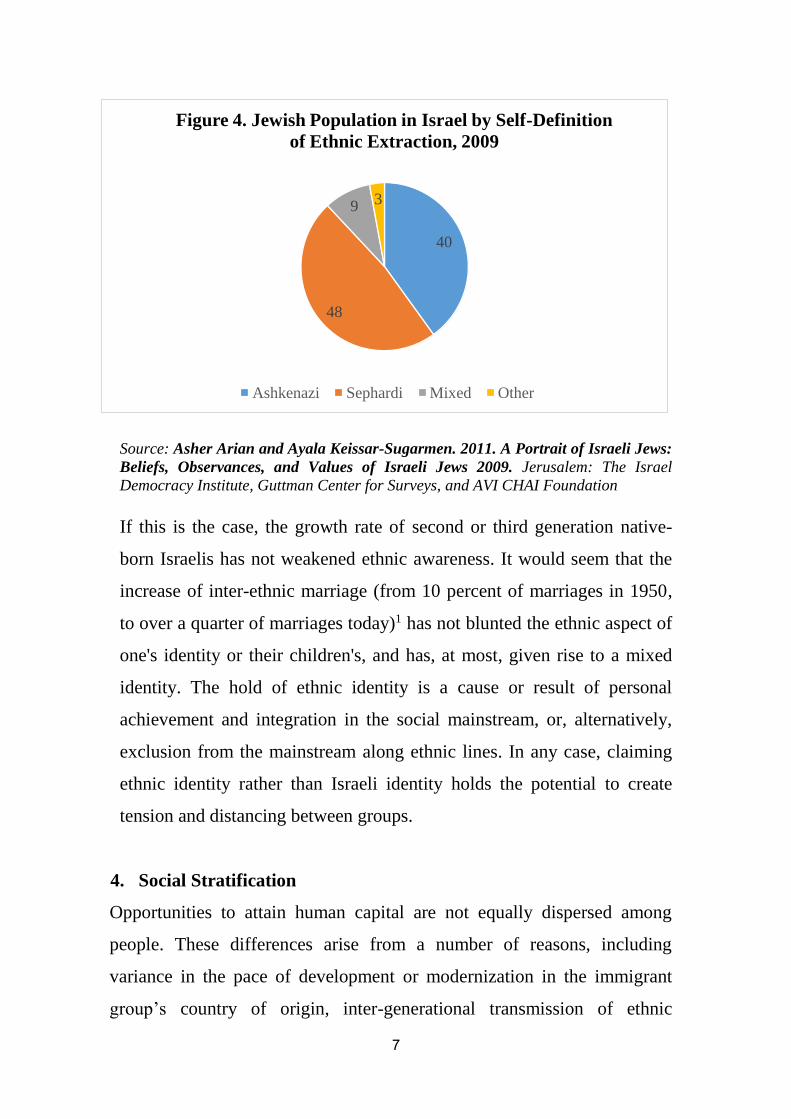
A complementary view of the population’s ethnic composition is achieved
when the individual is provided the ability to designate his/her own ethnic
belonging (Figure 4). This subjective approach emphasizes three main
subgroups: Mizrachi (Middle Eastern descent), 48 percent; Ashkenazi
(European descent), 40 percent; mixed ethnic identity, 9 percent; and a
fourth group of "other," 3 percent. The differences in the population
breakdown between the first "objective" approach and the second
"subjective" approach suggest that more "Israelis," (those born in Israel to
Israel-born fathers) are of Asian/African descent, and indeed this group
makes up the proportionally larger part of the Jewish population.
Furthermore, these findings suggest that ethnic origin is an important
identity component and that most Jews prefer to identify with a specific
geographic and socio-cultural background (whether singular or mixed),
than as local-Israelis.
7
40
48
9 3
Figure 4. Jewish Population in Israel by Self-Definition
of Ethnic Extraction, 2009
Ashkenazi Sephardi Mixed Other
Source: Asher Arian and Ayala Keissar-Sugarmen. 2011. A Portrait of Israeli Jews:
Beliefs, Observances, and Values of Israeli Jews 2009. Jerusalem: The Israel
Democracy Institute, Guttman Center for Surveys, and AVI CHAI Foundation
If this is the case, the growth rate of second or third generation native-
born Israelis has not weakened ethnic awareness. It would seem that the
increase of inter-ethnic marriage (from 10 percent of marriages in 1950,
to over a quarter of marriages today)1 has not blunted the ethnic aspect of
one's identity or their children's, and has, at most, given rise to a mixed
identity. The hold of ethnic identity is a cause or result of personal
achievement and integration in the social mainstream, or, alternatively,
exclusion from the mainstream along ethnic lines. In any case, claiming
ethnic identity rather than Israeli identity holds the potential to create
tension and distancing between groups.
4. Social Stratification
Opportunities to attain human capital are not equally dispersed among
people. These differences arise from a number of reasons, including
variance in the pace of development or modernization in the immigrant
group’s country of origin, inter-generational transmission of ethnic
8
attributes, development level of place of residence in Israel, and family
size. These factors, on their part, generate a socio-economic stratification
of the population. Main measurements of stratification include education
levels and economic attainments.
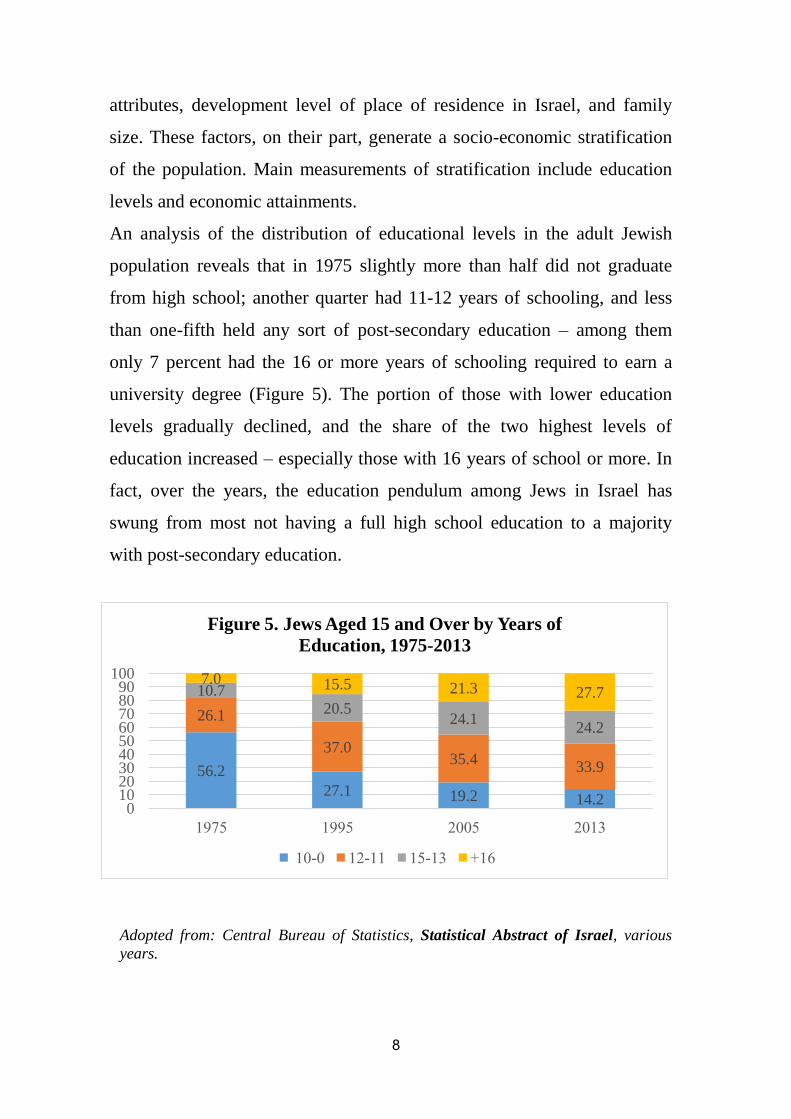
An analysis of the distribution of educational levels in the adult Jewish
population reveals that in 1975 slightly more than half did not graduate
from high school; another quarter had 11-12 years of schooling, and less
than one-fifth held any sort of post-secondary education – among them
only 7 percent had the 16 or more years of schooling required to earn a
university degree (Figure 5). The portion of those with lower education
levels gradually declined, and the share of the two highest levels of
education increased – especially those with 16 years of school or more. In
fact, over the years, the education pendulum among Jews in Israel has
swung from most not having a full high school education to a majority
with post-secondary education.
56.2
27.1 19.2 14.2
26.1
37.035.4
33.9
10.720.5
24.124.2
7.0 15.5 21.3 27.7
0102030405060708090
100
Figure 5. Jews Aged 15 and Over by Years of
Education, 1975-2013
- - -
Adopted from: Central Bureau of Statistics, Statistical Abstract of Israel, various
years.
9
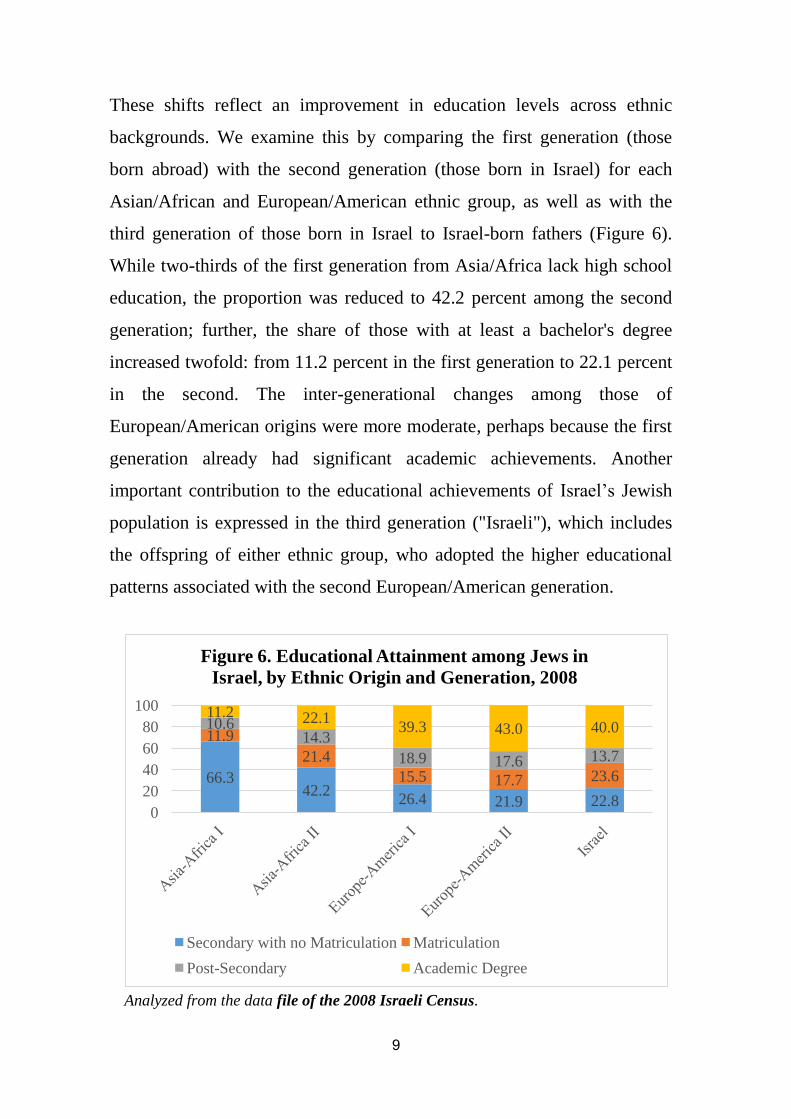
These shifts reflect an improvement in education levels across ethnic
backgrounds. We examine this by comparing the first generation (those
born abroad) with the second generation (those born in Israel) for each
Asian/African and European/American ethnic group, as well as with the
third generation of those born in Israel to Israel-born fathers (Figure 6).
While two-thirds of the first generation from Asia/Africa lack high school
education, the proportion was reduced to 42.2 percent among the second
generation; further, the share of those with at least a bachelor's degree
increased twofold: from 11.2 percent in the first generation to 22.1 percent
in the second. The inter-generational changes among those of
European/American origins were more moderate, perhaps because the first
generation already had significant academic achievements. Another
important contribution to the educational achievements of Israel’s Jewish
population is expressed in the third generation ("Israeli"), which includes
the offspring of either ethnic group, who adopted the higher educational
patterns associated with the second European/American generation.
66.342.2
26.4 21.9 22.8
11.9
21.4
15.5 17.7 23.6
10.614.3
18.9 17.6 13.7
11.2 22.139.3 43.0 40.0
0
20
40
60
80
100
Figure 6. Educational Attainment among Jews in
Israel, by Ethnic Origin and Generation, 2008
Secondary with no Matriculation Matriculation
Post-Secondary Academic Degree Analyzed from the data file of the 2008 Israeli Census.
10
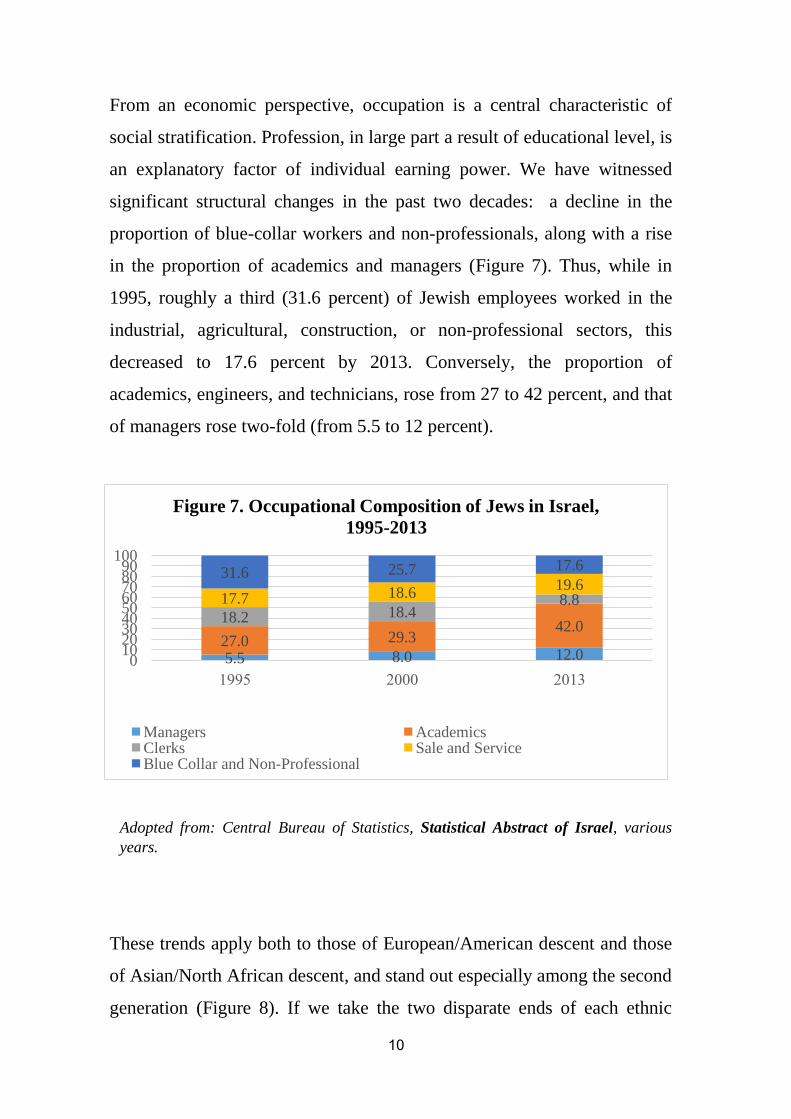
From an economic perspective, occupation is a central characteristic of
social stratification. Profession, in large part a result of educational level, is
an explanatory factor of individual earning power. We have witnessed
significant structural changes in the past two decades: a decline in the
proportion of blue-collar workers and non-professionals, along with a rise
in the proportion of academics and managers (Figure 7). Thus, while in
1995, roughly a third (31.6 percent) of Jewish employees worked in the
industrial, agricultural, construction, or non-professional sectors, this
decreased to 17.6 percent by 2013. Conversely, the proportion of
academics, engineers, and technicians, rose from 27 to 42 percent, and that
of managers rose two-fold (from 5.5 to 12 percent).
5.5 8.0 12.027.0 29.3
42.018.2 18.4
8.817.7 18.619.6
31.6 25.7 17.6
0102030405060708090
100
Figure 7. Occupational Composition of Jews in Israel,
1995-2013
Managers AcademicsClerks Sale and ServiceBlue Collar and Non-Professional
Adopted from: Central Bureau of Statistics, Statistical Abstract of Israel, various
years.
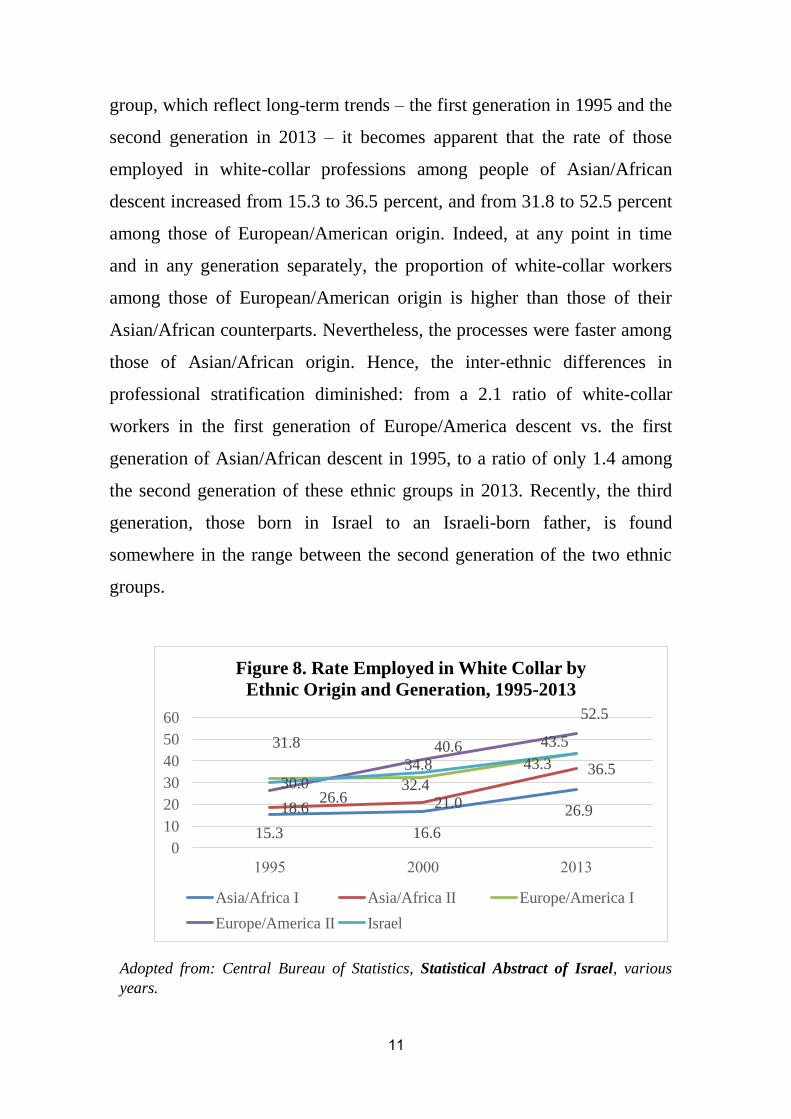
These trends apply both to those of European/American descent and those
of Asian/North African descent, and stand out especially among the second
generation (Figure 8). If we take the two disparate ends of each ethnic
11
group, which reflect long-term trends – the first generation in 1995 and the
second generation in 2013 – it becomes apparent that the rate of those
employed in white-collar professions among people of Asian/African
descent increased from 15.3 to 36.5 percent, and from 31.8 to 52.5 percent
among those of European/American origin. Indeed, at any point in time
and in any generation separately, the proportion of white-collar workers
among those of European/American origin is higher than those of their
Asian/African counterparts. Nevertheless, the processes were faster among
those of Asian/African origin. Hence, the inter-ethnic differences in
professional stratification diminished: from a 2.1 ratio of white-collar
workers in the first generation of Europe/America descent vs. the first
generation of Asian/African descent in 1995, to a ratio of only 1.4 among
the second generation of these ethnic groups in 2013. Recently, the third
generation, those born in Israel to an Israeli-born father, is found
somewhere in the range between the second generation of the two ethnic
groups.
15.3 16.6
26.918.6 21.0
36.5
31.8
32.4
43.3
26.6
40.6
52.5
30.0
34.8
43.5
0
10
20
30
40
50
60
Figure 8. Rate Employed in White Collar by
Ethnic Origin and Generation, 1995-2013
Asia/Africa I Asia/Africa II Europe/America I
Europe/America II Israel
Adopted from: Central Bureau of Statistics, Statistical Abstract of Israel, various
years.
12
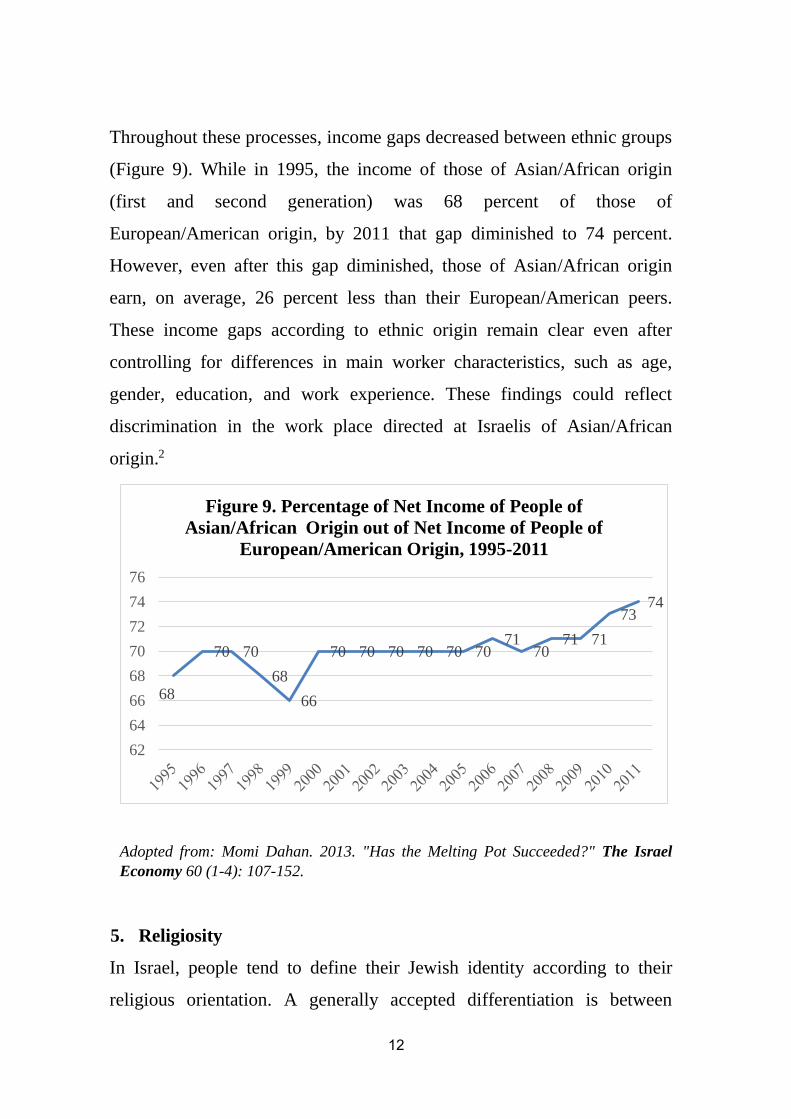
Throughout these processes, income gaps decreased between ethnic groups
(Figure 9). While in 1995, the income of those of Asian/African origin
(first and second generation) was 68 percent of those of
European/American origin, by 2011 that gap diminished to 74 percent.
However, even after this gap diminished, those of Asian/African origin
earn, on average, 26 percent less than their European/American peers.
These income gaps according to ethnic origin remain clear even after
controlling for differences in main worker characteristics, such as age,
gender, education, and work experience. These findings could reflect
discrimination in the work place directed at Israelis of Asian/African
origin.2
68
70 70
68
66
70 70 70 70 70 7071
7071 71
7374
62
64
66
68
70
72
74
76
Figure 9. Percentage of Net Income of People of
Asian/African Origin out of Net Income of People of
European/American Origin, 1995-2011
Adopted from: Momi Dahan. 2013. "Has the Melting Pot Succeeded?" The Israel
Economy 60 (1-4): 107-152.
5. Religiosity
In Israel, people tend to define their Jewish identity according to their
religious orientation. A generally accepted differentiation is between
13
Haredi (ultra-Orthodox), Orthodox, traditional, and secular (including anti-
religious). Certainly, each of these groups is not monolithic, but rather
comprises a range of people along a spectrum of religiosity. This is
especially salient among those who call themselves traditional, where this
ranges from the traditionally-religious to those who are traditional but not
religious. In any case, these are subjective definitions and are not
dependent on any specific practices or beliefs.
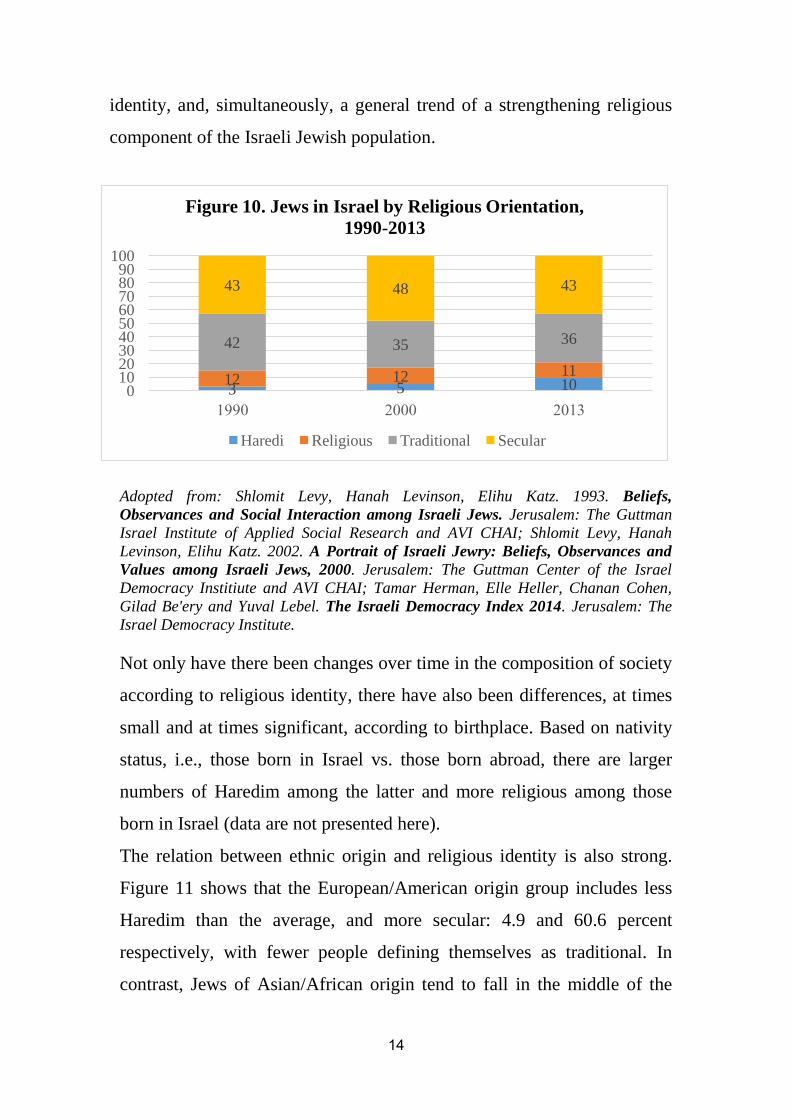
In 1990, 3 percent of Jewish adults in Israel defined themselves as Haredi
(Figure 10). Another one of every ten defined themselves as religious, and
the rest were either traditional (42 percent) or secular (43 percent), the
latter included a small number of those who called themselves anti-
religious. In the following decade, the two groups at the opposite ends of
the spectrum grew: Haredim at one end (5 percent) and secular at the other
(48 percent). While the rise in the numbers of Haredim can be attributed
mostly to high birth rates, there is also a growing "Haredization" of Jews of
Asian/African origin. The growth of secular Jews should be attributed to
the large influx of immigrants from the former Soviet Union. This brought
a large number of Jews who for decades lived in an environment that
suppressed any attachment to religious faith. Thereafter, there is a clear
trend of an increased proportion of Haredim and a decrease in the secular.
One can also examine Israeli Jewish society as one comprised of three
parts with different religious connections. The first can be defined as
"religious" and includes Haredim, religious, and traditional-religious
constituting roughly a third of the Jewish population; the second is
"traditional" and comprises about a quarter of Jewish Israelis; the third is
the "seculars," which includes about four of every ten Jews. Whether we
adopt a detailed or a more aggregate view, it seems that the Jewish
population in Israel is spread out across a definitional range of religious
14
identity, and, simultaneously, a general trend of a strengthening religious
component of the Israeli Jewish population.
3 5 1012 12 11
42 35 36
43 48 43
0102030405060708090
100
Figure 10. Jews in Israel by Religious Orientation,
1990-2013
Haredi Religious Traditional Secular
Adopted from: Shlomit Levy, Hanah Levinson, Elihu Katz. 1993. Beliefs,
Observances and Social Interaction among Israeli Jews. Jerusalem: The Guttman
Israel Institute of Applied Social Research and AVI CHAI; Shlomit Levy, Hanah
Levinson, Elihu Katz. 2002. A Portrait of Israeli Jewry: Beliefs, Observances and
Values among Israeli Jews, 2000. Jerusalem: The Guttman Center of the Israel
Democracy Institiute and AVI CHAI; Tamar Herman, Elle Heller, Chanan Cohen,
Gilad Be'ery and Yuval Lebel. The Israeli Democracy Index 2014. Jerusalem: The
Israel Democracy Institute.
Not only have there been changes over time in the composition of society
according to religious identity, there have also been differences, at times
small and at times significant, according to birthplace. Based on nativity
status, i.e., those born in Israel vs. those born abroad, there are larger
numbers of Haredim among the latter and more religious among those
born in Israel (data are not presented here).
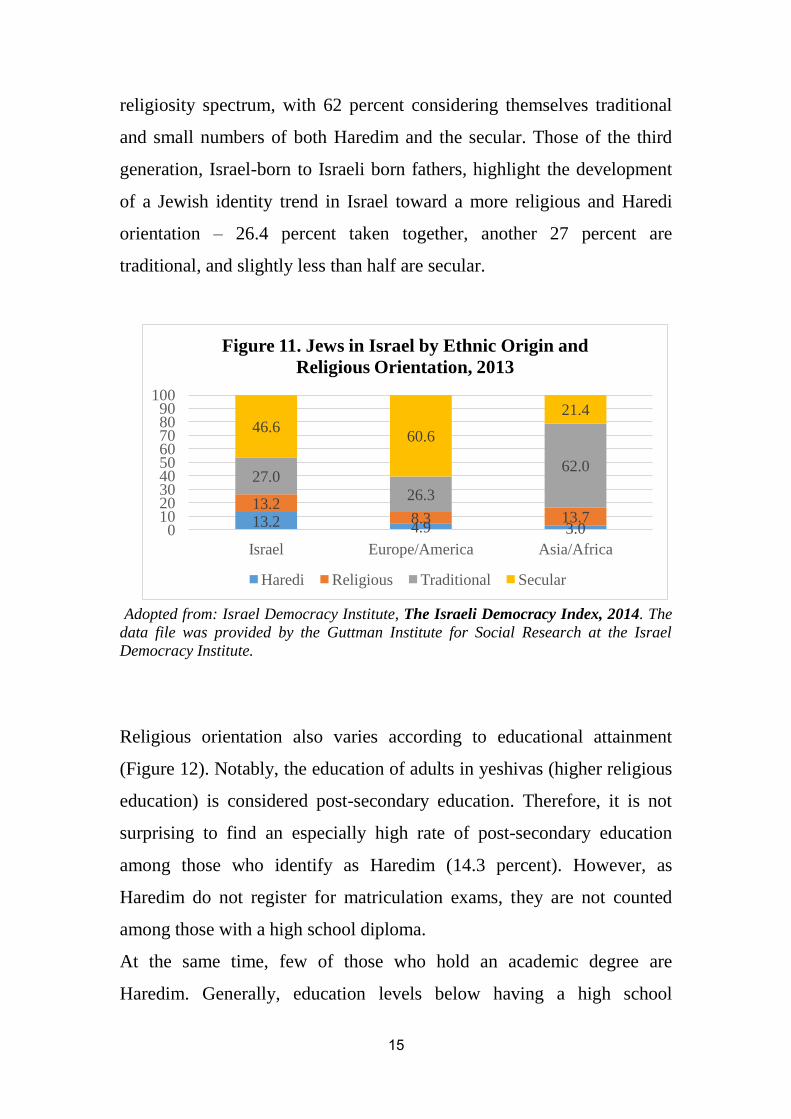
The relation between ethnic origin and religious identity is also strong.
Figure 11 shows that the European/American origin group includes less
Haredim than the average, and more secular: 4.9 and 60.6 percent
respectively, with fewer people defining themselves as traditional. In
contrast, Jews of Asian/African origin tend to fall in the middle of the
15
religiosity spectrum, with 62 percent considering themselves traditional
and small numbers of both Haredim and the secular. Those of the third
generation, Israel-born to Israeli born fathers, highlight the development
of a Jewish identity trend in Israel toward a more religious and Haredi
orientation – 26.4 percent taken together, another 27 percent are
traditional, and slightly less than half are secular.
13.2 4.9 3.0
13.28.3 13.7
27.0
26.3
62.0
46.660.6
21.4
0102030405060708090
100
Israel Europe/America Asia/Africa
Figure 11. Jews in Israel by Ethnic Origin and
Religious Orientation, 2013
Haredi Religious Traditional Secular
Adopted from: Israel Democracy Institute, The Israeli Democracy Index, 2014. The
data file was provided by the Guttman Institute for Social Research at the Israel
Democracy Institute.
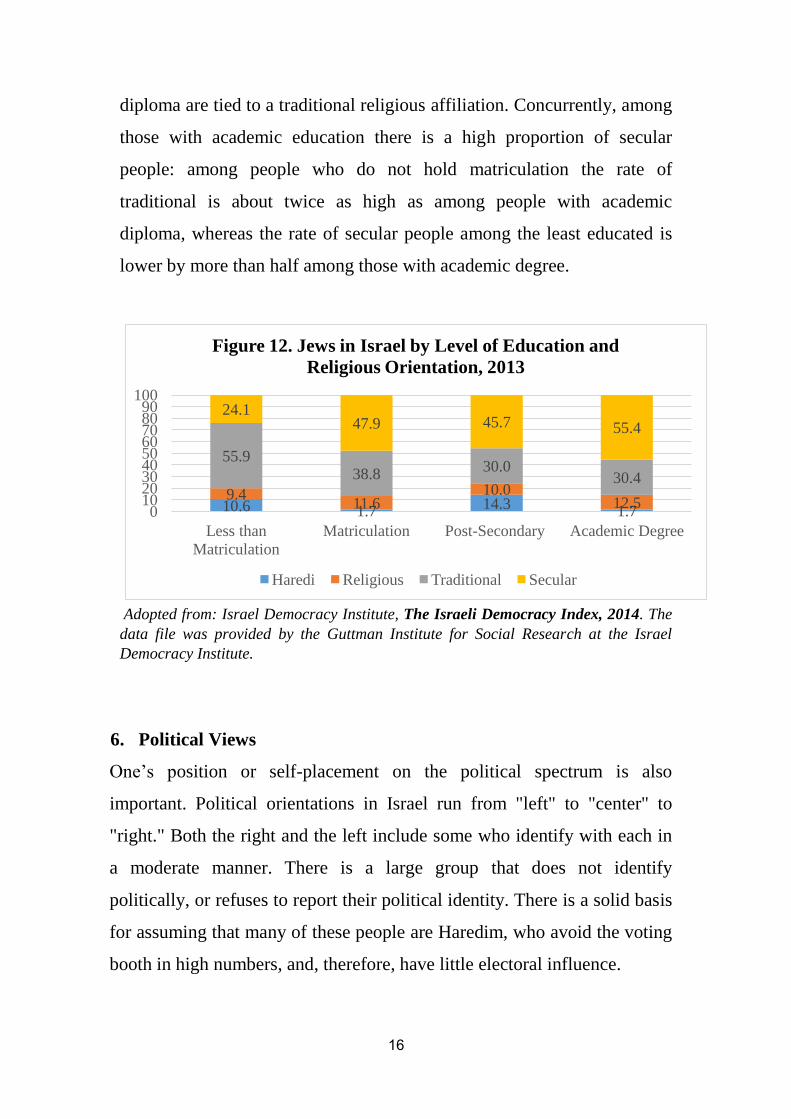
Religious orientation also varies according to educational attainment
(Figure 12). Notably, the education of adults in yeshivas (higher religious
education) is considered post-secondary education. Therefore, it is not
surprising to find an especially high rate of post-secondary education
among those who identify as Haredim (14.3 percent). However, as
Haredim do not register for matriculation exams, they are not counted
among those with a high school diploma.
At the same time, few of those who hold an academic degree are
Haredim. Generally, education levels below having a high school
16
diploma are tied to a traditional religious affiliation. Concurrently, among
those with academic education there is a high proportion of secular
people: among people who do not hold matriculation the rate of
traditional is about twice as high as among people with academic
diploma, whereas the rate of secular people among the least educated is
lower by more than half among those with academic degree.
10.6 1.714.3
1.79.4
11.610.0
12.5
55.938.8
30.030.4
24.147.9 45.7 55.4
0102030405060708090
100
Less than
Matriculation
Matriculation Post-Secondary Academic Degree
Figure 12. Jews in Israel by Level of Education and
Religious Orientation, 2013
Haredi Religious Traditional Secular
Adopted from: Israel Democracy Institute, The Israeli Democracy Index, 2014. The
data file was provided by the Guttman Institute for Social Research at the Israel
Democracy Institute.
6. Political Views
One’s position or self-placement on the political spectrum is also
important. Political orientations in Israel run from "left" to "center" to
"right." Both the right and the left include some who identify with each in
a moderate manner. There is a large group that does not identify
politically, or refuses to report their political identity. There is a solid basis
for assuming that many of these people are Haredim, who avoid the voting
booth in high numbers, and, therefore, have little electoral influence.
17
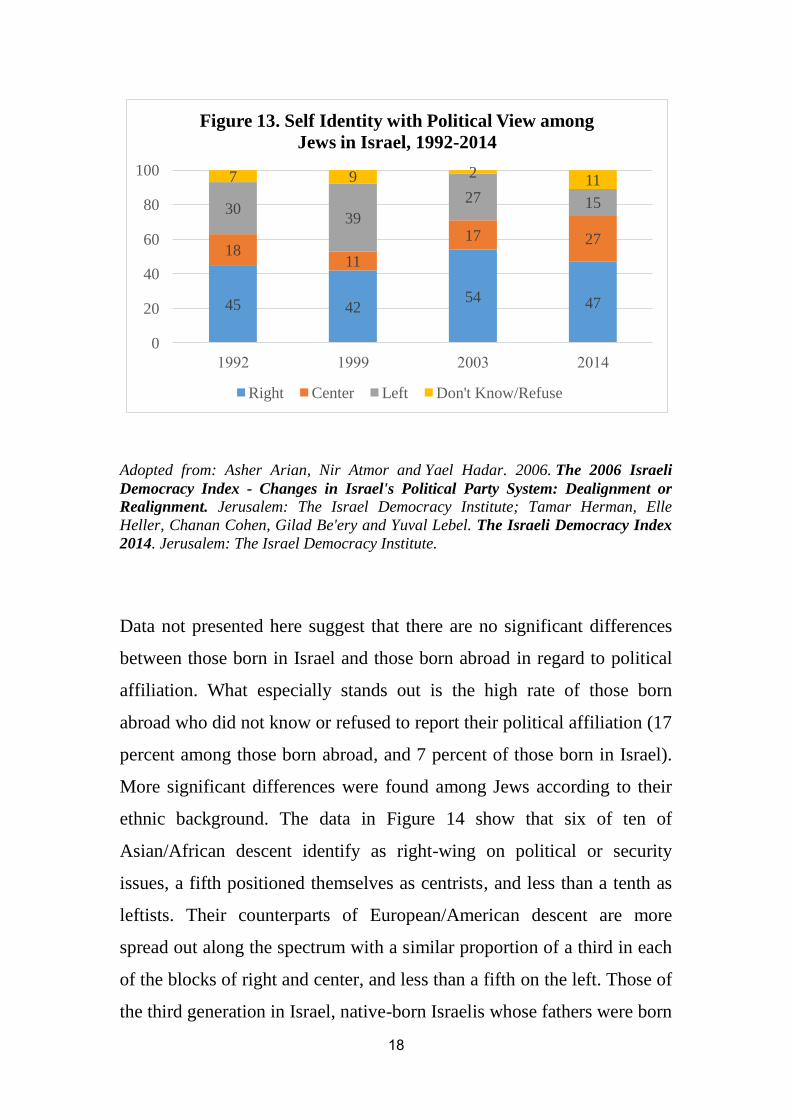
Examining trends over the past two decades (1992-2014) reveals that
despite slight fluctuations, the right is the larger political block; the center
has gained significant strength, and the left has declined (Figure 13). More
specifically, in 1992, roughly 45 percent of all adult Jews identified as
right wing; this rose to 54 percent by 2003, and, in recent years, has
returned to slightly less than half the Jewish population. The share of those
identified with the center, which stood at 18 percent in 1992, dropped to 11
percent in 1999, and has since grown two and a half times to slightly over
a quarter (27 percent) in 2014. Support of the left block gained strength in
the 1990s peaking at 39 percent, but has since dropped to as low as 15
percent. This trend may correspond to events or processes in the Israeli-
Arab conflict: the intensive Oslo negotiations between Israel and the
Palestinians until 2000, which sharpened the conflicting stances between
right and left and led to diffused political system with a small center; the
Second Intifada of the early 2000s weakened the left’s power, especially in
favor of the right; a continuing lack of faith in the likelihood of achieving a
solution in light of recent events, especially on the southern border after
the unilateral Gaza disengagement; and, perhaps, the general instability in
the Middle East or, alternatively, a growing trust of Israel's ability to
manage the conflict in its current form (until the events of Fall 2015),
rather than resolving it. Another explanation is the rapid demographic
growth of the religious and Haredi populations, which, as shown below,
tend to be right wing on political and security issues.
18
45 4254 47
1811
17 27
3039
27 15
7 9 211
0
20
40
60
80
100
Figure 13. Self Identity with Political View among
Jews in Israel, 1992-2014
Right Center Left Don't Know/Refuse
Adopted from: Asher Arian, Nir Atmor and Yael Hadar. 2006. The 2006 Israeli
Democracy Index - Changes in Israel's Political Party System: Dealignment or
Realignment. Jerusalem: The Israel Democracy Institute; Tamar Herman, Elle
Heller, Chanan Cohen, Gilad Be'ery and Yuval Lebel. The Israeli Democracy Index
2014. Jerusalem: The Israel Democracy Institute.
Data not presented here suggest that there are no significant differences
between those born in Israel and those born abroad in regard to political
affiliation. What especially stands out is the high rate of those born
abroad who did not know or refused to report their political affiliation (17
percent among those born abroad, and 7 percent of those born in Israel).
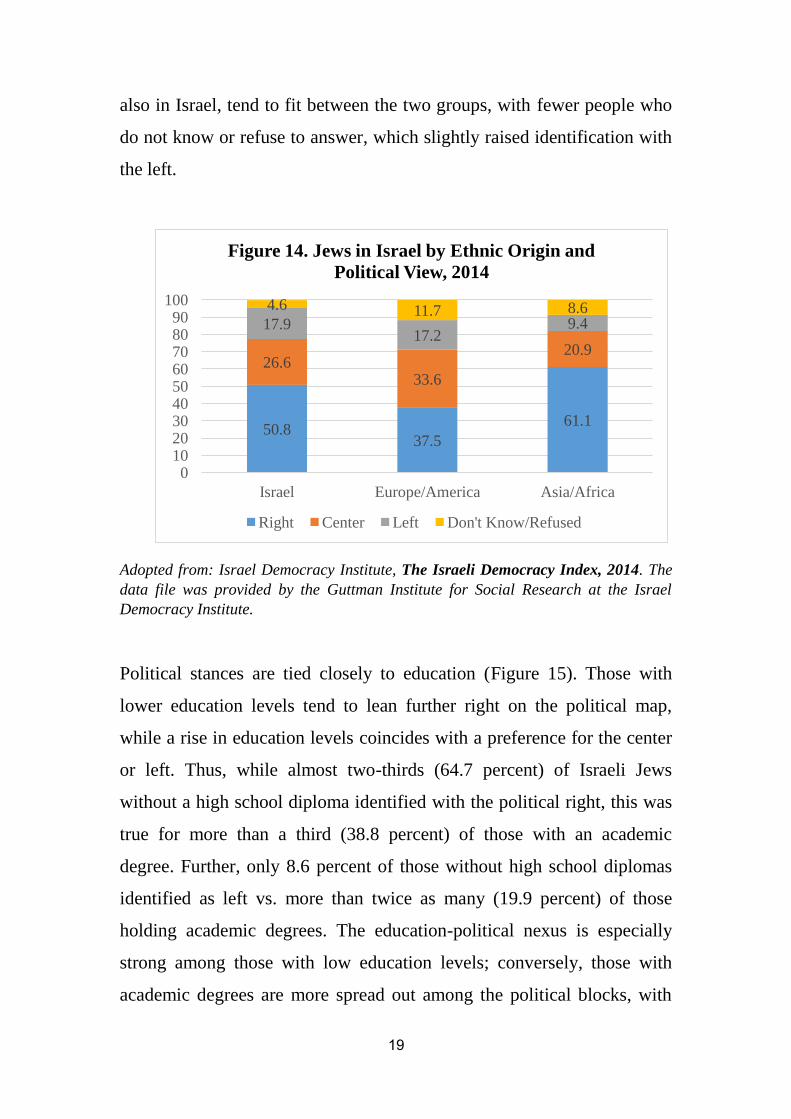
More significant differences were found among Jews according to their
ethnic background. The data in Figure 14 show that six of ten of
Asian/African descent identify as right-wing on political or security
issues, a fifth positioned themselves as centrists, and less than a tenth as
leftists. Their counterparts of European/American descent are more
spread out along the spectrum with a similar proportion of a third in each
of the blocks of right and center, and less than a fifth on the left. Those of
the third generation in Israel, native-born Israelis whose fathers were born
19
also in Israel, tend to fit between the two groups, with fewer people who
do not know or refuse to answer, which slightly raised identification with
the left.
50.837.5
61.1
26.633.6
20.9
17.917.2
9.4
4.6 11.7 8.6
0102030405060708090
100
Israel Europe/America Asia/Africa
Figure 14. Jews in Israel by Ethnic Origin and
Political View, 2014
Right Center Left Don't Know/Refused
Adopted from: Israel Democracy Institute, The Israeli Democracy Index, 2014. The
data file was provided by the Guttman Institute for Social Research at the Israel
Democracy Institute.
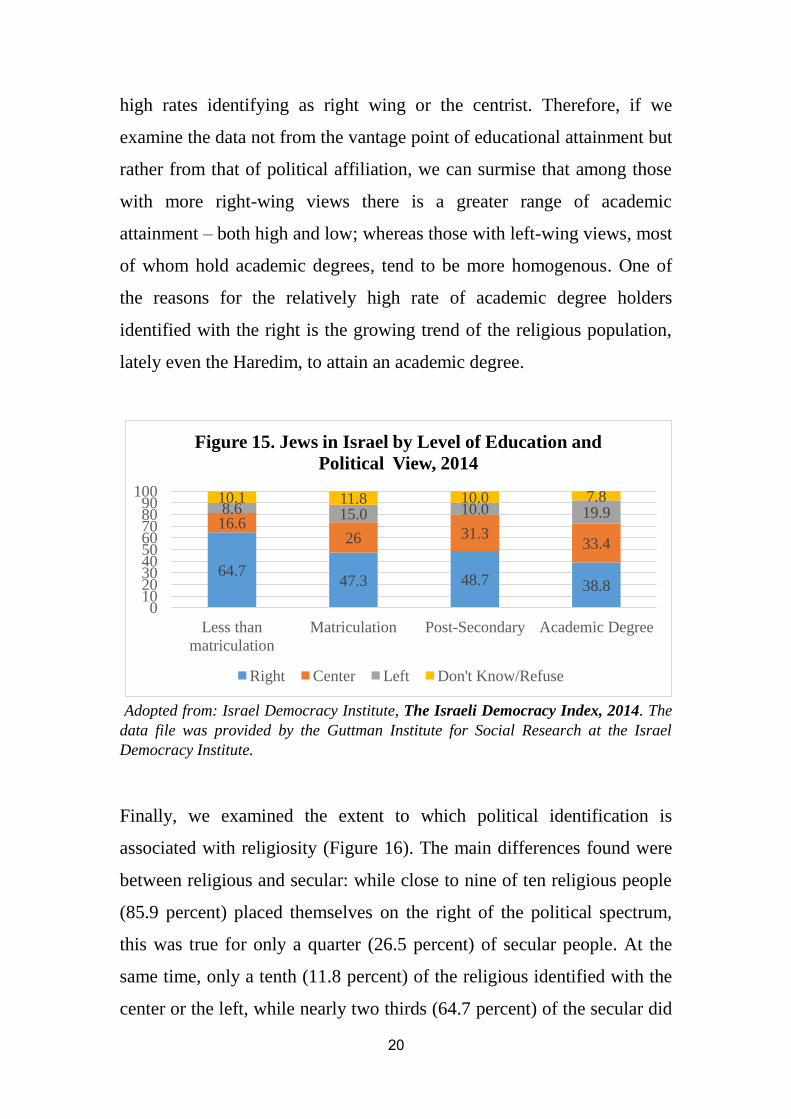
Political stances are tied closely to education (Figure 15). Those with
lower education levels tend to lean further right on the political map,
while a rise in education levels coincides with a preference for the center
or left. Thus, while almost two-thirds (64.7 percent) of Israeli Jews
without a high school diploma identified with the political right, this was
true for more than a third (38.8 percent) of those with an academic
degree. Further, only 8.6 percent of those without high school diplomas
identified as left vs. more than twice as many (19.9 percent) of those
holding academic degrees. The education-political nexus is especially
strong among those with low education levels; conversely, those with
academic degrees are more spread out among the political blocks, with
20
high rates identifying as right wing or the centrist. Therefore, if we
examine the data not from the vantage point of educational attainment but
rather from that of political affiliation, we can surmise that among those
with more right-wing views there is a greater range of academic
attainment – both high and low; whereas those with left-wing views, most
of whom hold academic degrees, tend to be more homogenous. One of
the reasons for the relatively high rate of academic degree holders
identified with the right is the growing trend of the religious population,
lately even the Haredim, to attain an academic degree.
64.747.3 48.7 38.8
16.626 31.3
33.4
8.6 15.0 10.0 19.910.1 11.8 10.0 7.8
0102030405060708090
100
Less than
matriculation
Matriculation Post-Secondary Academic Degree
Figure 15. Jews in Israel by Level of Education and
Political View, 2014
Right Center Left Don't Know/Refuse
Adopted from: Israel Democracy Institute, The Israeli Democracy Index, 2014. The
data file was provided by the Guttman Institute for Social Research at the Israel
Democracy Institute.
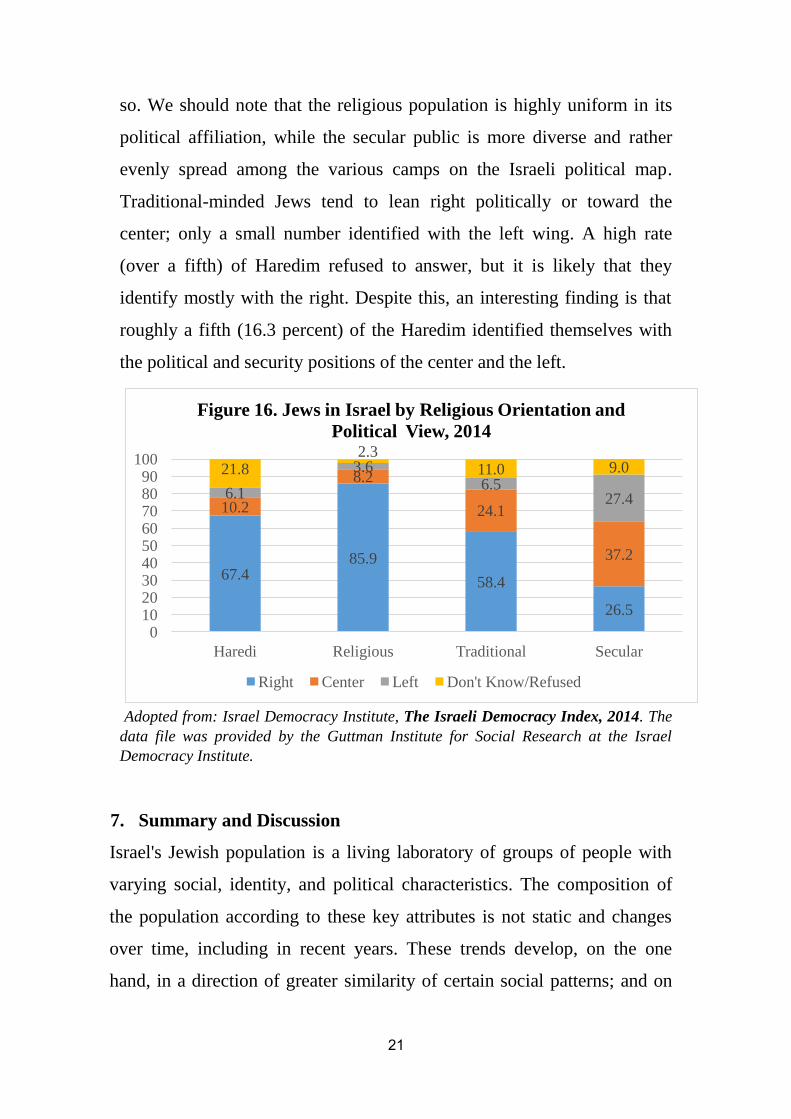
Finally, we examined the extent to which political identification is
associated with religiosity (Figure 16). The main differences found were
between religious and secular: while close to nine of ten religious people
(85.9 percent) placed themselves on the right of the political spectrum,
this was true for only a quarter (26.5 percent) of secular people. At the
same time, only a tenth (11.8 percent) of the religious identified with the
center or the left, while nearly two thirds (64.7 percent) of the secular did
21
so. We should note that the religious population is highly uniform in its
political affiliation, while the secular public is more diverse and rather
evenly spread among the various camps on the Israeli political map.
Traditional-minded Jews tend to lean right politically or toward the
center; only a small number identified with the left wing. A high rate
(over a fifth) of Haredim refused to answer, but it is likely that they
identify mostly with the right. Despite this, an interesting finding is that
roughly a fifth (16.3 percent) of the Haredim identified themselves with
the political and security positions of the center and the left.
67.485.9
58.4
26.5
10.2
8.2
24.1
37.2
6.1
3.66.5
27.4
21.82.3
11.0 9.0
0102030405060708090
100
Haredi Religious Traditional Secular
Figure 16. Jews in Israel by Religious Orientation and
Political View, 2014
Right Center Left Don't Know/Refused
Adopted from: Israel Democracy Institute, The Israeli Democracy Index, 2014. The
data file was provided by the Guttman Institute for Social Research at the Israel
Democracy Institute.
7. Summary and Discussion
Israel's Jewish population is a living laboratory of groups of people with
varying social, identity, and political characteristics. The composition of
the population according to these key attributes is not static and changes
over time, including in recent years. These trends develop, on the one
hand, in a direction of greater similarity of certain social patterns; and on
22
the other, the strengthening of connections between the attributes
emphasizing variations and particularistic patterns of behaviors and
attitudes among defined segments of the population.
Insights into the Jewish society in Israel evince 12 key conclusions:
1) The proportion of Jews (together with those of "no religion") from
the whole of the Israeli population has remained stable over time.
2) Among Jews, the proportion of those born in Israel is growing, and
has become a majority over the foreign-born.
3) Therefore, there is a noted decrease in the proportion of the first and
second generations of European/American and Asian/African
descent in favor of those born in Israel to an Israel-born father.
4) Despite this aforementioned trend, ethnic origin still constitutes an
important part of identity among second and third generation
Israelis.
5) There is an improvement in the educational and economic
achievements of Jewish Israelis, and the gaps once prevalent
between different ethnic origins have diminished.
6) The population proportion of the Haredim has grown, while that of
the traditional Jews has diminished.
7) There is a strong association between ethnic origin and religious
identity: Ashkenazis tend to be both more Haredi and more secular;
Mizrahis/Sephardis tend to be more in the middle of the religious
spectrum and mostly self-identify as traditional.
8) A strong connection was found between education and religious
identification: a large concentration of Haredim are among those
with less than high school diploma or have post-secondary
education, while there is a high proportion of secular Jews among
23
those with academic degrees. A high proportion of those with no
matriculation are traditional.
9) Half of Jewish Israelis identify with right-wing political and security
views, and this has remained stable for the past two decades. In
contrast, the number of those identifying with the center has grown
while that of the left has shrunk.
10) A high rate of those of Asian/African descent identify with the right;
those of European/American descent are more evenly dispersed
among the various political camps. Those of Israeli descent fall
somewhere in the middle.
11) Low educational levels increase the likelihood of identifying with
the right, while higher education tends to reinforce more left-leaning
political and security positions. The connection between education
and political views stands out especially among those with low
educational attainment; those with academic degrees tend to be more
evenly spread among the various political camps.
12) Religious Jews tend to identify more with the right; secular Jews are
more spread out across the political spectrum; and those who are
traditional tend to be more right wing or centrist, but not left wing.
The Jewish society in Israel is moving toward stronger characteristic
similarities, such as nativity status (native born Israelis), education
attainment (high), and political affiliation (center and right). A trend is
emerging of movement toward the poles of religious identity – Haredi on
one end and secular on the other. The traditional middle is weakening.
Concurrently, people grant importance to their ethnic origins. Despite that,
in each ethnic group – Ashkenazi and Sephardi – individuals span the
entirety of the political and religious spectrums (with the notable exception
that those of Middle Eastern backgrounds who are religious or Haredi, who
24
do not identify with the center or left on political or security issues), there
is a positive link between ethnic extraction and religious identity, and
between ethnicity and political identification. For example, eight of every
ten Mizrahim self-identify as traditional/religious/Haredi, while among
Ashkenazim the rate is only 39.5 percent; among Mizrahis, close to two-
thirds tend to be more right wing on political/security matters, and this is
true for slightly more than one-third of Ashkenazim. There is a strong
connection between religious identification and political affiliation.
One could claim that few combine similar identifying features in all social,
religious, and political facets. In other words, group belonging is more
intersecting than congruent. Apparently, contact points and joint interests
of groups from different parts of the society hold the potential for openness
and respect for others, i.e. pluralism. However it seems that a similarity in
one attribute does not always moderate contrasts or differences of
worldview and life style in other areas, which can create inter-group
tensions. Indeed, tensions such as these exist and at times stand out: half of
Jews perceive these tensions in the areas of economics, religion, and
politics as formidable, while a quarter characterizes the tension between
ethnic groups as strong.3
This position paper presents a profile of the Jewish population of Israel
along main social, identity, and political metrics. These characteristics can
offer a point of reference for any attempt to analyze inter-group tensions
and for drawing policy recommendations to reduce them. Impact of the
research will demand examination of how people perceive inter-group
tensions in Israel, the characteristics of people with different assessments
of inter-group tensions, and how similarities between people in some areas
can help mitigate contrasts, disagreements, and tensions in other aspects of
life in Israel.
25
Notes
*I wish to thank Shmuel Rosner, head of the project on Pluralism and Democracy in
Israel, for providing guidance for this document; as well as Dan Feferman, Shlomo
Fischer, Barry Geltman, Inbal Hekman, and Rami Tal for their useful comments.
1 Sicron, Moshe. 2004. Demography: Israel's Population – Characteristics &
Trends. Jerusalem: Carmel. Central Bureau of Statistics, unpublished data.
2Momi Dahan. 2013. "Has the Melting Pot Succeeded?" The Israel Economy 60 (1-
4): 107-152.
3Tamar Herman, Elle Heller, Chanan Cohen, Gilad Be'ery and Yuval Lebel. 2014.
The Israeli Democracy Index 2014. Jerusalem: The Israel Democracy Institute.
Recommended