Claremont CollegesScholarship @ Claremont
Pomona Senior Theses Pomona Student Scholarship
2010
Is LEED a True Leader? Studying the Effectivenessof LEED Certification in Encouraging GreenBuildingMegan M. TurnerPomona College
This Open Access Senior Thesis is brought to you for free and open access by the Pomona Student Scholarship at Scholarship @ Claremont. It has beenaccepted for inclusion in Pomona Senior Theses by an authorized administrator of Scholarship @ Claremont. For more information, please [email protected].
Recommended CitationTurner, Megan M., "Is LEED a True Leader? Studying the Effectiveness of LEED Certification in Encouraging Green Building"(2010). Pomona Senior Theses. Paper 1.http://scholarship.claremont.edu/pomona_theses/1

Is LEED a True Leader?
Studying the Effectiveness of LEED Certification in Encouraging Green Building
Megan Turner
In partial fulfillment of a Bachelor of Arts degree in Environmental Analysis Pomona College, Fall 2010 Claremont, CA Readers: Professor Char Miller Bowen Close, Sustainability Integration Office

Table of Contents
Acknowledgements ..................................................................................................................................iii
Introduction ................................................................................................................................................ 1
The History of LEED ................................................................................................................................. 8
Performance of LEED Buildings ............................................................................................................ 19
LEED at Pomona College: A Lincoln-Edmunds Case Study ............................................................. 36
Conclusion ................................................................................................................................................ 47
Appendix 1: Abbreviations and Technical Terms ............................................................................... 50
Appendix 2: Lincoln-Edmunds Faculty Survey .................................................................................. 51
Appendix 3: LEED-NC Version 2.1 Credits ......................................................................................... 52
Appendix 4: LEED-NC 2009 Sample Checklist ................................................................................... 58
Works Cited .............................................................................................................................................. 61
Table of Figures
Table 1. LEED-NC energy requirements over time .............................................................................. 6
Figure 1. Number of projects LEED certified and registered each year ........................................... 10
Table 2. Percentage of United States using 1999, 2004, and 2007 versions of ASHRAE standard 90.1 as basis for commercial building code .......................................................................................... 18 Figure 2. Measured EUIs (kBtu/sf) by LEED-NC Rating Level ......................................................... 22
Figure 3. Measured EUIs (kBtu/sf) by EAc1 Point Range .................................................................. 22
Figure 4. Distribution of LEED Building Energy Star Ratings .......................................................... 23
Figure 5. Measured versus Proposed Savings Percentages ............................................................... 25
Figure 6. Reported annual energy usage as compared to projected usage and Title-24 limit ...... 43
Figure 7. Reported energy generated annually as compared to projected energy generated ...... 44
Table 3. Approximate end use split for projected and actual energy usage .................................... 45

iii
Acknowledgements
There are many people without whom this thesis would not be possible. First and
foremost, my primary reader and major advisor, Professor Char Miller, read endless drafts and
helped me clarify both my ideas and the language I used to describe them, and his guidance
and support was priceless. My alternate reader Bowen Close was an excellent source of
information about sustainability both on campus and in general, and her many contacts proved
invaluable in collecting data for this project. She referred me to Cathy Turner and Erin Rowe,
who were generous enough to share the findings of their PIER team’s recent assessment of the
Lincoln-Edmunds buildings; getting access to this professional audit even while it is still under
review was an enormous help. Bowen also connected me with the Office of Facilities and
Campus Services’ Mark Matsumoto and Judy Brown, who were kind enough to provide
internal LEED documentation and fill me in on maintenance procedures in the Lincoln-
Edmunds buildings. A special thank-you to those who were willing to fill out surveys about
their thoughts on the subject at hand: Professors William Banks, Raymond Buriel, Deborah
Burke, Tzu-Yi Chen, Richard Lewis, Patricia Smiley, and Suzanne Thompson informed me of
their opinions about Lincoln-Edmunds, but these surveys would have never been sent if not for
the encouragement of Professors Eric Grosfils and Linda Reinen, whom I interviewed in person
early on. Architects Hudson Pruitt, Matt Mori, Steve Berger, and Susan Golden helped me learn
more about LEED from a designer’s perspective, and the latter two helped germinate the idea
for this project through their mentorship in the field of architecture. Finally, my loving family
and friends were an unending source of encouragement (and sanity) when I needed it most.

1
Introduction
Leadership in Energy and Environmental Design – the name itself speaks to what the
LEED certification system hopes to be. As the most popular sustainable building certification
system in the United States (and gaining favor abroad as well), LEED is a metric by which to
judge how “green” a building is. Its best-known form, LEED for New Construction and Major
Renovations (LEED-NC), sets a standard for the design and construction of new or significantly
renovated1 commercial and institutional buildings, ranking them as Certified, Silver, Gold, or
Platinum depending on how many points they accrue during the design process. These points
are divided into several major categories: Sustainable Sites, Water Efficiency, Energy and
Atmosphere, Materials and Resources, Indoor Environmental Quality, Innovation and Design
Process, and Regional Priority.2
1 According to LEED 2009 for New Construction and Major Renovations (page xiv), a “major renovation involves major HVAC renovation, significant envelope modifications, and major interior rehabilitation.”
Each category attempts to address a subset of ecological
concerns that the U.S. Green Building Council (USGBC), the organization which created LEED,
has deemed important in creating sustainable buildings; careful site selection is promoted to
preserve wildlife habitats and virgin land, and points for high albedo (reflectivity) surfaces and
low light pollution help ensure that buildings do not adversely affect their surroundings or
create heat islands. Water-use reduction is emphasized to prevent the depletion of fresh water
sources, while reduction in energy use is encouraged to help slow the progression of global
warming. Similarly, the use of sustainably harvested building materials and the reduction of
2 See Appendix 4 for a sample LEED-NC 2009 Project Checklist.

2
materials in general are rewarded to help preserve natural resources and manage waste output.
Human health is also supported by credits specifying low-VOC (volatile organic compound)
building materials and regulating minimum standards of ventilation. The final two categories
serve as a means of bonus points, either for going above and beyond the requirements of LEED
or for tackling design issues particularly relevant in the site’s geographic region.
For all the good intention these categories embody, just how sustainable can LEED-NC
buildings be when their ratings are entirely based on pre-construction predictions and design
specifications? At the moment post-construction data has no bearing on buildings’ certification
status, which means that structures using more energy or water than expected still retain the
credits they earned during the design and construction phases; thus, a building’s LEED rating is
based entirely on its compliance to design standards, not its actual performance. Furthermore,
LEED’s current design standards require a minimum energy use reduction of only 10% as
compared to the 2007 version of the American Society of Heating, Refrigerating and Air
Conditioning Engineers’ (ASHRAE) Standard 90.1, an energy efficiency standard used as the
basis of many local building codes; previous versions of LEED were even less demanding. The
USGBC defends this lax system by claiming LEED is a design-based brand of ratings intended
to create a market shift toward sustainability, and that low prerequisites help encourage more
developers to try building green for the first time. Former USGBC director Rob Watson has
noted that as a voluntary system, LEED cannot require “minimum performance that is too far
3
beyond the ability of the market to deliver.”3 Unfortunately this free-market approach assumes
an unrealistically optimistic timeline with regards to climate change: as LEED critic Auden
Schendler has said, even obtaining all available points for energy efficiency “frankly isn’t even
enough to solve the climate problem.”4
However, to meaningfully discuss the sustainability of LEED buildings, a clear
definition of the term “sustainable” must be established for use within the scope of this thesis. A
concise meaning is difficult to pin down, and even when solely discussing matters of climate
change and ecological threats a solid definition of sustainability has remained elusive. The
Brundtland Commission’s report Our Common Future defines it thusly: “[s]ustainable
development is development that meets the needs of the present without compromising the
ability of future generations to meet their own needs.”
For a system that touts itself as the leader in energy and
environmental design, LEED’s effect on buildings’ sustainability can be much smaller than
many designers and environmentalists feel is necessary to slow global warming.
5
3 Rob Watson, “LEED Is Not Perfect, But It’s Not Broken,” environmental design + construction, BNP Media, December 23, 2005,
Even this definition encompasses many
issues, all of which the LEED system attempts to address to some degree: global warming, fresh
water depletion, deforestation, depletion of mineral resources, excess waste and pollution, and
human health concerns, among others.
http://www.edcmag.com/CDA/Archives/44b973b231d98010VgnVCM100000f932a8c0____
4 Anya Kamenetz, “The Green Standard?” Fast Company 119 (October 2007), http://www.fastcompany.com/magazine/119/the-green-standard.html
5 Brundtland Commission, “Towards Sustainable Development,” Our Common Future, (Oslo: United Nations World Commission on Environment and Development, 1987), http://worldinbalance.net/intagreements/1987-brundtland.php

4
In this thesis I intend to focus on LEED’s relationship to global climate change and its
contribution to the effort to reduce greenhouse gas emissions. Countless scientific reports have
indicated that a 2°C increase above preindustrial temperatures is the maximum level of climate
change permissible without causing catastrophic damage to global ecological systems – i.e., the
upper bound of sustainability with regard to global warming.6 To stay within this limit,
atmospheric greenhouse gases would need to be stabilized almost immediately, requiring a
cutback to between 50 and 85% of carbon dioxide (CO2) emissions circa 2000 by the year 2050.7
Buildings in the United States represent 39% of the country’s total energy use as well as 39% of
its CO2 emissions – more than either transportation or industry – making architecture an
especially important target for reductions in emissions and energy use.8 LEED was created in
part to help encourage such reductions, as indicated by the USGBC’s summary of “What LEED
Is,” which describes the system as “aimed at improving performance across all the metrics that
matter most: energy savings, water efficiency, CO2 emissions reduction, improved indoor
environmental quality, and stewardship of resources and sensitivity to their impacts.”9
6 Bill Hare and Malte Meinshausen, “The EU, the IPCC and 2oC,” The Institute for European Studies, October 8, 2008,
By using
these metrics, LEED intends to decrease both the embodied and operational CO2 emissions of
http://www.ies.be/files/repo/Bill%20Hare%20081008.pdf
7 Intergovernmental Panel on Climate Change, “The long-term perspective,” Climate Change 2007: Synthesis Report, (Valencia: Intergovernmental Panel on Climate Change, 2007), 67, http://www.ipcc.ch/pdf/assessment-report/ar4/syr/ar4_syr.pdf
8 U.S. Department of Energy, “Why Building Energy Codes?” U.S. Department of Energy Building Energy Codes Program, 15 July 2010, http://www.energycodes.gov/why_codes/
9 U.S. Green Building Council, “Intro - What LEED Is,” U.S. Green Building Council, 2010, http://www.usgbc.org/DisplayPage.aspx?CMSPageID=1988

5
buildings: the emissions caused by constructing the building and those created in operating it
post-construction. Energy usage is the primary source of existing buildings’ operational CO2
emissions; currently, the embodied energy (the energy associated with obtaining, purifying, and
transporting) of tap water usage seems to contribute a negligible amount, though this will no
doubt increase as fresh water becomes a scarcer resource.10
Most existing buildings are relatively energy inefficient, and unfortunately LEED has
not yet effectively incentivized serious efficiency improvements. Even for those LEED buildings
which have earned the maximum number of energy efficiency credits (reducing energy usage
by 48%), operational emissions constitute over 80% of the buildings’ carbon footprints over
their lifetimes.
11
Table 1
For buildings that attained only the bare minimum of energy efficiency under
any LEED-NC versions before 2007 (see ), the sum of operational emissions since the
date of occupancy have likely already surpassed the total emissions caused by the construction
process.12
10 Matthew Sparkes, “Carbon Footprint of Tap Water,” Treehugger, February 8, 2007,
Although these figures assume that energy production remains largely fossil fuel-
based, this is unfortunately a fairly safe assumption for the coming decades; one scientific
report encouraging a shift to renewable energy estimated that “[w]ith sensible broad-based
policies and social changes, it may be possible to convert 25% of the current energy system to
[wind, hydroelectric, and solar] in 10-15 years and 85% in 20-30 years. Absent that clear
http://www.treehugger.com/files/2007/08/carbon_footprin_1.php
11 Engin Ayaz and Frances Yang, “Zero Carbon Isn’t Really Zero: Why Embodied Carbon in Materials Can’t Be Ignored,” DesignIntelligence, September 1, 2009, http://www.di.net/articles/archive/zero_carbon/
12 Ibid.
6
direction, the conversion will take longer, potentially 40-50 years.”13
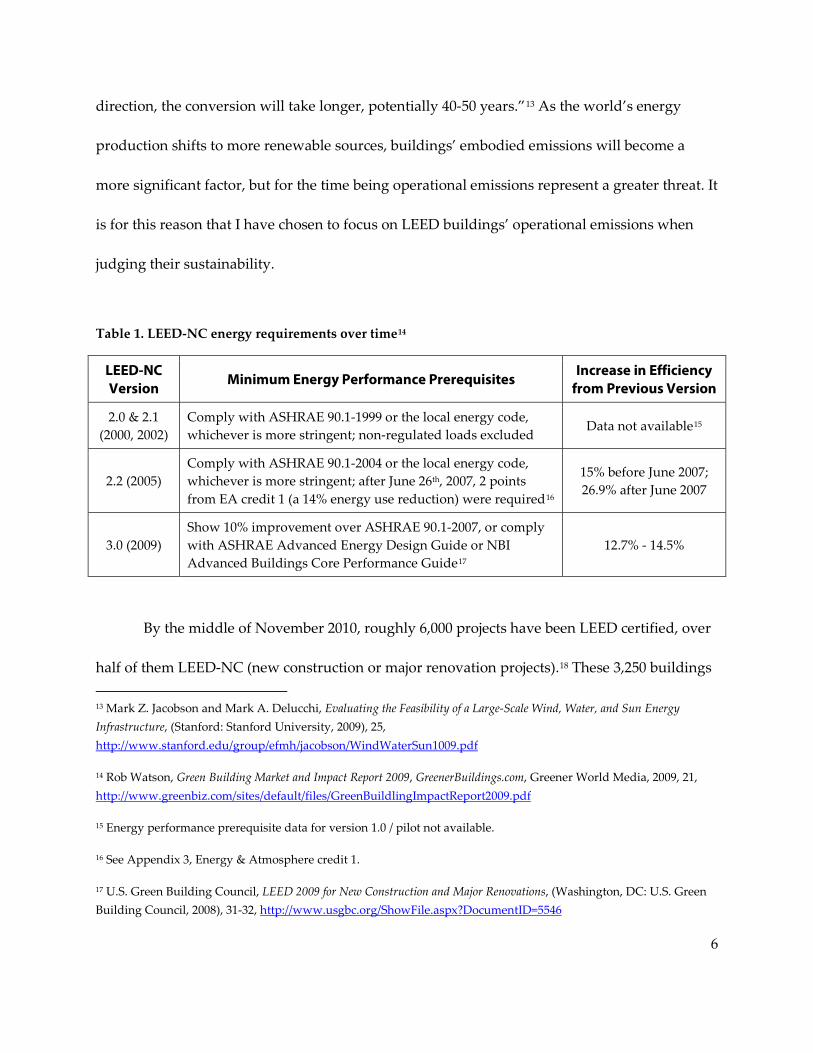
Table 1. LEED-NC energy requirements over time
As the world’s energy
production shifts to more renewable sources, buildings’ embodied emissions will become a
more significant factor, but for the time being operational emissions represent a greater threat. It
is for this reason that I have chosen to focus on LEED buildings’ operational emissions when
judging their sustainability.
14
LEED-NC Version
Minimum Energy Performance Prerequisites Increase in Efficiency
from Previous Version
2.0 & 2.1 (2000, 2002)
Comply with ASHRAE 90.1-1999 or the local energy code, whichever is more stringent; non-regulated loads excluded
Data not available15
2.2 (2005)
Comply with ASHRAE 90.1-2004 or the local energy code, whichever is more stringent; after June 26th, 2007, 2 points from EA credit 1 (a 14% energy use reduction) were required16
15% before June 2007;
26.9% after June 2007
3.0 (2009) Show 10% improvement over ASHRAE 90.1-2007, or comply with ASHRAE Advanced Energy Design Guide or NBI Advanced Buildings Core Performance Guide17
12.7% - 14.5%
By the middle of November 2010, roughly 6,000 projects have been LEED certified, over
half of them LEED-NC (new construction or major renovation projects).18
13 Mark Z. Jacobson and Mark A. Delucchi, Evaluating the Feasibility of a Large-Scale Wind, Water, and Sun Energy Infrastructure, (Stanford: Stanford University, 2009), 25,
These 3,250 buildings
http://www.stanford.edu/group/efmh/jacobson/WindWaterSun1009.pdf
14 Rob Watson, Green Building Market and Impact Report 2009, GreenerBuildings.com, Greener World Media, 2009, 21, http://www.greenbiz.com/sites/default/files/GreenBuildlingImpactReport2009.pdf
15 Energy performance prerequisite data for version 1.0 / pilot not available.
16 See Appendix 3, Energy & Atmosphere credit 1.
17 U.S. Green Building Council, LEED 2009 for New Construction and Major Renovations, (Washington, DC: U.S. Green Building Council, 2008), 31-32, http://www.usgbc.org/ShowFile.aspx?DocumentID=5546
7
have been constructed to LEED standards, which have been generally accepted as the most
popular way to ensure structures are sustainable, and as commercial buildings they will
continue to exist and use energy and water for approximately 70-75 years.19 Construction
factors and material choices can be considered a sunk cost of sorts, since they count as
embodied emissions and therefore not recurring sources of CO2 emission. Because most energy
in the United States is produced using fossil fuels, known for their significant carbon footprint,
reducing a building’s energy usage by 50 to 85% can be seen as a proxy for reducing its CO2
emissions by the same amount. LEED’s method of judging energy use reduction complements
this line of thought, since incorporating renewable energy into a project counts toward energy
savings; this makes the corresponding LEED credits an accurate reflection of the amount of
carbon-intensive energy saved, and thus CO2 emissions prevented. Unfortunately points are
only allotted for savings up to 48% – anything more is considered “exceptional performance
above the requirements set,” even though this falls beneath the bare minimum needed to
remain under the 2°C threshold.20
18 U.S. Green Building Council, “LEED Projects & Case Studies Directory,” U.S. Green Building Council, 2010,
To better understand why LEED’s requirements have set the
bar relatively low, we must first examine the history of the LEED system and the intentions
behind its creation.
http://www.usgbc.org/LEED/Project/CertifiedProjectList.aspx
19 D&R International, Ltd., 2009 Buildings Energy Data Book, (Buildings Technologies Program, Energy Efficiency and Renewable Energy, U.S. Department of Energy: 2009), 3-12, http://buildingsdatabook.eren.doe.gov/docs/DataBooks/2009_BEDB_Updated.pdf
20 USGBC, LEED 2009, 35.
8
The History of LEED
The U.S. Green Building Council, parent organization of the LEED rating systems, was
co-founded in 1993 by an unlikely pair: David Gottfried, a real-estate developer, and Mike
Italiano, an environmental lawyer and analyst. By 1994 the USGBC had organized a committee
consisting of environmentalists and real estate agents, architects, industry representatives, a
building owner, and a lawyer. Richard Fedrizzi, the USGBC’s current president, CEO, and a
founding chairman, explained these staffing choices by noting that “[t]he great majority of
environmental organizations had invested in keeping companies on the other side of the fence.
David [Gottfried] thought that we could do things differently. If we could invite business to the
table, we could develop standards relative to building performance, buy in at the very top, and
be able to transform the marketplace toward sustainable buildings.”21 The committee, headed
by Natural Resources Defense Council senior scientist Rob Watson, worked for three years on
the principles of what would eventually become LEED before receiving funding from the U.S.
Department of Energy’s Federal Energy Management Program; by late 1998, the LEED Pilot
Project Program (LEED Version 1.0) was introduced. After the certification of a handful of
building projects, the ratings system was heavily restructured, and LEED Version 2.0 was born
in March of 2000. Versions 2.1 and 2.2 then followed in 2002 and 2005 respectively, with each
iteration revising and updating credits until they closely resembled those in place today.22
21 Kamenetz, “The Green Standard?”
22 Building Design & Construction, White Paper on Sustainability, Building Design & Construction, November 2003, 7, http://www.usgbc.org/Docs/Resources/BDCWhitePaperR2.pdf.
9
Just as the LEED system was evolving, the corporate strategy of the USGBC continued to
develop over time as well, a process which accelerated when Rick Fedrizzi became CEO in 2004.
Previously a marketing executive at an air conditioning company, Fedrizzi saw flaws in the way
the organization was presenting itself; he felt it was “getting the messaging wrong, leading with
the environmental story. We had to lead with the business case.”23
The business case isn't just that green building saves money on energy. It's that LEED
certification sells buildings to high-end clients and governments, gets architects and
builders sparkling free publicity, and creates a hook for selling new products, materials,
and systems to builders. It's a whole new commercial ecosystem.
As journalist Anya Kamenetz
succinctly described it:
24
This strategy’s success is evident in the rapid expansion of both LEED project registration and
USGBC membership around the time Fedrizzi assumed control. As his profile on the USGBC
website proudly touts, membership has tripled during his time as CEO,
25
23 Kamenetz, “The Green Standard?”
and an analysis of
LEED registration and certification annual totals shows that on average, both numbers have
roughly doubled each year, showing no signs of slowing even during the current economic
recession (see Figure 1).
24 Ibid.
25 U.S. Green Building Council, “Executive Staff,” U.S. Green Building Council, 2010, http://www.usgbc.org/DisplayPage.aspx?CMSPageID=61#sfedrizzi

10
Figure 1. Number of projects LEED certified and registered each year26
Such growth seems counterintuitive during a time when construction activities are at a lull, but
Fedrizzi’s twofold marketing strategy has obviously paid off; as environmentalists (and famed
LEED critics) Randy Udall and Auden Schendler have jokingly described it, the USGBC has
managed to “Oprah-ize” the field of green building, making it “understandable – even sexy – to
the masses.”27
Engineers Jay Stein and Rachel Reiss summed up the quandary of LEED’s celebrity
status quite eloquently: “[i]n making the LEED System simple enough to allow mainstream
industry players to participate in green building projects, much of the critical information that
However, it is this same popularity that has made it an ample target for many
detractors.
26 “Number of LEED Certifications Skyrockets,” Green Building Insider, WPL Publishing Co., Inc. January 7, 2010, http://www.greenbuildinginsider.com/articles/20100105
27 Randy Udall and Auden Schendler, “Leed is Broken – Let’s Fix It,” iGreenBuild.com, August 9, 2005, http://www.igreenbuild.com/cd_1706.aspx
0
2,000
4,000
6,000
8,000
10,000
12,000
2000 2001 2002 2003 2004 2005 2006 2007 2008 2009
Num
ber o
f LEE
D P
roje
cts
Number of LEED Certifications and Registrations Annually
Certified
Registered
11
designers and clients need to make informed choices has been lost in the shuffle.”28
Because new versions of LEED are not retroactive and no follow-up data is required,
these buildings can retain their rankings and all the benefits that come with them, even if they
Fearing this
business-friendly approach would dilute LEED’s credibility, they published a report in
September 2004 entitled Ensuring the Sustainability of Sustainable Design: What Designers Need to
Know About LEED. In this work Stein and Reiss criticized the rating system for various
characteristics which undermine its ability to produce truly green buildings. They began with
version 2.1’s lack of credit weighting, meaning that installing bike racks on a project site carried
the same reward as reducing overall water consumption by 20%. Combined with a lack of
regionalization – weighting credits differently based on needs and issues specific to a project’s
geographic location – this resulted in many project teams aiming for the low-hanging fruit, or
“shopping for points,” racking up credits that were easy to fulfill yet not always relevant to a
building’s geographic or socioeconomic environment (i.e. “cool roofs” in the already-chilly
Rockies, or electric vehicle charging stations in a town with only six electric cars). This could
result in highly-ranked LEED buildings which had not earned a single energy credit beyond the
prerequisites, something that can hardly be considered sustainable with regards to climate
change. It is precisely this situation that worried Stein and Reiss, who felt that the existence of
such buildings diminished the value of LEED overall and weakened its power as a branding
tool, green building standard, and comparative mechanism.
28 Jay Stein and Rachel Reiss, Ensuring the Sustainability of Sustainable Design: What Designers Need to Know About LEED, (Boulder, CO: Platts, 2004), i, http://dada.cca.edu/~mbaum/Readings/07/Ensuring_Sustainability.pdf

12
function no more sustainably than the non-certified structure next door. The authors noted that
“[t]he USGBC sidesteps the issue by insisting that LEED-NC is focused on design, not
implementation. That makes sense, but it’s a distinction that could be lost on the general public,
which will ultimately judge LEED’s efforts.”29 In writing this thesis I have personally
encountered many misconceptions about what LEED means; one classmate was under the
optimistic impression that LEED buildings were carbon-neutral. Since the publishing of Stein
and Reiss’ article LEED has become an international symbol of green building, and as such the
public expects LEED-certified buildings to be green buildings throughout their lifetimes, not
just until the date of occupancy; even if the USGBC tries to shy away from this duty, its rating
system has become the de facto indicator of sustainability both because of its meteoric rise to
prominence and because of the rhetoric used to promote it. Several months after Stein and Reiss
published their paper, Rick Fedrizzi proclaimed that “if it’s not LEED, it’s not green,” a
statement that certainly suggests the creators of LEED consider it the preeminent marker of
green design.30 As the authors argued, the USGBC must ensure that the LEED rating system is a
good indicator of sustainability if they wish it to function as such, since “[t]he value of LEED
certification rests in the credibility it confers on a project. The LEED imprimatur proclaims to
the world that a building’s designers and developers have done a good thing.”31
29 Ibid, 10.
Stein and Reiss’
paper was an important means of voicing early concerns among the architectural and
30 Nadav Malin, “If It’s Not LEED, Can It Still Be Green?” Environmental Building News 13, no. 12 (December 2004), http://www.buildinggreen.com/auth/article.cfm/2004/12/1/If-It-s-Not-LEED-Can-It-Still-Be-Green/
31 Stein and Reiss, Ensuring Sustainability, 12.

13
engineering community, and it paved the way for further constructive criticisms that would
help shape the trajectory of the LEED system.
In August of 2005, a few months before LEED-NC version 2.2 was released, Randy Udall
and Auden Schendler published a critique that rocked the world of green building; their title
boldly stated that “LEED is Broken – Let’s Fix It.” Although they acknowledged the USGBC’s
success in publicizing sustainable design, they were not afraid to castigate it for its flaws,
writing the following scathing summary:
We're concerned that LEED has become costly, slow, brutal, confusing, and unwieldy, a
death march for applicants administered by a soviet-style bureaucracy that makes green
building more difficult than it needs to be, yet has everyone genuflecting at the door to
prove their credentials. The result: mediocre "green" buildings where certification, not
environmental responsibility, is the primary goal … and a discouraged cadre of
professionals who want to build green, but can't afford to certify their buildings.32
In their paper, Udall and Schendler argued that striving for LEED certification is too expensive,
counterproductive, complicated, bureaucratic, and overhyped. While some of the additional
costs of LEED are merited – such as the greater investment in good design, high-quality
materials and appliances, and commissioning to ensure the building is working as intended –
others are unnecessary fees tacked on by the system itself: project registration and certification,
USGBC membership, and the cost of compiling mountains of documentation. The deluge of
32 Udall and Schendler, “LEED is Broken.”
14
paperwork required for certification is a reflection of the bureaucracy inherent in the system:
reviewers can be unnecessarily impersonal and inflexible in their handling of project teams’
submissions, and as the authors discovered in their own green building endeavors, attempts at
meeting the spirit of a credit can shut one out from earning the credit at all. When designing an
office space, Udall and Schendler chose to make all workspaces adjacent to perimeter walls and
windows in order to improve natural lighting and air flow; rather than earning them a credit for
improving the quality of non-perimeter workspaces33 (which they had managed to eliminate),
this indisputable design improvement cost them the credit altogether. In the authors’ words,
“[t]he review process needs to be dramatically streamlined, and injected with a serious dose of
humility and humanity.”34
Similar issues are evident with regards to energy modeling and energy use reduction.
Modeling energy usage, a notoriously complicated, difficult, and sometimes expensive
endeavor, is one of several options used within LEED 2009 to ascertain how many points a
building can earn for optimizing energy performance.
35 Udall and Schendler instead maintained
that “modeling is most valuable as a design tool … Intelligent modeling, early in the design
process, can save lots of energy, money, and pollution.”36
33 See Appendix 3, Indoor Environmental Quality credit 6.2.
Unfortunately at that time, energy
modeling was required at the end of the design process as a predictive tool for obtaining energy
34 Udall and Schendler, “LEED is Broken.”
35 See Appendix 3, Energy & Atmosphere credit 1.
36 Udall and Schendler, “LEED is Broken.”

15
performance credits: by estimating the energy usage of a future building and comparing that to
an estimated “baseline” budget building, project teams could arrive at their supposed energy
savings and be rewarded accordingly – all without metering a single kilowatt in the real world.
Furthermore, at the time the authors were writing, this energy use prediction only took into
account “regulated loads,” excluding “plug loads” – any energy usage other than HVAC,
lighting, and water heating. As a result, any appliances outside the realm of “regulated load”
had no bearing on a building’s energy usage rating, even if they created tremendous energy
savings (or energy hogs); fortunately this oversight has since been addressed to some extent.
Counterintuitive prioritizing within LEED version 2.1 was mirrored by the fact that
credits remained unweighted even after the introduction of version 2.2. This contributed in part
to what Udall and Schendler described as “point mongering” and “LEED brain” – two design
maladies encouraged by the LEED system (though to a lesser extent with LEED 2009’s weighted
credits). The former is “what happens when the design team becomes obsessively focused on
getting credits, regardless of whether they add environmental value … because there is prestige
in getting a high LEED rating,” while the latter is “what happens when the potential PR benefits
of certification begin driving the design process.”37 As Stein and Reiss described earlier,
designers were rewarded by playing to the system, and because LEED certification has acquired
such prestige, “gaming a final few credits can be worth its weight in LEED Gold.”38
37 Ibid.
38 Ibid.
16
Udall and Schendler’s final, somewhat pessimistic point was that the financial benefits
of green buildings may be overstated. Although studies have shown that sustainable buildings
can result in increased worker productivity and reduced absenteeism, these qualities are
“difficult to quantify … [and] don’t impact first costs,” and their relative value depends on the
perspective of the developer.39 Similarly, the financial benefits of more efficient buildings are
often general, societal benefits that will only begin to pay back the owner’s investment in the
long term. In today’s world of rapid construction and short-term occupancy, such returns on
investments may not accrue fast enough to sway developers. Nonetheless, the environmental
benefits of green design are very real, and LEED can be a helpful tool to encourage a shift
toward sustainability. The authors closed with the suggestion that true sustainability may
require a prescriptive system of requirements and specifications, rather than the performance-
based certification approach LEED takes. However, they concluded that because “we need
green building to triumph, to take over our culture … we need LEED – or something like it – to
accelerate that transition,” and they hoped that their tough-love criticism could help reform and
reinvent the system.40
Udall and Schendler’s critical analysis of LEED drew a lot of attention in the world of
green building, prompting a response from the “father of LEED” himself, Rob Watson (one of
the founding members of the USGBC). Watson wrote that he had “smiled a sad smile and
nodded [his] head in agreement with about 80 percent of what the authors were saying,” but
39 Ibid.
40 Ibid.

17
that because of the continual evolution of LEED and the introduction of version 2.2, the article
“essentially was obsolete the day it was published.”41
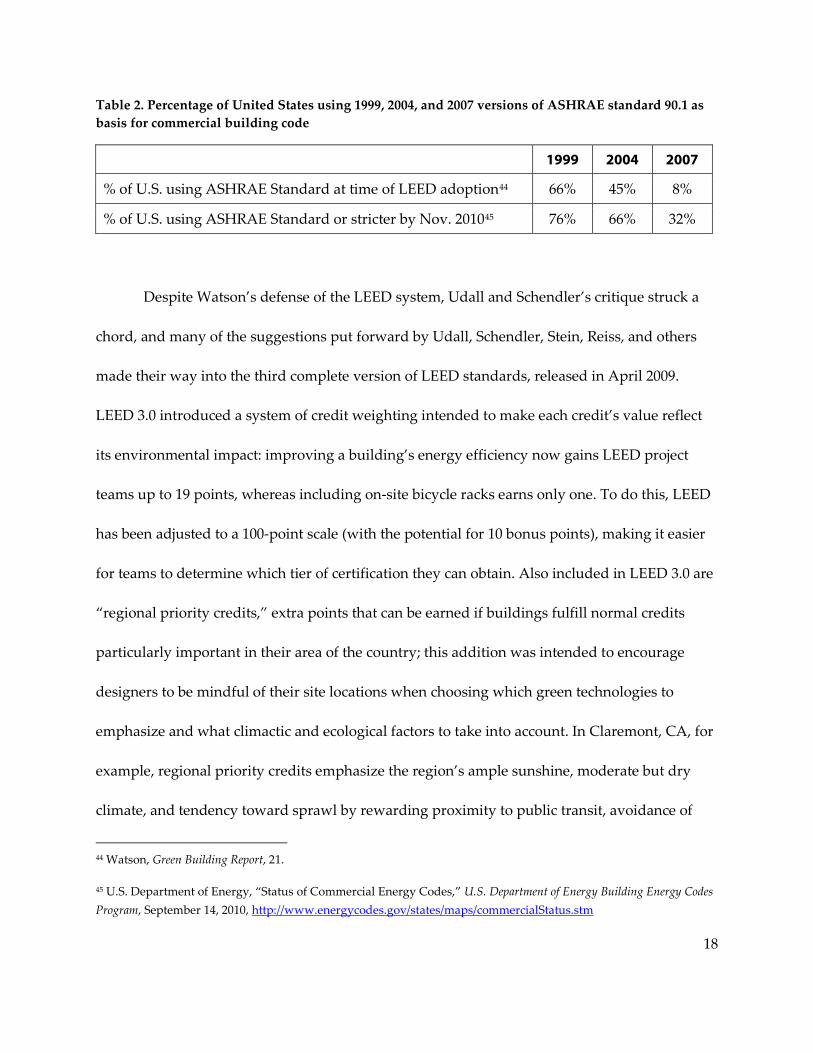
Table 2
In his response he cited the “streamlining
[of] LEED’s documentation and certification requirements” as well as a newly introduced
online workspace for project teams as two ways in which the certification process was
becoming easier to navigate. He also defended LEED’s energy-efficiency standards, saying that
version 2.2 and newer energy standards released by ASHRAE fixed many of the complaints
targeted at its Energy and Atmosphere section, and that ASHRAE should not be viewed as
“national standard practice,” but rather an above-average metric of energy performance (see
). He asserted that “we need to abandon the 1980s view that operational energy is the
only relevant parameter; it’s about 60 percent of the equation,” with all of the other elements
prescribed by LEED contributing to a building’s carbon footprint.42 (While this statement is
quite true during the construction phase and significantly affects a building’s embodied energy,
many of these factors become sunk emissions costs that are proportionately less significant
during a building’s meaningful life, as described earlier.) With this in mind, Watson closed his
rebuttal with a quote from Gandhi to sum up the USGBC’s philosophy of encouraging market
shifts rather than mandating sweeping changes: “A leader who is 100 paces ahead of his
followers is revered and called a visionary; one who is a thousand paces ahead is stoned and
called a heretic.”43
41 Watson, “LEED Is Not Perfect.”
42 Ibid.
43 Ibid.
18
Table 2. Percentage of United States using 1999, 2004, and 2007 versions of ASHRAE standard 90.1 as basis for commercial building code
1999 2004 2007
% of U.S. using ASHRAE Standard at time of LEED adoption44 66% 45% 8%
% of U.S. using ASHRAE Standard or stricter by Nov. 201045 76% 66% 32%
Despite Watson’s defense of the LEED system, Udall and Schendler’s critique struck a
chord, and many of the suggestions put forward by Udall, Schendler, Stein, Reiss, and others
made their way into the third complete version of LEED standards, released in April 2009.
LEED 3.0 introduced a system of credit weighting intended to make each credit’s value reflect
its environmental impact: improving a building’s energy efficiency now gains LEED project
teams up to 19 points, whereas including on-site bicycle racks earns only one. To do this, LEED
has been adjusted to a 100-point scale (with the potential for 10 bonus points), making it easier
for teams to determine which tier of certification they can obtain. Also included in LEED 3.0 are
“regional priority credits,” extra points that can be earned if buildings fulfill normal credits
particularly important in their area of the country; this addition was intended to encourage
designers to be mindful of their site locations when choosing which green technologies to
emphasize and what climactic and ecological factors to take into account. In Claremont, CA, for
example, regional priority credits emphasize the region’s ample sunshine, moderate but dry
climate, and tendency toward sprawl by rewarding proximity to public transit, avoidance of
44 Watson, Green Building Report, 21.
45 U.S. Department of Energy, “Status of Commercial Energy Codes,” U.S. Department of Energy Building Energy Codes Program, September 14, 2010, http://www.energycodes.gov/states/maps/commercialStatus.stm

19
creating heat islands, water conservation, use of renewable energy (such as solar power), and
daylighting. Although all of these modifications to LEED were welcomed by its supporters and
critics alike, the certification system’s ability to produce truly sustainable buildings is still
subject to question.
Performance of LEED Buildings
The most straightforward way to ascertain LEED buildings’ level of sustainability is by
analyzing their performance. In March of 2008 the New Buildings Institute (NBI) did just that;
in a comprehensive survey of data supplied from 121 buildings certified under LEED-NC
version 2, NBI (funded by the USGBC and the Environmental Protection Agency) conducted the
first-ever large-scale analysis of the energy efficiency of LEED-NC buildings.46 552 buildings
were certified LEED-NCv.2 as of December 2006, constituting 75 percent of total certifications at
the time and therefore providing “the largest coherent subset on which to base energy
analysis.”47 Because of this, the NBI invited all NCv.2 buildings at the time to participate in the
study, receiving positive responses from about half. However, half of this group was unable to
participate for technical reasons – such as lacking a full year’s worth of energy usage data – and
so the final sample size was 22% of total LEED-NCv.2 certified buildings.48
46 Cathy Turner and Mark Frankel, Energy Performance of LEED for New Construction Buildings, U.S. Green Building Council, New Buildings Institute, 2008,
Despite the nature of
their selection, these buildings were reasonably representative of NCv.2 buildings in terms of
http://www.usgbc.org/ShowFile.aspx?DocumentID=3930
47 Ibid, 7-8.
48 Ibid, 33.

20
size distribution, climate zone, and certification level, though skewed in favor of office
buildings when divided by building type. These 121 buildings reported one year of energy use
data, excluding credit from on-site energy production and including “plug loads;” this data was
then compared to the energy usage averages from the 2003 Commercial Building Energy
Consumption Survey (CBECS), a “national survey of building energy characteristics completed
every four years by the federal Energy Information Administration.”49 This comparison
revealed that the LEED buildings studied had a median Energy Use Intensity (EUI, a calculation
of kBtu/ft2) that was 24% below the average EUI from CBECS.50
The results show a level of spread within building types and certification levels that
can’t be explained solely by the building characteristics data available. While differences
in averages suggest possible relationships, the variance in the data is too large for
statistically significant confidence in the size of those differences.
This finding is rather
underwhelming in light of the 50-85% reduction required to prevent significant climate change,
and unfortunately its statistical usefulness is limited as well. Upon examining individual LEED
buildings’ EUIs, the authors discovered:
51
This degree of variance necessitated the use of median values rather than means when
describing the averages for the LEED dataset, in part because of a subset of outliers which
Turner and Frankel dubbed “High Energy Type” buildings. These buildings, which accounted
49 Ibid, 2.
50 Ibid, 13-14.
51 Ibid, 10.

21
for 17% of the LEED dataset, were primarily used as labs and datacenters, which require more
operating energy than typical commercial buildings (and actually used nearly two and one-half
times more energy than predicted in their designs, on average).52 In comparison, the CBECS
dataset consisted of only 11% High Energy Type buildings, in addition to 8% low-energy
structures such as warehouses and vacant buildings, none of which were present in the LEED
dataset.53 Because of this disparity, Turner and Frankel chose to exclude the High Energy Type
buildings from the remainder of their in-depth analysis, studying only what they termed
“Medium Energy Type” buildings, or those with more typical energy usage. The authors then
compared these buildings using various categorizations, starting with average EUIs for
different levels of LEED certification (see Figure 2). As expected, more highly ranked buildings
performed better, with certified projects having a 26% lower average EUI than CBECS’ average,
while silver projects’ average EUI was 32% lower. Gold and platinum buildings (combined into
one category because of the scarcity of platinum-ranked respondents) had an average EUI 44%
lower than CBECS’, a reduction that is nearing Architecture 2030’s interim goal of 50% – also
the low end of what could be considered truly sustainable. As before, however, the authors
cautioned that although “[t]his suggested trend in medians is encouraging … the wide scatter
within each level shows significant further room for improvement.”54
52 Ibid, 28.
This same tendency was
evident in an analysis of the buildings by the number of Energy & Atmosphere credit 1 (EAc1)
53 Watson, Green Building Report, 22.
54 Turner and Frankel, Energy Performance of LEED, 16.

22
points they obtained (see Figure 3): those which earned 8 to 10 points had a noticeably lower
median EUI than those which earned only 2 or less, but each category’s range was wide enough
to overlap significantly. Categorizing buildings by climate zone revealed that those in mixed,
cool, or cold climates had median EUIs 38% to 49% lower than their CBECS counterparts, but
buildings in warm and hot climates showed no improvements over CBECS structures in their
regions; this could suggest that energy efficiency is harder to achieve in hotter locales, a topic on
which Turner and Frankel recommended further study.55
Figure 2. Measured EUIs (kBtu/sf) by LEED-NC Rating Level56
Figure 3. Measured EUIs (kBtu/sf) by EAc1 Point Range57
55 Ibid, 17.
56 Ibid, 16. Unless otherwise noted, all graphs in this section are reproduced from the original report with permission from the authors.
57 Ibid, 17.
23
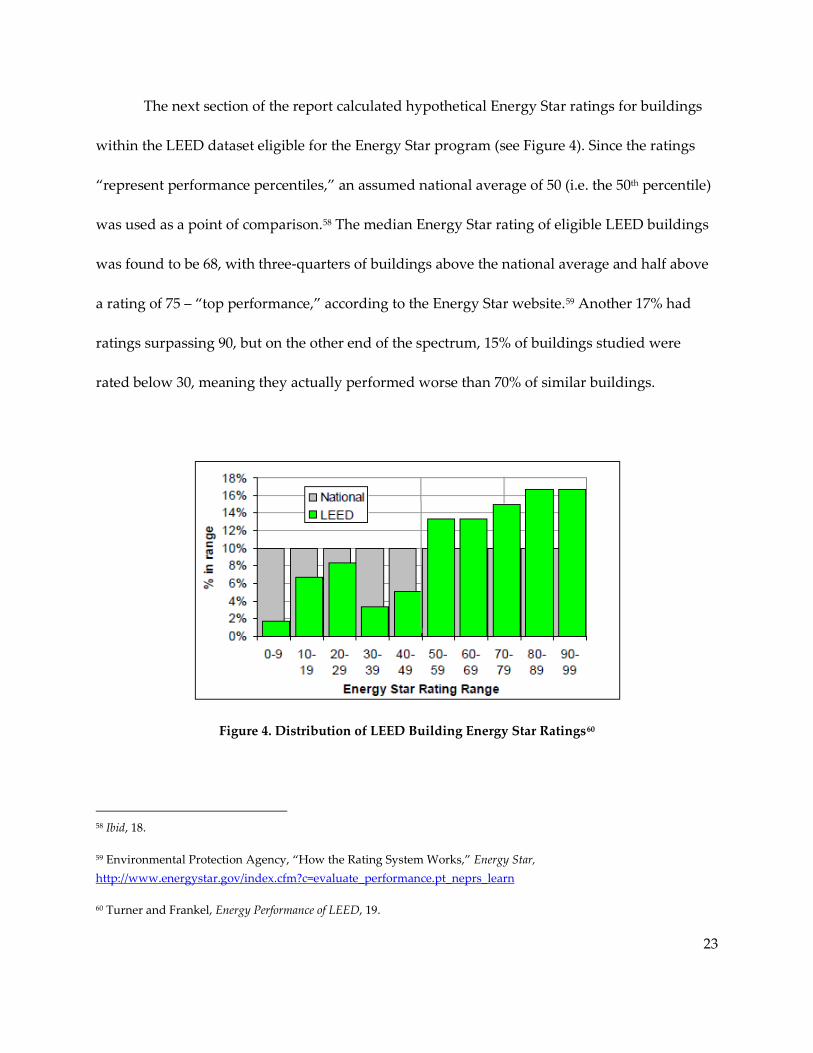
The next section of the report calculated hypothetical Energy Star ratings for buildings
within the LEED dataset eligible for the Energy Star program (see Figure 4). Since the ratings
“represent performance percentiles,” an assumed national average of 50 (i.e. the 50th percentile)
was used as a point of comparison.58 The median Energy Star rating of eligible LEED buildings
was found to be 68, with three-quarters of buildings above the national average and half above
a rating of 75 – “top performance,” according to the Energy Star website.59
Another 17% had
ratings surpassing 90, but on the other end of the spectrum, 15% of buildings studied were
rated below 30, meaning they actually performed worse than 70% of similar buildings.
Figure 4. Distribution of LEED Building Energy Star Ratings60
58 Ibid, 18.
59 Environmental Protection Agency, “How the Rating System Works,” Energy Star, http://www.energystar.gov/index.cfm?c=evaluate_performance.pt_neprs_learn
60 Turner and Frankel, Energy Performance of LEED, 19.

24
Some of these buildings were even revealed to be using more energy than their project baseline
figures (maximum energy usage allowed by building standards), a fact which Turner and
Frankel uncovered in their analysis of measured versus proposed energy use. The authors
prefaced their comparisons to design proposals by noting:
[M]ost professionals in the energy modeling industry are careful to adopt caveats in
their predictions or emphasize that modeling is a tool to identify relative energy
performance, not to predict actual energy use. Despite these caveats, modeling is widely
used to estimate actual future energy use … Therefore, the predictive accuracy of energy
modeling in terms of both relative and actual energy performance becomes critical to the
building industry.61
On average, the authors found that the ratio of measured EUI to predicted EUI was 92%,
suggesting that average EUI numbers from energy modeling are fairly reliable. Furthermore,
average measured energy savings below project baseline figures were 28%, which is close to the
average of 25% projected during the design phase, as well as the 24% savings found when
comparing the LEED and CBECS averages. However, the variation in performance across the
dataset suggests that on a smaller scale, energy modeling is not nearly as reliable (see Figure 5);
as the authors summarized:
[T]he accuracy of individual energy use predictions is very inconsistent … [T]his
suggests energy modeling is a poor predictor of project-specific energy performance.
61 Ibid, 20-21.

25
Measured EUIs for over half the projects deviate by more than 25% from the design
projections, with 30% significantly better and 25% significantly worse … The
conclusions are similar for relative savings predictions on an individual project basis …
Fully 25% of the buildings show savings in excess of 50%, well above any predicted
outcomes, while 21% show unanticipated measured losses, i.e., measured energy use
exceeding the modeled code baseline.62
Figure 5. Measured versus Proposed Savings Percentages63
To further investigate this disparity, Turner and Frankel turned to projects’ calculated
baseline figures. Since these estimates are used as a standard of comparison to determine LEED
62 Ibid, 22-23.
63 Ibid, 24.

26
buildings’ energy savings over similar non-LEED buildings, their accuracy can have a large
effect on how many points a project is awarded for EAc1. The authors found that even when
considering only office buildings, baseline EUIs had a “factor of four variability within a single
project type,” suggesting that their methods of calculation are in dire need of improvement and
standardization.64 Further complicating this uncertainty is the fact that average baseline EUIs
for building types did not always correspond to the average EUIs for building type categories
within CBECS, indicating that they may not be good representatives of the buildings they
intend to approximate. Another result of this inaccurate prediction is that “[p]rojects that set
higher energy performance targets seem to be held to a higher baseline standard from which to
measure improvement,” likely because of the way in which the ASHRAE 90.1 standard – the
basis for baseline calculation – determines what could be considered a similar building.65 For
example, a building using a geothermal heat pump for its HVAC needs would have to be
compared to a baseline using this same technology, rather than the more commonly used but
less efficient air-source heat pumps. As the authors warned, “this protocol may represent a
disincentive for the adoption of more efficient mechanical systems,” since a higher baseline
could result in less points from EAc1.66
64 Ibid, 25-26.
Turner and Frankel closed the report with a short
discussion of other energy-related credits (which had “little conclusive impact on energy
performance”) and a survey of building occupants (which showed either positive or neutral
65 Ibid, 26-27.
66 Ibid, 27.
27
opinions on comfort, productivity, and overall satisfaction), summarizing their earlier findings
and suggestions in their conclusion.67
Likely because of its objective and even-handed nature – and its position as the only
comprehensive study of LEED-NC energy efficiency to date – the Energy Performance of LEED
report has been used to support the arguments of boosters and detractors alike. One of the most
outspoken critics of the study, the LEED system, and the USGBC as a whole has been Henry
Gifford, an energy-efficiency specialist working in New York City. Gifford wrote an especially
negative response to the Energy Performance report, taking issue with much of its methodology.
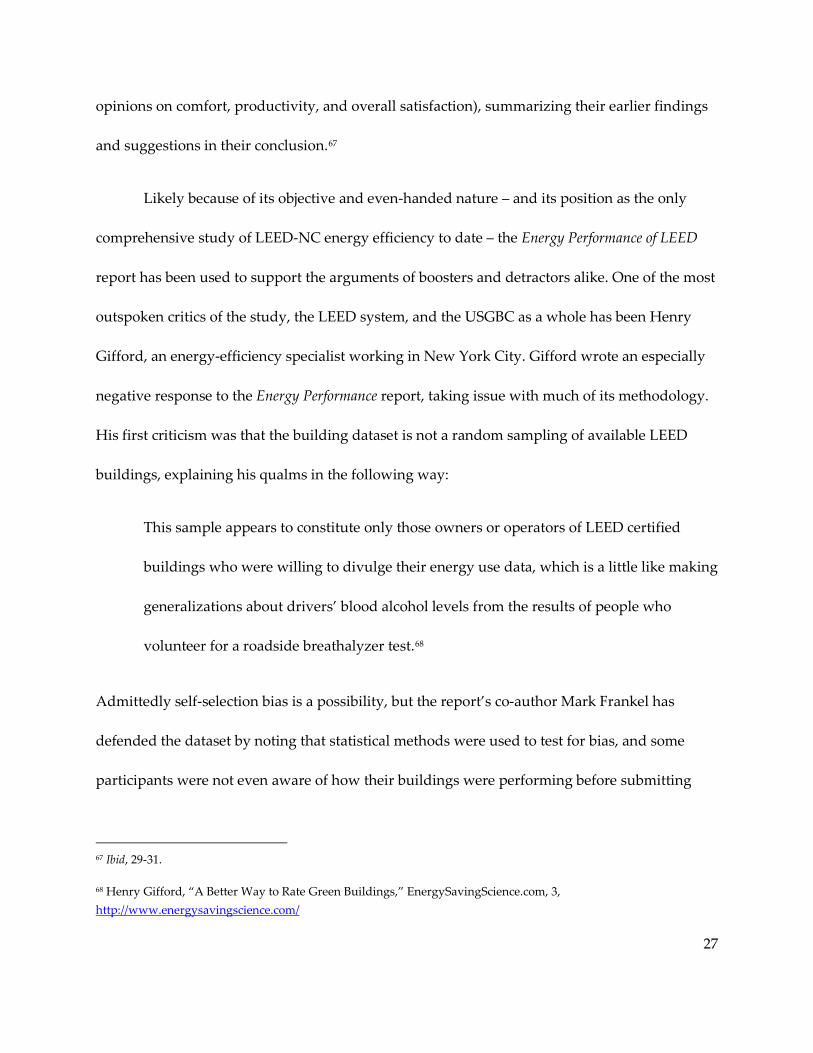
His first criticism was that the building dataset is not a random sampling of available LEED
buildings, explaining his qualms in the following way:
This sample appears to constitute only those owners or operators of LEED certified
buildings who were willing to divulge their energy use data, which is a little like making
generalizations about drivers’ blood alcohol levels from the results of people who
volunteer for a roadside breathalyzer test.68
Admittedly self-selection bias is a possibility, but the report’s co-author Mark Frankel has
defended the dataset by noting that statistical methods were used to test for bias, and some
participants were not even aware of how their buildings were performing before submitting
67 Ibid, 29-31.
68 Henry Gifford, “A Better Way to Rate Green Buildings,” EnergySavingScience.com, 3, http://www.energysavingscience.com/
28
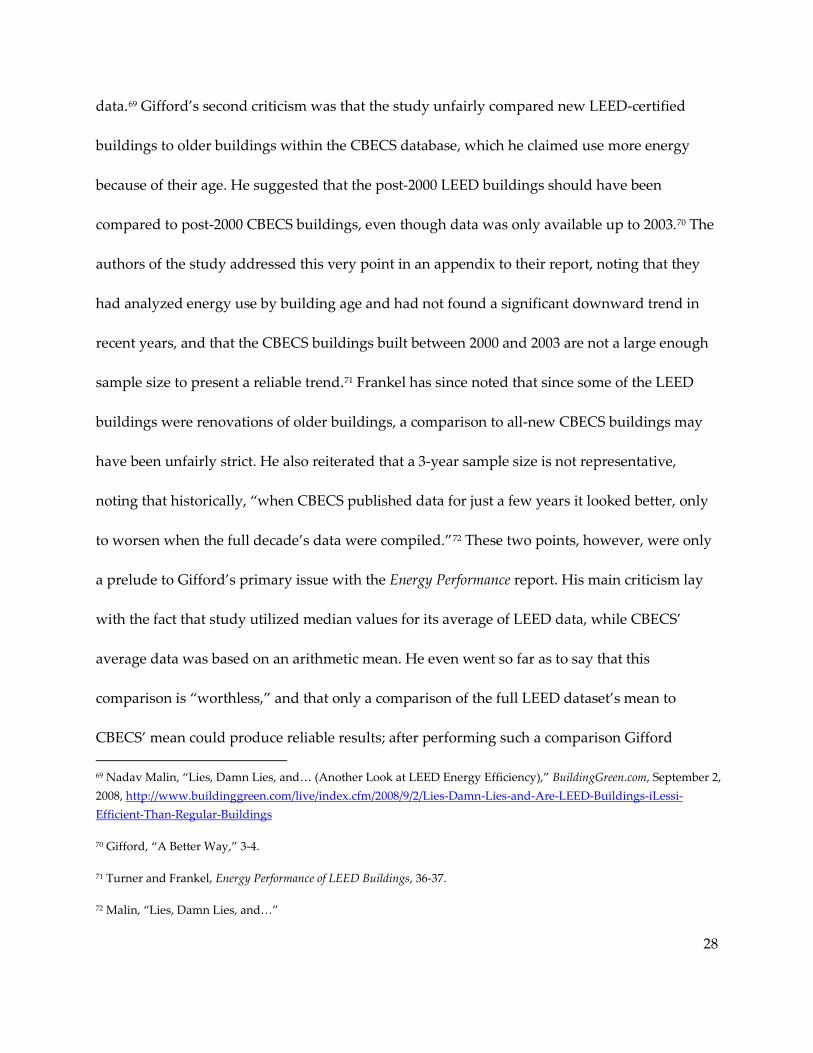
data.69 Gifford’s second criticism was that the study unfairly compared new LEED-certified
buildings to older buildings within the CBECS database, which he claimed use more energy
because of their age. He suggested that the post-2000 LEED buildings should have been
compared to post-2000 CBECS buildings, even though data was only available up to 2003.70 The
authors of the study addressed this very point in an appendix to their report, noting that they
had analyzed energy use by building age and had not found a significant downward trend in
recent years, and that the CBECS buildings built between 2000 and 2003 are not a large enough
sample size to present a reliable trend.71 Frankel has since noted that since some of the LEED
buildings were renovations of older buildings, a comparison to all-new CBECS buildings may
have been unfairly strict. He also reiterated that a 3-year sample size is not representative,
noting that historically, “when CBECS published data for just a few years it looked better, only
to worsen when the full decade’s data were compiled.”72
69 Nadav Malin, “Lies, Damn Lies, and… (Another Look at LEED Energy Efficiency),” BuildingGreen.com, September 2, 2008,
These two points, however, were only
a prelude to Gifford’s primary issue with the Energy Performance report. His main criticism lay
with the fact that study utilized median values for its average of LEED data, while CBECS’
average data was based on an arithmetic mean. He even went so far as to say that this
comparison is “worthless,” and that only a comparison of the full LEED dataset’s mean to
CBECS’ mean could produce reliable results; after performing such a comparison Gifford
http://www.buildinggreen.com/live/index.cfm/2008/9/2/Lies-Damn-Lies-and-Are-LEED-Buildings-iLessi-Efficient-Than-Regular-Buildings
70 Gifford, “A Better Way,” 3-4.
71 Turner and Frankel, Energy Performance of LEED Buildings, 36-37.
72 Malin, “Lies, Damn Lies, and…”
29
declared that LEED buildings actually use 29% more energy than their CBECS counterparts.73
However, Gifford’s methods have statistical problems of their own: for a dataset with such a
wide spread, a median presents a much more reliable average value than a mean, given the
mean’s tendency to be skewed by large outlying numbers. Furthermore, the CBECS dataset
contains fewer High Energy Type buildings and more low-energy buildings, as described
before. While measuring LEED’s median against CBECS’ mean creates an admittedly less-than-
ideal comparison, Turner and Frankel’s use of the median to describe the LEED buildings’
average is the more statistically valid choice, as verified by their peer reviewers from various
respected institutions. Rob Watson has even noted that CBECS could benefit from using median
values as well, given the level of variability within its own dataset.74
Despite Gifford’s questionable attempts at debunking the Energy Performance study, his
response’s more general critiques of LEED are hard to refute. As an energy-efficiency specialist,
he was especially irked by LEED’s method of awarding points for energy savings modeling,
writing that “attention is focused on the appearance of energy efficiency, not its accomplishment.
The LEED system does this by rewarding designers for predicting that a building will save
energy, not for proving that a building actually saves energy.”
75
73 Gifford, “A Better Way,” 4.
As an example of this focus on
appearance, Gifford mentioned the popularity of solar panels on buildings. As one of the few
visible markers of a building’s sustainable nature, solar panels present a “perfect photo
74 Watson, Green Building Report, 22.
75 Gifford, “A Better Way,” 5.
30
opportunity, which makes them a publicist’s dream.”76 (After all, one of the economic draws of
LEED certification is its generation of positive publicity, as explained earlier.) To reiterate this
point Gifford described a residential high-rise in New York City that has “solar panels mounted
vertically on its facades where everyone can see them,” a design choice that drastically reduces
their energy output; even worse, these panels are not facing due south (the direction that
receives most sunlight in the Northern Hemisphere): some are facing southwest, while others
are facing northwest, and one group of panels is even blocked from the sun entirely by
unfortunately placed rooftop equipment.77 (This building, paradoxically named The Solaire, is
rated Gold under LEED-NCv.2, and it uses its “green building” publicity to attract the
wealthiest residents of Battery Park City.78
Rated buildings should mount award plaques with removable screws, because each year
the building’s energy bills would have to be reviewed. Buildings that did not continue to
perform would lose their ratings, and those that performed well could continue to have
something to be proud of.
) Gifford’s general argument was that LEED cannot
reliably produce energy-efficient buildings, since LEED ratings are not based on real-world
energy efficiency. He stated:
79
76 Ibid, 5.
77 Ibid, 6-7.
78 Steven Winter Associates, Inc., “Battery Park City’s Gold Standard: The Solaire Residential High Rise,” www.swinter.com, http://www.swinter.com/services/documents/Solaire_Case_Study.pdf
79 Gifford, “A Better Way,” 8-9.
31
Ironically enough, this notion of rescindable ratings was considered from the early days of
LEED, but it was rejected both for its impracticality and its punitive nature.80 However, the
concept is working its way into the system, since LEED 2009 now requires buildings from all
LEED systems (not just NC) to report energy and water use values for the first five years of
occupancy, though no definite penalty is in place for buildings that underperform.81 This new
requirement addresses multiple issues in that it creates a ready-made data pool for future
studies of LEED’s energy efficiency in addition to creating a sense of responsibility for buildings’
energy usage.82 The USGBC’s accompanying Building Performance Partnership will monitor
usage data and “help underachieving projects identify and fix performance problems,”
hopefully fixing energy and water use hemorrhages without actually penalizing participants.83
On October 8, 2010, Gifford filed a class-action lawsuit against the USGBC and many of
its founding members. The suit alleges that the USGBC’s claims of improved energy efficiency
are “false and intended to mislead the consumer and monopolize the market for energy-
efficient building design,” using Gifford’s critique of the Energy Performance report as evidence
However, this was only a small step in remedying LEED’s relatively low energy efficiency, and
it was not able to silence Henry Gifford’s accusations.
80 Malin, “Lies, Damn Lies, and…”
81 USGBC, LEED 2009, xvii.
82 Watson, Green Building Report, 19.
83 Tristan Roberts and Allyson Wendt, “USGBC Expands Data Collection from LEED Buildings,” BuildingGreen.com, August 20, 2010, http://www.buildinggreen.com/auth/article.cfm/2010/8/20/USGBC-Expands-Data-Collection-from-LEED-Buildings/

32
of subterfuge.84 The suit invokes the Sherman Anti-Trust Act and the Lanham Act, among
others, in accusing the USGBC of “deceptive marketing and unfair competition” as well as
“deceptive business practices and false advertising,” and it demands that the organization
“cease deceptive practices and pay $100 million in compensation to victims, in addition to legal
fees.”85 The plaintiffs listed include Gifford himself, “owners who paid for LEED certification on
false premises, professionals like Gifford whose livelihoods have allegedly been harmed by
LEED, and taxpayers whose money has subsidized LEED buildings,” though the extent to
which Gifford’s livelihood has been harmed is subject to dispute.86 Gifford himself states that
“[n]obody hires [him] to fix their buildings…[because u]nless you’re a LEED AP you’re not
going to get work,” but green building lawyer Shari Shapiro suspects that Gifford may have
actually benefited from the increased environmental awareness LEED has engendered;
nonetheless, Gifford asserts that LEED’s supposed dishonesty is detrimental to the world as a
whole, “harming the environment by leading consumers away from using proven energy-
saving strategies” (like those he employs in his own practice).87
While Gifford’s accusations of monopoly and deception are doubtful at best, his
wariness of LEED’s penetration into building legislation is somewhat merited, as explained in a
report by public policy professor David M. Hart, who wrote:
84 Tristan Roberts, “USGBC, LEED Targeted by Class-Action Suit,” BuildingGreen.com, October 14, 2010, http://www.buildinggreen.com/auth/article.cfm/2010/10/14/USGBC-LEED-Targeted-by-Class-Action-Suit/
85 Ibid.
86 Ibid.
87 Ibid.

33
LEED is widely perceived to be…a ‘perfect example of an energy/environment standard
that did not come from government down, but from society up.’ Yet government
agencies, in their roles as buyers and owners of buildings, as land use and taxing
authorities, and as regulators of construction, undoubtedly helped to catalyze LEED’s
explosive growth in the past decade.88
He went on to note that “[i]n just one short decade, aided by a push from all levels of
government, USGBC has defined ‘green building’ in the U.S. To the extent that LEED mandates
spread, it will have attained a de facto position as national legislator of building standards.”
89
88 David M. Hart, Don’t Worry About the Government? The LEED-NC “Green Building” Rating System and Energy Efficiency in U.S. Commercial Buldings, MIT Industrial Performance Center, (Cambridge, MA: Massachusetts Institute of Technology, 2009), 2-3,
Hart detailed how the USGBC was founded at a time when the government “went to sleep for
fifteen years,” neglecting the topic of energy efficiency after several ineffective attempts at
efficiency legislation. In 1977 Congress had established the Department of Energy (DOE) and
charged it with the task of developing building standards “designed to achieve the maximum
practicable improvements in energy efficiency,” but upon their implementation the backlash
was so strong that they were no longer enforced. In 1982 DOE sought to strengthen its efficiency
standards, choosing to contract ASHRAE for the job rather than face a second round of censure.
DOE asked ASHRAE to revise its 90.1 standard for use as a basis of building codes, leading to
the creation of ASHRAE standard 90.1-1989, and in 1992 Congress required states to adopt it as
the basis of their local building codes (implementing any future revisions DOE deemed
http://web.mit.edu/ipc/research/energy/pdf/EIP_09-001.pdf
89 Ibid, 13.

34
necessary).90 However, no disciplinary measures were put in place for states that failed to create
a 90.1-based building code, and even today nine states (including places like Alaska, Wyoming,
and Arizona) lack a statewide code altogether.91
These halfhearted attempts at energy efficiency are typical of the post-energy-crisis era,
during which “carbon emissions of the commercial building sector in North America grew
about 25% faster than carbon emissions of the overall economy,” and building efficiency
“remained unchanged from 1986 to 1999.”
92 In this environment the USGBC’s founders saw a
niche waiting to be filled, and with their fortuitous timing combined with keen business sense,
the LEED system began working its way into government building requirements even before
version 2.0 was released. As Hart revealed, “[o]ne of the first adopters of LEED-NC was the U.S.
General Services Administration (GSA), which manages much of the federal government’s real
estate portfolio. The federal government is the nation’s largest real estate owner and lessee.”93 In
January of 2000 GSA required all of its new buildings to be LEED certified, and many other
governmental agencies – federal, state, and local – followed suit. By the end of 2005 “41% of all
LEED-NC registrations … were government buildings.”94
90 Ibid, 4-5.
(An additional 21% was made up
mostly of buildings for private schools and universities, including Pomona College – a fact to
91 DOE, “Status of Codes.”
92 Hart, Don’t Worry About the Government? 6.
93 Ibid, 11.
94 Ibid, 11-12.

35
which I will return later.) In addition to these requirements, some governments also enacted
incentives for commercial buildings that pursued LEED certification: tax credits, reduced fees,
expedited permits, and even exemptions from certain zoning requirements (such as maximum
height or density). San Francisco has even gone so far as to require LEED-NC Silver certification
for all commercial buildings by 2009 and Gold by 2012. Furthermore, some jurisdictions’
“‘green building’ codes require projects to meet LEED standards, but not necessarily receive
formal certification, creating a LEED ‘shadow effect’ of uncertain proportions.”95 This mass
implementation of the LEED-NC system has helped it expand exponentially in the past ten
years, but at the same time, it has placed the USGBC in the peculiar position of de facto
standards legislator. As Hart wrote, acting as “primary arbiter of building energy codes …
undermine[s] its own capacity to achieve its mission, which is to push the upper bounds of the
industry mainstream.”96
Being entangled with government standards makes it harder for LEED to “lead the
‘revolution,’” since any significant changes will ripple out to public policy and likely be met
with the same opposition that halted DOE’s efforts in 1977.
97
95 Ibid, 12-13.
In addition, LEED’s position as
“unelected policy-maker” shifts the responsibility of enforcing energy efficiency away from the
government, which is the only entity capable of imposing the prescriptive requirements that are
96 Ibid, 22.
97 Ibid, 21.
36
necessary to “pull along the trailing edge of ‘brown building’ practice.”98 Hart concluded that
“a voluntary approach to building energy efficiency is inevitably limited in reach,” and though
the USGBC has helped catapult the field of green building into the limelight, it cannot force a
sustainable level of CO2 emissions on its own.99
LEED at Pomona College: A Lincoln-Edmunds Case Study
In order to expand its role as market shift leader,
LEED must not be bogged down in issues of policy; Hart’s report seems to suggest that the
government must respond with stricter energy efficiency measures to ensure that sustainability
becomes the norm, not the exception.
During the time since the LEED certification system was created, Pomona College has
become increasingly conscious of environmental issues. In May of 2003, its Board of Trustees
mandated that all new construction and major renovation on campus must be built to LEED
Silver standards, though not necessarily certified as such.100
98 Ibid, 3.
This first took effect with the
construction of the Richard C. Seaver Biology Building, which was certified LEED Silver in 2004.
Because the Seaver Biology Building is metered along with the rest of the Seaver complex,
energy use data for only the LEED-certified portion is not available; according to design
specifications the building should be using 25% less energy than one meeting Title-24,
California’s relatively stringent building construction code which can be used in lieu of
99 Ibid, 22.
100 “History of Sustainability at Pomona,” Pomona College, http://www.pomona.edu/administration/sustainability/about/history.aspx

37
ASHRAE 90.1 when assessing LEED credits.101 Shortly after the completion of the Seaver
Biology Building, construction was started on a second LEED project: the Lincoln-Edmunds
Buildings, which were rated Gold. This complex now houses the Geology, Computer Science,
Linguistics and Cognitive Science (LGCS), Neuroscience, Psychology, Chicano/a~Latino/a
Studies, Black Studies, Asian American Studies, and Environmental Analysis departments.102
While taking classes in these departments I had heard whispers of discontent about the design
of the buildings, but I was never quite sure what had gone wrong. To get a better picture of the
faculty’s opinions, I contacted professors within these departments who had been employed by
the College at the time of the buildings’ construction and whose offices are currently located
within the complex. I began by interviewing two such professors in person – Eric Grosfils and
Linda Reinen – and then emailed eleven others with a survey of comparable questions,103
101 “Green Building Features: Richard C. Seaver Biology,” Pomona College,
receiving responses from seven of them. As a result the Black Studies and Asian American
Studies departments are not represented, which no doubt skews the nature of the opinions I
have heard to a certain degree. However, only one Asian American Studies professor has an
office located within Lincoln-Edmunds, and no Black Studies professors’ offices are within the
complex at all, so it seems these two departments do not have as strong a presence in the
buildings as others might. Another factor that skews the tone of responses I received is that six
http://www.pomona.edu/administration/sustainability/initiatives/facilities/seaver-bio.aspx
102 Mark Kendall, “The Lincoln and Edmunds Buildings Are Now Open,” Pomona College, January 12, 2007, http://www2.campus.pomona.edu/news/2007/01/12-lincoln-edmunds-buildings-now-open.aspx
103 See Appendix 2

38
of the seven professors who responded by email are Psychology professors, although three of
the six also have appointments in other departments. This could result in the information being
more representative of the Psychology department’s space than the buildings as a whole.
Nonetheless, in spite of these limitations, the opinions I received provide an interesting starting
point in examining the Lincoln-Edmunds buildings; while many comments are not directly
related to the LEED certification process, the issues that arose are a real-world reminder of the
fact that a LEED plaque does not necessarily mean a building is sustainable or well designed.
All of the professors interviewed and surveyed were at least somewhat involved in the
design process of the buildings, and one respondent was an Associate Dean of the College at the
time. Several participants voiced dissatisfaction with the experience, saying that it was at times
secretive and disorganized, with many requests being either ignored or misinterpreted. One
Geology professor found it necessary to write up a lengthy list of corrections and notes after
seeing the final plans for his workspace, and the LGCS faculty were so dissatisfied with their
space’s initial design that they took matters into their own hands and drew up a plan of their
own. Other professors who were not as vocal during the design process were not so lucky; a
professor from the Psychology department said that she had assumed student-faculty
interactivity would have been a core value integrated into the building’s design, but because
she did not specifically request this quality her department’s offices were all placed in a corridor
that makes them “invisible … from the flow of students.”104
104 Patricia Smiley, e-mail message to author, November 13, 2010.
Other issues arose from the “veil of
silence” under which faculty were not allowed to know how other departments’ spaces were
39
being designed, resulting in a fragmented planning process unaware of the bigger picture. One
glaring example of this lack of integration is the fact that the Geology department’s rock saw lab,
a space so dirty that it requires its own air filtration system, is located immediately adjacent to
Computer Science’s server room, a space which requires clean, cool air to keep its many
computers from overheating. Because of this oversight, a positive-pressure air filtration system
had to be installed in the server room after the fact in order to prevent it from accumulating
Geology’s dust and dirt.105
Six of the nine professors with whom I communicated felt that their department’s needs
were not quite met in the building’s design, and one of the three professors who answered
positively was a member of the LGCS department (which designed its own space). Several
professors listed small classrooms and poorly designed public spaces as some of their major
problems, while others mentioned a lack of storage space and improper classroom furniture,
specifically large immobile tables rather than individual desks. Over half pointed out the
scarcity of electrical outlets in offices – only one panel of six outlets for the entire workspace –
which was evidently more of a financial decision than an energy-conserving one. Three
professors mentioned problems with lights that never turn off: the LGCS suite is permanently lit
even to this day, a problem that initially plagued the Geology lounge as well. Although the
lighting was designed in banks in order to allow better controllability, no light switches were
installed until 18 months after occupancy; strangely enough, a storage closet’s lighting was
wired along with one of the banks in the lounge, meaning it was perpetually illuminated as
Unfortunately this poor design choice is only one of many.
105 Eric Grosfils and Linda Reinen, personal interview, September 14, 2010.
40
well.106 A Psychology professor noted that the observation space for the department’s one-way
vision room was initially equipped with emergency lighting that could not be turned off,
rendering the space unusable for its purpose.107
106 Ibid.
Another point of contention with several
professors was plumbing: four expressed annoyance with the automatic faucets initially
installed in all spaces (even labs and pantries), which are inefficient for anything other than
hand-washing and can often be triggered unintentionally. One Geology professor described
how the sink in her lab was positioned next to the door and would turn on every time someone
entered or exited the room; this problem was not remedied until 18 months after occupancy,
when the sink was replaced with a traditional, manual one. This same professor told me that
during the construction process, she realized that no sinks were being installed in what had
been designated the department’s “wet lab,” a peculiar oversight that would have been costly to
fix. A similar issue occurred in the rock saw lab, which was designed by a special lab consultant
because it was intended to house many different types of large equipment. However, the
consultant’s design was later modified without the department’s knowledge: the building’s
main electrical panel was placed behind the spot where a two-ton saw was intended to be
located, and several plumbing fixtures were shifted in ways that required a total redesign of the
room. Furthermore, while moving into the building, the department discovered that the door
of the room was too small to accommodate a multi-use piece of equipment. As a result, the
107 Smiley, e-mail message.

41
College had to purchase three smaller pieces of equipment just to replace the one that should
have been included in the design specifications.108
Interior décor was another subject of disagreement; the Geology department requested
rubberized floors in its labs and public spaces, knowing they were likely to be dirty, but the
College required public spaces to be carpeted to match the rest of the building, even though this
would require more cleaning. Several offices were initially designed with rubberized flooring
instead, and some lab spaces were even unintentionally carpeted when the building was
constructed. Faculty research labs were only furnished with one lab bench, one sink, and one set
of cabinets, making work a challenge. To remedy this problem, the faculty suggested that they
salvage furnishings from the old Seaver building, slotted to be remodeled in the near future.
However, the College argued that the older, light wood pieces from Seaver would not match
the new, dark wood furniture of Lincoln-Edmunds and that they could just buy new
furnishings, presumably throwing away the ones from Seaver. Fortunately the faculty was able
to persuade the College that reusing was the more economical option, preventing a colossal
waste of still-usable furniture and cabinetry.
109
108 Grosfils and Reinen, personal interview.
The design of Lincoln-Edmunds was certainly
not all bad; all but one of the professors I contacted noted that they enjoy working in the
buildings despite their shortcomings, listing the incorporation of natural light, high ceilings,
and pleasing views as several of the things they like best. Many of the most obvious issues have
109 Ibid.

42
also been remedied, and for the ones that remain, one professor glibly stated that Lincoln-
Edmunds’ inhabitants are “happily making lemonade from the lemons.”110
Many of the professors I contacted seem to be under the impression that the buildings
are energy efficient (if they were not ambivalent on the topic), but unfortunately historical
energy use data for the Lincoln-Edmunds complex tells another story. This data is readily
available on Pomona’s website, and a page describing the building’s green features proudly
states that the building “performs 38.9% better than Title-24 energy efficiency requirements”
and generates part of its own energy through an 88.2 kW solar photovoltaic panel installation
on its roof.
111 However, the actual energy-use projections upon which this 38.9% figure are
based are not as easily accessible. Thanks to Mark Matsumoto, a project manager at the Office of
Facilities and Campus Services, I was able to peruse the original LEED certification documents
for the buildings, which contained the Title-24 baseline energy usage, projected energy usage,
and projected energy generation by the photovoltaic panel array.112
110 Ibid.
Because of the way LEED
points are written, Lincoln-Edmunds was awarded 10 out of 10 points for optimizing energy
performance, with a predicted energy savings of 52.6% over Title-24 (22.4% in renewable
savings, as determined by price rather than kilowatt-hours (kWh), and the rest in energy use
reduction), but on comparing the projected values to actual data during the building’s lifetime, I
111 “Green Building Features: Lincoln-Edmunds Buildings,” Pomona College, http://www.pomona.edu/administration/sustainability/initiatives/facilities/leb.aspx
112 Mark Matsumoto, e-mail message to author, August 20, 2010.

43
found a large disparity. Even in the first year after the building was built, during which it was
only partially occupied, Lincoln-Edmunds used more energy than its Title-24 baseline allotment
(see Figure 6). In fact, it was already using nearly twice as much as projected. Energy use has
only grown since then, reaching nearly three times the projected usage and almost twice the
Title-24 budget during the 2008-2009 school year.113 Fortunately the rooftop photovoltaic array
is producing almost as much as predicted (91%), but because of the greater overall energy usage
it represents a much smaller percentage of total energy in kWh than initially planned – 3.2% as
opposed to 9.4% (see Figure 7). The disparity in production can likely be attributed to the fact
that the panels are cleaned three times a year rather than the recommended four, reducing their
output slightly.114
Figure 6. Reported annual energy usage as compared to projected usage and Title-24 limit
113 “Campus Sustainability Data,” Pomona College, http://www.pomona.edu/administration/sustainability/resources/datalist.aspx
114 Judy Brown, e-mail message to author, October 1, 2010.
0
500,000
1,000,000
1,500,000
2,000,000
2,500,000
3,000,000
3,500,000
Projected Usage
Title-24 Budget
2006 - 2007 2007 - 2008 2008 - 2009
Tota
l Ene
rgy
Usa
ge in
kW
h
Annual Energy Usage of Lincoln-Edmunds
Total kWh

44
Figure 7. Reported energy generated annually as compared to projected energy generated115
Why are the Lincoln-Edmunds buildings using so much more energy than predicted?
Unfortunately Pomona’s energy use monitoring only divides usage by gas vs. electricity, rather
than by end use, so by Pomona’s data alone I was only able to surmise that the buildings could
be considered High Energy Type because of the presence of several science and computer labs;
categorized as such, Lincoln-Edmunds is exceeding its energy use predictions by the same
percentage as similar buildings, though this certainly does not excuse its poor performance.
From communicating with faculty working in the buildings and taking classes there for the past
three years, I suspected that excessive lighting and air conditioning might be at fault for some of
the buildings’ energy-hogging ways, but without data I could not be certain. Luckily enough, I
embarked on this research project around the same time the California Energy Commission’s
115 “Live Renewable Energy Monitoring,” Fat Spaniel Technologies, http://view2.fatspaniel.net/PV2Web/merge?&view=PV/standard/Simple&eid=1782
0
20000
40000
60000
80000
100000
120000
Projected Annual Generation
2008 - 2009 2009 - 2010
Tota
l Ene
rgy
Gen
erat
ed in
kW
h
Annual Photovoltaic Array Output
Total kWh

45
Public Interest Energy Research program (PIER) commissioned the NBI and Portland Energy
Conservation, Inc. (PECI) to perform an energy performance assessment of the buildings. NBI’s
Cathy Turner and PECI engineer Erin Rowe were kind enough to share their findings with me,
including a breakdown of energy usage by end use and many observations from a site visit.
Table 3. Approximate end use split for projected and actual energy usage116
Plugs and lights Heating Cooling Domestic hot water
Design kBtu/sf 20.5 14.6 4.4 6.0
Design % 45% 32% 10% 13%
Actual kBtu/sf 33.6 40.2 21.8 29.9
Actual % 27% 32% 17% 24%
As seen in Table 3, heating constitutes the largest percentage of actual energy usage, a strange
outcome for a building located in sunny southern California. In the Site Energy Performance
Assessment Report, Rowe explains that the boiler lockout temperature – the external
temperature at which heating equipment can no longer be turned on – is 95° F, meaning the
buildings could possibly be heated even when the temperature outside is quite warm.
Furthermore, the “deadband” range between heating and cooling modes – the leeway given
between temperatures designated to activate heating or cooling – is only 1 degree, resulting in
spaces fluctuating between heating and cooling modes unnecessarily; currently, Title-24
requires a 5° deadband. Occupants are also given a relatively wide range of control over 116 New Buildings Institute, Energy Performance Overview: Pomona College – Lincoln and Edmunds Buildings, (Public Interest Energy Research, 2010), 2.
46
thermostats in each zone (68°-74° F), meaning one HVAC zone can be in cooling mode while the
zone next door is in heating mode, each consuming extra energy to counteract their neighbor’s
temperature change. Heating and cooling will also continue to run even when a zone’s
windows are open, wasting energy. One other significant contributor to HVAC energy usage is
that of exhaust fans and fume hoods in lab spaces, many of which run at all times assuming
maximum occupancy. As the report notes, lab spaces make up only 15% of the total square
footage of the buildings, suggesting they are not necessarily High Energy Type by nature, but
these lab spaces may be using enough energy on their own to suggest otherwise.117
Plug loads and lighting are other areas for improvement; although plugs and lights
comprise a smaller percentage of total energy usage than predicted in the design phase, they
use more energy per square foot. Despite Lincoln-Edmunds’ wealth of natural light, no daylight
or occupancy sensors were implemented, and as a result many spaces remain artificially lit even
when daylight would suffice, or when no one is in the room. Although lights are scheduled to
automatically shut off at midnight, this shutoff does not actually occur, causing lights to remain
on at all hours unless manually turned off. The addition of occupancy sensors, daylight sensors
or photocells, and working lighting schedules would help solve these issues. Plug loads are
more difficult to reduce, since they largely depend on the energy efficiency of the appliances
used and the number of appliances that are typically running. Because of the departments
housed within Lincoln-Edmunds, the building contains several computer labs and many pieces
117 New Buildings Institute and Pacific Energy Conservation, Inc., Site Energy Performance Assessment Report for Pomona College Lincoln-Edmunds Building, (Public Interest Energy Research, 2010), 7.

47
of specialty equipment that are likely not designed with energy efficiency as a top priority. The
College currently requires that new appliances purchased are EnergyStar certified when
possible, but this rating system is not applicable for many lab-specific appliances, and it is
unclear whether this requirement was in place when Lincoln-Edmunds was constructed. Given
the fact that some equipment pieces were overlooked when planning the layouts of lab spaces,
it seems likely that they may have been left out of the energy modeling process as well,
resulting in an underestimation for total energy usage.118
Conclusion
The Lincoln-Edmunds buildings are far from being a model example of LEED-certified
structures, but unfortunately they are also not an anomaly. When a complex that hogs as much
energy as Lincoln-Edmunds can be ranked LEED Gold, much less certified in the first place, it is
an indicator that the ranking system is in dire need of improvement. Although each iteration of
LEED-NC moves closer to sustainability, at its current pace it may be too little, too late.
And so the question stands: is LEED a true leader in energy, environmental design, and
sustainability? Or is it merely a way for the building industry to cash in on the “green” trend?
Perhaps it is a little of both. LEED has undeniably galvanized the green building industry in a
way that would have been unimaginable to American architects twenty years ago, and its
popularity has no doubt encouraged criticism and competition as well. Efforts such as
Architecture 2030 (which aims for carbon-neutral new construction by 2030), Passivhaus (an
118 Ibid, 4-7.

48
energy efficiency system imported from Germany in 2003), and Green Globes (an alternative
rating system for buildings imported from Canada in 2004) might have never arisen if not for
the success of LEED, and their existence encourages all green building standards to raise the bar.
One architect with whom I corresponded noted that the LEED rating system has “elevated the
social conscious regarding sustainability, which makes it a much easier sell for design
professionals trying to lead clients toward better, more thoughtful design” – a change which has
likely made it easier for other building standards to enter the market as well.119
However, LEED’s fame has also made it a tool for builders to garner free publicity and
good will without ever having to prove that their structures are actually helping the
environment. LEED’s celebrity status as the preeminent green building system has created
confusion in the eyes of the public, some of whom assume LEED buildings must be fully
sustainable or even net-zero carbon emissions. Sadly, an average energy savings of only 25%
says otherwise, and as demonstrated by Lincoln-Edmunds, even buildings that claim a 52.6%
savings – within the range of what could be considered sustainable – can actually be using even
more energy than allowed by state building codes. In its current state, LEED-NC cannot be
relied upon to produce sustainable buildings. As my architect correspondent put it, “rating
systems [like LEED] … provide the mire for good projects to get stuck in;” he went on to say
that “[t]here is little to no incentive for innovation within the LEED system … The factor
contributing most to design innovation is probably the economy.”
120
119 Matt Mori, e-mail message to author, October 18, 2010.
Since LEED is a voluntary
120 Ibid.

49
system based upon the idea of encouraging market shifts, the USGBC must walk a fine line
between effectively stringent requirements and those so strict that no building financier will
willingly attempt LEED certification. If LEED were to suddenly lose the support of the building
community, this shift would be more harmful to the pursuit of sustainability than low
standards could be. Nonetheless, the current glacial pace of change that LEED is encouraging
will result in irreversible climate change before those in the business of building will all
willingly adopt sustainable practices. For this reason, federal government intervention is likely
necessary (and not merely in the form of government-mandated adoption of LEED). If more
stringent building codes are put in place – ones that could result in perhaps a 50% savings, a
target which architects say is much more achievable than it sounds – LEED could instead target
the segment of the market willing to aim for 85% energy use reductions, or even net-zero
energy usage. In a country where construction lobbyists are an influential force and 18% of
states do not even have a state-wide building code, this may sound ambitious. However, one
should not expect saving an entire planet to be easy. The USGBC must encourage more drastic
energy efficiency measures both by the government and within its own system if it wants LEED
to live up to its name.

50
Appendix 1: Abbreviations and Technical Terms
LEED – Leadership in Energy and Environmental Design
LEED-NC – LEED for New Construction and Major Renovations
USGBC – United States Green Building Council
VOC – Volatile organic compound
IPCC – Intergovernmental Panel on Climate Change
EAc1 – Energy and Atmosphere credit 1
HVAC – Heating, Ventilation, and Air Conditioning
ASHRAE – American Society of Heating, Refrigerating and Air Conditioning Engineers
NBI – New Buildings Institute
EPA – Environmental Protection Agency
NCv.2 – LEED-NC version 2.0
CBECS – Commercial Building Energy Consumption Survey
EUI – Energy Use Intensity
DOE – Department of Energy
LGCS – Linguistics and Cognitive Science
kWh – kilowatt-hour
PIER – Public Interest Energy Research
PECI – Portland Energy Conservation, Inc.
Btu – British thermal unit

51
Appendix 2: Lincoln-Edmunds Faculty Survey
1. Were you included in the design process of the Lincoln-Edmunds complex? If so, how would you describe it? To what extent were you involved?
2. Do you feel that your department's needs were met in the design of the buildings? i.e. was all of your equipment accounted for, do you have enough storage space, do your classroom and office spaces accommodate the teaching styles of your department?
3. Do you feel any of your department's design requests were restricted, overlooked, or
improperly implemented, either by the design team or the college? If so, how has it impacted you since the building's construction?
4. Have any design elements of the buildings struck you as poorly thought out, either from a
human or ecological perspective? e.g. lights with no light switches, not enough electrical outlets
5. Has working in Lincoln-Edmunds increased your environmental awareness? How
sustainable do the buildings seem to you?
6. What is your overall impression of the buildings? Do you enjoy working in them?
52
Appendix 3: LEED-NC Version 2.1 Credits121
SUSTAINABLE SITES
Credits attained by Lincoln-Edmunds listed in black, others listed in grey
Prerequisite 1. Erosion & Sedimentation Control – Control erosion to reduce negative impacts on water and air quality.
1. Site Selection – Avoid development of inappropriate sites and reduce the environmental impact from the location of a building on a site.
2. Urban Redevelopment – Channel development to urban areas with existing infrastructure, protect greenfields and preserve habitat and natural resources.
3. Brownfield Redevelopment – Rehabilitate damaged sites where development is complicated by real or perceived environmental contamination, reducing pressure on undeveloped land.
4.1. Alternative Transportation, Public Transportation Access – Locate project within 1/2 mile (walking) of a commuter rail, light rail or subway station or 1/4 mile of two or more public or campus bus lines usable by building occupants.
4.2. Alternative Transportation, Bicycle Storage & Changing Rooms – Provide secure bicycle storage with convenient changing/shower facilities (within 200 yards of the building) for 5% or more of regular building occupants.
4.3. Alternative Transportation, Alternative Fuel Vehicles – Provide alternative fuel vehicles for 3% of building occupants AND provide preferred parking for these vehicles, OR install alternative-fuel refueling stations for 3% of the total vehicle parking capacity of the site.
4.4. Alternative Transportation, Parking Capacity – Size parking capacity to meet, but not exceed, minimum local zoning requirements OR add no new parking for rehabilitation projects. Also, provide preferred parking for carpools or vanpools capable of serving 5% of the building occupants.
5.1. Reduced Site Disturbance, Protect or Restore Open Space – On greenfield sites, limit site disturbance, OR on previously developed sites, restore a minimum of 50% of the site area by replacing impervious surfaces with native or adapted vegetation.
5.2. Reduced Site Disturbance, Development Footprint – Reduce the development footprint to exceed local zoning’s open space requirements for the site by 25%.
121 U.S. Green Building Council, LEED Green Building Rating System For New Construction & Major Renovations (LEED-NC) Version 2.1, (Washington, DC: U.S. Green Building Council, 2002), http://www.usgbc.org/Docs/LEEDdocs/LEED_RS_v2-1.pdf

53
6.1. Stormwater Management, Rate and Quantity – Implement a stormwater management plan to reduce rate and quantity of stormwater runoff.
6.2. Stormwater Management, Treatment – Construct site stormwater treatment systems.
7.1. Heat Island Effect, Non-Roof – Provide shade (within 5 years) and/or use light-colored/high-albedo materials and/or open grid pavement for the site’s non-roof impervious surfaces; OR place a minimum of 50% of parking spaces underground or covered by structured parking.
7.2. Heat Island Effect, Roof – Use Energy Star compliant AND high emissivity roofing for a minimum of 75% of the roof surface; OR install a vegetated roof for at least 50% of the roof area.
8. Light Pollution Reduction – Eliminate light trespass from the building and site, improve night sky access and reduce development impact on nocturnal environments.
WATER EFFICIENCY
1.1. Water Efficient Landscaping, Reduce by 50% – Use high-efficiency irrigation technology OR use captured rain or recycled site water to reduce potable water consumption for irrigation by 50% over conventional means.
1.2. Water Efficient Landscaping, No Potable Use or No Irrigation – Use only captured rain or recycled site water to eliminate all potable water use for site irrigation, OR do not install permanent landscape irrigation systems.
2. Innovative Wastewater Technologies – Reduce the use of municipally provided potable water for building sewage conveyance by a minimum of 50%, OR treat 100% of wastewater on site to tertiary standards.
3.1. Water Use Reduction, 20% Reduction – Employ strategies that in aggregate use 20% less water than the water use baseline calculated for the building (not including irrigation).
3.2. Water Use Reduction, 30% Reduction – Employ strategies that use 30% less water than the water use baseline.
ENERGY & ATMOSPHERE
Prerequisite 1. Fundamental Building Systems Commissioning – Verify and ensure that fundamental building elements and systems are designed, installed and calibrated to operate as intended.
Prerequisite 2. Minimum Energy Performance – Design the building to comply with ASHRAE/IESNA Standard 90.1-1999 or the local energy code, whichever is more stringent.
54
Prerequisite 3. CFC Reduction in HVAC&R Equipment – Zero use of CFC-based refrigerants in new base building HVAC&R systems. When reusing existing base building HVAC equipment, complete a comprehensive CFC phase-out conversion.
1. Optimize Energy Performance – Achieve increasing levels of energy performance above the prerequisite standard to reduce environmental impacts associated with excessive energy use. * Each 5% reduction gains a point, up to a total of 10 possible points for this credit.
2.1. Renewable Energy, 5% – Supply at least 5% of the building’s total energy use (as expressed as a fraction of annual energy cost) through the use of on-site renewable energy systems.
2.2. Renewable Energy, 10% – Supply at least 10% of the building’s total energy use through the use of on-site renewable energy systems.
2.3. Renewable Energy, 20% – Supply at least 20% of the building’s total energy use through the use of on-site renewable energy systems.
3. Additional Commissioning – Implement additional commissioning tasks above those required by EA Prerequisite 1.
4. Ozone Depletion – Install base building level HVAC and refrigeration equipment and fire suppression systems that do not contain HCFCs or Halons.
5. Measurement & Verification – Provide for the ongoing accountability and optimization of building energy and water consumption performance over time by installing continuous metering equipment.
6. Green Power – Provide at least 50% of the building’s electricity from renewable sources by engaging in at least a two-year renewable energy contract.
MATERIALS & RESOURCES
Prerequisite 1. Storage & Collection of Recyclables – Provide an easily accessible area that serves the entire building and is dedicated to the separation, collection and storage of materials for recycling.
1.1. Building Reuse, Maintain 75% of Existing Shell – Maintain at least 75% of existing building structure and shell (exterior skin and framing, excluding window assemblies and non-structural roofing material).
1.2. Building Reuse, Maintain 100% of Shell – Maintain all of existing building structure and shell.
1.3. Building Reuse, Maintain 100% Shell & 50% Non-Shell – Maintain 100% of existing building structure and shell AND at least 50% of non-shell areas (interior walls, doors, floor coverings and ceiling systems).
55
2.1. Construction Waste Management, Divert 50% – Develop and implement a waste management plan, quantifying material diversion goals. Recycle and/or salvage at least 50% of construction, demolition and land clearing waste.
2.2. Construction Waste Management, Divert 75% – Recycle and/or salvage 75% of construction, demolition and land clearing waste.
3.1. Resource Reuse, Specify 5% – Use salvaged, refurbished or reused materials, products and furnishings for at least 5% of building materials.
3.2. Resource Reuse, Specify 10% – Use salvaged, refurbished or reused materials, products and furnishings for at least 10% of building materials.
4.1. Recycled Content, Specify 5% (post-consumer + 1/2 post-industrial) – Use materials with recycled content such that the sum of post-consumer recycled content plus one-half of the post-industrial content constitutes at least 5% of the total value of the materials in the project.
4.2. Recycled Content, Specify 10% (post-consumer + 1/2 post-industrial) – Use materials with recycled content at least 10% of the total value of the materials in the project.
5.1. Local/Regional Materials, 20% Manufactured Locally – Use a minimum of 20% of building materials and products that are manufactured regionally within a radius of 500 miles.
5.2. Local/Regional Materials, of 20% in MRc5.1, 50% Harvested Locally – Of the regionally manufactured materials documented for MR Credit 5.1, use a minimum of 50% of building materials and products that are extracted, harvested or recovered within 500 miles of the project site.
6. Rapidly Renewable Materials – Use rapidly renewable building materials and products for 5% of the total value of all building materials and products used in the project.
7. Certified Wood – Use a minimum of 50% of wood-based materials and products, certified in accordance with the Forest Stewardship Council’s Principles and Criteria, for wood building components.
INDOOR ENVIRONMENTAL QUALITY
Prerequisite 1. Minimum IAQ Performance – Meet the minimum requirements of voluntary consensus standard ASHRAE 62-1999, Ventilation for Acceptable Indoor Air Quality, and approved Addenda.
Prerequisite 2. Environmental Tobacco Smoke (ETS) Control – Prevent exposure of building occupants and systems to Environmental Tobacco Smoke.
56
1. Carbon Dioxide (CO2) Monitoring – Install a permanent carbon dioxide monitoring system that provides feedback on space ventilation performance in a form that affords operational adjustments.
2. Ventilation Effectiveness – Provide for the effective delivery and mixing of fresh air to support the safety, comfort and well-being of building occupants.
3.1. Construction IAQ Management Plan, During Construction – Prevent indoor air quality problems resulting from the construction/renovation process in order to help sustain the comfort and well-being of construction workers and building occupants.
3.2. Construction IAQ Management Plan, Before Occupancy – After construction ends and prior to occupancy conduct a minimum two-week building flush-out with 100% outside air OR conduct a baseline indoor air quality testing procedure.
4.1. Low-Emitting Materials, Adhesives & Sealants – The VOC content of adhesives and sealants used must be less than the current VOC content limits of SCAQMD, AND all sealants used as fillers must meet or exceed the requirements of the Bay Area Air Quality Management District.
4.2. Low-Emitting Materials, Paints – VOC emissions from paints and coatings must not exceed the VOC and chemical component limits of Green Seal’s Standard GS-11 requirements.
4.3. Low-Emitting Materials, Carpet – Carpet systems must meet or exceed the requirements of the Carpet and Rug Institute’s Green Label Indoor Air Quality Test Program.
4.4. Low-Emitting Materials, Composite Wood – Composite wood and agrifiber products must contain no added urea-formaldehyde resins.
5. Indoor Chemical & Pollutant Source Control – Avoid exposure of building occupants to potentially hazardous chemicals that adversely impact air quality by utilizing permanent entryway systems, exhaust systems, and appropriately plumbed drains.
6.1. Controllability of Systems, Perimeter – Provide at least an average of one operable window and one lighting control zone per 200 square feet for all regularly occupied areas within 15 feet of the perimeter wall.
6.2. Controllability of Systems, Non-Perimeter – Provide controls for each individual for airflow, temperature and lighting for at least 50% of the occupants in non-perimeter, regularly occupied areas.
7.1. Thermal Comfort, Comply with ASHRAE 55-1992 – Provide a thermally comfortable environment that supports the productivity and well-being of building occupants.
7.2. Thermal Comfort, Permanent Monitoring System – Install a permanent temperature and humidity monitoring system configured to provide operators control over thermal comfort
57
performance and the effectiveness of humidification and/or dehumidification systems in the building.
8.1. Daylight & Views, Daylight 75% of Spaces – Provide for the building occupants a connection between indoor spaces and the outdoors through the introduction of daylight into the regularly occupied areas of the building.
8.2. Daylight & Views, Views for 90% of Spaces – Achieve direct line of sight to transparent windows for building occupants in 90% of all regularly occupied spaces.
INNOVATION & DESIGN PROCESS
1.1 - 1.4. Innovation in Design – To provide design teams and projects the opportunity to be awarded points for exceptional performance above the requirements set by the LEED Green Building Rating System and/or innovative performance in Green Building categories not specifically addressed by the LEED Green Building Rating System.
2. LEED Accredited Professional – Have at least one principal participant of the project team that has successfully completed the LEED Accredited Professional exam.
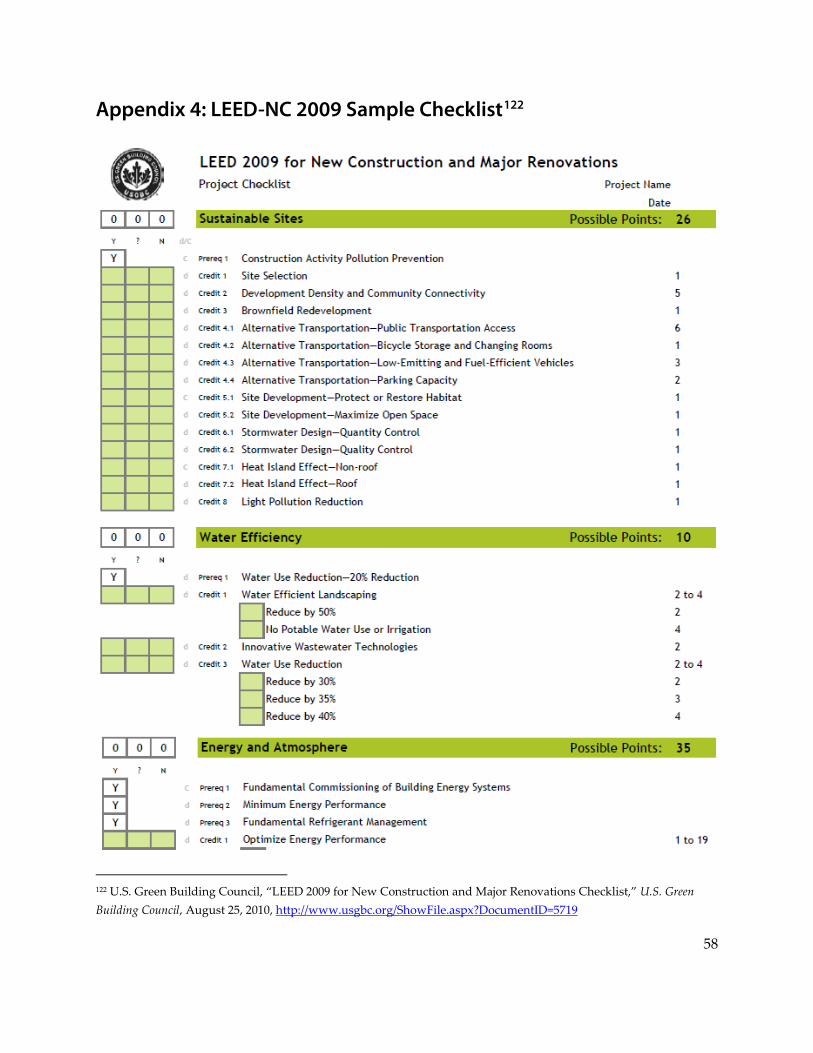
58
Appendix 4: LEED-NC 2009 Sample Checklist122
122 U.S. Green Building Council, “LEED 2009 for New Construction and Major Renovations Checklist,” U.S. Green Building Council, August 25, 2010, http://www.usgbc.org/ShowFile.aspx?DocumentID=5719

59

60
61
Works Cited
Ayaz, Engin, and Frances Yang. "Zero Carbon Isn't Really Zero: Why Embodied Carbon in Materials Can't Be Ignored." DesignIntelligence. September 1, 2009. http://www.di.net/articles/archive/zero_carbon/.
Brundtland Commission. "Towards Sustainable Development." Our Common Future. Oslo: United Nations World Commission on Environment and Development, 1987.
Building Design & Construction. White Paper on Sustainability. Building Design & Construction, November 2003.
"Campus Sustainability Data." Pomona College. http://www.pomona.edu/administration/sustainability/resources/datalist.aspx.
D&R International, Ltd. 2009 Buildings Energy Data Book. Buildings Technologies Program, Energy Efficiency and Renewable Energy, U.S. Department of Energy, 2009.
Environmental Protection Agency. "How the Rating System Works." Energy Star. http://www.energystar.gov/index.cfm?c=evaluate_performance.pt_neprs_learn.
Gifford, Henry. "A Better Way to Rate Green Buildings." EnergySavingScience.com. http://www.energysavingscience.com/.
"Green Building Features: Lincoln-Edmunds Buildings." Pomona College. http://www.pomona.edu/administration/sustainability/initiatives/facilities/leb.aspx.
"Green Building Features: Richard C. Seaver Biology." Pomona College. http://www.pomona.edu/administration/sustainability/initiatives/facilities/seaver-bio.aspx.
Green Building Insider. "Number of LEED Certifications Skyrockets." Green Building Insider. WPL Publishing Co., Inc. January 7, 2010. http://www.greenbuildinginsider.com/articles/20100105.
Hare, Bill, and Malte Meinshausen. "The EU, the IPCC and 2oC." The Institute for European Studies, October 8, 2008.
Hart, David M. Don't Worry About the Government? The LEED-NC "Green Building" Rating System and Energy Efficiency in U.S. Commercial Buildings. MIT Industrial Performance Center, Cambridge, MA: Massachusetts Institute of Technology, 2009.
62
"History of Sustainability at Pomona." Pomona College. http://www.pomona.edu/administration/sustainability/about/history.aspx.
Intergovernmental Panel on Climate Change. "The long-term perspective." Climate Change 2007: Synthesis Report. Valencia: Intergovernmental Panel on Climate Change, 2007.
Jacobson, Mark Z., and Mark A. Delucchi. Evaluating the Feasibility of a Large-Scale Wind, Water, and Sun Energy Infrastructure. Stanford: Stanford University, 2009.
Kamenetz, Anya. "The Green Standard?" Fast Company 119 (October 2007).
Kendall, Mark. "The Lincoln and Edmunds Buildings Are Now Open." Pomona College. January 12, 2007. http://www2.campus.pomona.edu/news/2007/01/12-lincoln-edmunds-buildings-now-open.aspx.
Malin, Nadav. "If It's Not LEED, Can It Still Be Green?" Environmental Building News 13, no. 12 (December 2004).
Malin, Nadav. "Lies, Damn Lies, and... (Another Look at LEED Energy Efficiency)." BuildingGreen Blogs. September 2, 2008. http://www.buildinggreen.com/live/index.cfm/2008/9/2/Lies-Damn-Lies-and-Are-LEED-Buildings-iLessi-Efficient-Than-Regular-Buildings.
New Buildings Institute and Pacific Energy Conservation, Inc. Site Energy Performance Assessment Report for Pomona College Lincoln-Edmunds Building. Public Interest Energy Research, 2010.
New Buildings Institute. Energy Performance Overview: Pomona College - Lincoln and Edmunds Buildings. Public Interest Energy Research, 2010.
Roberts, Tristan. "USGBC, LEED Targeted by Class-Action Suit." BuildingGreen.com. October 14, 2010. http://www.buildinggreen.com/auth/article.cfm/2010/10/14/USGBC-LEED-Targeted-by-Class-Action-Suit/.
Roberts, Tristan, and Allyson Wendt. "USGBC Expands Data Collection from LEED Buildings." BuildingGreen.com. August 20, 2010. http://www.buildinggreen.com/auth/article.cfm/2010/8/20/USGBC-Expands-Data-Collection-from-LEED-Buildings/.
Sparkes, Matthew. "Carbon Footprint of Tap Water." Treehugger. February 8, 2007. http://www.treehugger.com/files/2007/08/carbon_footprin_1.php.
63
Stein, Jay, and Rachel Reiss. Ensuring the Sustainability of Sustainable Design: What Designers Need to Know About LEED. Boulder, CO: Platts, 2004.
Steven Winter Associates, Inc. "Battery Park City's Gold Standard: The Solaire Residential High Rise." www.swinter.com. http://www.swinter.com/services/documents/Solaire_Case_Study.pdf.
Turner, Cathy, and Mark Frankel. "Energy Performance of LEED for New Construction Buildings." U.S. Green Building Council. New Buildings Institute. 2008. http://www.usgbc.org/ShowFile.aspx?DocumentID=3930.
U.S. Department of Energy. "Status of Commercial Energy Codes." U.S. Department of Energy Building Energy Codes Program. September 14, 2010. http://www.energycodes.gov/states/maps/commercialStatus.stm.
U.S. Department of Energy. "Why Building Energy Codes?" U.S. Department of Energy Building Energy Codes Program. July 15, 2010. http://www.energycodes.gov/why_codes/.
U.S. Green Building Council. "Executive Staff." U.S. Green Building Council. 2010. http://www.usgbc.org/DisplayPage.aspx?CMSPageID=61#sfedrizzi.
U.S. Green Building Council. "Intro - What LEED Is." U.S. Green Building Council. 2010. http://www.usgbc.org/DisplayPage.aspx?CMSPageID=1988.
U.S. Green Building Council. LEED 2009 for New Construction and Major Renovations. Washington, DC: U.S. Green Building Council, 2008.
U.S. Green Building Council. "LEED 2009 for New Construction and Major Renovations Checklist." U.S. Green Building Council. August 25, 2010. http://www.usgbc.org/ShowFile.aspx?DocumentID=5719.
U.S. Green Building Council. LEED Green Building Rating System For New Construction & Major Renovations (LEED-NC) Version 2.1. Washington, DC: U.S. Green Building Council, 2002.
U.S. Green Building Council. "LEED Projects & Case Studies Directory." U.S. Green Building Council. 2010. http://www.usgbc.org/LEED/Project/CertifiedProjectList.aspx.
Udall, Randy, and Auden Schendler. "Leed is Broken -- Let's Fix It." iGreenBuild.com. August 9, 2005. http://www.igreenbuild.com/cd_1706.aspx.
64
Watson, Rob. "Green Building Market and Impact Report 2009." GreenerBuildings.com. Greener World Media. http://www.greenbiz.com/buildings/research/report/2009/11/05/green-building-market-and-impact-report-2009.
Watson, Rob. "LEED Is Not Perfect, But It's Not Broken." environmental design + construction. BNP Media. December 23, 2005. http://www.edcmag.com/CDA/Archives/44b973b231d98010VgnVCM100000f932a8c0____.
Recommended

![SUSTAINABLE BUILDING DE and HVAC SIGN LEED · LEED Accredited Professionals (APs) has topped 131,000. USGBC’s LEED version 3 (v3)—includes LEED 2009[1], a new LEED ac-creditation](https://img.pdfslide.us/doc/110x75/5f0aaf2e7e708231d42cd46c/sustainable-building-de-and-hvac-sign-leed-leed-accredited-professionals-aps-has.jpg)