060 TIJA Symposium 2012
2/1/12
Is it IFRS Adoption or Convergence to IFRS that Matters?
Lei Cai
Asheq Rahman
Stephen Courtenay
School of Accountancy
Massey University
Auckland
New Zealand
Draft Date: 31 Jan 2012
1
060 TIJA Symposium 2012
2/1/12
Is it IFRS Adoption or Convergence to IFRS that Matters?
Abstract
Prior Studies find that International Financial Reporting Standards (IFRS) adoption improves
earnings quality. Some studies also introduce enforcement variables to show the added
benefits of enforcement. However, we note that some of the countries that have adopted IFRS
had accounting standards similar to IFRS prior to adopting IFRS while others had accounting
standards less similar to IFRS. We contend that the latter group benefit more from IFRS
adoption because their accounting standards undergo greater improvements. We examine the
effect of IFRS adoption by taking into account the prior dissimilarities a country’s accounting
standards had with IFRS. We use data from 31 countries and we take into account the effects
of legal enforcement. We find that when IFRS is adopted or when accounting standards are
more similar to IFRS, countries have lower levels of earnings management. Also, countries
with accounting standards less similar to IFRS prior to IFRS adoption have a greater drop in
earnings management after IFRS adoption. Our results support the contention that countries
with lower quality accounting standards would benefit more from IFRS adoption.
2
060 TIJA Symposium 2012
2/1/12
1. Introduction
Many countries have begun mandatory adoption of International Financial Reporting
Standards (IFRS) issued by the International Accounting Standards Board (IASB). IFRS
removes many allowable accounting alternatives, and some initial evidences show that IFRS
limit managerial discretion to manipulate earnings, thereby improving earnings quality.
Research investigating the usefulness of IFRS adoption has shown that countries that adopt
IFRS have lower earnings management (Jeanjean and Stolowy, 2008; Callao and Jarne 2010;
Hoque et al. 2012). We contend that the term ‘adoption’ does not to carry the same meaning
across countries because the effect of adoption is formed by a country’s distinctive regulatory,
capital market, accounting, and auditing features. This has been partially studied by recent
studies through an examination of the effects of enforcement on the adoption of IFRS
(Jeanjean and Stolowy, 2008; Hoque et al. 2012). These studies, however, do not take into
consideration the fact that some of the IFRS adopting countries already had accounting
standards similar to IFRS prior to adopting IFRS. We contend that the benefit of IFRS
adoption is reaped more by countries whose accounting standards are less similar to IFRS.
We examine the effect of IFRS adoption by taking into account the prior dissimilarities a
country’s accounting standards had with IFRS. We take into account the effects of legal
enforcement as recent studies have done. We also find that when IFRS is adopted or when
accounting standards are more similar to IFRS, countries have lower levels of earnings
management. Also, countries with standards less similar to IFRS prior to IFRS adoption have
a greater reduction in earnings management after IFRS adoption. Our results support the
contention that countries, in general, benefit from IFRS adoption, and countries that achieve
greater ‘convergence’ to IFRS by adopting IFRS benefit more than those countries that
already had accounting standards similar to IFRS. However, in this milieu, while we find
legal enforcement to be a significant player in reducing earnings management, its influence
on enhancing the effects of IFRS on earnings management reduction is not consistently
significant. The likely cause of this is that countries that had standards dissimilar to IFRS had
weaker legal enforcement arrangements. Therefore, their reduction in their earnings
management is primarily due to IFRS adoption and less due to the legal enforcement
arrangements complementing IFRS.
A strength of our study is that we have been able to study the effects of IFRS adoption more
effectively. Previous studies (Jeanjean and Stolowy, 2008; Hoque et al, 2012) were unable to
3
060 TIJA Symposium 2012
2/1/12
obtain data for large-sample tests because their studies were conducted too soon after IFRS
adoption by their sample countries. Regulations take years to unfold and take effect. As
mandatory IFRS adoption has been use for some years in many countries, it is now possible
to empirically test how IFRS plays a role in establishing earnings quality. In this regard, we
note that the effects of IFRS adoption take about three to four years to take effect.
Our sample covers data from 2000 to 2009 across 31 countries. We use the theory
frameworks of Soderstrom and Sun (2007), Leuz et al. (2003), and Hope (2003). Our results
show that firm reporting incentives are shaped by the institutional environments of countries
(Ball et al., 2000; Hope, 2003; Bhattacharya et al. 2003; Beneish and Yohn, 2008; Jeanjean
and Stolowy, 2008), and IFRS has the strongest effect on earnings quality when
‘convergence’ is large due to IFRS adoption.
Our paper contributes to the accounting literature in three ways. First, most IFRS adoption
papers (Callao and Jarne, 2010; Houqe et al. 2011) do not consider the differences between
local GAAP and IFRS. Simply coding IFRS adoption as an indicator variable to measure the
quality of accounting standards is not sufficient because it does not capture how much IFRS
adoption affects the state of accounting policies in a country. In this paper, we capture the
degree of variation in GAAP differences to get a better measurement of IFRS adoption.
Second, previous studies only provide preliminary evidence on the effect of IFRS adoption
because their data cover only one or two years after mandatory adoption of IFRS, or cover
fewer countries. We use a large sample that covers data up to five years after mandatory
adoption of IFRS. Third, our study focuses on the issue of which countries benefit more from
IFRS adoption. Currently, much attention is being placed on the convergence between IFRS
and the US accounting standards. The question that arises from this focus is whether this
should be the main direction of the IASB’s efforts or should the IASB provide more attention
to those countries that need assistance in improving the quality of their accounting standards?
The remainder of the paper is organized as follows. Section 2 provides the literature review
and leads to the hypothesis. Section 3 describes the research design, including the measures
for the dependent, independent, and control variables, the model specifications, and the
sample selection process. Section 4 presents the descriptive statistics and empirical analysis.
Finally, the conclusion of this study is drawn in Section 5.
4
060 TIJA Symposium 2012
2/1/12
2. Literature review and hypotheses development
Adopting a common set of high quality accounting standards can improve earnings quality
through the ease of monitoring and comparison of financial reports across borders, which
puts pressure on management to report faithfully and truthfully and engage less in earnings
management activities (Soderstrom and Sun 2007). Daske and Gebhardt (2006) find
significant increases in disclosure quality under IFRS in three European countries (namely,
Austria, Germany, and Switzerland) scored by independent academic accounting scholars.
Using a sample in 21 countries, Barth, Landsman, and Lang (2008) show that international
accounting standards (IAS) adopting firms have less earnings management, more timely loss
recognition, and more value relevant earnings than non-adopting firms in post-adoption
period. They suggest that adopting IAS improves accounting quality and potentially reduces
the cost of equity capital. More recently, Chen et al. (2010) find that accounting quality has
marginally improved after IFRS adoption in the 15 European Union countries. They suggest
that the improvement in accounting quality is due to IFRS restricting alternative accounting
choices, reducing the ambiguity in local standards, and changing the managerial incentives.
In contrast, opponents argue that adopting high quality accounting standards per se does not
necessarily improve accounting quality. For example, Ball, Robin, and Wu (2003) find that
the accounting quality is low in four Asian countries/regions (Hong Kong, Malaysia,
Singapore, and Thailand), even though their accounting standards are derived from common
law countries. Lin and Paananen (2006) examine changes in the patterns of earnings
management activities over time, and suggest that IASB has not been effective in decreasing
overall earnings management activities. Callao and Jarne (2010) compare discretionary
accruals in periods preceding and immediately after IFRS adoption for firms listed on 11
European stock markets. Their findings suggest that IFRS encourages discretionary
accounting and opportunistic behaviour.
Besides accounting standards, accounting quality is also determined by a country’s overall
institutional system and firms’ incentives for financial reporting (Ball et al., 2000; Ball et al.,
2003; Boonlert-U-Thai, Meek, and Nabar, 2006; Jeanjean and Stolowy, 2008). Leuz et al.
(2003) use cluster analysis with La Porta et al’s (1998) nine institutional variables to identify
systematic differences in earnings management across 31 countries. They report lower
earnings management in countries with stronger investor protection, since strong protection
limits insiders’ ability to acquire private control benefits, and reduces their incentives to mask
5
060 TIJA Symposium 2012
2/1/12
firm performance. Similarly, Burgstahler, Hail, and Leuz (2006) examine the relation
between earnings management and the interaction among ownership structure, capital market
structure and development, the tax system, accounting standards, and investor protection.
They document that strong legal systems are associated with lower earnings management.
Boonlert-U-Thai et al. (2006) explore the effects of investor protection on reported earnings
quality, and find that earning smoothness is less prevalent in strong investor protection
countries. Ding, et al. (2007) examine how a country’s legal system, economic development,
importance of stock markets, and ownership concentration shape the country’s accounting
standards, which in turn affect the country’s quality of financial reporting. Soderstrom and
Sun (2007) argue that cross-country differences in accounting quality are likely to remain
following IFRS adoption, because accounting quality is a function of the institutional setting
in which firms operate. Although conversion to IFRS is likely to improve earnings quality, it
is only one of several determinants. Even after mandatory IFRS adoption, country-level
institutional variables continue to vary across countries.
Many researchers argue that the enforcement of accounting standards is as important as the
accounting standards (e.g. Shleifer and Vishny, 1997). “Strong IFRS enforcement puts
pressure on management and auditors to act faithfully and truthfully to comply with the
standards, and contributes to comparability of financial statements across countries” (FEE,
2002, 29). Enforcement of standards also helps investors perceive that financial reports
reflect a firm’s fundamentals, which can increase the relevance of the accounting information.
Ewert and Wagenhofer (2005) find that tightening enforcement of accounting standards
reduces earnings management and improves reporting quality.
Ball et al. (2003) and Holthausen (2003) predict that IFRS adoption by countries with weak
enforcement mechanisms will lead to lower perceived quality of the standards, and suggests
that it would be useful for the literature to begin to structure and quantify the country
descriptions by developing more informative tests. Similarly, Leuz et al. (2003) and Beneish
and Yohn (2008) argue that countries with strong outsider1 protection are expected to enact
and enforce accounting and securities laws that limit the manipulation of accounting
information. Jeanjean and Stolowy (2008) provide early evidence of the importance of the
institutional environment in reducing earnings management after IFRS adoption. They find
that earnings management did not decline in Australia and the UK after the introduction of 1 Outsiders are distinguished from those insiders such as managers and controlling shareholders, who have
incentives to conceal their private control benefits from outsiders (See Leuz et al. 2003).
6
060 TIJA Symposium 2012
2/1/12
IFRS, and in fact increased in France. In a pre-IFRS setting Hope (2003) had found that
accounting standards enforcement is needed to encourage or forces managers to follow the
rules. In a more recent study, Hoque et al (2012) find that legal enforcement (a proxy for
accounting enforcement) had a positive influence on the effects of IFRS adoption on the
reduction of earnings management.
The studies on the influence of IFRS adoption and enforcement often simply assume that all
countries adopting IFRS will benefit from IFRS adoption and that enforcement along with
IFRS adoption will provide further accounting quality improvements. These studies do not
take into account that among the countries that have adopted IFRS there is a large proportion
that already had accounting standards similar to IFRS and had strong enforcement
arrangements, in particular, with regards to securities law disclosure requirements and
auditing. We contend that countries that had accounting standards divergent2 from IFRS are
likely to have more significant effects from the adoption of IFRS. Also, countries that have
not adopted IFRS but have standards relatively similar to IFRS will enjoy lower levels of
earnings management. In this respect, two countries, USA and Canada, stand out. These two
countries have more extensive standards than IFRS. Likewise, we hypothesize that
H1 Earnings management is negatively associated with IFRS adoption and greater
convergence of local standards to IFRS.
As discussed above, legal enforcement arrangements are likely to have a direct positive
influence on earnings quality. Legal enforcement is also likely to enhance the influence of
IFRS and convergence to IFRS. Therefore, we hypothesise that
H2 Earnings management is negatively associated with legal enforcement.
H3 The stronger the legal enforcement the greater will be the influence of IFRS adoption and
convergence of local standards to IFRS on the reduction of earnings management.
IFRS adoption is not simply the replacement of local accounting standards. Most countries
that have adopted IFRS have also enhanced their securities laws and auditing requirements.
For example, to adopt IFRS, EU countries, Australia, New Zealand, and Singapore are
providing legislative support to accounting standards and adopting better auditing standards.
2 Of lower quality as the proponents of IFRS suggest.
7
060 TIJA Symposium 2012
2/1/12
Because of better accounting standards and better enforcement support, we predict that
countries that had standards that were less convergent with IFRS are likely to experience
higher reduction in earnings management. Therefore, we hypothesize that:
H4 For IFRS adoption countries, the reduction of earnings management is higher for those
countries that had local standards less convergent to IFRS prior to IFRS adoption.
3. Research design
3.1. Dependent variable: earnings management
We use earnings management as the dependent variable to represent accounting quality that is
particularly responsive to reporting incentives (Burgstahler et al., 2006). Following Leuz et al.
(2003)3 we use two country-level measures of earnings management to capture the two
different dimensions along which insiders exercise the discretion to manipulate earnings,
namely, 1) the variation of accruals, and 2) the magnitude of accruals. The first captures the
degree of earnings smoothing, while the second measures the managerial discretion in
reported earnings. The measures are further explained below:
1) Smoothing measure: the variation of accruals
Earnings smoothing is defined as “an attempt on the part of the firm’s management to reduce
abnormal variations in earnings to the extent allowed under sound accounting and
management principles” (Beidleman, 1973, 653). To capture the degree of earnings
smoothing, the first earnings management measure (EM1) in formula (1) is a country’s
median ratio4 of the firm-level standard deviation of operating earnings divided by the
firm-level standard deviation of cash flow from operations. The scaling by cash flow from
operations controls for differences in the variability of economic performance across firms. A
low value indicates that management exercises accounting discretion to smooth reported
earnings.
3 Leuz et al. (2003) use two measures: the correlation between changes in accounting accruals and operating
cash flows, and the small loss avoidance. We find that these two measures are not suitable for our study, because
one year’s change in accruals may relate to changes in operating cash flows in several subsequent years, and the
small loss avoidance cannot be used for a country in a given year that has a small number of firms in the sample.
These two measures only suit the analysis when pooling the firm-level data in a relatively long time period, and
with a large sample size. We test the correlation between the aggregate earnings management score calculated
by Leuz et al.’s (2003) four measures and the aggregate score based on our two measures, and find a positive
Spearman’s correlation (p<0.01). 4 We use the median ratio to allow direct firm size comparisons across countries, and to avoid extreme values.
8
060 TIJA Symposium 2012
2/1/12
EM1 = Median (StdDev (Operating Income) / StdDev (Cash Flow from Operations)) (1)
Cash flow from operations is computed by subtracting the accruals from operating income
because cash flow information of firms is not available in some countries, especially prior to
2001, as in formula (2):
Cash Flow from Operations = Operating Income – Accruals (2)
Following Dechow, Sloan, and Sweeney (1995) accruals are calculated as in formula (3):
Accrualsit = (ΔCAit – ΔCashit) – (ΔCLit - ΔSTDit - ΔTPit) – Depit (3)
Where:
ΔCAit = change in total current assets,
ΔCashit = change in cash & short-term investments;
ΔCLit = change in total current liabilities,
ΔSTDit = change in short-term debt included in current liabilities,
ΔTPit = change in income taxes payable, and
Depit = depreciation and amortization expense, for firm i in year t.
2) Discretion measure: the magnitude of accruals
The second earnings management measure (EM2) captures the magnitude of accruals. It is
used as a proxy for management discretion in reported earnings. It is computed as a country’s
median ratio of the absolute value of firms’ accruals divided by the absolute value of firms’
cash flows from operations in a fiscal year. A larger value is interpreted as higher earnings
management.
EM2 = Median (|Accruals|/|Cash Flow from Operations|) (4)
Finally, to reduce measurement error, we combine EM1 and EM2 into an aggregate earnings
management measure (EM12)5. High values of EM12 suggest high levels of earnings
management.
5 This aggregate measure is positively and significantly correlated with the component extracted from a
principal component analysis of EM1 and EM2 (not tabulated).
9
060 TIJA Symposium 2012
2/1/12
EM12 = (- 1) * EM1 + EM2 (5)
We reverse the direction of EM1 by multiplying it by -1, to make higher values represent
higher earnings management.
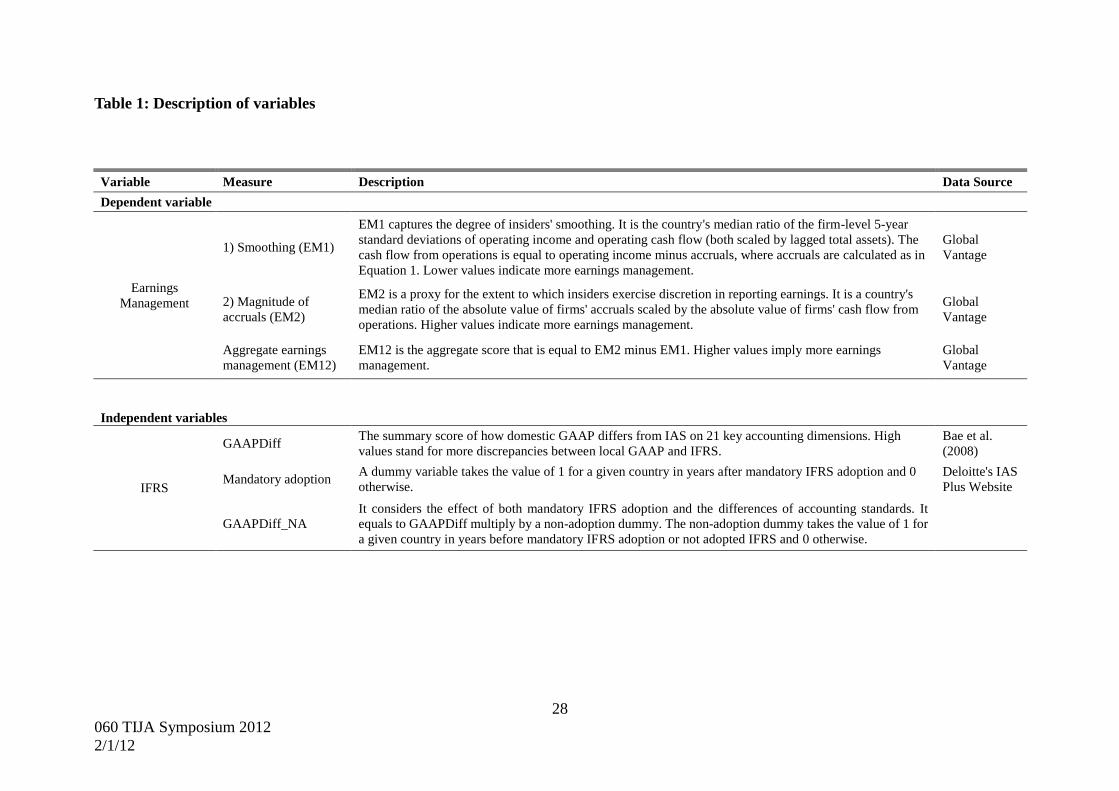
[Insert Table 1 here]
3.2. Independent variables: accounting standards and enforcement
3.2.1. Accounting standards
To measure the extent of IFRS adoption, we include Bae, Tan, and Welker’s (2008)6
summary score of difference between local GAAP and IFRS (GAAPDiff) to indicate how
each country’s local accounting standards differ from IFRS. This measure ranges from 0 to 21,
with higher values for more discrepancies between each country’s local GAAP and IFRS.
We use a dummy variable for mandatory IFRS adoption. ‘Mandatory adoption’ takes the
value of 1 for a given country in years ending on or after the mandatory IFRS adoption year,
and 0 otherwise (see Table 4 for mandatory adoption Year).
Alternatively, by considering the effect of discrepancy of accounting standards and IFRS
adoption together, we create a variable by multiplying GAAPDiff and a non-adoption dummy.
The non-adoption dummy variable takes the value of 1 for non-adoption countries or for
countries in years prior to mandatory IFRS adoption and 0 for otherwise. For example, high
values stand for more discrepancies between local GAAP and IFRS for non-adoption
countries or for adoption countries in pre-IFRS periods, while 0 indicates the countries in
years after mandatory IFRS adoption or the countries have 0 score of GAAPDiff (such as
Singapore and South Africa).
3.2.2. Enforcement
Ball et al. (2003) and Soderstrom and Sun (2007) argue that accounting standards alone do
not determine the quality of financial reporting. Country-level enforcement factors are likely
to have a powerful influence on earnings management, especially after mandatory IFRS
6 Bae et al. (2008) develop two measures of differences in accounting standards for 1,176 country pairs based
on an international survey of generally accepted accounting principles in 2001. We use their first measure that
involves identifying a list of 21 important accounting rules.
10
060 TIJA Symposium 2012
2/1/12
adoption. However, the enforcement of accounting standards is difficult to measure and
quantify, as it takes different forms in different countries. To develop a good measure of
enforcement, we start from the following definitions:
“Enforcement” is defined by the European Federation of Accountants (FEE) as “...a system to
whenever possible prevent, and hereafter identify and correct, material errors or omissions in
the application of IFRS in financial information and other regulatory statements issued to the
public...” (FEE, 2002, 31). The Committee of European Securities Regulators (CESR)
defines “enforcement” as “...the combination of supervision and sanctioning in cases of
non-compliance with the rules...” (FEE, 2002, 31).
An enforcement system for accounting standards has internal and external effects. Internally,
IFRS are enforced by accountants through preparing the financial reports, internal auditors
through internal audits, and audit committee/board/AGM through corporate governance.
Externally, IFRS are enforced by external auditors, national IFRS enforcement bodies,
financial market regulators and the press. An efficient and effective enforcement has six
aspects: 1) self-enforcement through the preparation of financial statements; 2) a statutory
audit of financial statements; 3) approval of financial statements; 4) an institutional oversight
system; 5) litigation and legal sanctions; and 6) public and press reactions (FEE, 2001). FEE
(2001) argues that large differences in legal environments can explain part of the differences
in enforcement mechanisms, which relate to the institutional oversight systems. Further, FEE
(2001) observes that the enforcement of accounting standards differs significantly across
countries, and is even nonexistent in some countries.
The above statements indicate that the country-level measure of enforcement can be based on
legal factors and the institutional oversight system. To capture these factors, we slightly
modify Hope’s (2003) comprehensive measure of enforcement7 by using four country-level
factors: 1) insider trading laws, 2) judicial efficiency, 3) rule of law, and 4) shareholder
protection. First, we aggregate these four measures by assigning equal weights to each
variable. We also conduct a principal component analysis to avoid the problem of
multicollinearity.
7 We exclude audit spending in Hope’s (2003) measure for two reasons. First, Hope (2003, 242) realizes that
audit spending is not a perfect measure of the audit quality, as it covers only the top 10 audit firms. Second,
although audit spending contributes to part of the country-level enforcement, including it or not does not affect
the result of analysis.
11
060 TIJA Symposium 2012
2/1/12
The first element of enforcement, insider trading laws, may deter insiders from manipulating
earnings to profit from trading in the firm’s stock (Hope, 2003). Beneish and Vargus (2002)
show that insider trading is associated with earnings management. Aboody, Hughes, and Liu
(2005) find that privately informed traders earn greater profits when trading stocks with high
earnings quality risk factors. In our study, we use the aggregate insider trading law index
developed by Beny (2005), which equals the sum of sections of the statute as follows: (1)
tipping, (2) tippee, (3) damages, and (4) criminal or the sum of scope and sanction. It ranges
from 0 to 4, with 0 indicating the least restrictive insider trading legal regime and 4 indicating
the most restrictive insider trading legal regime.
The second and third elements, judicial efficiency and rule of law, are from La Porta et al.
(1998). Judicial efficiency indicates the efficiency and integrity of the legal environment as it
affects business, while rule of law assesses a country’s law and order tradition. As explained
by Hope (2003), although a country’s judicial system might be functioning well without
enforcement of accounting standards, generally standards enforcement is strongly associated
with a strong judicial system, and accounting regulations tend to be effective in countries
with strict rules of law. Both judicial efficiency and rule of law range from 0 to 10, with
lower scores for less efficiency and less tradition for law and order.
The inclusion of the above legal variables8 is consistent with Schipper’s (2005) argument
that enforcement power resides in the security exchanges and courts where firms are listed.
However, because the security exchanges in most IFRS adoption countries require audit
reports compliant with IFRS or have similar requirements such as compliance with “IFRS as
adopted by EU”, “NZ FRS”, or “Hong Kong FRS” (Deloitte’s IAS Plus Website, 2011), we
do not code this basic requirement into the measure of a country’s IFRS enforcement
mechanisms.
Finally, Hung (2001), Ball et al. (2000), and Leuz et al. (2003) infer that countries with strong
shareholder protection are expected to enact and enforce accounting rules and securities laws
that limit earnings manipulation. Thus, in weak shareholder protection environments,
managers are more likely to violate accounting standards to manipulate earnings. Hence, we
use La Porta et al.’s (1998) anti-director rights index as the fourth enforcement variable. It is
8 The four legal variables represent the legal and political system factors identified by Soderstrom and Sun
(2007). Even though accounting enforcement is conceptually different to legal enforcement, they are strongly
connected.
12
060 TIJA Symposium 2012
2/1/12
an aggregate measure of minority shareholder rights, ranging from 0 to 6, where 0 (6)
indicates the weakest (strongest) investor protection.
3.3. Control variables
To isolate the relation between earnings management, IFRS adoption and enforcement
mechanisms, we control for other country-level institutional factors such as ownership
structure, financial market development, capital structure and tax system identified by
Soderstrom and Sun (2007). These factors also affect the quality of financial reporting.
Rahman, Yammeesri, and Perera (2010) show that institutional variables such as ownership
structure, nature of debt, and regulations vary systematically between countries affecting the
levels of accruals based earnings quality.
3.3.1. Ownership structure
We control for ownership structure by using an ownership concentration measure. La Porta et
al. (1998) show that firms in countries with concentrated ownership have less demand for
financial reporting and more earnings management. Soderstrom and Sun (2007) provide that
controlling shareholders have incentives to smooth earnings, as they not only have access to
inside information, but also have incentives to hide their exploitation of the wealth of
minority shareholders. Both theory (Shleifer and Wolfenzon, 2002) and prior evidence (La
Porta et al., 1998; La Porta, Lopez-De-Silanes, Shleifer, and Vishny, 1999) show that
ownership concentration is lower in countries with better investor protection. Leuz et al.
(2003) find that firms in countries with relatively dispersed ownership, strong investor
protection and large stock markets exhibit lower levels of earnings management than
countries with relatively concentrated ownership, weak investor protection, and less
developed stock markets.
3.3.2. Financial market development
We control for financial market development because the demand for financial information
from market participants may provide incentives for firms to improve the quality of financial
reporting. Many (e.g., Leuz et al., 2003; Burgstahler et al., 2006; Djankov, La Porta,
Lopez-de-Silanes, and Shleifer, 2008) find that firms in countries with large and highly
developed equity markets engage in less earnings management, as financial markets can

13
060 TIJA Symposium 2012
2/1/12
screen out firms with less informative earnings. We use market liquidity9 as our market
development variable because Levine and Zervos (1998) and Atje and Jovanovic (1993) find
that market liquidity is positively associated with economic growth, and Huddart, Hughes,
and Brunnermeier (1999) find that high liquidity lowers the costs of capital, motivating firms
to make earnings more informative.
3.3.3. Capital structure
Capital structure can affect the level of earnings management in two ways. First, an important
incentive for earnings management is to reduce the likelihood of violating debt covenants
(Healy and Wahlen, 1999). In theory, when firms have more debt, managers have more
incentives to engage in earnings manipulation to maintain the contractual covenants (Watts
and Zimmerman, 1978). Ali and Hwang (2000) and Soderstrom and Sun (2007) argue that
banks demand less financial reporting than do shareholders because banks have private
access to firm management.
Incentives to manage earnings also exist in countries with high levels of equity finance. For
example, the presence of bonuses and executive stock options can motivate managers to
enhance accruals to increase accounting earnings. However, this is countered by better
investor protection arrangements in such countries.
In contrast, firms in countries with more public debt tend to have less earnings management,
because creditors such as bond holders have more monitoring power, especially in countries
with high creditor protection.
We use a country’s median ratio of total long-term debt and total assets (LT Debt / TA) as the
proxy of the capital structure (bank debt is not available in Global Vantage) where total
long-term debt in Global Vantage represents all interest-bearing obligations due after the
current operating cycle.
3.3.4. Tax system
In countries with close conformity between tax and financial accounting rules, firms are
likely to choose conservative accounting methods to keep earnings down. However, some
9 We also use stock market capitalization as the market development variable and have similar results (not
reported).
14
060 TIJA Symposium 2012
2/1/12
studies find that firms in countries with high tax-book conformity along with high tax rates
have less scope to decrease earnings (Guenther and Young, 2000; Burgstahler et al., 2006).
While it is unclear what effect taxation has on earnings management, we feel that it is
important to control for the effect of taxation as an additional influence on accounting
practice. High tax rates increase the incentive to reduce taxable earnings and hide profits in
financial reporting (Soderstrom and Sun, 2007). Since the actual tax rates are not easy to
compare across countries, we use a country’s median ratio of total income taxes to total assets
(Total taxes / TA) obtained from Global Vantage database to reflect the tax burden of the
country.
3.4 Regression models
We employ the following models to test our hypothesis that earnings management is
negatively associated with IFRS adoption and stronger legal enforcement. In Models (1) to
(6), we test the effects of mandatory adoption by using a mandatory adoption dummy
variable and GAAPDiff separately, with the alternative measure of IFRS adoption
(GAAPDiff_NA) tested in models (7) and (8). In model (8), we use Generalized Linear
Model (GLM) for the interactions between GAAPDiff_NA and the principal components of
legal enforcement.
Model (1) – (6):
EM12 = β0+ β1GAAPDiff + β2 Mandatory Adoption + β3 Legal Enforcement + β4 Ownership Concentration + β5
Market Liquidity + β6LT Debt/TA + β7TotalTaxes/TA + Year Dummies + ε
Model (7):
EM12 = β0+ β1GAAPDiff_NA + β2Enforcement_PC1 + β3Enforcement_PC2 + β4Enforcement_PC3 + β5
Ownership Concentration + β6 Market Liquidity + β7LT Debt/TA + β8TotalTaxes/TA + Year Dummies +
ε
Model (8):
EM12 = β0+ β1GAAPDiff_NA + β2Enforcement_PC1 + β3GAAPDiff_NA*Enforcement_PC1 +
β4Enforcement_PC2 + β5GAAPDiff_NA*Enforcement_PC2 + β6Enforcement_PC3 +
β7GAAPDiff_NA*Enforcement_PC3 + β8 Ownership Concentration + β9 Market Liquidity + β10LT
Debt/TA + β11TotalTaxes/TA + Year Dummies + ε
Where EM12 is the aggregate score that is equal to magnitude of accruals (EM2) minus
smoothing (EM1). GAAPDiff is the summary score of how domestic GAAP differs from IAS
15
060 TIJA Symposium 2012
2/1/12
on 21 key accounting dimensions; Mandatory Adoption is a dummy that takes 1 for the
period after mandatory adoption and 0 otherwise; GAAPDiff_NA is a combined measure for
the effect of both mandatory IFRS adoption and the differences of accounting standards, by
multiplying GAAPDiff and a non-adoption dummy10
, high values stand for more
discrepancies between local GAAP and IFRS, and 0 indicates no difference between
domestic GAAP and IFRS, or the countries have already mandatorily adopted IFRS; The
legal enforcement variables are introduced one at a time in model (1) to (4), the aggregate
enforcement measure is used in model (5), and the principal components are employed in
model (7); Ownership Concentration is measured as the median percentage of common
shares owned by the top 3 shareholders in the ten largest privately owned non-financial firms
in a given country; Market Liquidity is the total value of market trading as a percentage of the
country's GDP; LT Debt/TA is the country's median ratio of total long-term debt and total
assets; Total Taxes/TA is the country's median ratio of total income taxes and total assets.
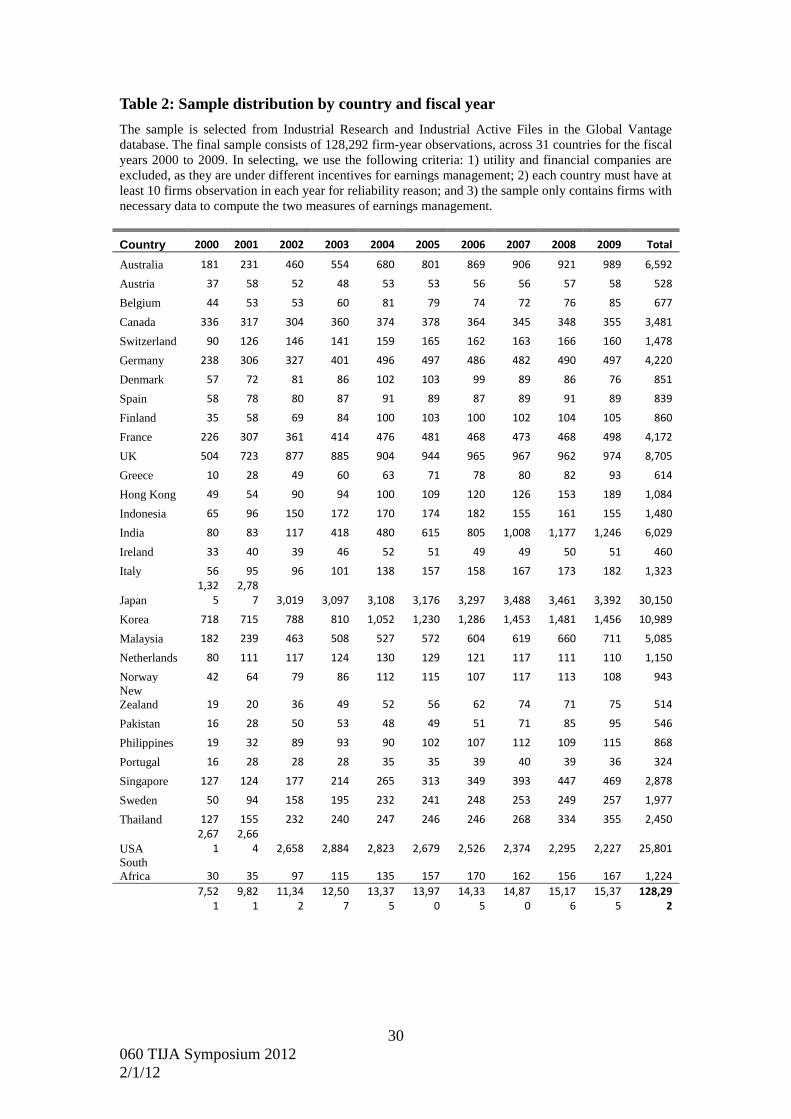
3.5. Sample selection
The sample is obtained from the Global Vantage: Industrial Research and Industrial Active
datasets. Following previous research (Leuz et al. 2003; Lin and Paananen, 2006), we
exclude financial service firms such as banks and financial institutions because it is difficult
and problematic to compute their discretionary accruals. We also exclude utility companies
because they are regulated and have different incentives to manage earnings from companies
in unregulated industries. To ensure sufficient observations in any given country and year for
computing EM1 and EM2, each country must have at least 10 firm observations in each year.
We also exclude firm-year observations with missing financial data that is necessary for
computing EM1 and EM2. For example, because EM1 requires calculation of the standard
deviation of operating earnings and standard deviation of cash flow, each firm must have
income statement and balance sheet information for at least five consecutive years. We obtain
data from 1996 for computing the consecutive five-yearly standard deviations of EM1 in year
2000. To extend the work of Leuz et al. (2003), the sample period for the analyses is from
2000 to 2009.
Table 2 shows the sample distribution by country and fiscal year. The final sample consists of
128,292 firm-year observations, across 31 countries for the fiscal years 2000 to 2009.
10
The non-adoption dummy is simply one less adoption dummy, representing the non-adoption countries and
adoption countries in years prior to mandatory IFRS adoption.
16
060 TIJA Symposium 2012
2/1/12
[Insert Table 2 here]
4. Descriptive statistics and empirical analysis
4.1. Descriptive statistics for earnings management
Table 3 provides descriptive statistics for the two individual earnings management measures
in Panel A and Panel B respectively, as well as their aggregate measure in Panel C. The signs
in the heading of the panels indicate whether higher values imply more earnings management
(+) or less earnings management (-). While the U.S. is yet to adopt IFRS, prior studies have
found high quality earnings due to high quality accounting standards and strong regulatory
and institutional arrangements. Furthermore, our data show that Canada also has a low level
of earnings management and strong institutions similar to the U.S. Therefore, we use the
average earnings management of the U.S. and Canada as a benchmark11
.
[Insert Table 3 here]
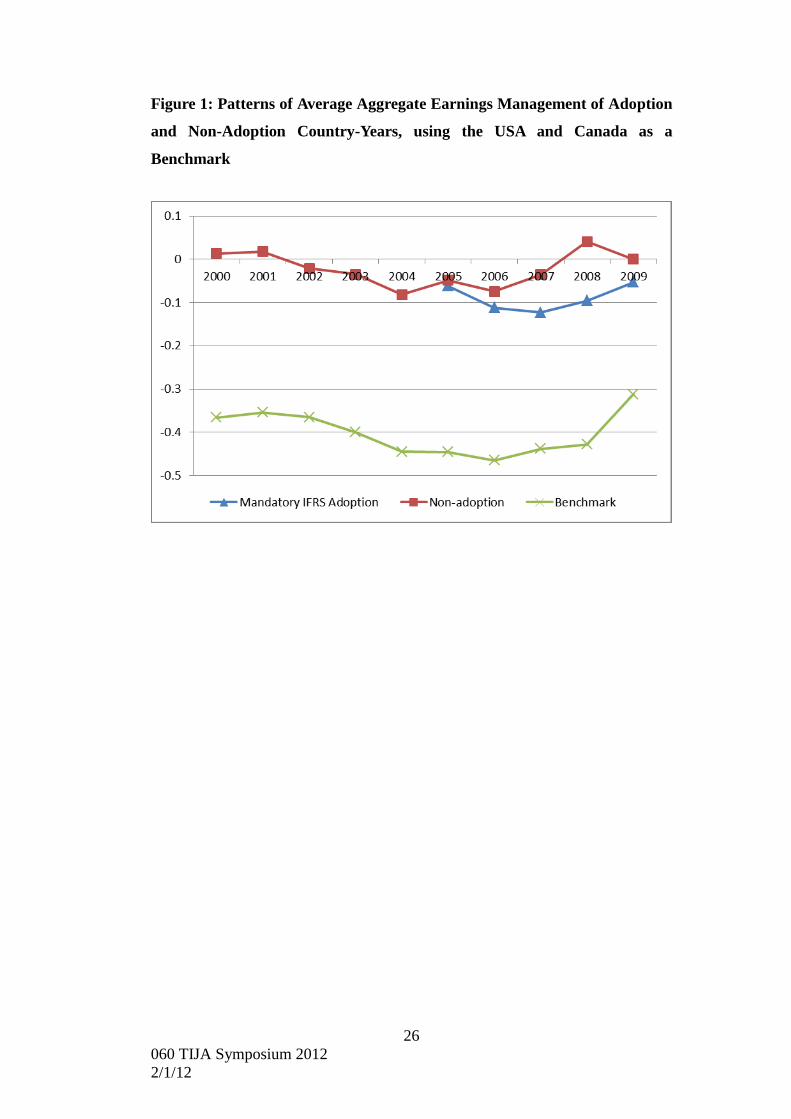
Figure 1 provides a comparison of the average earnings management of the IFRS adoption
group, non-adoption group, and the benchmark of U.S. and Canada. It shows that there is no
particular trend for the level of earnings management over the years. On average, the IFRS
adoption group has a slightly lower level of earnings management than the non-adoption
group, while the benchmark of the U.S. and Canada has the lowest level of earnings
management. However, a selection bias may exist in this study because the number of
non-adoption countries is much less than the adoption countries.
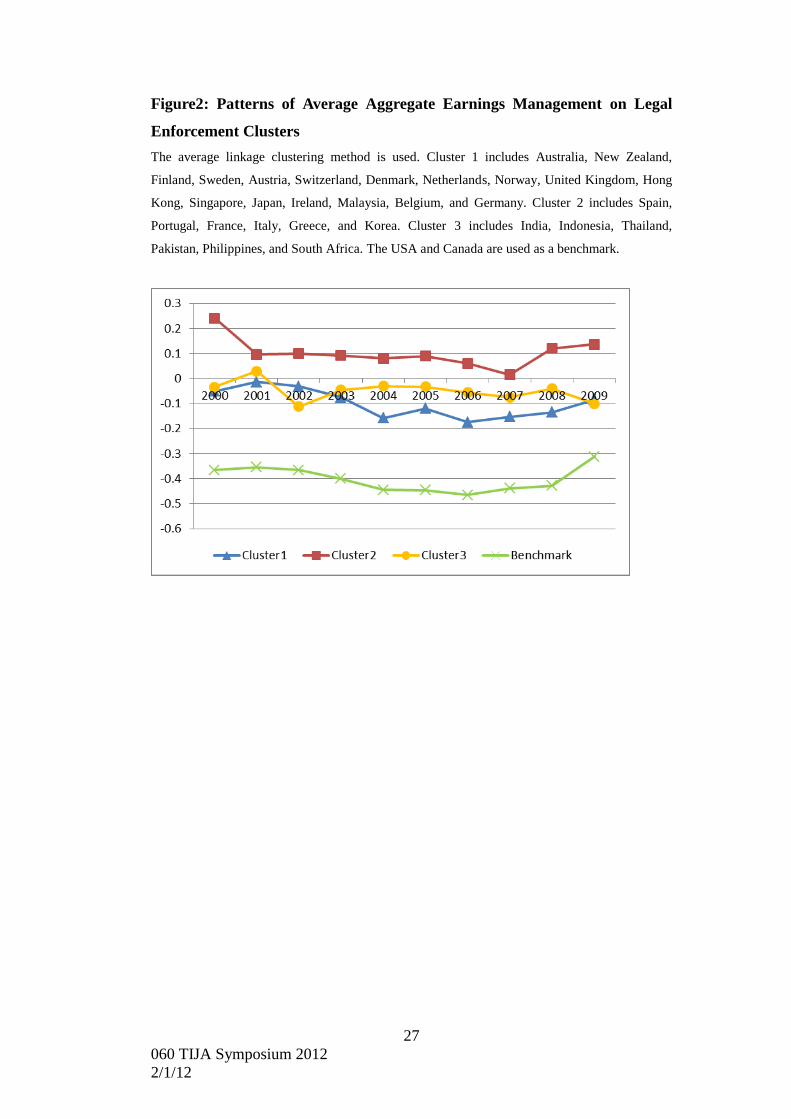
[Insert Figure 1 here]
Based on the four legal enforcement variables, we use a cluster analysis12
to segment the
countries into three major groups. Cluster one includes Australia, New Zealand, Finland,
Sweden, Austria, Switzerland, Denmark, Netherlands, Norway, United Kingdom, Hong Kong,
Singapore, Japan, Ireland, Malaysia, Belgium, and Germany. Cluster two includes Spain,
Portugal, France, Italy, Greece, and Korea. Cluster three includes India, Indonesia, Thailand,
Pakistan, Philippines, and South Africa. By using the U.S. and Canada benchmark, we
compare the average earnings management between the three clusters. Figure 2 shows that
11
The result is similar, when we only use U.S. data as the benchmark (not tabulated). 12
The U.S. and Canada used as a benchmark are excluded from the cluster analysis.
17
060 TIJA Symposium 2012
2/1/12
cluster one with stronger legal enforcement on average has a lower level of earnings
management than cluster two and three, the weaker legal enforcement clusters. Cluster three
has the highest level of earning management. Again, the benchmark group of the U.S. and
Canada has the lowest level of earnings management.
[Insert Figure 2 here]
4.2. Institutional characteristics
Table 4 presents the country-by-country data for institutional variables used in this study. The
four legal enforcement factors and their aggregate measure show that countries such as the
U.S., Canada, New Zealand, Australia and the United Kingdom have the highest enforcement
scores, while Indonesia, Philippines, Pakistan, and Thailand have the lowest.
For ownership, the U.S., Taiwan, and UK show the smallest ownership concentration, while
Greece, Belgium, and Indonesia have the largest ownership concentration. The accounting
standards difference index shows that Singapore, South Africa and the United Kingdom have
the smallest number of differences from IFRS, while Greece, Spain, Finland and Portugal
have the largest number of differences. The mandatory adoption year is used for coding the
IFRS adoption and non-adoption year dummies.
[Insert Table 4 here]
4.3. Bivariate correlations
Table 5 reports the Pearson and Spearman correlation coefficients for the correlations
between pooled earnings management measures13
and various country-level institutional
variables.
As expected, the pooled smoothing measure (EM1) and the pooled magnitude of accruals
(EM2) are negatively correlated with a Pearson coefficient of -0.611 (p < 0.01) or a Spearman
coefficient of -0.628 (p < 0.01), suggesting that EM1 and EM2 capture somewhat distinct
aspects of earnings management.
The proxy for accounting standards (GAAPDiff) is positively correlated with pooled
13
The pooled measure is the average over the sample period of 2000 to 2009.
18
060 TIJA Symposium 2012
2/1/12
AggregateEM (0.458) at a highly significant level (p < 0.01), suggesting that the quality of
accounting standards is an important factor affecting accounting quality.
Consistent with our hypothesis, the four legal enforcement factors are all negatively
correlated with pooled AggregateEM. Aggregate Enforcement is also negatively correlated
with pooled AggregateEM (-0.498) at a highly significant level (p < 0.01), showing that
countries with stronger legal enforcement generally have less earnings management.
The control variable Ownership Concentration is positively correlated with pooled
AggregateEM (0.616) at a highly significant level (p < 0.01), suggesting that countries with
concentrated ownership generally have high levels of earnings management.
[Insert Table 5 here]
4.4. Principal component analysis
Since the above correlation table shows that the four enforcement variables are somewhat
correlated, we conduct a principal component analysis (PCA) (see Table 6) to identify the
underlying components. Four principal components are identified. The first three components
together explain 96.7% of the total variation. We ignore the last principal component for the
regressions in the next two sub-sessions.
The first principal component (Enforcement_PC1) explains 50.7% of the variations. We
interpret this first principal component as total law enforcement, because three of the four
enforcement variables have strong loadings in the component. Their loadings are: judicial
efficiency (0.597), rule of law (0.666), and insider trading law (0.442).
The second principal component (Enforcement_PC2) explains 28% of the variations. It
mainly represents anti-director rights, which has a loading of 0.872.
The third principal component (Enforcement_PC3) explains 18.1% of the variations. It
mainly represents insider trading laws, which has a loading of 0.818.
[Insert Table 6 here]
19
060 TIJA Symposium 2012
2/1/12
4.5. Regressions
Consistent with the results of the bivariate correlations, Table 7 shows that the results of
country-year level linear regressions with aggregate earnings management as the dependent
variable. We control for serial/auto correlation across years using year dummies14
. The
adjusted R-squares for the regressions range from 42.4% to 45.9%.
Models 1 to 6 show that GAAPDiff is positively and significantly associated with earnings
management (β1 ranges from 0.014 to 0.016 with all p < 0.01), suggesting that the quality of
accounting standards is relevant to earnings quality. The mandatory adoption dummy is
negatively associated with earnings management, suggesting that the IFRS adoption countries
have lower levels of earnings management in post-adoption periods, compared with the
non-adoption countries and adoption countries in pre-adoption periods.
In models 7 and 8, GAAPDiff_NA (i.e. the combination of mandatory adoption of IFRS and
GAAPDiff) is positively and significantly associated with earnings management, suggesting
that countries with lower accounting standards quality have higher levels of earnings
management. Putting together the results of models 1 to 8, our results indicate that earnings
management is lower for countries that have adopted IFRS or have local standards that
converge with IFRS. This result supports hypothesis H1.
Similar to previous studies, we also find a reduction in earnings management for the
enforcement variables. In OLS models 1 to 4, individually all four legal enforcement factors
are negatively associated with earnings management. Except for the Anti-director rights index,
the other legal enforcement variables are negative at highly significant levels. In OLS models
5 to 7, both the aggregate measure and the principal components of legal enforcement are
negatively and significantly associated with earnings management, indicating that strong
legal enforcement reduces earnings management. Therefore, our results support hypothesis
H2, i.e., earnings management is negatively associated with legal enforcement.
Using General Linear Model (GLM) in 8, the coefficient on the interactions between
GAAPDiff_NA and Enforcment_PC1 is negative and marginally significant at a significance
level of p<0.10, suggesting that stronger legal enforcement can overcome the GAAP
differences to reduce a country’s overall level of earnings management. However, this result
14
The coefficients for year dummies are not tabulated for brevity.
20
060 TIJA Symposium 2012
2/1/12
is not as significant as those of Hoque et al (2012). The main reasons for this are that when
countries are adopting IFRS they are also making additional securities law arrangement for
enforcing IFRS and for auditing, and several countries, such as Australia, New Zealand,
Singapore and South Africa already had local standards similar to IFRS prior to the official
adoption of IFRS. Note that the coefficient of GAAPDiff_NA in models 7 and 8 are not as
strong as those of Mandatory adoption of IFRS in models 1 to 3. While we do find support
for hypothesis H3, the support is not very significant.
Ownership concentration is significantly and positively associated with earnings management
across various models, suggesting that countries with higher ownership concentration have
higher levels of earnings management. The coefficients for market liquidity15
are close to
zero and not significant. The long-term debt to total assets ratio is negatively associated with
earnings management, suggesting that the monitoring power of the debt holders reduces
earnings management. The total taxes to total assets ratio is also negatively associated with
earning management. Consistent with Guenther and Young (2000) and Burgstahler et al.
(2006), the countries with high tax rates have less scope to decrease earnings.
[Insert Table 7 here]
For hypothesis H4, we conduct tests to ascertain whether or not for IFRS adoption countries,
the reduction of earnings management is higher for those countries that had local standards
less convergent to IFRS prior to IFRS adoption. The results for these tests are presented in
Table 8. The results show that out of the 22 countries in our sample that adopted IFRS, the
number of countries with reductions in earnings management increased from 8 to 19 within a
period of three years after IFRS adoption. We also find a negative correlation between
GAAPDiff immediately prior IFRS adoption and earnings management change. The results
show that while the initial two years after IFRS adoption the association between GAAPDiff
and EM12 was minimal, but by the third year this association had become quite large (-0.212)
and in the fourth year the trend of EM12 reducing continued (-0.180). Because GAAPDiff is
a categorical variable, we conducted ANOVA and found the third year F-statistic 3.120 to be
significant at p <0.10. Although the results are not very strong, there is a clear indication that
the countries with higher GAAPDiff are enjoying reductions in earnings management.
[Insert Table 8 here]
15
When we replace market liquidity with market capitalization, the results are similar.
21
060 TIJA Symposium 2012
2/1/12
4.7. Sensitivity tests
Our results are robust across several sensitivity tests (not tabulated). (1) We examine the
minimum sample size of 10 firm observations in each country-year by changing this
requirement to at least 30 firm observations in each country-year, and find similar results. (2)
The results remain similar, when we use a principal component of EM1 and EM2 to replace
the aggregate earnings management as the dependent variable in the regressions. (3) The
mandatory adoption dummy remains significant, when we use an additional dummy variable
for indicating countries during the period of voluntary adoption IFRS, which is also
negatively associated with the aggregate earnings management. (4) Some of our enforcement
variables and ownership concentration are drawn from studies conducted several years ago16
,
and may have changed over time. The results are not affected by using an alternative time
variant measure of rule of law drawn from World Bank Worldwide Governance Indicators17
to replace the time-invariant rule of law drawn from La Porta et al. (2008). Here, the rule of
law reflects perceptions of the extent to which agents have confidence in and abide by the
rules of society, and in particular the quality of contract enforcement, property rights, the
police, and the courts, as well as the likelihood of crime and violence (Kaufmann, Kraay, and
Mastruzzi, 2010). It is estimated annually, and available from 1996 to 2010. (5) We have
multi-year data for the earnings management variables, which are positively correlated,
because our smoothing measure is calculated using the standard deviation of data from the
previous five years and moves for every five-year period. Another reason is that the firms
with high accruals in a certain year are also likely to have high accruals in following years.
We conduct autoregressive regressions to control for the potential autocorrelation problem.
All estimated coefficients from the time series method are consistent with the results of linear
regressions. (6) We acknowledge that many institutional factors link and interact with each
other, adding noise to the models. Also, because we have two measures of earnings
management, we conduct additional tests, such as canonical correlation analysis to control for
the correlations between the two earnings management measures, and between the various
institutional factors. The results from the alternative multivariate methods are consistent with
16
We assume that the changes of these institutions are costly and time consuming and the changes are gradual,
although these variables are slowly changing over time. For example, some countries have renewed their
enforcement systems to support the adoption of IFRS. 17
The Worldwide Governance Indicators (WGI) including the alternative rule of law measure is downloaded
from http://info.worldbank.org/governance/wgi/pdf/wgidataset.xls.
22
060 TIJA Symposium 2012
2/1/12
our regressions.
In summary, the results of the bivariate correlations, OLS regressions, GLM, and robustness
tests support our hypothesis that both good accounting standards quality and strong legal
enforcement are necessary to reduce earnings management.
5. Conclusion
Although accounting standards are now harmonized in many countries, the lack of uniformity
and comparability in the enforcement of accounting standards across borders reduces the
benefits of IFRS adoption to improve accounting quality, which is of concern to accounting
standard setters, regulators, and investors. We examine this concern by investigating the
effects of IFRS adoption and legal enforcement on the differences in earnings management
across 31 countries. A unique step we take in this study is to take into account the level of
convergence that had already taken place in a country prior to IFRS adoption. We took this
because countries that have had large changes in their accounting standards and policies
would enjoy the benefits of IFRS adoption more than the countries that already had higher
quality accounting standards and policies.
The findings show that mandatory adoption of IFRS and strong enforcement reduce earnings
management. However, the effects of legal enforcement are not as strong as ascertained in
previous studies when the difference between pre-IFRS accounting standards and IFRS are
taken into account. Also, we find that countries with less convergent standards to IFRS
benefit more from IFRS adoption. These findings highlight the importance of IFRS adoption
in countries with lower quality accounting standards and institutional settings than for those
with better accounting arrangements. Currently, the International Accounting Standards
Board (IASB) is focused on aligning IFRS with the US accounting standards. Our results
suggest that alignment with US standards would have lower benefits than the effort to
encourage countries with less developed accounting institutional arrangements to adopt IFRS.
23
060 TIJA Symposium 2012
2/1/12
References
Aboody, D., Hughes, J. & Liu, J. (2005). Earnings quality, insider trading, and cost of capital.
Journal of Accounting Research, 43(5), 651-673.
Ali, A. & Hwang, L. (2000). Country-specific factors related to financial reporting and the
value relevance of accounting data. Journal of Accounting Research, 38(1), 1-21.
Atje, R. & Jovanovic, B. (1993). Stock market and development. European Economic Review,
37, 632-640.
Bae, K. -H., Tan, H. & Welker, M. (2008). International GAAP differences: The impact on
foreign analysts. The Accounting Review, 83(3), 593–628.
Ball, R., Kothari, S. & Robin, A. (2000). The effect of international institutional factors on
properties of accounting earnings. Journal of Accounting and Economics, 29, 1-52.
Ball, R., Robin, A. & Wu, J. S. (2003). Incentives versus Standards: Properties of Accounting
Income in Four East Asian Countries, and Implications for Acceptance of IAS. Journal
of Accounting and Economics, 36, 235–270.
Barth, M., Landsman, W. & Lang, M. (2008). International accounting standards and
accounting quality. Journal of Accounting Research, 46(3), 467-498.
Beidleman, C. (1973). Income smoothing: the role of management. The Accounting Review,
48(4), 653-667.
Beneish, M. D. & Vargus, M. E. (2002). Insider trading, earnings quality, and accrual
mispricing. The Accounting Review, 77(4), 755-791. M.D.
Beneish, M. D. & Yohn, T. L. (2008). Information friction and investor home bias: A
perspective on the effect of global IFRS adoption on the extent of equity home bias,
Journal of Accounting and Public Policy, 27, 433–443.
Beny, L. N. (2005). Do insider trading laws matter? Some preliminary comparative evidence.
American Law and Economics Review, 7(1), 144-183.
Bhattacharya, U., Daouk, H. & Welker, M. (2003). The world price of earnings opacity. The
Accounting Review, 78(3), 641-678.
Boonlert-U-Thai, K., Meek, G. K. & Nabar, S. (2006). Earnings attributes and
invetor-protection: International evidence. The International Journal of Accounting,
41(4), 327-357.
Burgstahler, D., Hail, L. & Leuz. C. (2006). The importance of reporting incentives: Earnings
management in European private and public firms. The Accounting Review, 81(5),
983–1016.
Callao, S. & Jarne, J. I. (2010) Have IFRS affected earnings management in the European
Union? Accounting in Europe, 7(2), 159-189.
Chen, H., Tang, Q., Jiang, Y. & Lin, Z. (2010). The role of international financial reporting
standards in accounting quality: evidence from the European Union. Journal of
International Financial Management and Accounting, 21(3), 220-278.
Daske, H. & Gebhardt, G. (2006). International financial reporting standards and experts’
perceptions of disclosure quality. Abacus, 42(3-4), 461-498.
Daske, H., Hail, L., Leuz, C. & Verdi, R. (2008), Mandatory IFRS reporting around the world:
early evidence on the economic consequences. Journal of Accounting Research, 46(5),
1085-142.
Dechow, P., Sloan, R. & Sweeney, A. (1995). Detecting earnings management. The
Accounting Review, 70, 193-225.
Deloitte’s IAS Plus Website. (2011). Use of IFRSs by jurisdiction. Retrieved September 1,
2011, from http://www.iasplus.com/country/useias.htm .
24
060 TIJA Symposium 2012
2/1/12
Ding, Y., Hope, O., Jeanjean, T. & Stolowy, H. (2007). Differences between domestic
accounting standards and IAS: measurement, determinants and implications. Journal of
Accounting and Public Policy, 26(1), 1-38.
Djankov, S., La Porta, R., Lopez-de-Silanes, F. & Shleifer, A. (2008). The law and economics
of self-dealing. Journal of Financial Economics, 88, 430-465.
Ewert, R. & Wagenhofer, A. (2005). Economic effects of tightening accounting standards to
restrict earnings management. The Accounting Review, 80, 1101-1124.
FEE. (2001). Enforcement mechanisms in Europe: A preliminary investigation of oversight
systems. Retrieved June 2, 2008, from http://www.fee.be/fileupload/upload/
Enforcement MechanismsinEurope153200520952.pdf.
FEE. (2002). Discussion paper on enforcement of IFRS within Europe. Retrieved June 5,
2008, from http://www.iasplus.com/resource/feenforc.pdf.
Guenther, D. & Young, D. (2000). The association between financial accounting measures
and real economic activity: a multinational study. Journal of Accounting and
Economics, 29(1), 53-72.
Healy, P. & Wahlen, J. (1999). A review of the earnings management literature and its
implication for standard setting. Accounting Horizons, 13, 365-383.
Holthausen, R. W. (2003). Testing the relative power of accounting standards versus
incentives and other institutional features to influence the outcome of financial
reporting in an international setting, Journal of Accounting and Economics, 36,
271-283.
Hope. O. -K. (2003). Disclosure practices, enforcement of accounting standards, and analysts’
forecast accuracy: an international study. Journal of Accounting Research, 41(2),
235-272.
Hoque, M., Zijl, T., Dunstan, K. & Karim, W. (2011). The effect of IFRS Adoption and
investor protection on earnings quality around the world. International Journal of
Accounting, Forthcoming.
Huddart, S., Hughes, J. & Brunnermeier, M. (1999). Disclosure requirements and stock
exchange listing choices in an international context. Journal of Accounting and
Economics, 26, 237-269.
Hung, M. (2001). Accounting standards and value relevance of financial statement: An
international analysis. Journal of Accounting and Economics, 30 (3), 401-420.
Jeanjean, T. & Stolowy, H. (2008). Do accounting standards matter? An exploratory analysis
of earnings management before and after IFRS adoption. Journal of Accounting and
Public Policy, 27, 480–494.
Kaufmann, D., Kraay, A. & Mastruzzi, M. (2010). The Worldwide Governance Indicators : A
summary of methodology, data and analytical issues. World Bank Policy Research
Working Paper No.543. Retrieved December 1, 2011, from
http://papers.ssrn.com/sol3/papers.cfm?abstract_id=1682130.
La Porta, R., Lopez-De-Silanes, F., Shleifer, A. & Vishny, R. (1998). Law and finance.
Journal of Political Economy, 106(6), 1113-55
La Porta, R., Lopez-De-Silanes, F., Shleifer, A. & Vishny, R. (1999). The quality of
government. Journal of Law, Economics and Organization, 15, 222-279.
Leuz, C., Nanda, D. & Wysocki, P. D. (2003). Earnings management and investor protection:
an international comparison. Journal of Financial Economics, 69, 505-527.
Levine, R. & Zervos, S. (1998). Stock markets, banks and economic growth. American
Economic Review, 88, 537-558.
Lin, H. & Paananen, M. (2006). The effect of financial systems on earnings management
among firms reporting under IFRS. Business School Working Papers UHBS 2006-2.
Retrieved 20/5/08 from https://uhra.herts.ac.uk/dspace/bitstream/2299/714/1/S61.pdf.
25
060 TIJA Symposium 2012
2/1/12
Pope, P. F. & Walker, M. (1999). International differences in the timeliness, conservatism,
and classification of earnings. Journal of Accounting Research, 37(Supplement), 53-87.
Rahman, A., Yammeesri, J. & Perera, H. (2010). Financial reporting quality in international
settings: A comparative study of the USA, Japan, Thailand, France and Germany. The
International Journal of Accounting, 45(1), 1-34.
Schipper, K. (2005). The introduction of International Accounting Standards in Europe:
implications for international convergence. European Accounting Review, 14(1),
101-126.
Shleifer, A. & Vishny, R. (1997), A survey of corporate governance, The Journal of Finance,
52 (2), 737-783.
Shleifer, A. & Wolfenzon, D. (2002). Investor protection and equity markets. Journal of
Financial Economics, 66(1), 3–27.
Soderstrom, N. S. & Sun, K. J. (2007). IFRS adoption and accounting quality: a review.
European Accounting Review, 16(4), 675-702.
Watts, R. L. & Zimmerman, J. L. (1978). Towards a positive theory of the determination of
accounting standards. The Accounting Review, 53, 112-134.
Barth, M., Landsman, W. & Lang, M. (2008). International accounting standards and
accounting quality. Journal of Accounting Research, 46(3), 467-498.
Callao, S. & Jarne, J. I. (2010) Have IFRS affected earnings management in the European
Union? Accounting in Europe, 7(2), 159-189.
Chen, H., Tang, Q., Jiang, Y. & Lin, Z. (2010). The role of international financial reporting
standards in accounting quality: evidence from the European Union. Journal of
International Financial Management and Accounting, 21(3), 220-278.
Daske, H., Hail, L., Leuz, C. & Verdi, R. (2008), Mandatory IFRS reporting around the world:
early evidence on the economic consequences. Journal of Accounting Research, 46(5),
1085-142.
Jeanjean, T. & Stolowy, H. (2008). Do accounting standards matter? An exploratory analysis
of earnings management before and after IFRS adoption. Journal of Accounting and
Public Policy, 27, 480–494.
26
060 TIJA Symposium 2012
2/1/12
Figure 1: Patterns of Average Aggregate Earnings Management of Adoption
and Non-Adoption Country-Years, using the USA and Canada as a
Benchmark
27
060 TIJA Symposium 2012
2/1/12
Figure2: Patterns of Average Aggregate Earnings Management on Legal
Enforcement Clusters
The average linkage clustering method is used. Cluster 1 includes Australia, New Zealand,
Finland, Sweden, Austria, Switzerland, Denmark, Netherlands, Norway, United Kingdom, Hong
Kong, Singapore, Japan, Ireland, Malaysia, Belgium, and Germany. Cluster 2 includes Spain,
Portugal, France, Italy, Greece, and Korea. Cluster 3 includes India, Indonesia, Thailand,
Pakistan, Philippines, and South Africa. The USA and Canada are used as a benchmark.
28
060 TIJA Symposium 2012
2/1/12
Table 1: Description of variables
Variable Measure Description Data Source
Dependent variable
Earnings
Management
1) Smoothing (EM1)
EM1 captures the degree of insiders' smoothing. It is the country's median ratio of the firm-level 5-year
standard deviations of operating income and operating cash flow (both scaled by lagged total assets). The
cash flow from operations is equal to operating income minus accruals, where accruals are calculated as in
Equation 1. Lower values indicate more earnings management.
Global
Vantage
2) Magnitude of
accruals (EM2)
EM2 is a proxy for the extent to which insiders exercise discretion in reporting earnings. It is a country's
median ratio of the absolute value of firms' accruals scaled by the absolute value of firms' cash flow from
operations. Higher values indicate more earnings management.
Global
Vantage
Aggregate earnings
management (EM12)
EM12 is the aggregate score that is equal to EM2 minus EM1. Higher values imply more earnings
management.
Global
Vantage
Independent variables
IFRS
GAAPDiff The summary score of how domestic GAAP differs from IAS on 21 key accounting dimensions. High
values stand for more discrepancies between local GAAP and IFRS.
Bae et al.
(2008)
Mandatory adoption A dummy variable takes the value of 1 for a given country in years after mandatory IFRS adoption and 0
otherwise.
Deloitte's IAS
Plus Website
GAAPDiff_NA
It considers the effect of both mandatory IFRS adoption and the differences of accounting standards. It
equals to GAAPDiff multiply by a non-adoption dummy. The non-adoption dummy takes the value of 1 for
a given country in years before mandatory IFRS adoption or not adopted IFRS and 0 otherwise.
29
060 TIJA Symposium 2012
2/1/12
Independent variables
Legal
Enforcement
1) Insider trading law
The aggregate Insider trading law index equals the sum of (1) Tipping, (2) Tippee, (3) Damages, and (4)
Criminal or equivalently, the sum of Scope and Sanction. It ranges from 0 to 4, with 0 representing the most
lax insider trading legal regime and 4 representing the most restrictive insider trading legal regime.
Beny (2005)
2) Judicial efficiency Assessment of the efficiency and integrity of the legal environment as it affects business. Scale from 0 to 10;
with lower scores, lower efficiency levels.
La Porta et al.
(1998)
3) Rule of law
Assessment of the law and order tradition in the country produced by country risk rating agency
International Country Risk (ICR). Scale from 0 to 6; with lower scores for less tradition for law and order.
La Porta et al.
(1998)
Or reflects perceptions of the extent to which agents have confidence in and abide by the rules of society,
and in particular the quality of contract enforcement, property rights, the police, and the courts, as well as the
likelihood of crime and violence.
World Bank
4) Anti-director rights It is an aggregate measure of (minority) shareholder rights and ranges from 0 to 6, where 0 signifies the
weakest investor protections and 5 signifies the strongest investor protection.
La Porta et al.
(1998)
Aggregate enforcement A comprehensive measure of the enforcement of accounting standards equals to the aggregate score by
assigning equal weights to above 4 country-level variables. High values stand for strong enforcement.
Control variables
Ownership structure Ownership
Concentration
It is measured as the median percentage of common share owned by the top 3 shareholders in the ten largest
privately owned non-financial firms in a given country. High values stand for high ownership concentration.
La Porta et al.
(1998)
Financial market
development
Market liquidity It equals to the total value of market trading as a percentage of a country's GDP. This indicator complements
the market capitalization ratio by showing whether market size is matched by trading. World Bank
Stock market
capitalization
The ratio of stock market capitalization to gross domestic product. Market capitalization (also known as
market value) is the share price times the number of shares outstanding. World Bank
Capital Structure LT Debt / TA It is the country's median ratio of total long-term debt and total assets, where total long-term debt represents
interest-bearing obligations due after the current operating cycle.
Global
Vantage
Tax Total Taxes / TA It is the country's median ratio of total income taxes and total assets, where total income taxes represents all
taxes imposed on income by local, provincial/state, national, and foreign governments.
Global
Vantage
30
060 TIJA Symposium 2012
2/1/12
Table 2: Sample distribution by country and fiscal year
The sample is selected from Industrial Research and Industrial Active Files in the Global Vantage
database. The final sample consists of 128,292 firm-year observations, across 31 countries for the fiscal
years 2000 to 2009. In selecting, we use the following criteria: 1) utility and financial companies are
excluded, as they are under different incentives for earnings management; 2) each country must have at
least 10 firms observation in each year for reliability reason; and 3) the sample only contains firms with
necessary data to compute the two measures of earnings management.
Country 2000 2001 2002 2003 2004 2005 2006 2007 2008 2009 Total
Australia 181 231 460 554 680 801 869 906 921 989 6,592
Austria 37 58 52 48 53 53 56 56 57 58 528
Belgium 44 53 53 60 81 79 74 72 76 85 677
Canada 336 317 304 360 374 378 364 345 348 355 3,481
Switzerland 90 126 146 141 159 165 162 163 166 160 1,478
Germany 238 306 327 401 496 497 486 482 490 497 4,220
Denmark 57 72 81 86 102 103 99 89 86 76 851
Spain 58 78 80 87 91 89 87 89 91 89 839
Finland 35 58 69 84 100 103 100 102 104 105 860
France 226 307 361 414 476 481 468 473 468 498 4,172
UK 504 723 877 885 904 944 965 967 962 974 8,705
Greece 10 28 49 60 63 71 78 80 82 93 614
Hong Kong 49 54 90 94 100 109 120 126 153 189 1,084
Indonesia 65 96 150 172 170 174 182 155 161 155 1,480
India 80 83 117 418 480 615 805 1,008 1,177 1,246 6,029
Ireland 33 40 39 46 52 51 49 49 50 51 460
Italy 56 95 96 101 138 157 158 167 173 182 1,323
Japan
1,325
2,787 3,019 3,097 3,108 3,176 3,297 3,488 3,461 3,392 30,150
Korea 718 715 788 810 1,052 1,230 1,286 1,453 1,481 1,456 10,989
Malaysia 182 239 463 508 527 572 604 619 660 711 5,085
Netherlands 80 111 117 124 130 129 121 117 111 110 1,150
Norway 42 64 79 86 112 115 107 117 113 108 943 New
Zealand 19 20 36 49 52 56 62 74 71 75 514
Pakistan 16 28 50 53 48 49 51 71 85 95 546
Philippines 19 32 89 93 90 102 107 112 109 115 868
Portugal 16 28 28 28 35 35 39 40 39 36 324
Singapore 127 124 177 214 265 313 349 393 447 469 2,878
Sweden 50 94 158 195 232 241 248 253 249 257 1,977
Thailand 127 155 232 240 247 246 246 268 334 355 2,450
USA
2,671
2,664 2,658 2,884 2,823 2,679 2,526 2,374 2,295 2,227 25,801
South
Africa 30 35 97 115 135 157 170 162 156 167 1,224
7,521
9,821
11,342
12,507
13,375
13,970
14,335
14,870
15,176
15,375
128,292
31
060 TIJA Symposium 2012
2/1/12
Table 3: Country scores for earnings management measures
EM1 in Panel A is the earnings smoothing measure, which is the country’s median ratio of the
firm-level standard deviations of operating income and operating cash flow, both scaled by
lagged total assets. EM2 in Panel B is the earnings discretion measure, which is the country’s
median ratio of the absolute value of accruals and the absolute value of the cash flow from
operations. EM12 in Panel C is the aggregate earnings management score, which is equal to
EM2 minus EM1. The sign in the heading indicates where higher scores for the respective
measure represent more earnings management (+) or less earnings management (-).
Panel A: Earnings smoothing measures: EM1 = σ(OpInc) /σ(CFO) (-)
Country 2000 2001 2002 2003 2004 2005 2006 2007 2008 2009
Australia 0.688 0.736 0.787 0.814 0.872 0.877 0.868 0.828 0.852 0.835
Austria 0.404 0.350 0.368 0.472 0.457 0.424 0.486 0.428 0.478 0.664
Belgium 0.363 0.459 0.423 0.495 0.468 0.478 0.476 0.525 0.558 0.584
Canada 0.738 0.813 0.788 0.788 0.784 0.798 0.834 0.787 0.788 0.777
Switzerland 0.429 0.616 0.719 0.724 0.788 0.685 0.722 0.623 0.592 0.638
Germany 0.431 0.477 0.524 0.557 0.628 0.568 0.551 0.534 0.510 0.556
Denmark 0.587 0.541 0.565 0.543 0.542 0.589 0.598 0.601 0.590 0.649
Spain 0.372 0.431 0.457 0.407 0.444 0.460 0.358 0.366 0.417 0.498
Finland 0.560 0.622 0.717 0.758 0.779 0.722 0.739 0.649 0.634 0.747
France 0.422 0.428 0.472 0.548 0.557 0.515 0.530 0.524 0.490 0.510
UK 0.663 0.686 0.736 0.742 0.702 0.671 0.651 0.652 0.666 0.687
Greece 0.403 0.466 0.414 0.382 0.377 0.502 0.558 0.494 0.537 0.518
Hong Kong 0.565 0.551 0.566 0.570 0.608 0.626 0.498 0.576 0.581 0.635
Indonesia 0.513 0.528 0.631 0.576 0.610 0.551 0.559 0.551 0.579 0.611
India 0.669 0.637 0.667 0.590 0.570 0.546 0.558 0.595 0.547 0.561
Ireland 0.711 0.880 0.820 0.763 0.746 0.547 0.612 0.532 0.677 0.701
Italy 0.364 0.507 0.499 0.494 0.497 0.488 0.499 0.490 0.476 0.538
Japan 0.457 0.558 0.554 0.544 0.542 0.566 0.577 0.553 0.539 0.620
Korea 0.498 0.510 0.565 0.571 0.619 0.639 0.655 0.642 0.624 0.602
Malaysia 0.615 0.626 0.556 0.545 0.523 0.547 0.558 0.544 0.551 0.611
Netherlands 0.383 0.553 0.581 0.601 0.650 0.687 0.683 0.624 0.541 0.699
Norway 0.697 0.705 0.736 0.705 0.744 0.731 0.689 0.666 0.658 0.585
New Zealand 0.509 0.478 0.469 0.626 0.596 0.614 0.714 0.710 0.704 0.667
Pakistan 0.439 0.428 0.536 0.499 0.527 0.474 0.447 0.505 0.476 0.636
Philippines 0.541 0.548 0.534 0.537 0.482 0.493 0.468 0.445 0.437 0.405
Portugal 0.337 0.412 0.421 0.382 0.355 0.451 0.379 0.406 0.398 0.480
Singapore 0.524 0.550 0.616 0.594 0.696 0.636 0.600 0.580 0.597 0.607
Sweden 0.649 0.769 0.842 0.853 0.888 0.835 0.839 0.817 0.758 0.809
Thailand 0.573 0.560 0.571 0.582 0.576 0.570 0.595 0.606 0.680 0.650
USA 0.801 0.854 0.863 0.862 0.856 0.827 0.802 0.796 0.785 0.828
South Africa 0.622 0.683 0.716 0.685 0.693 0.684 0.753 0.711 0.751 0.802
Mean 0.533 0.579 0.604 0.607 0.619 0.606 0.608 0.592 0.596 0.636
Median 0.524 0.551 0.566 0.576 0.608 0.570 0.595 0.580 0.581 0.635
Std. Dev. 0.128 0.134 0.138 0.132 0.142 0.121 0.132 0.118 0.115 0.106
32
060 TIJA Symposium 2012
2/1/12
Panel B: Earnings discretion measure: EM2 = │Acc│/│CFO│ (+)
Country 2000 2001 2002 2003 2004 2005 2006 2007 2008 2009
Australia 0.496 0.494 0.452 0.422 0.380 0.350 0.370 0.329 0.300 0.336
Austria 0.557 0.717 0.613 0.700 0.592 0.651 0.479 0.481 0.481 0.662
Belgium 0.595 0.629 0.701 0.565 0.531 0.583 0.421 0.458 0.501 0.592
Canada 0.403 0.470 0.458 0.431 0.386 0.390 0.369 0.371 0.360 0.505
Switzerland 0.426 0.548 0.567 0.527 0.434 0.421 0.363 0.323 0.457 0.501
Germany 0.606 0.604 0.706 0.717 0.611 0.620 0.529 0.436 0.558 0.628
Denmark 0.458 0.692 0.680 0.558 0.436 0.535 0.547 0.449 0.393 0.647
Spain 0.425 0.518 0.546 0.531 0.538 0.510 0.488 0.397 0.505 0.656
Finland 0.324 0.467 0.527 0.558 0.514 0.523 0.491 0.415 0.450 0.758
France 0.441 0.513 0.504 0.501 0.491 0.524 0.443 0.465 0.506 0.587
UK 0.456 0.530 0.496 0.512 0.503 0.454 0.445 0.438 0.416 0.483
Greece 1.167 0.565 0.495 0.487 0.469 0.677 0.560 0.465 0.536 0.685
Hong Kong 0.615 0.653 0.578 0.662 0.568 0.763 0.677 0.781 0.767 0.682
Indonesia 0.543 0.559 0.611 0.759 0.600 0.651 0.662 0.559 0.485 0.538
India 0.492 0.421 0.477 0.426 0.453 0.553 0.586 0.584 0.625 0.623
Ireland 0.229 0.380 0.372 0.409 0.368 0.481 0.358 0.376 0.298 0.568
Italy 0.505 0.549 0.609 0.646 0.569 0.629 0.651 0.512 0.535 0.763
Japan 0.586 0.533 0.604 0.559 0.507 0.464 0.444 0.440 0.469 0.637
Korea 0.578 0.579 0.572 0.618 0.653 0.623 0.645 0.655 0.813 0.642
Malaysia 0.718 0.762 0.697 0.661 0.682 0.618 0.611 0.642 0.667 0.625
Netherlands 0.335 0.460 0.624 0.599 0.490 0.462 0.367 0.367 0.420 0.557
Norway 0.588 0.592 0.684 0.667 0.575 0.521 0.496 0.452 0.522 0.567
New Zealand 0.423 0.638 0.396 0.334 0.334 0.344 0.337 0.382 0.339 0.402
Pakistan 0.383 0.629 0.285 0.447 0.552 0.332 0.288 0.332 0.662 0.430
Philippines 0.769 0.873 0.803 0.648 0.761 0.654 0.714 0.674 0.588 0.521
Portugal 0.724 0.600 0.700 0.549 0.610 0.630 0.549 0.518 0.765 0.632
Singapore 0.561 0.651 0.731 0.641 0.617 0.604 0.590 0.695 0.735 0.700
Sweden 0.402 0.585 0.620 0.547 0.409 0.370 0.375 0.376 0.426 0.514
Thailand 0.577 0.609 0.528 0.520 0.528 0.533 0.498 0.537 0.560 0.592
USA 0.405 0.489 0.461 0.420 0.364 0.344 0.337 0.336 0.355 0.475
South Africa 0.390 0.473 0.276 0.393 0.379 0.400 0.295 0.278 0.303 0.355
Mean 0.522 0.574 0.560 0.549 0.513 0.523 0.483 0.468 0.510 0.576
Median 0.496 0.565 0.572 0.549 0.514 0.524 0.488 0.449 0.501 0.592
Std. Dev. 0.171 0.103 0.127 0.107 0.104 0.116 0.121 0.123 0.142 0.107
33
060 TIJA Symposium 2012
2/1/12
Panel C: Aggregate measure: EM12 = EM2-EM1 (+)
Country 2000 2001 2002 2003 2004 2005 2006 2007 2008 2009
Australia -0.192 -0.242 -0.335 -0.392 -0.492 -0.527 -0.498 -0.499 -0.551 -0.499
Austria 0.153 0.366 0.245 0.228 0.135 0.228 -0.006 0.053 0.003 -0.003
Belgium 0.232 0.170 0.278 0.069 0.063 0.105 -0.055 -0.068 -0.057 0.008
Canada -0.335 -0.343 -0.329 -0.357 -0.398 -0.408 -0.465 -0.416 -0.427 -0.272
Switzerland -0.003 -0.068 -0.152 -0.197 -0.353 -0.264 -0.359 -0.300 -0.135 -0.137
Germany 0.175 0.126 0.182 0.160 -0.017 0.052 -0.022 -0.098 0.047 0.071
Denmark -0.128 0.150 0.115 0.014 -0.106 -0.054 -0.052 -0.152 -0.196 -0.002
Spain 0.053 0.087 0.090 0.124 0.094 0.050 0.131 0.031 0.088 0.158
Finland -0.236 -0.155 -0.190 -0.200 -0.265 -0.199 -0.248 -0.235 -0.184 0.011
France 0.020 0.085 0.032 -0.047 -0.066 0.009 -0.087 -0.059 0.016 0.077
UK -0.208 -0.156 -0.240 -0.230 -0.199 -0.216 -0.206 -0.214 -0.250 -0.204
Greece 0.764 0.100 0.081 0.105 0.093 0.175 0.002 -0.029 -0.001 0.167
Hong Kong 0.050 0.101 0.011 0.092 -0.040 0.137 0.179 0.206 0.186 0.047
Indonesia 0.029 0.031 -0.021 0.183 -0.010 0.100 0.103 0.008 -0.094 -0.073
India -0.177 -0.216 -0.189 -0.164 -0.117 0.007 0.027 -0.011 0.078 0.062
Ireland -0.482 -0.500 -0.448 -0.355 -0.378 -0.065 -0.253 -0.156 -0.379 -0.133
Italy 0.140 0.042 0.110 0.153 0.072 0.140 0.152 0.022 0.059 0.225
Japan 0.129 -0.026 0.050 0.016 -0.035 -0.102 -0.133 -0.113 -0.070 0.017
Korea 0.080 0.069 0.007 0.047 0.035 -0.016 -0.010 0.013 0.189 0.041
Malaysia 0.103 0.137 0.141 0.116 0.158 0.071 0.053 0.098 0.115 0.015
Netherlands -0.047 -0.093 0.043 -0.002 -0.160 -0.225 -0.316 -0.257 -0.121 -0.142
Norway -0.109 -0.113 -0.051 -0.038 -0.169 -0.210 -0.193 -0.214 -0.136 -0.019
New Zealand -0.086 0.160 -0.073 -0.292 -0.262 -0.269 -0.377 -0.328 -0.365 -0.265
Pakistan -0.056 0.201 -0.251 -0.052 0.025 -0.142 -0.160 -0.173 0.186 -0.206
Philippines 0.228 0.325 0.269 0.111 0.279 0.161 0.246 0.229 0.151 0.116
Portugal 0.387 0.188 0.279 0.167 0.255 0.179 0.170 0.112 0.367 0.152
Singapore 0.037 0.101 0.115 0.047 -0.078 -0.032 -0.010 0.115 0.138 0.092
Sweden -0.247 -0.184 -0.222 -0.306 -0.479 -0.465 -0.464 -0.441 -0.332 -0.295
Thailand 0.004 0.049 -0.043 -0.061 -0.048 -0.037 -0.097 -0.069 -0.120 -0.058
USA -0.397 -0.365 -0.402 -0.443 -0.492 -0.483 -0.465 -0.460 -0.429 -0.353
South Africa -0.232 -0.210 -0.440 -0.292 -0.314 -0.284 -0.458 -0.433 -0.448 -0.447
Mean -0.011 -0.006 -0.043 -0.058 -0.105 -0.083 -0.125 -0.124 -0.086 -0.060
Median 0.004 0.049 0.007 -0.002 -0.066 -0.037 -0.087 -0.098 -0.070 -0.002
Std. Dev. 0.243 0.203 0.215 0.197 0.215 0.211 0.219 0.200 0.228 0.184
34
060 TIJA Symposium 2012
2/1/12
Table 4: Legal enforcement, ownership and IFRS adoption
See Table 1 for the description for the four components of enforcement. Judicial efficiency, rule of law,
and anti-director rights are sourced from La Porta et al. (1998). Insider trading laws index is sourced
from Beny (2005). Enforcement is the aggregate score by assigning equal weights to above four
variables. The results are consistent with those computed from factor analysis. High values stand for
strong enforcement. GAAPDiff is sourced from Bae et al. (2008) with higher values stand for more
discrepancies between local GAAP and IFRS. Mandatory adoption year is used to code the IFRS
adoption dummies.
Country Name
Judicial Efficienc
y
Rule of Law
Insider Trading Laws
Anti-Director Rights
Aggregate Enforcemen
t
Ownership Concentratio
n GAAP Diff
Mandatory
Adoption Year
Australia 10 10 3 4 27 0.28 4 2005
Austria 9.5 10 2 2 23.5 0.51 12 2005
Belgium 9.5 10 3 0 22.5 0.62 13 2005
Canada 9.25 10 4 5 28.25 0.24 5 2011
Switzerland 10 10 3 2 25 0.48 12 2005
Germany 9 9.23 3 1 22.23 0.5 11 2005
Denmark 10 10 3 2 25 0.4 11 2005
Spain 6.25 7.8 3 4 21.05 0.5 16 2005
Finland 10 10 3 3 26 0.34 15 2005
France 8 8.98 4 3 23.98 0.24 12 2005
UK 10 8.57 3 5 26.57 0.15 1 2005
Greece 7 6.18 2 2 17.18 0.68 17 2005
Hong Kong 10 8.22 3 5 26.22 0.54 3 2005
Indonesia 2.5 3.98 2 2 10.48 0.62 4 N.A.
India 8 4.17 2 5 19.17 0.43 8 2011
Ireland 8.75 7.8 3 4 23.55 0.36 6 2005
Italy 6.75 8.33 3 1 19.08 0.6 12 2005
Japan 10 8.98 2 4 24.98 0.18 9 2011
Korea 6 5.35 4 2 17.35 0.23 6 2011
Malaysia 9 6.78 2 4 21.78 0.52 8 2012
Netherlands 10 10 3 2 25 0.31 4 2005
Norway 10 10 1 4 25 0.31 7 2005
New Zealand
10 10 3 4 27 0.51 3 2007
Pakistan 5 3.03 1 5 14.03 0.41 4 2013
Philippines 4.75 2.73 2 3 12.48 0.51 10 2005
Portugal 5.5 8.68 3 3 20.18 0.59 13 2005
Singapore 10 8.57 3 4 25.57 0.53 0 2005
Sweden 10 10 3 3 26 0.28 10 2005
Thailand 3.25 6.25 3 2 14.5 0.48 4 N.A.
USA 10 10 4 5 29 0.12 4 N.A.
South Africa 6 4.42 2 5 17.42 0.52 0 2005
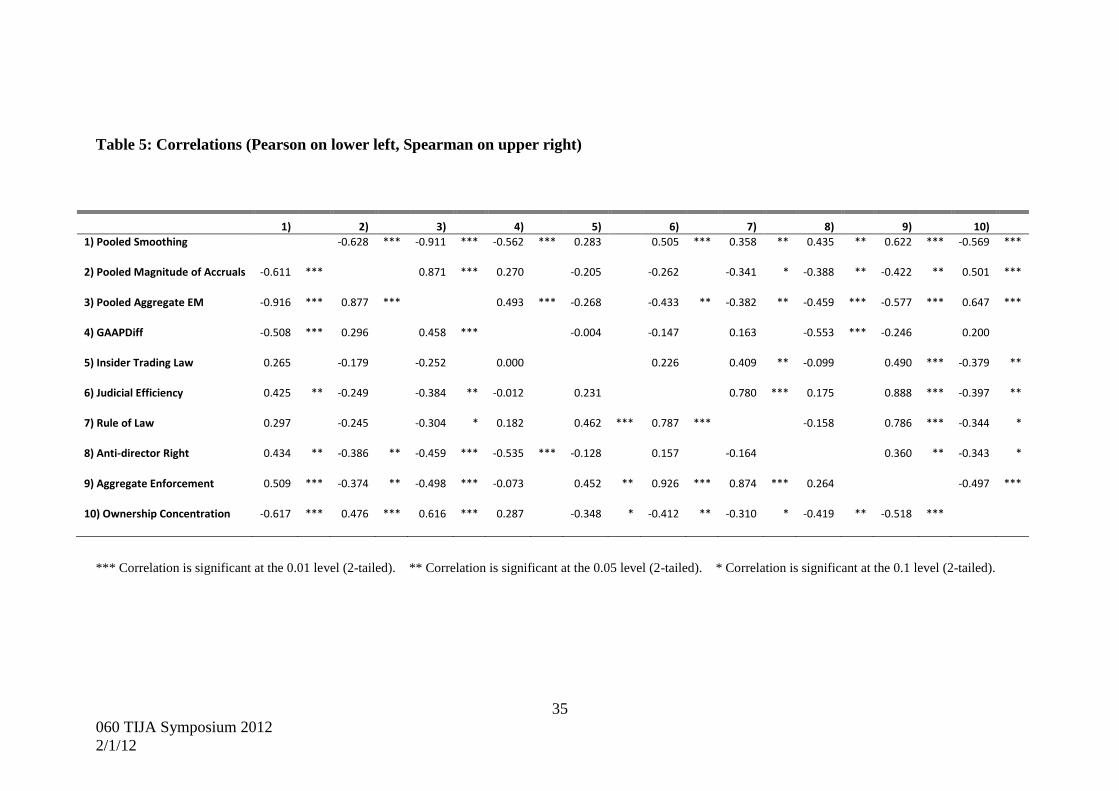
35
060 TIJA Symposium 2012
2/1/12
Table 5: Correlations (Pearson on lower left, Spearman on upper right)
1) 2) 3) 4) 5) 6) 7) 8) 9) 10)
1) Pooled Smoothing
-0.628 *** -0.911 *** -0.562 *** 0.283 0.505 *** 0.358 ** 0.435 ** 0.622 *** -0.569 ***
2) Pooled Magnitude of Accruals -0.611 ***
0.871 *** 0.270 -0.205 -0.262 -0.341 * -0.388 ** -0.422 ** 0.501 ***
3) Pooled Aggregate EM -0.916 *** 0.877 ***
0.493 *** -0.268 -0.433 ** -0.382 ** -0.459 *** -0.577 *** 0.647 ***
4) GAAPDiff -0.508 *** 0.296 0.458 *** -0.004 -0.147 0.163 -0.553 *** -0.246 0.200
5) Insider Trading Law 0.265 -0.179 -0.252 0.000 0.226 0.409 ** -0.099 0.490 *** -0.379 **
6) Judicial Efficiency 0.425 ** -0.249 -0.384 ** -0.012 0.231 0.780 *** 0.175 0.888 *** -0.397 **
7) Rule of Law 0.297 -0.245 -0.304 * 0.182 0.462 *** 0.787 *** -0.158 0.786 *** -0.344 *
8) Anti-director Right 0.434 ** -0.386 ** -0.459 *** -0.535 *** -0.128 0.157 -0.164 0.360 ** -0.343 *
9) Aggregate Enforcement 0.509 *** -0.374 ** -0.498 *** -0.073 0.452 ** 0.926 *** 0.874 *** 0.264 -0.497 ***
10) Ownership Concentration -0.617 *** 0.476 *** 0.616 *** 0.287 -0.348 * -0.412 ** -0.310 * -0.419 ** -0.518 ***
*** Correlation is significant at the 0.01 level (2-tailed). ** Correlation is significant at the 0.05 level (2-tailed). * Correlation is significant at the 0.1 level (2-tailed).
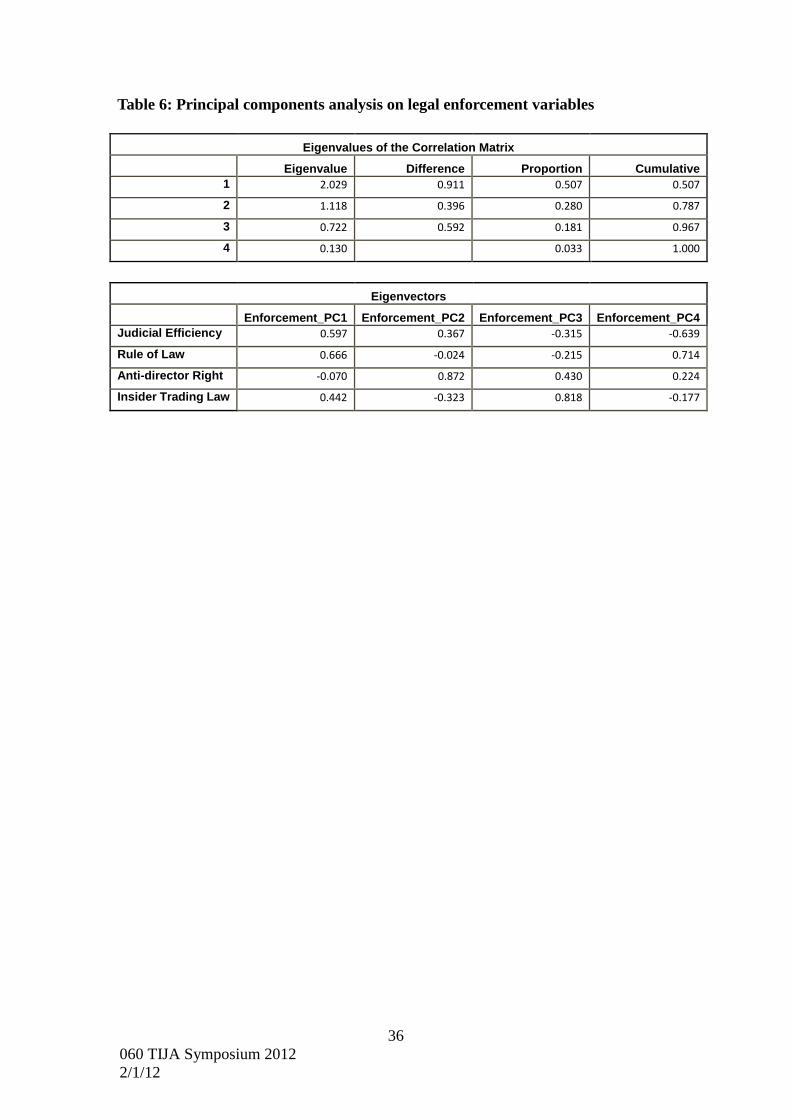
36
060 TIJA Symposium 2012
2/1/12
Table 6: Principal components analysis on legal enforcement variables
Eigenvalues of the Correlation Matrix
Eigenvalue Difference Proportion Cumulative
1 2.029 0.911 0.507 0.507
2 1.118 0.396 0.280 0.787
3 0.722 0.592 0.181 0.967
4 0.130 0.033 1.000
Eigenvectors
Enforcement_PC1 Enforcement_PC2 Enforcement_PC3 Enforcement_PC4
Judicial Efficiency 0.597 0.367 -0.315 -0.639
Rule of Law 0.666 -0.024 -0.215 0.714
Anti-director Right -0.070 0.872 0.430 0.224
Insider Trading Law 0.442 -0.323 0.818 -0.177
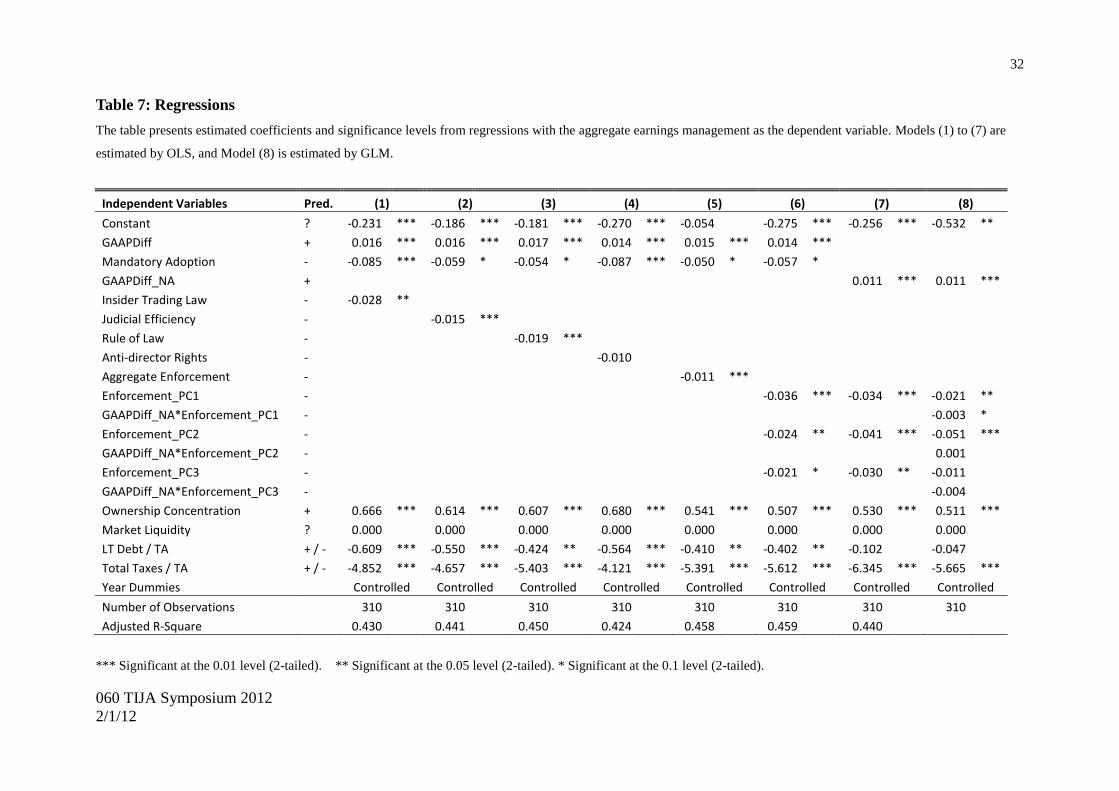
32
060 TIJA Symposium 2012
2/1/12
Table 7: Regressions
The table presents estimated coefficients and significance levels from regressions with the aggregate earnings management as the dependent variable. Models (1) to (7) are
estimated by OLS, and Model (8) is estimated by GLM.
Independent Variables Pred. (1) (2) (3) (4) (5) (6) (7) (8)
Constant ? -0.231 *** -0.186 *** -0.181 *** -0.270 *** -0.054
-0.275 *** -0.256 *** -0.532 **
GAAPDiff + 0.016 *** 0.016 *** 0.017 *** 0.014 *** 0.015 *** 0.014 *** Mandatory Adoption - -0.085 *** -0.059 * -0.054 * -0.087 *** -0.050 * -0.057 * GAAPDiff_NA +
0.011 *** 0.011 ***
Insider Trading Law - -0.028 ** Judicial Efficiency -
-0.015 ***
Rule of Law -
-0.019 *** Anti-director Rights -
-0.010
Aggregate Enforcement -
-0.011 *** Enforcement_PC1 -
-0.036 *** -0.034 *** -0.021 **
GAAPDiff_NA*Enforcement_PC1 -
-0.003 *
Enforcement_PC2 -
-0.024 ** -0.041 *** -0.051 ***
GAAPDiff_NA*Enforcement_PC2 -
0.001 Enforcement_PC3 -
-0.021 * -0.030 ** -0.011
GAAPDiff_NA*Enforcement_PC3 -
-0.004 Ownership Concentration + 0.666 *** 0.614 *** 0.607 *** 0.680 *** 0.541 *** 0.507 *** 0.530 *** 0.511 ***
Market Liquidity ? 0.000
0.000
0.000
0.000
0.000
0.000
0.000
0.000 LT Debt / TA + / - -0.609 *** -0.550 *** -0.424 ** -0.564 *** -0.410 ** -0.402 ** -0.102
-0.047
Total Taxes / TA + / - -4.852 *** -4.657 *** -5.403 *** -4.121 *** -5.391 *** -5.612 *** -6.345 *** -5.665 ***
Year Dummies Controlled Controlled Controlled Controlled Controlled Controlled Controlled Controlled
Number of Observations
310
310
310
310
310
310
310
310 Adjusted R-Square 0.430 0.441 0.450 0.424 0.458 0.459 0.440
*** Significant at the 0.01 level (2-tailed). ** Significant at the 0.05 level (2-tailed). * Significant at the 0.1 level (2-tailed).
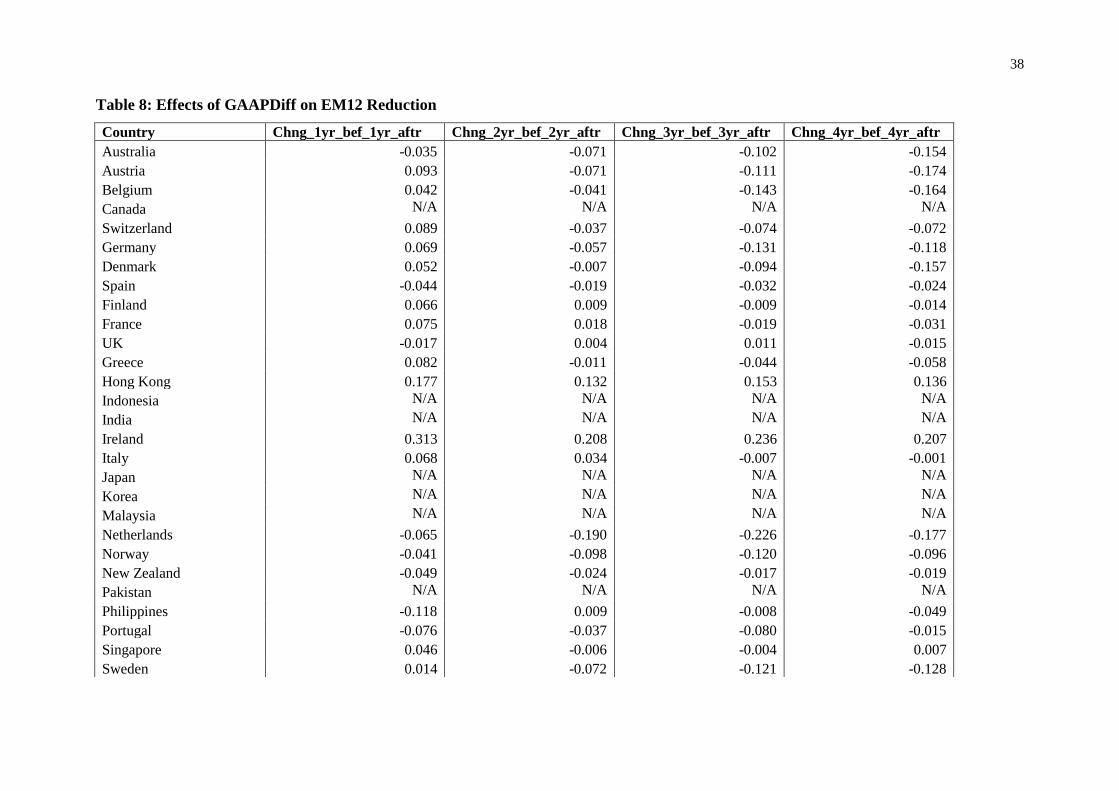
38
Table 8: Effects of GAAPDiff on EM12 Reduction
Country Chng_1yr_bef_1yr_aftr Chng_2yr_bef_2yr_aftr Chng_3yr_bef_3yr_aftr Chng_4yr_bef_4yr_aftr
Australia -0.035 -0.071 -0.102 -0.154
Austria 0.093 -0.071 -0.111 -0.174
Belgium 0.042 -0.041 -0.143 -0.164
Canada N/A N/A N/A N/A
Switzerland 0.089 -0.037 -0.074 -0.072
Germany 0.069 -0.057 -0.131 -0.118
Denmark 0.052 -0.007 -0.094 -0.157
Spain -0.044 -0.019 -0.032 -0.024
Finland 0.066 0.009 -0.009 -0.014
France 0.075 0.018 -0.019 -0.031
UK -0.017 0.004 0.011 -0.015
Greece 0.082 -0.011 -0.044 -0.058
Hong Kong 0.177 0.132 0.153 0.136
Indonesia N/A N/A N/A N/A
India N/A N/A N/A N/A
Ireland 0.313 0.208 0.236 0.207
Italy 0.068 0.034 -0.007 -0.001
Japan N/A N/A N/A N/A
Korea N/A N/A N/A N/A
Malaysia N/A N/A N/A N/A
Netherlands -0.065 -0.190 -0.226 -0.177
Norway -0.041 -0.098 -0.120 -0.096
New Zealand -0.049 -0.024 -0.017 -0.019
Pakistan N/A N/A N/A N/A
Philippines -0.118 0.009 -0.008 -0.049
Portugal -0.076 -0.037 -0.080 -0.015
Singapore 0.046 -0.006 -0.004 0.007
Sweden 0.014 -0.072 -0.121 -0.128
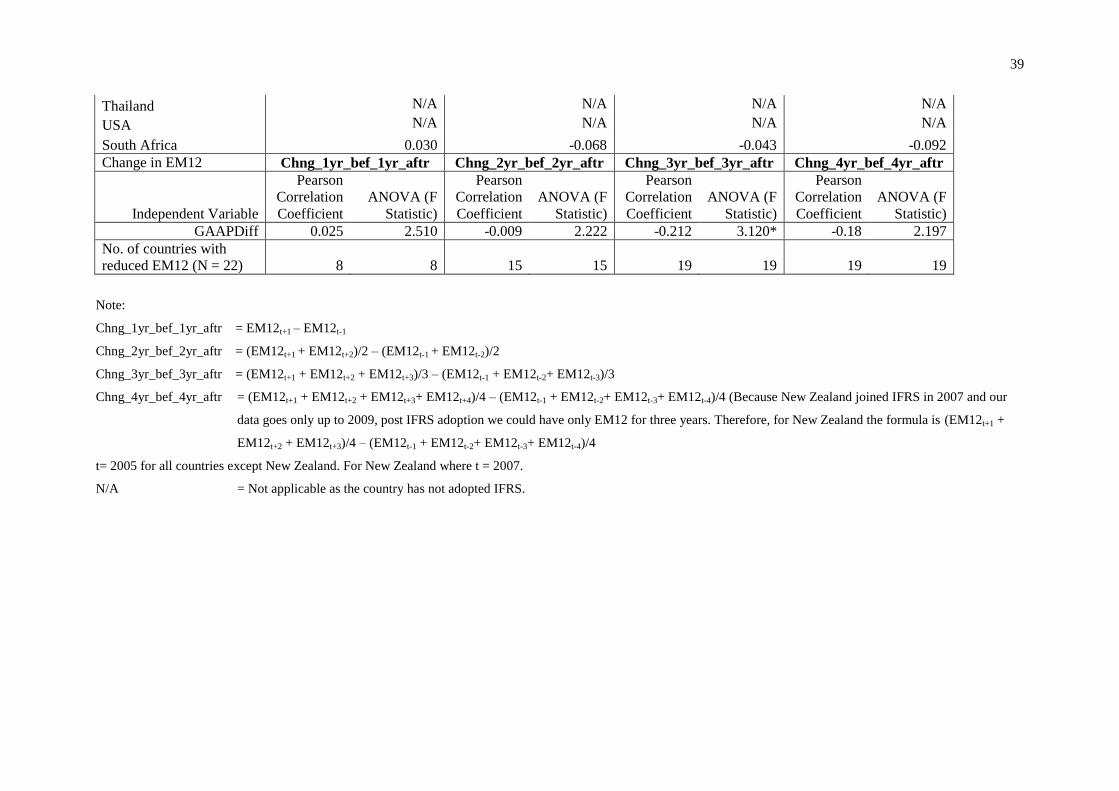
39
Thailand N/A N/A N/A N/A
USA N/A N/A N/A N/A
South Africa 0.030 -0.068 -0.043 -0.092
Change in EM12 Chng_1yr_bef_1yr_aftr Chng_2yr_bef_2yr_aftr Chng_3yr_bef_3yr_aftr Chng_4yr_bef_4yr_aftr
Independent Variable
Pearson
Correlation
Coefficient
ANOVA (F
Statistic)
Pearson
Correlation
Coefficient
ANOVA (F
Statistic)
Pearson
Correlation
Coefficient
ANOVA (F
Statistic)
Pearson
Correlation
Coefficient
ANOVA (F
Statistic)
GAAPDiff 0.025 2.510 -0.009 2.222 -0.212 3.120* -0.18 2.197
No. of countries with
reduced EM12 (N = 22) 8 8 15 15 19 19 19 19
Note:
Chng_1yr_bef_1yr_aftr = EM12t+1 – EM12t-1
Chng_2yr_bef_2yr_aftr = (EM12t+1 + EM12t+2)/2 – (EM12t-1 + EM12t-2)/2
Chng_3yr_bef_3yr_aftr = (EM12t+1 + EM12t+2 + EM12t+3)/3 – (EM12t-1 + EM12t-2+ EM12t-3)/3
Chng_4yr_bef_4yr_aftr = (EM12t+1 + EM12t+2 + EM12t+3+ EM12t+4)/4 – (EM12t-1 + EM12t-2+ EM12t-3+ EM12t-4)/4 (Because New Zealand joined IFRS in 2007 and our
data goes only up to 2009, post IFRS adoption we could have only EM12 for three years. Therefore, for New Zealand the formula is (EM12t+1 +
EM12t+2 + EM12t+3)/4 – (EM12t-1 + EM12t-2+ EM12t-3+ EM12t-4)/4
t= 2005 for all countries except New Zealand. For New Zealand where t = 2007.
N/A = Not applicable as the country has not adopted IFRS.
Recommended