International Research Journal of Engineering and Technology (IRJET) e-ISSN: 2395 -0056
Volume: 02 Issue: 04 | July-2015 www.irjet.net p-ISSN: 2395-0072
© 2015, IRJET.NET- All Rights Reserved Page 1701
Analysis of Cavity and Composite Walls to Improve the Comfort in
Building Envelope using Ecotect
Mr. Abhishek R. Deshmukh1, Prof. M. S. Salunkhe2 Prof. N. N. Shinde3
1Research Student, Department of Technology, Shivaji University, Kolhapur, Maharashtra, India
2,3Professor, Department of Technology, Shivaji University, Kolhapur, Maharshtra, India
---------------------------------------------------------------------***--------------------------------------------------------------------- Abstract- Cavity and Composite walls are used to
insulate the inner building environment form the outer.
But the Experimental analysis can show many
variations due to human errors and instrumental
errors. The use of simulation tools can help in
determining more reliable results that can be used for
complete design of building.
This document concentrates on comfort analysis of
building by analysing the cavity walls and composite
walls in Ecotect Analysis, a building thermal simulation
tool, for Pune region (lat. 18.5 long. 73.8), a moderate
climatic zone in India. It is observed that in this region
increased discomfort is due to too hot discomfort
degree hours (DDH) and study further concentrates on
reducing the too hot discomfort degree hours and
increase the comfort level
Keywords: Cavity wall, Composite wall, Comfort,
Discomfort Degree Hours, Building envelope
1. INTRODUCTION
A building interacts with the environment through its external facades such as roof, walls, windows and projections referred as building envelope. The envelope acts as a thermal shell, which if thoughtlessly constructed, would result in energy leaks through every component. Hence, each components needs to be properly chosen to ensure an energy efficient building. The choice depend onsite and primary objective is to examine the site conditions. Besides an ideal orientation at the site, proper configuration of building envelope plays a significant role in building’s thermal performance.
It is observed in moderate zones in India at Pune (lat. 18.5° long. 73.8°) the increased discomfort level is due to too hot discomfort degree hours, and maximum reduction in too hot DDH is observed for the width of 50 mm for air (minimum possible width) and insulation materials like EPE and EPS.
1.1 Cavity walls
Cavity wall consists of an outer brick or block leaf separated by an inner brick or block leaf by the means of an air gap called as cavity. In cavity walls, the air gap inhibits the transmission of heat into or out of the building as air acts as a bad conductor of heat. In composite walls, the cavities are filled with insulating materials by adjusting its thickness.
1.2 Comfort
Thermal comfort is that condition of mind which expresses satisfaction with the thermal environment. It is also range of climatic condition in which majority of people will not feel discomfort of either heat or cold. Such a zone in still air corresponds to a range of 20 to 30°C of dry bulb temperature and 30 to 60% of relative humidity. Besides, various climatic conditions such as wind speed, vapour pressure and radiation also affect the comfort conditions.
The comfort is measured on the basis of Discomfort Degree hours (DDH). DDH is the sum of the hourly room air temperature outside comfort zone.
2. RESEARCH METHODOLOGY
The analysis consists of following cavities and composite materials
2.1 Selection of Base case for performance evaluation 2.2 Selection of minimum width for air cavity 2.3 Selection of insulation material. 2.4 Selection of efficient width of insulation in walls
2.1 Selection of Base case for performance evaluation
The building envelope acts differently in different climatic zones. Thermal performance of the building can change according to the climate of the region where the building is located, and thus according to the location the availability of material used in construction of the building also differs. Hence, a base case is required to be

International Research Journal of Engineering and Technology (IRJET) e-ISSN: 2395 -0056
Volume: 02 Issue: 04 | July-2015 www.irjet.net p-ISSN: 2395-0072
© 2015, IRJET.NET- All Rights Reserved Page 1702
considered for reference and creating a base for evaluation of building envelope for given climatic zone.
The base case will include the material used for building envelope for a given region. In this case the region under consideration is Pune (lat. 18.5° long. 73.8°) in Maharashtra state of India, which falls under moderate climatic zone of the six climatic zones in India.
The base case for moderate region is given below
Table 1- Base case for building envelope in moderate zones
Building Components
Material assigned
Wall Double Brick plaster
Doors Solid core Pine Timber
Windows Single glazed Aluminium frame
Floor Concrete Slab and Tile on Ground
Roof Concrete and Asphalt
2.2 Selection of minimum width for air cavity
The air cavity is responsible to provide insulation in the cavity wall and acts as barrier to the transmission of heat. Air cavity causes the convective heat transfer which is independent of width of cavity. Due to this the U- value of the air cavity wall remains constant until and the wall material is changed.
Thus it is necessary to select such a width which is minimum and easy for construction of wall and maintain a uniform layer of air between the two leaves of wall.
2.3 Selection of insulation material
Selection of insulation is an important aspect as the material must be low cost, durable, and moisture resistant and most importantly low in thermal conductivity.
The materials selected in this case are Expanded polyethylene (EPE) and Expanded polyesterene (EPS).
Table 2- Thermal conductivity of insulation materials
Material Conductivity (W/ m-°K)
EPE 0.414
EPS 0.035
2.4 Selection of efficient width of insulation in wall
The efficient width of insulation is that which results in maximum reduction of discomfort degree hours and provide maximum comfort as compared to solid walls.
In the region the cavity walls are still not popular in use and thus solid walls are in practise in building envelope.
3. ANALYSIS
Analysis of building envelope is done using the Ecotect Analysis 2011, thermal simulation tool for analysis of buildings. The comfort zone (temperature range) for the given moderate zone is derived from the bio-climatic chart of Pune region (lat. 18.5° long. 73.8°) i.e 22 - 26°C.
The unit of comfort used by the simulation tool is Discomfort Degree Hours (DDH) is the sum of the hourly room temperature outside the comfort zone Thermal analysis of building on the basis of comfort is done for moderate climatic zone. The analysis outcomes obtained from the simulation tool are as follows
Graph 1- Discomfort Degree Hours for Base case
Table 3- Discomfort Degree Hours for Base case
DISCOMFORT DEGREE HOURS
Zone: Zone 1
Zone is not air-conditioned.
Occupancy: Weekdays 00-24, Weekends 00-24.
Comfort: Band = 22.0 - 26.0 C
TOO HOT
TOO COOL TOTAL
MONTH DegHrs DegHrs DegHrs
Jan 55 935 990
Feb 224 474 698
Mar 1137 65 1202
International Research Journal of Engineering and Technology (IRJET) e-ISSN: 2395 -0056
Volume: 02 Issue: 04 | July-2015 www.irjet.net p-ISSN: 2395-0072
© 2015, IRJET.NET- All Rights Reserved Page 1703
Apr 1898 0 1898
May 2147 0 2147
Jun 941 0 941
Jul 261 0 261
Aug 134 0 134
Sep 299 0 299
Oct 367 5 372
Nov 146 436 582
Dec 33 1097 1130
TOTAL 7642 3012 10654
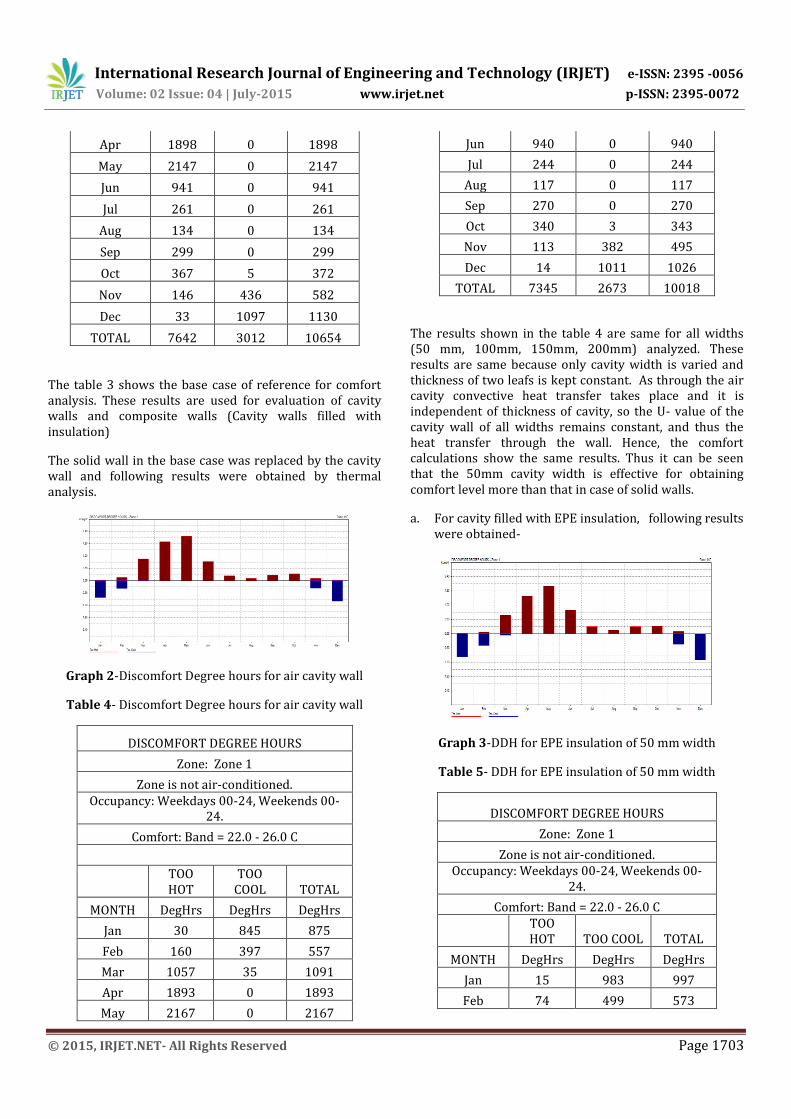
The table 3 shows the base case of reference for comfort analysis. These results are used for evaluation of cavity walls and composite walls (Cavity walls filled with insulation)
The solid wall in the base case was replaced by the cavity wall and following results were obtained by thermal analysis.
Graph 2-Discomfort Degree hours for air cavity wall
Table 4- Discomfort Degree hours for air cavity wall
DISCOMFORT DEGREE HOURS
Zone: Zone 1
Zone is not air-conditioned. Occupancy: Weekdays 00-24, Weekends 00-
24.
Comfort: Band = 22.0 - 26.0 C
TOO HOT
TOO COOL TOTAL
MONTH DegHrs DegHrs DegHrs
Jan 30 845 875
Feb 160 397 557
Mar 1057 35 1091
Apr 1893 0 1893
May 2167 0 2167
Jun 940 0 940
Jul 244 0 244
Aug 117 0 117
Sep 270 0 270
Oct 340 3 343
Nov 113 382 495
Dec 14 1011 1026
TOTAL 7345 2673 10018
The results shown in the table 4 are same for all widths (50 mm, 100mm, 150mm, 200mm) analyzed. These results are same because only cavity width is varied and thickness of two leafs is kept constant. As through the air cavity convective heat transfer takes place and it is independent of thickness of cavity, so the U- value of the cavity wall of all widths remains constant, and thus the heat transfer through the wall. Hence, the comfort calculations show the same results. Thus it can be seen that the 50mm cavity width is effective for obtaining comfort level more than that in case of solid walls.
a. For cavity filled with EPE insulation, following results were obtained-
Graph 3-DDH for EPE insulation of 50 mm width
Table 5- DDH for EPE insulation of 50 mm width
DISCOMFORT DEGREE HOURS
Zone: Zone 1
Zone is not air-conditioned. Occupancy: Weekdays 00-24, Weekends 00-
24.
Comfort: Band = 22.0 - 26.0 C
TOO HOT TOO COOL TOTAL
MONTH DegHrs DegHrs DegHrs
Jan 15 983 997
Feb 74 499 573
International Research Journal of Engineering and Technology (IRJET) e-ISSN: 2395 -0056
Volume: 02 Issue: 04 | July-2015 www.irjet.net p-ISSN: 2395-0072
© 2015, IRJET.NET- All Rights Reserved Page 1704
Mar 792 77 869
Apr 1577 0 1577
May 2004 0 2004
Jun 992 0 992
Jul 308 0 308
Aug 153 0 153
Sep 305 0 305
Oct 321 7 328
Nov 96 465 561
Dec 5 1127 1132
TOTAL 6642 3158 9800
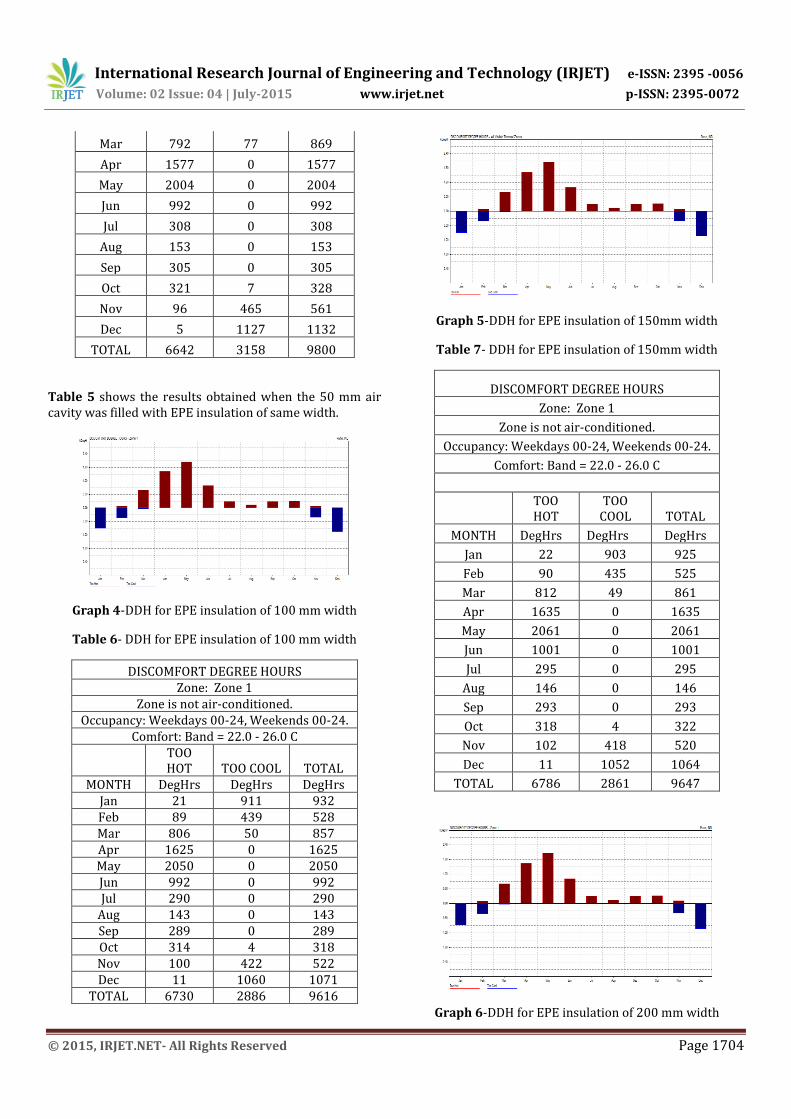
Table 5 shows the results obtained when the 50 mm air cavity was filled with EPE insulation of same width.
Graph 4-DDH for EPE insulation of 100 mm width
Table 6- DDH for EPE insulation of 100 mm width
DISCOMFORT DEGREE HOURS Zone: Zone 1
Zone is not air-conditioned. Occupancy: Weekdays 00-24, Weekends 00-24.
Comfort: Band = 22.0 - 26.0 C
TOO HOT TOO COOL TOTAL
MONTH DegHrs DegHrs DegHrs Jan 21 911 932 Feb 89 439 528 Mar 806 50 857 Apr 1625 0 1625 May 2050 0 2050 Jun 992 0 992 Jul 290 0 290
Aug 143 0 143 Sep 289 0 289 Oct 314 4 318 Nov 100 422 522 Dec 11 1060 1071
TOTAL 6730 2886 9616
Graph 5-DDH for EPE insulation of 150mm width
Table 7- DDH for EPE insulation of 150mm width
DISCOMFORT DEGREE HOURS
Zone: Zone 1
Zone is not air-conditioned.
Occupancy: Weekdays 00-24, Weekends 00-24.
Comfort: Band = 22.0 - 26.0 C
TOO HOT
TOO COOL TOTAL
MONTH DegHrs DegHrs DegHrs
Jan 22 903 925
Feb 90 435 525
Mar 812 49 861
Apr 1635 0 1635
May 2061 0 2061
Jun 1001 0 1001
Jul 295 0 295
Aug 146 0 146
Sep 293 0 293
Oct 318 4 322
Nov 102 418 520
Dec 11 1052 1064
TOTAL 6786 2861 9647
Graph 6-DDH for EPE insulation of 200 mm width

International Research Journal of Engineering and Technology (IRJET) e-ISSN: 2395 -0056
Volume: 02 Issue: 04 | July-2015 www.irjet.net p-ISSN: 2395-0072
© 2015, IRJET.NET- All Rights Reserved Page 1705
Table 8- DDH for EPE insulation of 200 mm width
DISCOMFORT DEGREE HOURS
Zone: Zone 1
Zone is not air-conditioned.
Occupancy: Weekdays 00-24, Weekends 00-24.
Comfort: Band = 22.0 - 26.0 C
TOO HOT
TOO COOL TOTAL
MONTH DegHrs DegHrs DegHrs
Jan 22 899 922
Feb 91 432 523
Mar 815 48 863
Apr 1640 0 1640
May 2066 0 2066
Jun 1005 0 1005
Jul 298 0 298
Aug 148 0 148
Sep 296 0 296
Oct 321 4 325
Nov 103 416 519
Dec 12 1048 1060
TOTAL 6817 2847 9664
From table 5, 6, 7 and 8 it can be seen that the EPE insulation has proved to be effective in reducing the total discomfort degree hours up to 8.01%, 9.75%, 9.45% and 9.29% for insulation widths of 50 mm, 100 mm, 150 mm and 200 mm respectively. This reduction the total discomfort degree hours includes the considerable amount of reduction in too hot degree hours which is maximum with 13.08% which is for 50 mm insulation width. While the too cool degree hours reduction is maximum for 200 mm width i.e 5.47. If only the too hot degree hours are to be considered as in Pune (lat. 18.5° long. 73.8°) region the discomfort level is mostly due to too hot degree hours the width of 50 mm can be considered most efficient in case EPE is used for insulating the cavity.
b. For cavity filled with EPS insulation, following results were obtained-
Graph 7-DDH for EPS insulation of 50 mm width
Table 9- DDH for EPS insulation of 50 mm width
DISCOMFORT DEGREE HOURS
Zone: Zone 1
Zone is not air-conditioned.
Occupancy: Weekdays 00-24, Weekends 00-24.
Comfort: Band = 22.0 - 26.0 C
TOO HOT TOO COOL TOTAL
MONTH DegHrs DegHrs DegHrs
Jan 19 920 939
Feb 84 445 529
Mar 798 53 850
Apr 1613 0 1613
May 2040 0 2040
Jun 988 0 988
Jul 288 0 288
Aug 141 0 141
Sep 287 0 287
Oct 310 4 314
Nov 97 427 524
Dec 9 1070 1079
TOTAL 6674 2919 9593
Graph 8-DDH for EPS insulation of 100 mm width

International Research Journal of Engineering and Technology (IRJET) e-ISSN: 2395 -0056
Volume: 02 Issue: 04 | July-2015 www.irjet.net p-ISSN: 2395-0072
© 2015, IRJET.NET- All Rights Reserved Page 1706
Table 10- DDH for EPS insulation of 100 mm width
DISCOMFORT DEGREE HOURS
Zone: Zone 1
Zone is not air-conditioned.
Occupancy: Weekdays 00-24, Weekends 00-24.
Comfort: Band = 22.0 - 26.0 C
TOO HOT TOO
COOL TOTAL
MONTH DegHrs DegHrs DegHrs
Jan 20 904 925
Feb 86 435 521
Mar 807 49 856
Apr 1630 0 1630
May 2058 0 2058
Jun 1000 0 1000
Jul 294 0 294
Aug 145 0 145
Sep 292 0 292
Oct 316 4 320
Nov 100 419 518
Dec 10 1054 1064
TOTAL 6758 2865 9623
Graph 9-DDH for EPS insulation of 150 mm width
Table 11- DDH for EPS insulation of 150 mm width
DISCOMFORT DEGREE HOURS
Zone: Zone 1
Zone is not air-conditioned. Occupancy: Weekdays 00-24, Weekends 00-
24.
Comfort: Band = 22.0 - 26.0 C
TOO HOT
TOO COOL TOTAL
MONTH DegHrs DegHrs DegHrs
Jan 21 897 918
Feb 88 430 518
Mar 811 47 859
Apr 1638 0 1638
May 2066 0 2066
Jun 1006 0 1006
Jul 298 0 298
Aug 147 0 147
Sep 294 0 294
Oct 319 4 323
Nov 101 415 516
Dec 11 1047 1057
TOTAL 6800 2840 9640
Graph 10- DDH for EPS insulation of 200 mm width
Table 12- DDH for EPS insulation of 200 mm width
DISCOMFORT DEGREE HOURS
Zone: Zone 1
Zone is not air-conditioned.
Occupancy: Weekdays 00-24, Weekends 00-24.
Comfort: Band = 22.0 - 26.0 C
TOO HOT TOO
COOL TOTAL
MONTH DegHrs DegHrs DegHrs
Jan 21 894 915
Feb 88 427 516
Mar 814 47 861
Apr 1642 0 1642
May 2071 0 2071
Jun 1009 0 1009
Jul 300 0 300
Aug 148 0 148
Sep 296 0 296
Oct 321 4 325

International Research Journal of Engineering and Technology (IRJET) e-ISSN: 2395 -0056
Volume: 02 Issue: 04 | July-2015 www.irjet.net p-ISSN: 2395-0072
© 2015, IRJET.NET- All Rights Reserved Page 1707
Nov 102 413 515
Dec 11 1043 1054
TOTAL 6823 2828 9651
The table 9, 10, 11 and 12 show the results obtained from the analysis when cavity was filled with EPS insulation with 50 mm, 100 mm, 150 mm and 200 mm. The reduction in total discomfort degree hours observed are 9.95 %, 9.67%, 9.57% and 9.41% at the widths of 50 mm, 100 mm, 150 mm and 200 mm respectively. Maximum reduction observed in too hot discomfort degree hours was 12.66% at the width of 50 mm of EPS in the cavity while that of too cool discomfort degree hours was 6.1% at the width of 200 mm. Thus it can be said that 50 mm width is efficient in reducing the discomfort as Pune (lat. 18.5° long. 73.8°) region felt maximum discomfort due to
too hot degree hours.
4. CONCLUSION
1. Increase in the width of air cavity in the cavity walls does not affect the heat transfer rather keeps it constant.
2. For building envelope the width of cavity must be minimum as possible from the view of ease of construction.
3. Insulation material can be opted for use instead of relying on air cavity for reducing the discomfort level inside the building.
Graph 11-Percentage reduction in Too Hot Discomfort Degree Hours
4. As in case of Pune (lat. 18.5° long. 73.8°) ,India region, the increased discomfort level is due to too hot discomfort degree hours, and maximum reduction in too hot DDH is observed for the width of 50 mm for air (minimum possible width) and insulation materials like EPE and EPS.
Results can be obtained for various other climatic zones in India. The Ecotect Analysis 2011 building simulation tool can be used for thermal analysis for use of materials in building envelope.
5. REFERENCES
1. Abhijeet Kamble et al., “Experimental Analysis of Cavity walls with Burnt brick for Building Envelope”, International Research Journal of Engineering and Technology, Vol. 2, Issue 3, June 2015
2. H. Hens et al., “Brick Cavity walls-A Performance Analysis based on Measurement and Simulation”, Journal of Building Physics, vol.- 31 no. 2, October-2007
3. Nayak J. K & Prajapati J. A., “ Handbook of Energy Conscious Buildings”, R&D Project no. 3 /4 (03)/ 99 SEC, May 2006
4. ASHRAE fundamentals, ASHRAE Inc., Atlanta 1997
5. S. E. Patil & N. N. Shinde, “ Theoretical Analysis of Composite roof with respect to Comfort in Building Envelope”, Current Trends in Technology and Science, Vol. 3, Issue 3, May 2014
6. Mani A., Handbook of solar radiation data of India, Allied Publishers, New Delhi, 1981.
7. R. Kapoor et al., Strategy roadmap for net zero energy building in India, USAID ECO II project, International Resources Group, New Delhi, August 2011
8. Siberstien and H. Hens, “Effect of Air and Moisture flow on Thermal Performance of Insulation in Ventilated roofs and walls”, Journal of Building Physics, 1996.
9. Delghust and A. Jannsens, “Retrofit Cavity wall Insulation: Performance Analysis from In-situ measurement”.
10. Straube and Burnett, “Field testing of Filled Cavity Wall System”.
11. El Hassan Ridouane and Marcus Bianchi, “Thermal Performance of Uninsulated and Partially Filled Wall Cavities”, ASHRAE Annual Conference, Montreal, 2011.
Recommended