ipaa │2009 Private Capital Conference
Surviving and ProsperingIn Uncertain Times
January 14, 2009
Overview of ESS Funds Group
• Energy Special Situations Funds est. late 2005• Two institutional funds - $340+ million• Pursue middle-market, energy opportunities• 13 investments since inception• $150+ million uncommitted capital• Fund managers:
Jon Linker, Jeff Hewitt, Tim Sullivant
ESSF Strategy
• Invest in companies/projects - all energy sectors – Seek growth and value creation
• Sole manage small investments ($5 - $40 mm)• Partner large deals ($30 - $150 mm); 5 co’s.• Management track record and co-invest are key• Structure, incentives create common objectives• Equity-oriented - all financial structures possible
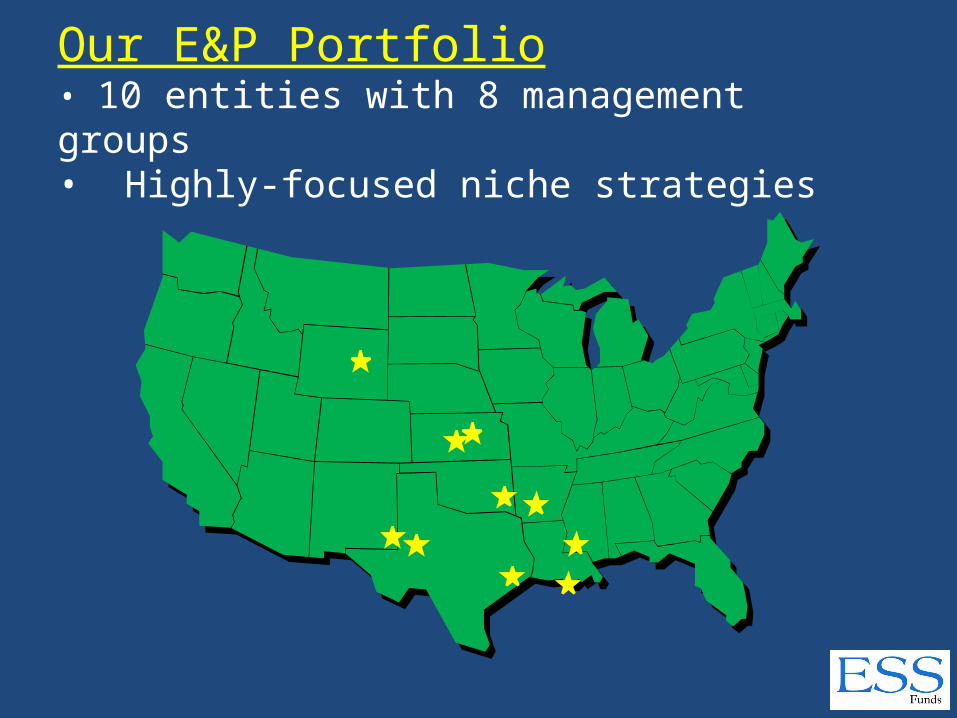
Our E&P Portfolio• 10 entities with 8 management groups• Highly-focused niche strategies

What Will 2009 Bring?
“Every new beginning starts from some other beginning’s end …”
Dan Wilson, Semisonic
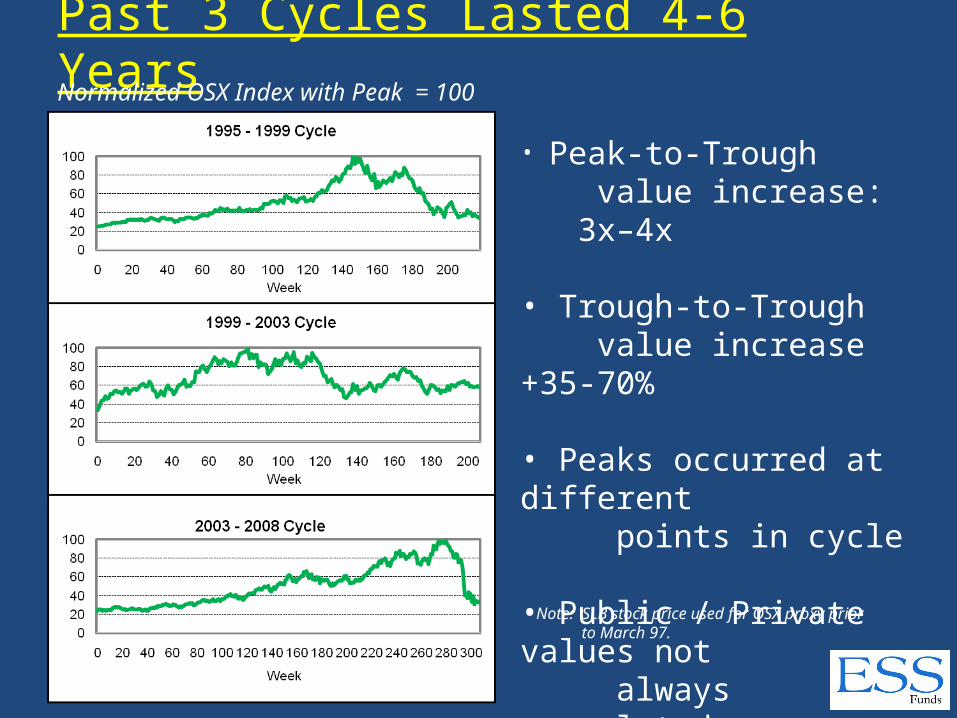
Past 3 Cycles Lasted 4-6 YearsNormalized OSX Index with Peak = 100
• Peak-to-Trough value increase: 3x–4x
• Trough-to-Trough value increase +35-70%
• Peaks occurred at different points in cycle
• Public / Private values not always correlated
Note: SLB stock price used for OSX proxy prior to March 97.
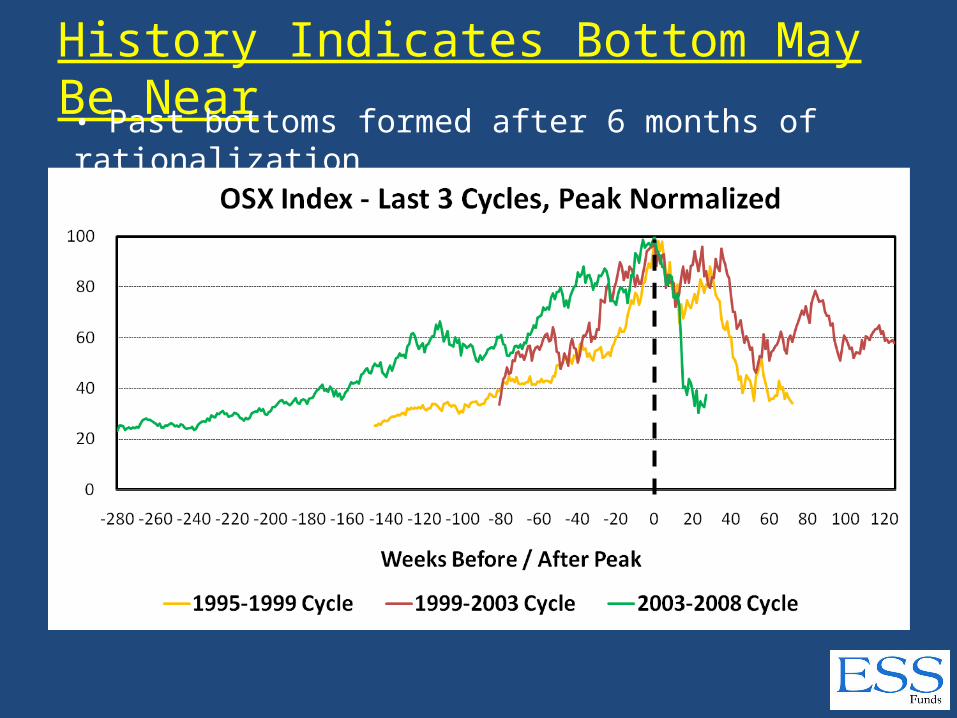
History Indicates Bottom May Be Near• Past bottoms formed after 6 months of rationalization
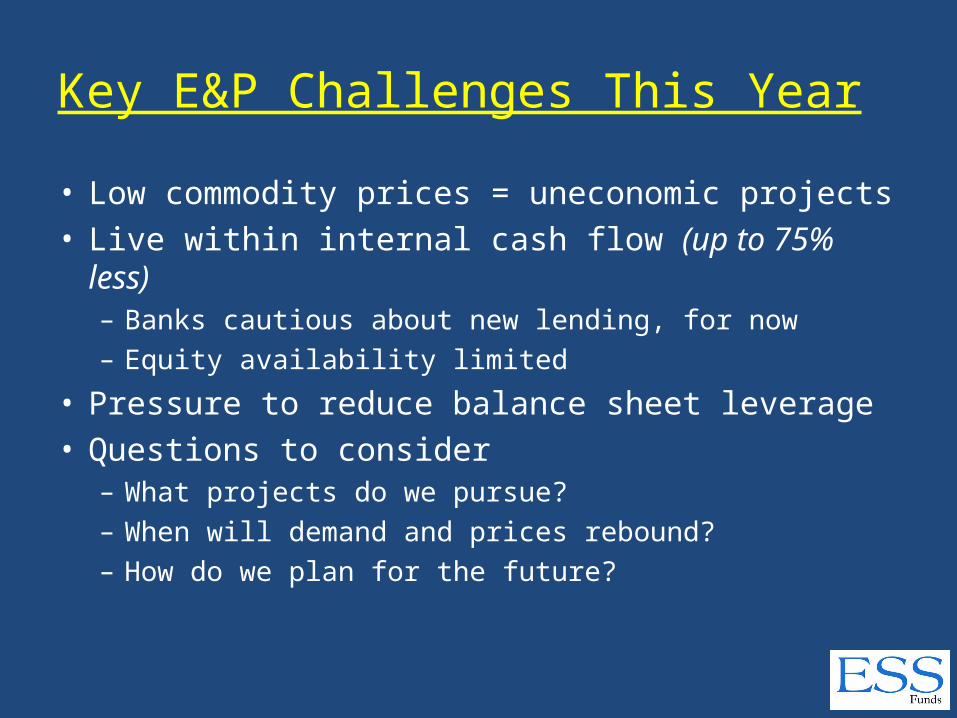
Key E&P Challenges This Year
• Low commodity prices = uneconomic projects• Live within internal cash flow (up to 75% less)
– Banks cautious about new lending, for now– Equity availability limited
• Pressure to reduce balance sheet leverage• Questions to consider
– What projects do we pursue?– When will demand and prices rebound?– How do we plan for the future?
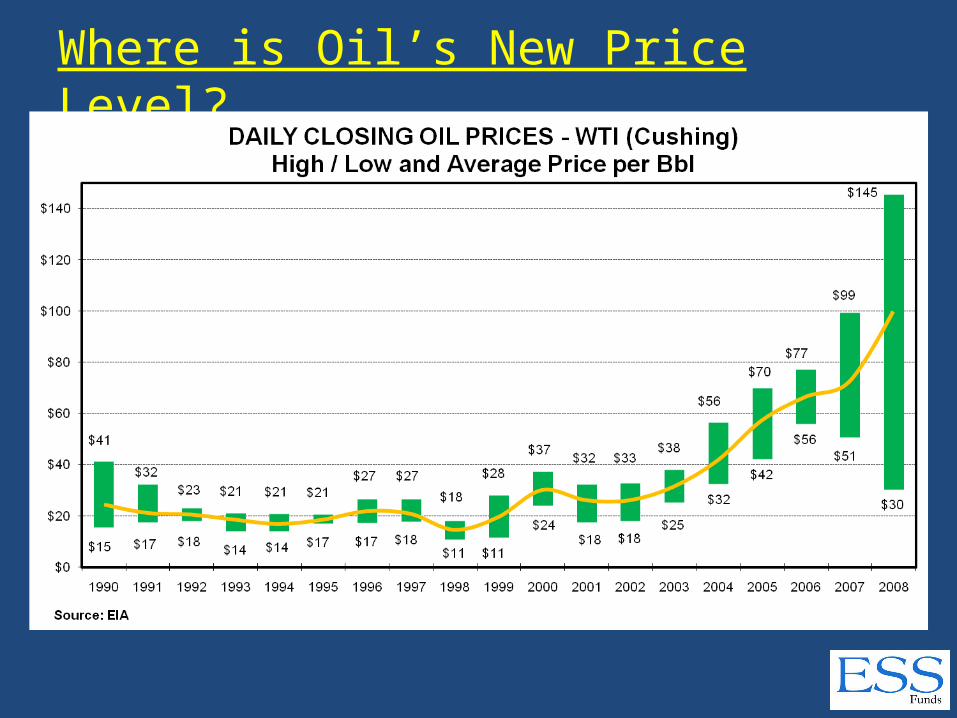
Where is Oil’s New Price Level?
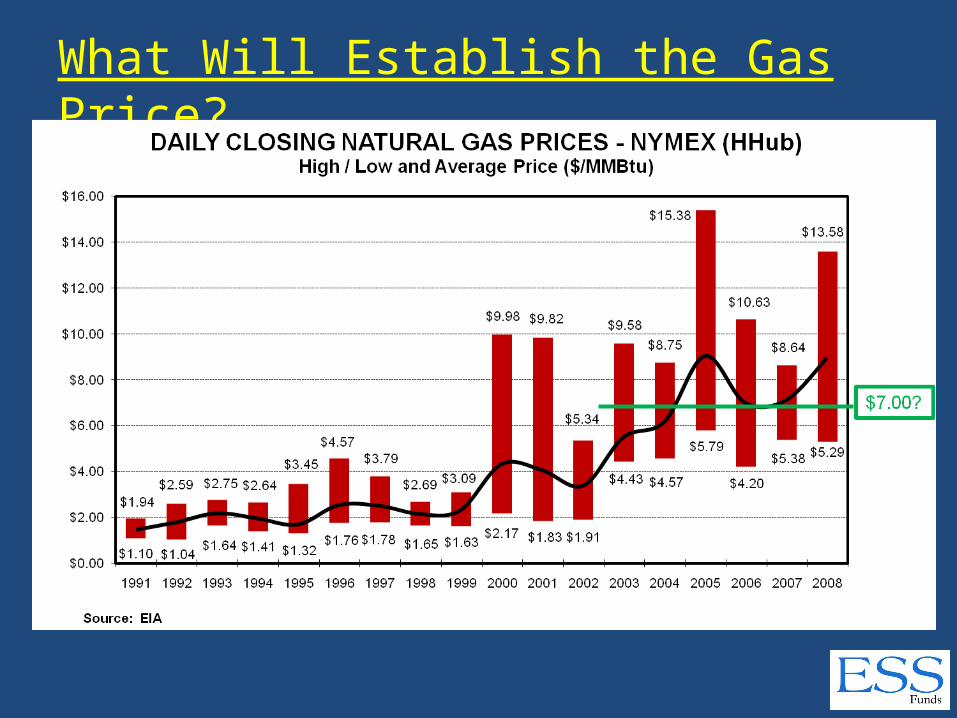
What Will Establish the Gas Price?
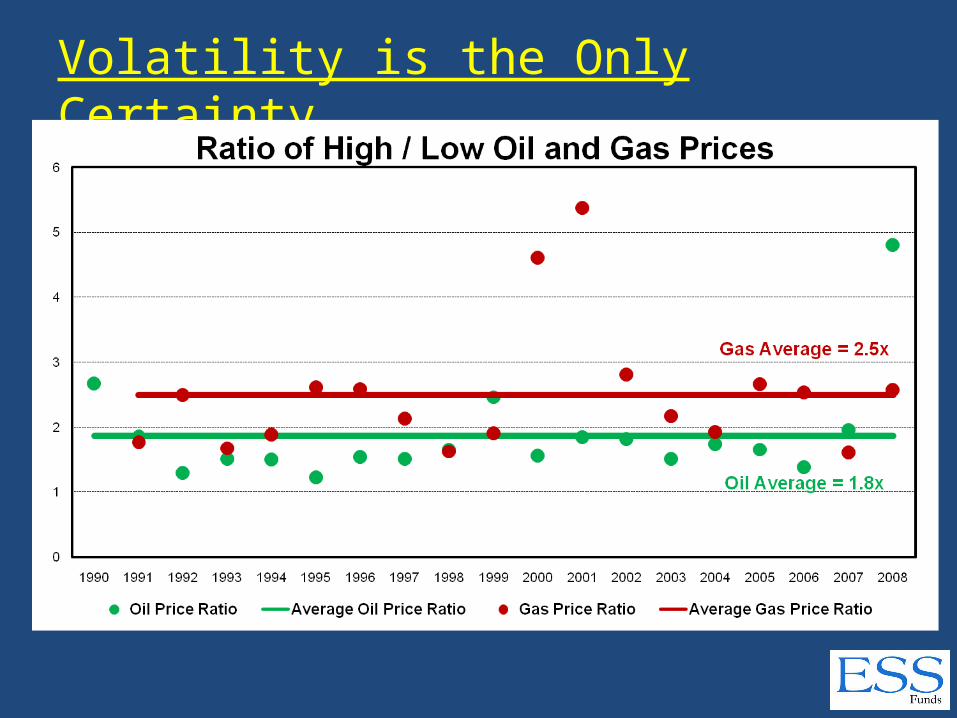
Volatility is the Only Certainty
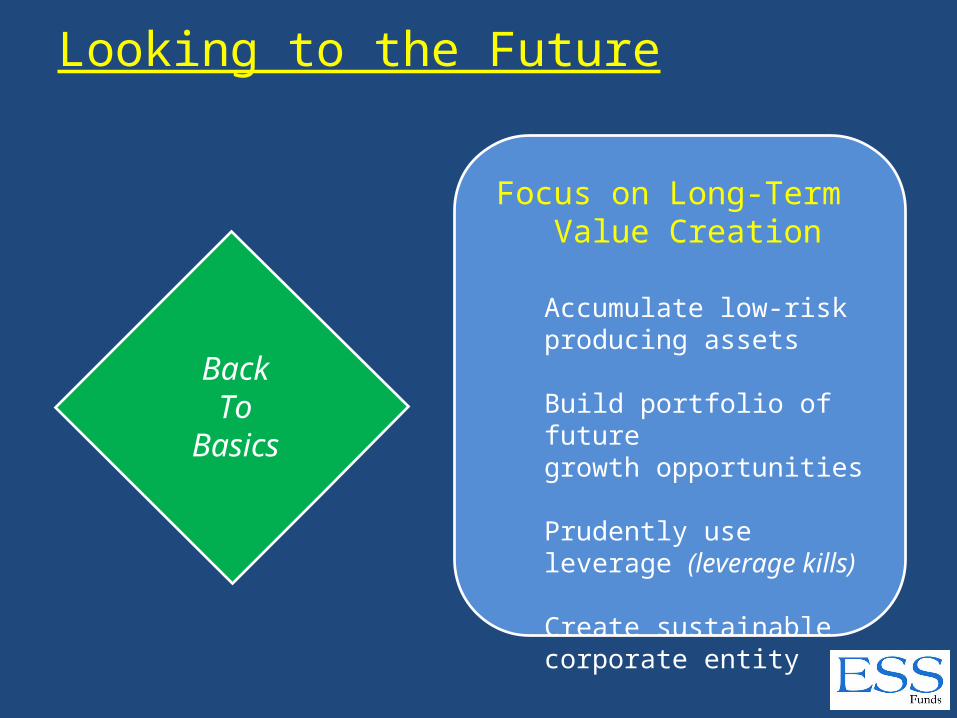
Looking to the Future
Focus on Long-Term Value Creation
Accumulate low-risk producing assets
Build portfolio of future growth opportunities
Prudently use leverage (leverage kills)
Create sustainable corporate entity
BackTo
Basics
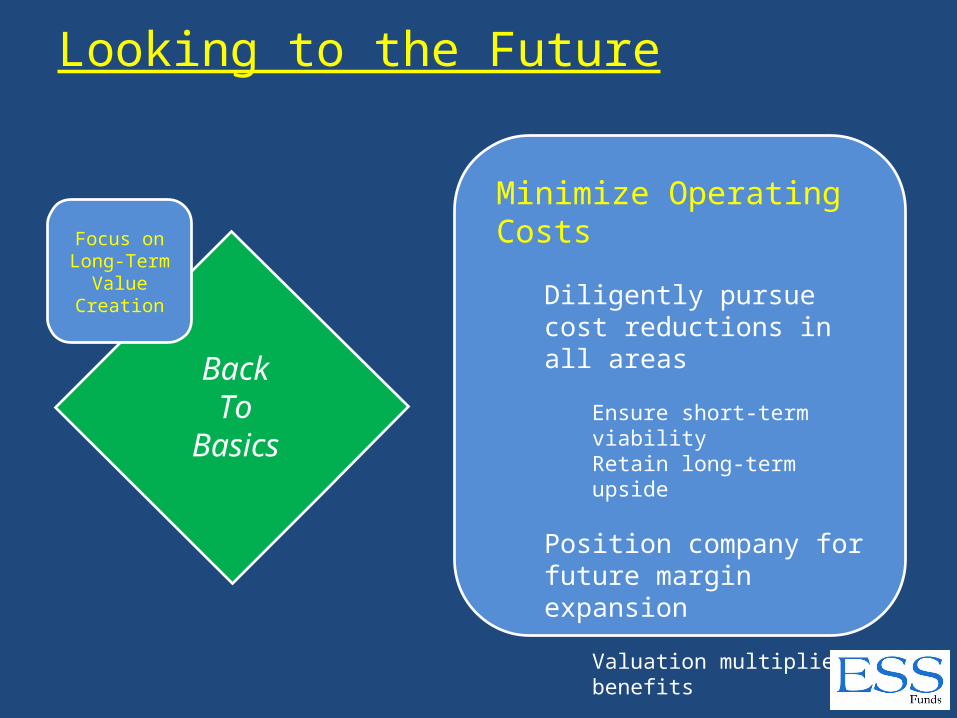
Looking to the Future
Minimize Operating Costs
Diligently pursue cost reductions in all areas
Ensure short-term viability Retain long-term upside
Position company for future margin expansion
Valuation multiplier benefits
BackTo
Basics
Focus on Long-Term
Value Creation
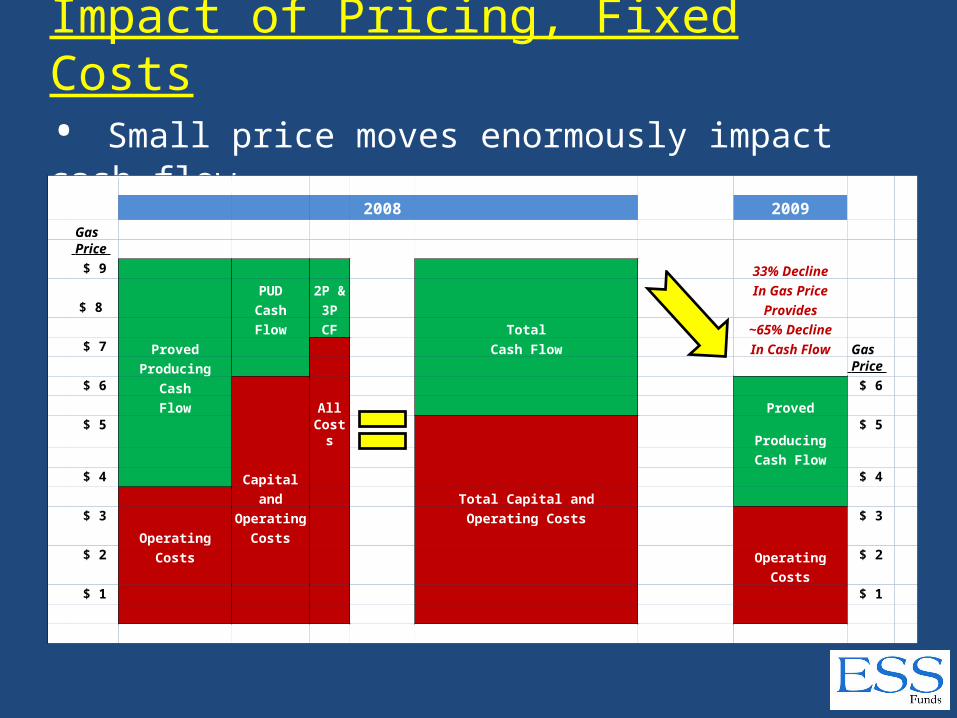
Impact of Pricing, Fixed Costs• Small price moves enormously impact cash flow
2008 2009
Gas
Price
$ 9 33% Decline
PUD 2P & In Gas Price
$ 8 Cash 3P Provides
Flow CF Total ~65% Decline
$ 7 Proved Cash Flow In Cash Flow Gas
Producing Price
$ 6 Cash $ 6
Flow All Proved
$ 5 Costs Producing $ 5
Cash Flow
$ 4 Capital $ 4
and Total Capital and
$ 3 Operating Operating Costs $ 3
Operating Costs
$ 2 Costs Operating $ 2
Costs
$ 1 $ 1
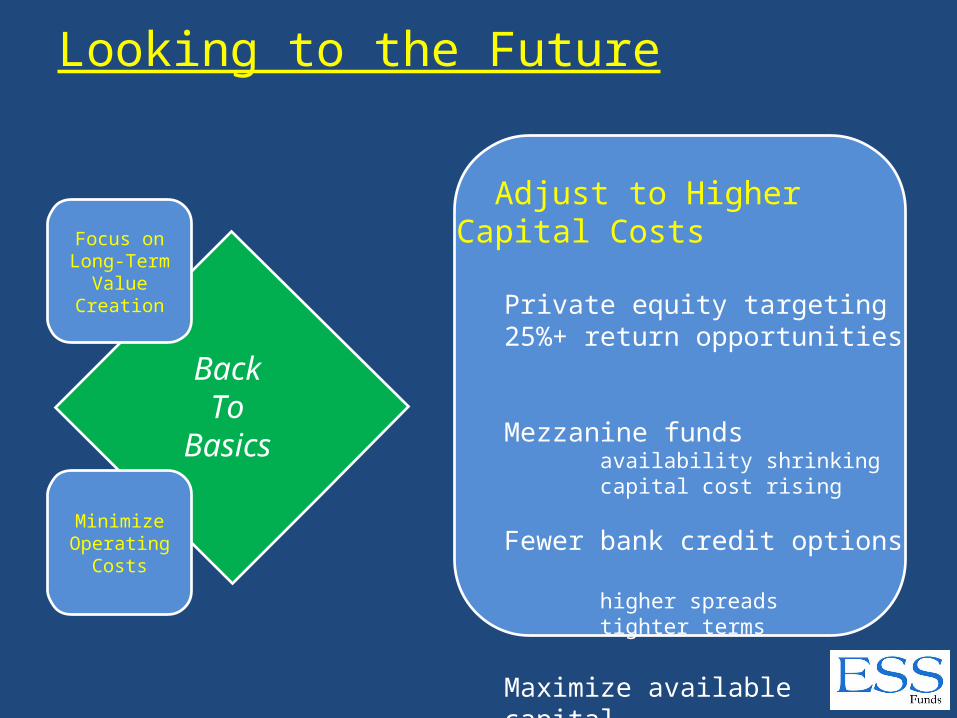
Looking to the Future
Adjust to Higher Capital Costs
Private equity targeting 25%+ return opportunities
Mezzanine funds availability shrinkingcapital cost rising
Fewer bank credit options higher spreadstighter terms
Maximize available capital
BackTo
Basics
Focus on Long-Term
Value Creation
MinimizeOperating
Costs
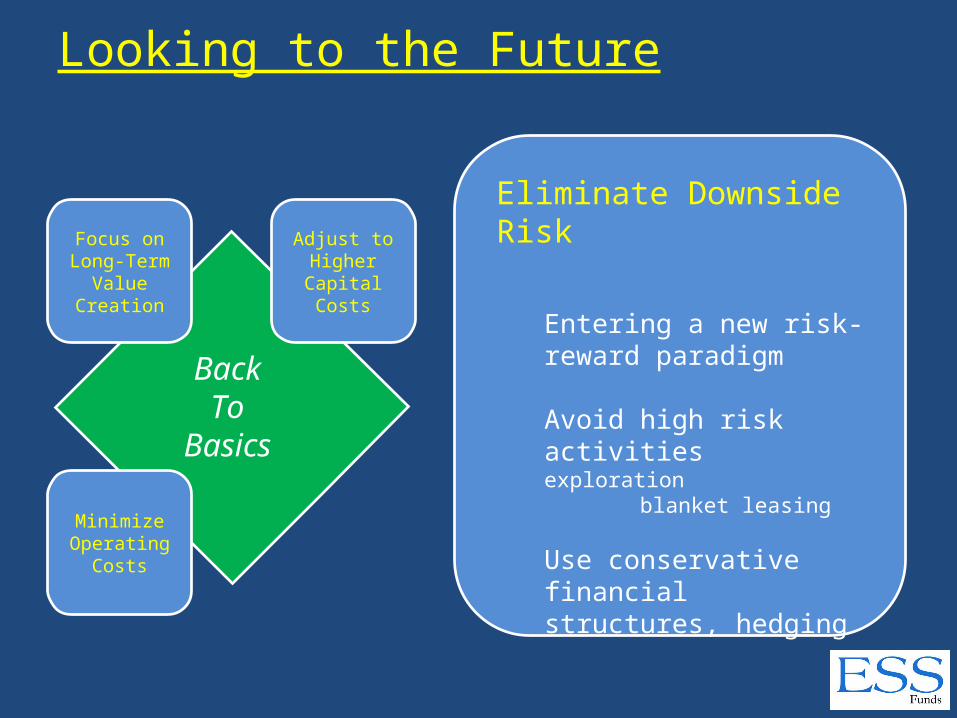
Looking to the Future
Eliminate Downside Risk
Entering a new risk-reward paradigm
Avoid high risk activities exploration blanket leasing
Use conservative financial structures, hedging
BackTo
Basics
Focus on Long-Term
Value Creation
MinimizeOperating
Costs
Adjust toHigherCapital Costs
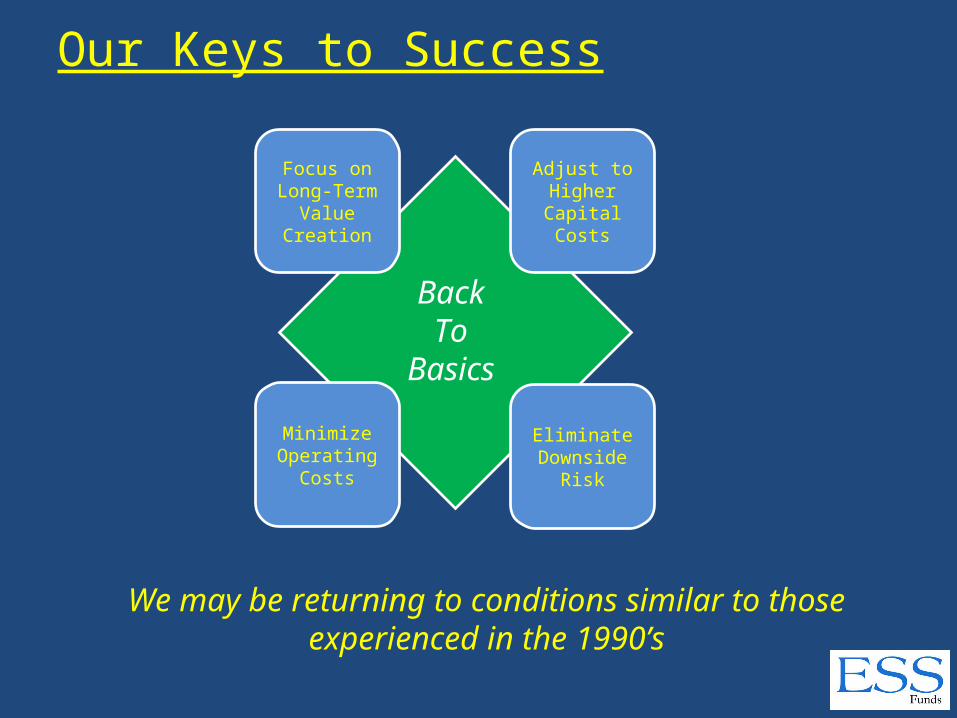
Our Keys to Success
BackTo
Basics
Focus on Long-Term
Value Creation
MinimizeOperating
Costs
Adjust to HigherCapital Costs
EliminateDownside
Risk
We may be returning to conditions similar to those experienced in the 1990’s

www.essfunds.com
Recommended