IOT Predictive Maintenance: Building Predictive Vibration Analysis Models
Rick R. DurhamWatson-IoT PMQ Data Scientist 6/19/2017
2
The purpose of this presentation is to outline a proposed method for building predictive vibration models that could be
used in an edge/cloud/on-prem environment to detect bearing failures and prevent more costly downtime using
predictive and IoT technologies
Building Predictive Vibration Analysis Models
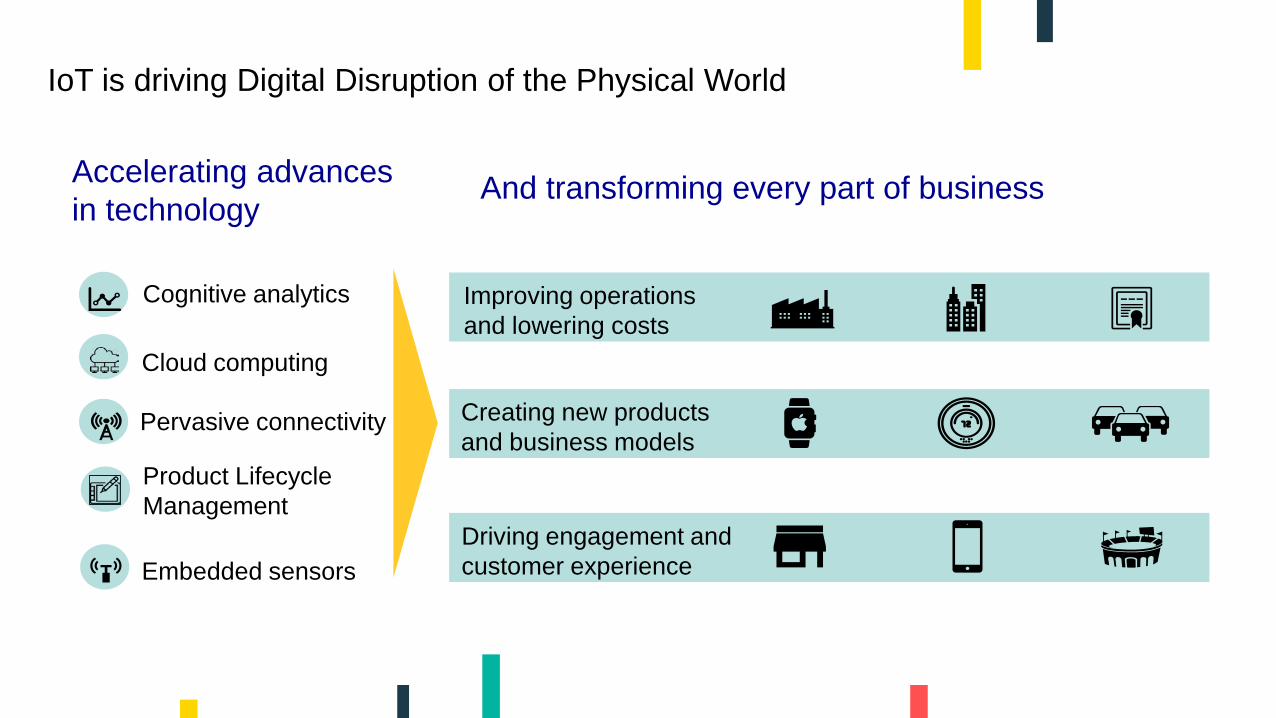
IoT is driving Digital Disruption of the Physical World
Accelerating advances in technology
And transforming every part of business
Cognitive analytics
Creating new products and business models
Improving operations and lowering costs
Driving engagement and customer experience
Pervasive connectivity
Embedded sensors
Cloud computing
Product LifecycleManagement

•Use a predefined lifetime for replacement
•Frequent unexpected failures leading to customers’ frustration
•Adaptively raise alert based on the actual condition of the product and environment
•Focused on critical event prediction
PREDICTIVE MAINTENANCE1.Anomaly detection: How to classify the present condition into good and bad 2.Signal/Sensor based detection: How to recognize change-points of the system
Predictive Maintenance and Quality enables the transition from static maintenancemodels to dynamic and condition-based maintenance models to predictive models
Time- Cycle Based Maintenance
Condition-Based Maintenance
4
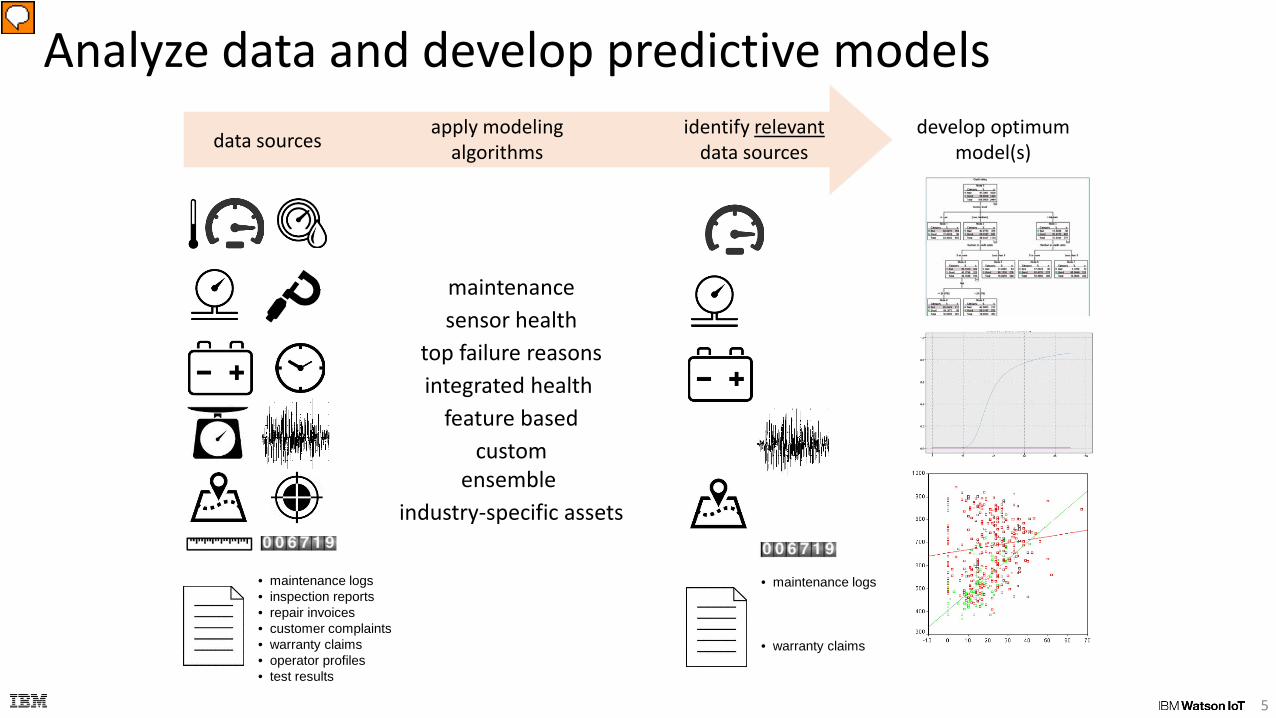
Analyze data and develop predictive models
5
data sources identify relevant
data sources develop optimum
model(s)apply modeling
algorithms
maintenancesensor health
top failure reasonsintegrated health
feature basedcustom
ensemble industry-specific assets
• maintenance logs• inspection reports• repair invoices• customer complaints• warranty claims• operator profiles• test results
• maintenance logs• inspection reports• repair invoices• customer complaints• warranty claims• operator profiles• test results
Bearing Vibration Modeling
6

Building Predictive Vibration Analysis Models (Background)
• Data provided from the Prognostics Data Repository hosted by NASA specifically, the bearing dataset
• Data gather from experiment studying four bearings installed on a loaded rotating shaft with a constant speed of 2000 rpms
7

Building Predictive Vibration Analysis Models (Background)• Data Details:
• The analysis period range (10/22/2003 12:06 - 11/25/2003 23:39)
• Two sensors for each bearing (x, y axis)• Data recorded for a 1 second window every 5 or 10 minutes
• Sampling Rate 20 khz• Data was recorded in 2,156 files
• No engineering specifications for the bearing assemblies or the experimental setup was provided -therefore we could not calculate the expected FFT components i.e.
• Fundamental Train Frequency
• Ball-Spin Frequency• Ball-Pass Outer-Race
• Ball-Pass Inner-Race
8
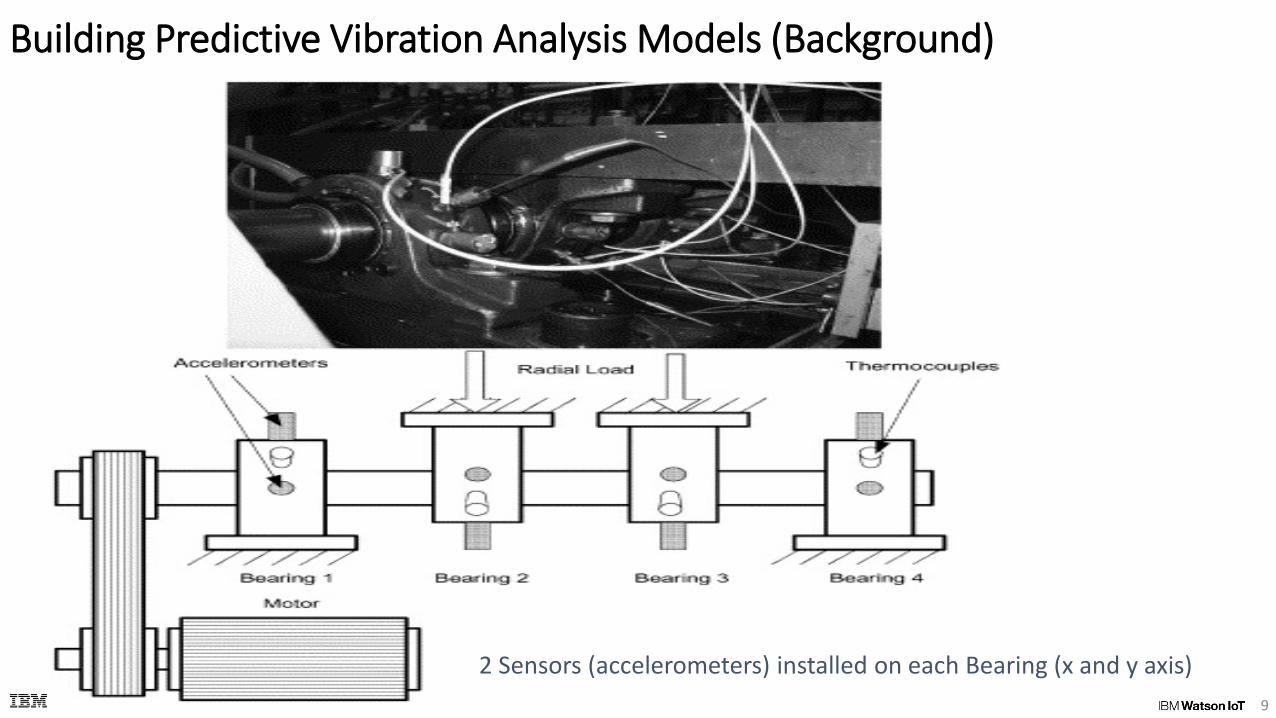
Building Predictive Vibration Analysis Models (Background)
9
2 Sensors (accelerometers) installed on each Bearing (x and y axis)
© 2012 IBM Corporation10
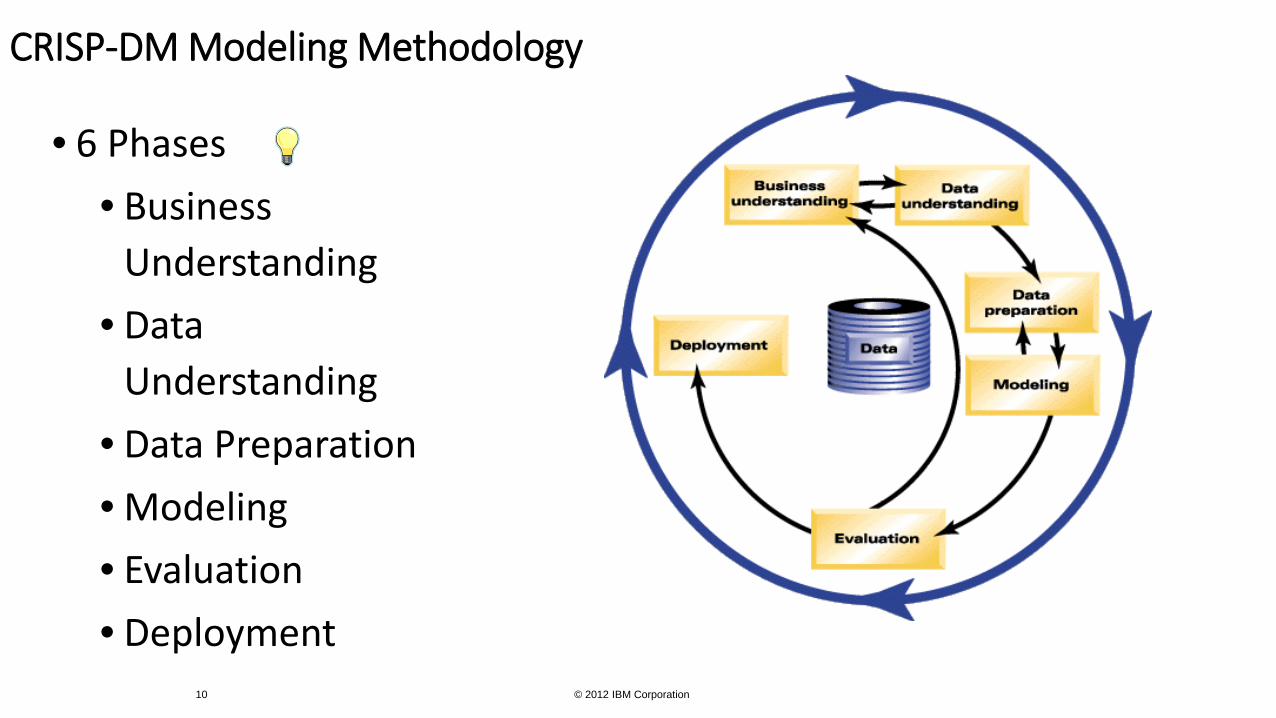
CRISP-DM Modeling Methodology
• 6 Phases• Business
Understanding• Data
Understanding• Data Preparation• Modeling• Evaluation• Deployment
Building Predictive Vibration Analysis ModelsModeling WorkFlow:• Business use case:
• Build a model to predict when a bearing is likely to fail based upon data gather from sensors (accelerometers) mounted on the bearing supports. This model could be used at the Edge level or in an IoT cloud based configuration
• Data Preparation-Data Visualization:
• Analyze the input Time Series data - Exploratory Data Analysis (EDA)• Iterate through each time series file containing accelerometer measurements and
calculate the top 5 highest “frequency spikes” for each file (1 second intervals). Store these new FFT representative features along with their respective time stamp in a new file for each bearing assembly. File in Excel *.csv format
• This creates a file for each bearing with 2156 records (four files total) for the interval
• Create visualizations to determine when failure events occur
11
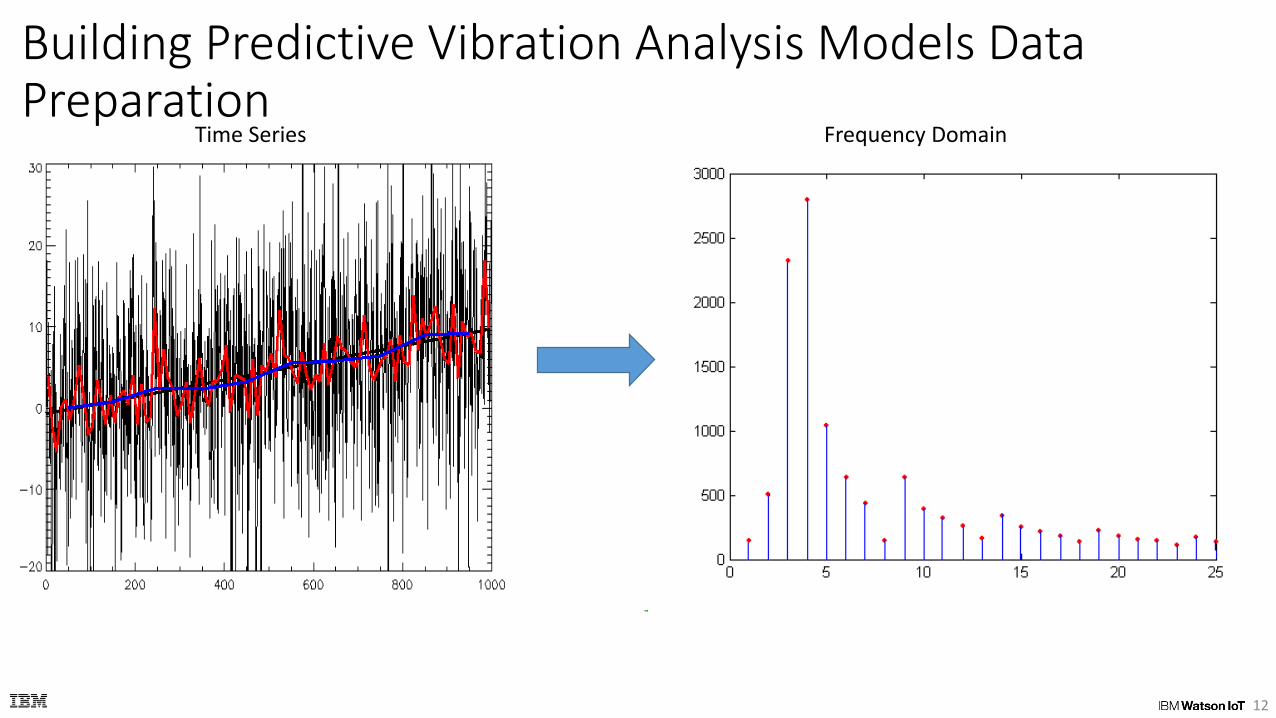
Building Predictive Vibration Analysis Models Data Preparation
12
Time Series Frequency Domain
:
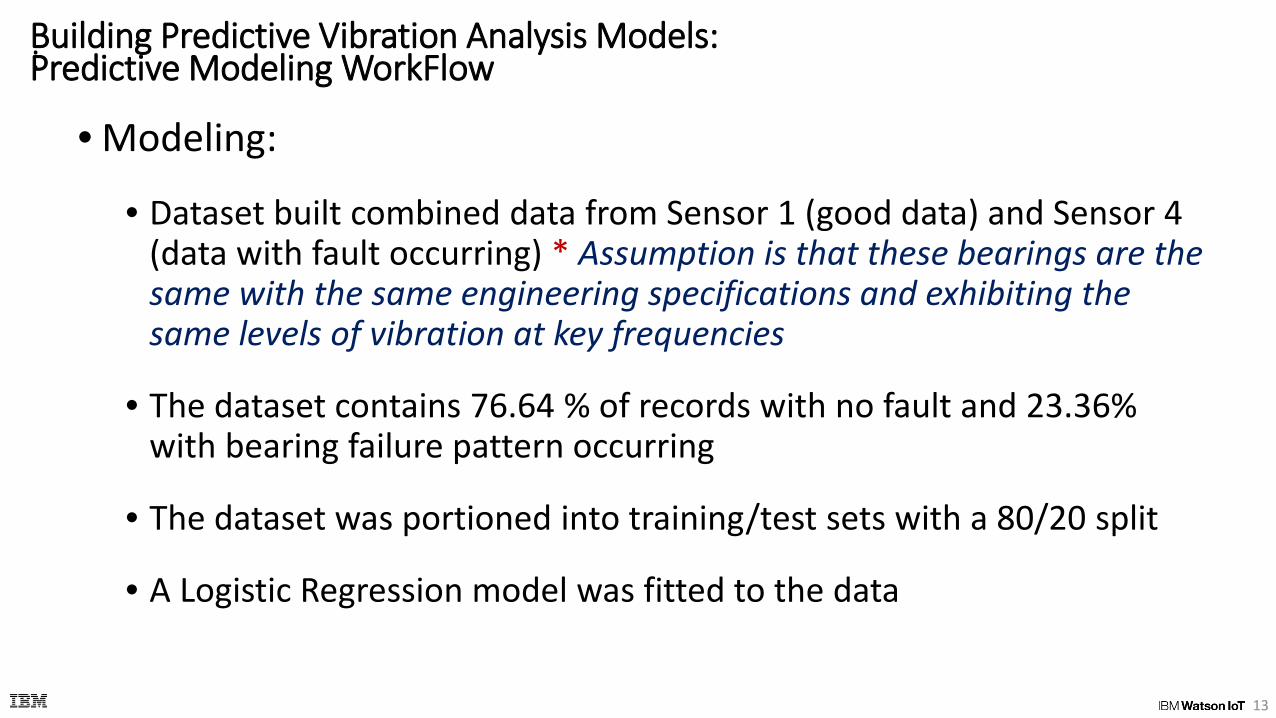
• Modeling:
• Dataset built combined data from Sensor 1 (good data) and Sensor 4 (data with fault occurring) * Assumption is that these bearings are the same with the same engineering specifications and exhibiting the same levels of vibration at key frequencies
• The dataset contains 76.64 % of records with no fault and 23.36% with bearing failure pattern occurring
• The dataset was portioned into training/test sets with a 80/20 split
• A Logistic Regression model was fitted to the data
13
Building Predictive Vibration Analysis Models:Predictive Modeling WorkFlow
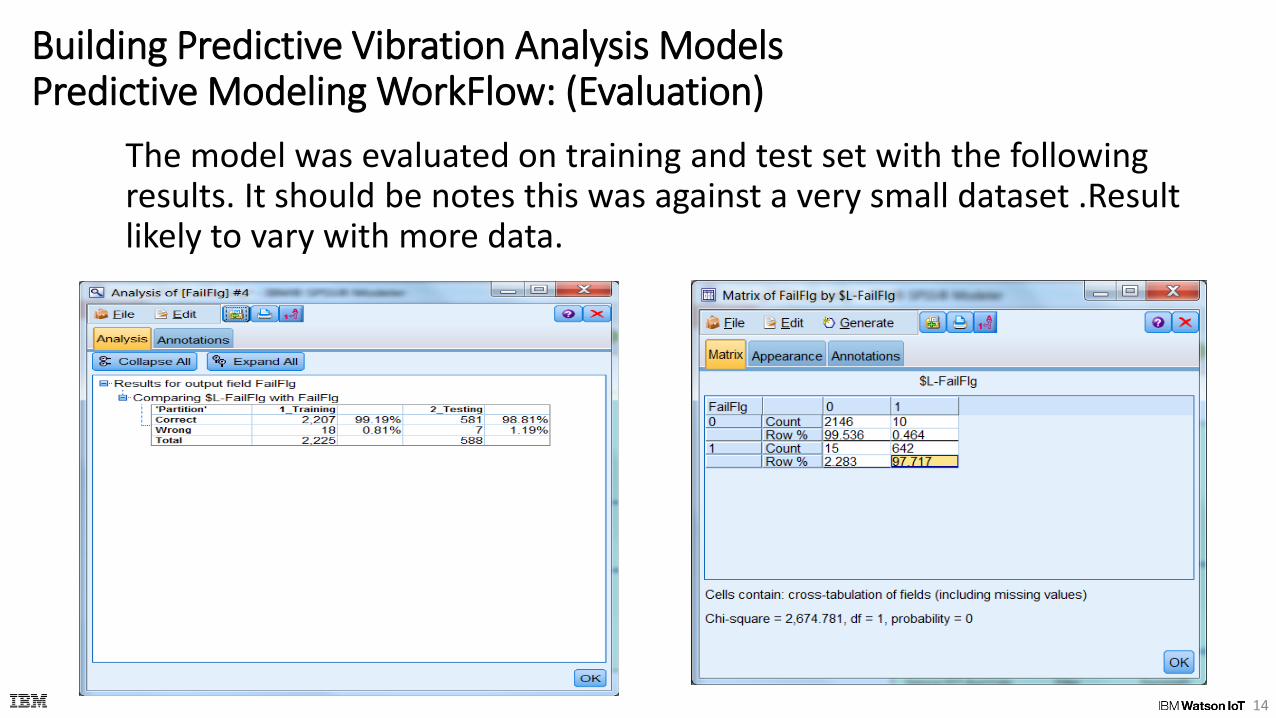
Building Predictive Vibration Analysis ModelsPredictive Modeling WorkFlow: (Evaluation)
The model was evaluated on training and test set with the following results. It should be notes this was against a very small dataset .Result likely to vary with more data.
14
PMQ Demo - Bearing Vibration Predictive Modeling WorkFlow:
• Deployment: • A scoring stream was created to score as set of bearing records
against the logistic model that was created in the modeling phase. Note: The dataset records for this scoring stream were previously converted from time series to FFT format this is a fairly trivial undertaking. In a production setting this processing would be added to the scoring stream.
• This scoring model could be used in a variety of deployment environments including:
• Edge Devices
• Cloud Based SaaS application
• On Prem operational systems
15
PMQ Demo - Bearing Vibration
Demo
16

PMQ Demo - Bearing Vibration
Q/A
17
18
predictive maintenance modeling?

Thank You

20
Important links:
https://www.youtube.com/watch?v=5MNyLM0N6l0
Very special Thanks to Dr. Victoria Catterson who provided much of the bulk data prep code in r for this presentation
http://cowlet.org/2013/09/15/understanding-data-science-feature-extraction-with-r.html
https://www.youtube.com/watch?v=g8h2aFAVGH0
Vibration Analysis -Diagnosing a Bearing Defect (Real World)
Detecting bearing tones with vibration analysis
IBM and Business Partner Internal Use Only
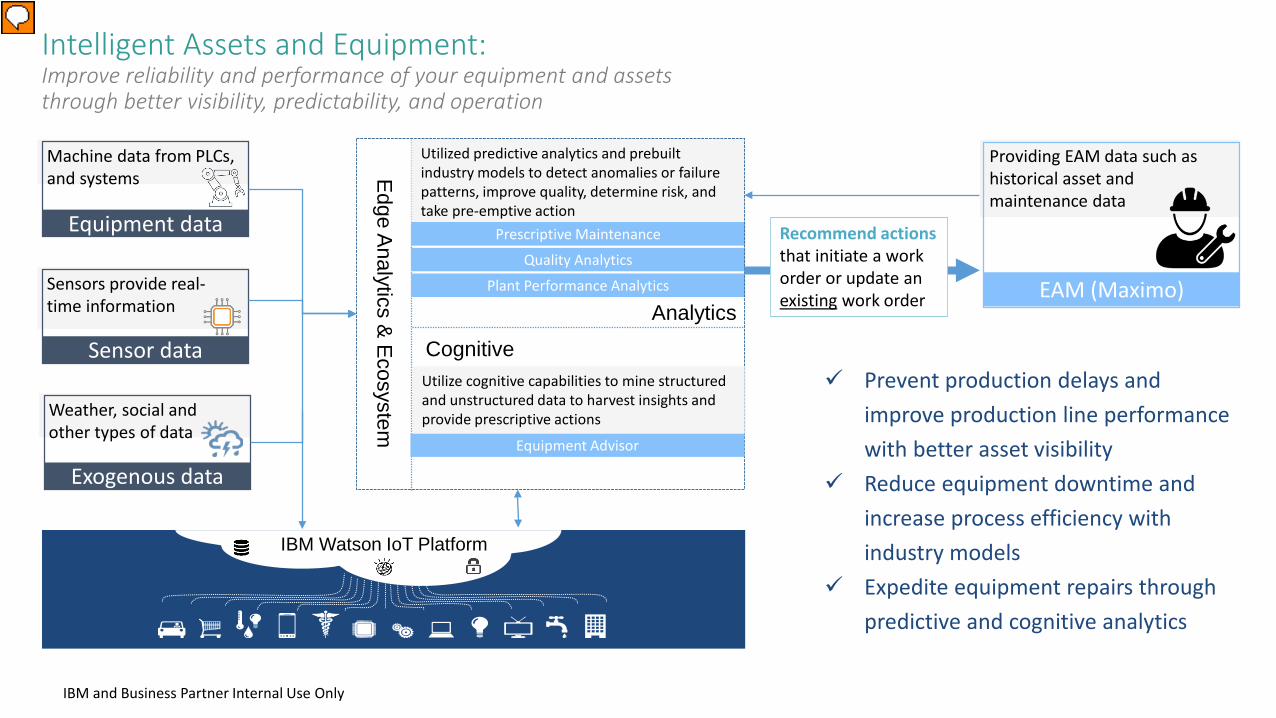
Intelligent Assets and Equipment:Improve reliability and performance of your equipment and assets through better visibility, predictability, and operation
Machine data from PLCs, and systems
Equipment data
Weather, social and other types of data
Exogenous data
Sensors provide real-time information
Sensor data
Edge Analytics & Ecosystem
Cognitive
Analytics
Utilized predictive analytics and prebuilt industry models to detect anomalies or failure patterns, improve quality, determine risk, and take pre-emptive action
Prescriptive Maintenance
Quality Analytics
Plant Performance Analytics
Prevent production delays and improve production line performance with better asset visibility
Reduce equipment downtime and increase process efficiency with industry models
Expedite equipment repairs through predictive and cognitive analytics
IBM Watson IoT Platform
Recommend actions that initiate a work order or update an existing work order
Providing EAM data such as historical asset and maintenance data
EAM (Maximo)
Equipment Advisor
Utilize cognitive capabilities to mine structured and unstructured data to harvest insights and provide prescriptive actions

The Journey
Recommended