ConfidentialInvestor UpdateFY – 2018
February 2019
1
Cautionary statement
This presentation has been prepared by PT Saka Energi Indonesia (“PGN Saka” of the “Company”) and is only for informational purposes and does not constitute a recommendation regarding the
securities or debt of PGN Saka or any of its subsidiaries, or an investment in the Company. The information in this presentation is confidential and none of the information appearing in this presentation
may be distributed to the press or other media or reproduced or redistributed in whole or in part in any form at any time without the prior written consent from the Company. This document remains the
property of PGN Saka and on request must be returned and any copies destroyed.
Neither PGN Saka nor any of its respective affiliates, shareholders, directors, employees, agents, advisors or representatives makes any representation or warranty, either expressed or implied, in relation
to the accuracy, completeness or reliability of the information contained in this presentation, nor is this presentation intended to be a complete statement or summary of the state and condition of the
Company. The information set out herein may be subject to updating, completion, revision, verification and amendment without notice and such information may change materially. The information in this
presentation should not be regarded by recipients as a substitute for the exercise of their own judgement.
This presentation is not intended as, and does not form part of, any offer to sell or subscription of or solicitation or invitation to buy or subscribe for any securities. Neither this presentation nor anything
contained herein shall form the basis of, or be relied on in connection with, any contract or commitment whatsoever.
This presentation contains forward-looking statements relating to PGN Saka operations that are based on management’s current expectations, estimates and projections about the petroleum. Words or
phrases such as “expects,” “forecast,” “projects,” “estimates,” “may,” “could,” “outlook,” “on schedule,” “on track,” and similar expressions are intended to identify such forward-looking statements. These
statements are not guarantees of future performance and are subject to certain risks uncertainties and other factors, many of which are beyond the company’s control and are difficult to predict.
Therefore, actual outcomes and results may differ materially from what is expressed or forecasted in such forward-looking statements. The reader should not place undue reliance on these forward-
looking statements, which speak only as of the date of this presentation. Unless legally required, PGN Saka undertakes no obligation to update publicly any forward-looking statements, whether as a
result of new information, future events or otherwise.
Among the important factors that could cause actual results to differ materially from those in the forward-looking statements are: changing crude oil and natural gas prices; changing refining, marketing
and chemicals margins; the company’s ability to realize anticipated cost savings and expenditure reductions; actions of competitors or regulators; timing of exploration expenses; timing of crude oil lifting's;
the competitiveness of alternate-energy sources or product substitutes; technological developments; the business, results of operations and financial condition of the company’s suppliers, vendors,
partners, and equity affiliates, particularly during extended periods of low prices for crude oil and natural gas; the inability or failure of the company’s joint-venture partners to fund their share of operations
and development activities; the potential failure to achieve expected net production from existing and future crude oil and natural gas development projects; potential delays in the development,
construction or start-up of planned projects; changing economic, regulatory and political environments in the various countries in which the company operates; the potential liability for remedial actions or
assessments under existing or future environmental regulations and litigation; significant business, operational, investment or product changes required by existing or future environmental statutes and
regulations, the company’s future acquisition or disposition of assets and gains and losses from asset dispositions or impairments; government-mandated sales, divestitures, recapitalizations, industry-
specific taxes, changes in fiscal terms or restrictions on scope of company operations; foreign currency movements compared with the U.S. dollar; the effects of changed accounting rules under generally
accepted accounting principles promulgated by rule-setting bodies. Other unpredictable or unknown factors not discussed in this presentation could also have material adverse effects on forward-looking
statements. No assurance can be given that further events will occur, that projections will be achieved, or that the Company’s assumptions are correct. Actual results may differ materially from those
projected.
Any opinions expressed in this presentation are subject to change without notice and may differ or be contrary to opinions expressed by other businesses areas or groups of the Company as a result of
using different assumptions and criterion or otherwise.
2
Table of contents
Section 1 Corporate overview 3
Section 2 Operational and Financial highlights 8
Appendix A EBITDA Reconciliation 13
Appendix B Regulation and Upstream fiscal regime 15

Corporate Overview
Section 1
4
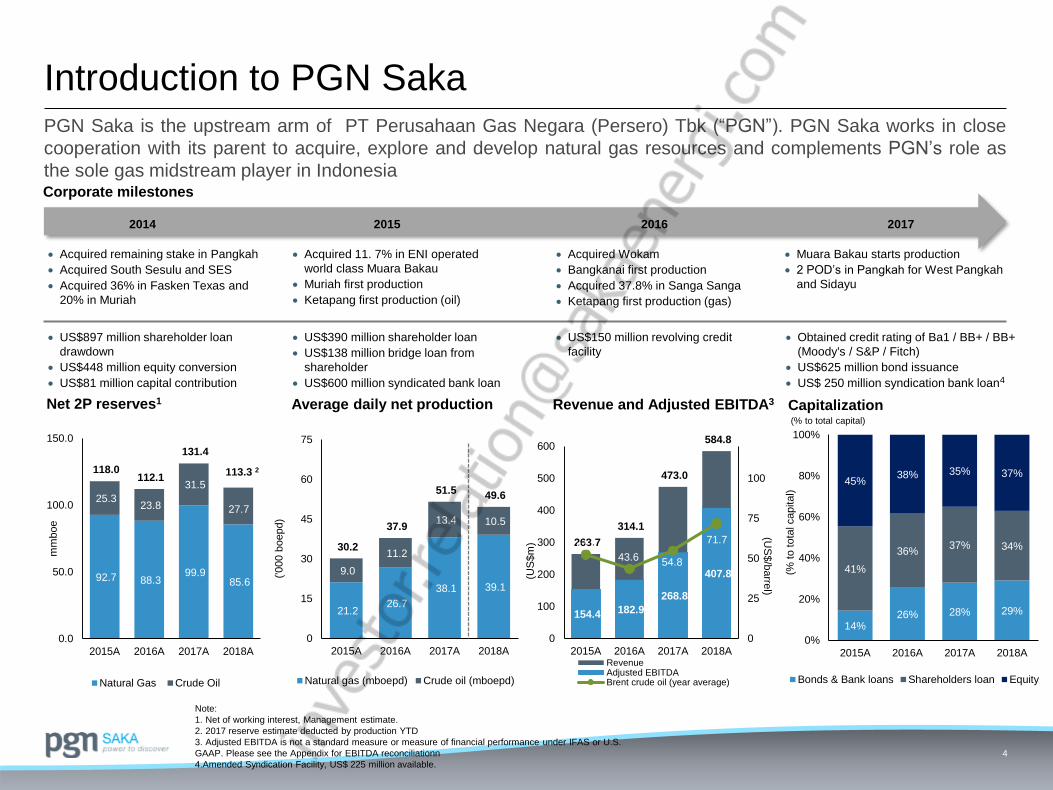
Introduction to PGN SakaPGN Saka is the upstream arm of PT Perusahaan Gas Negara (Persero) Tbk (“PGN”). PGN Saka works in close
cooperation with its parent to acquire, explore and develop natural gas resources and complements PGN’s role as
the sole gas midstream player in IndonesiaCorporate milestones
Net 2P reserves1 Revenue and Adjusted EBITDA3 Capitalization
Note:
1. Net of working interest, Management estimate.
2. 2017 reserve estimate deducted by production YTD
3. Adjusted EBITDA is not a standard measure or measure of financial performance under IFAS or U.S.
GAAP. Please see the Appendix for EBITDA reconciliationn
4.Amended Syndication Facility, US$ 225 million available.
(% to total capital)
2014 2015 2016 2017
Acquired remaining stake in Pangkah
Acquired South Sesulu and SES
Acquired 36% in Fasken Texas and
20% in Muriah
Muara Bakau starts production
2 POD’s in Pangkah for West Pangkah
and Sidayu
Acquired Wokam
Bangkanai first production
Acquired 37.8% in Sanga Sanga
Ketapang first production (gas)
Acquired 11. 7% in ENI operated
world class Muara Bakau
Muriah first production
Ketapang first production (oil)
US$897 million shareholder loan
drawdown
US$448 million equity conversion
US$81 million capital contribution
US$390 million shareholder loan
US$138 million bridge loan from
shareholder
US$600 million syndicated bank loan
US$150 million revolving credit
facility
Obtained credit rating of Ba1 / BB+ / BB+
(Moody's / S&P / Fitch)
US$625 million bond issuance
US$ 250 million syndication bank loan4
154.4 182.9
268.8
407.8
263.7
314.1
473.0
584.8
52.5 43.6 54.8
71.7
0
25
50
75
100
0
100
200
300
400
500
600
2015A 2016A 2017A 2018A
(US
$/b
arre
l)
(US
$m
)
RevenueAdjusted EBITDABrent crude oil (year average)
14%26% 28% 29%
41%
36%37% 34%
45%38% 35% 37%
0%
20%
40%
60%
80%
100%
2015A 2016A 2017A 2018A
(% to tota
l capital)
Bonds & Bank loans Shareholders loan Equity
Average daily net production
21.2 26.7
38.1 39.1
9.0
11.2
13.4 10.5
30.2
37.9
51.5 49.6
0
15
30
45
60
75
2015A 2016A 2017A 2018A
('000 b
oepd)
Natural gas (mboepd) Crude oil (mboepd)
92.7 88.3 99.9
85.6
25.3 23.8
31.5
27.7
118.0 112.1
131.4
113.3 2
0.0
50.0
100.0
150.0
2015A 2016A 2017A 2018A
mm
boe
Natural Gas Crude Oil
5
PT Saka Energi Investasi
(SEInv)
Muriah PSC
(20%)
0.003%
43.04%56.96%
99.997%
PT Saka Energi Investasi
(SEInv)
SES PSC1
(8.9%)
PT Saka Energi
Internasional (SEInt)
Fasken
(36%)
Saka Energi Overseas
Holding BV (SEOH)
100%
Saka Indonesia
Pangkah BV (SIPBV)
100%99.9%
99.9%
0.1%
0.1%
Ketapang PSC
(20%)
South Sesulu PSC
(100%)
Bangkanai PSC
(30%)
West Bangkanai PSC
(30%)
Wokam II PSC
(100%)
Muara Bakau PSC
(11.7%)
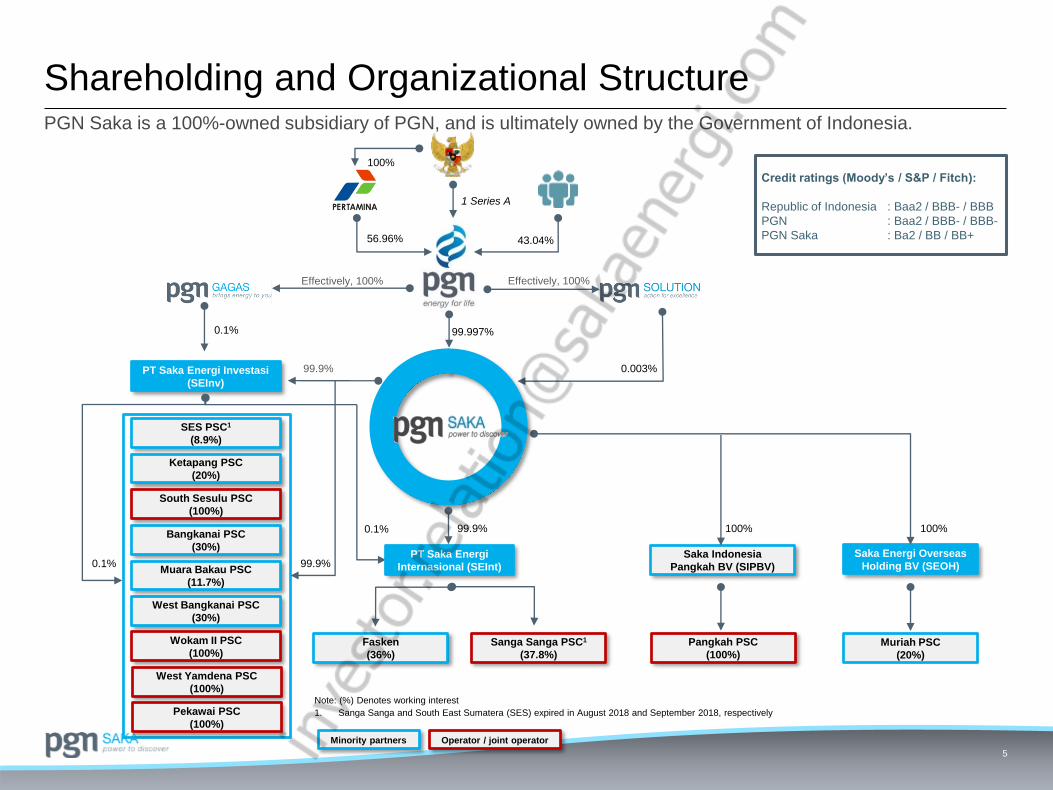
Note: (%) Denotes working interest
1. Sanga Sanga and South East Sumatera (SES) expired in August 2018 and September 2018, respectively
Pangkah PSC
(100%)
Sanga Sanga PSC1
(37.8%)
Minority partners Operator / joint operator
West Yamdena PSC
(100%)
Pekawai PSC
(100%)
100%
1 Series A
Effectively, 100% Effectively, 100%
0.1% 99.9%
Credit ratings (Moody’s / S&P / Fitch):
Republic of Indonesia : Baa2 / BBB- / BBB
PGN : Baa2 / BBB- / BBB-
PGN Saka : Ba2 / BB / BB+
PGN Saka is a 100%-owned subsidiary of PGN, and is ultimately owned by the Government of Indonesia.
Shareholding and Organizational Structure
6
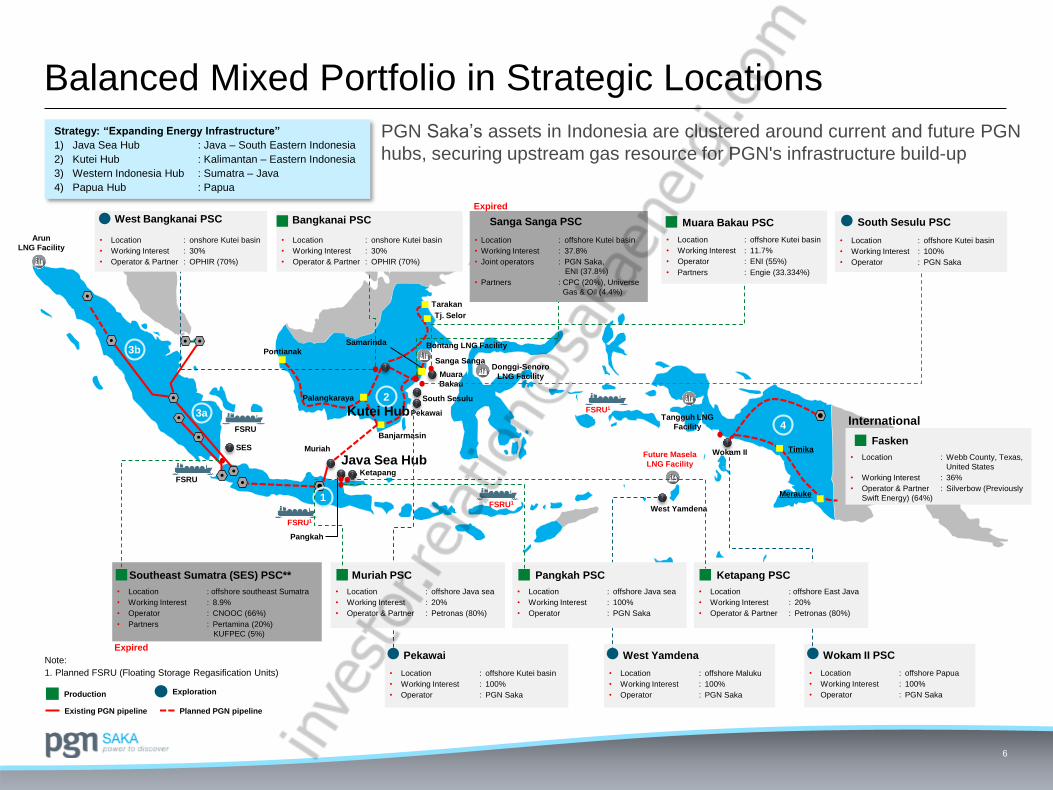
PGN Saka’s assets in Indonesia are clustered around current and future PGN
hubs, securing upstream gas resource for PGN's infrastructure build-up
Balanced Mixed Portfolio in Strategic Locations
Note:
1. Planned FSRU (Floating Storage Regasification Units)
• Location : offshore southeast Sumatra
• Working Interest : 8.9%
• Operator : CNOOC (66%)
• Partners : Pertamina (20%)
KUFPEC (5%)
Tangguh
LNG
Facility 4SES
FSRU
Muara
Bakau
KetapangFSRU
Pontianak
West YamdenaFSRU1
FSRU1
Future Masela
LNG Facility
FSRU1
Sanga Sanga
South Sesulu
Pekawai
Pangkah
Muriah
Palangkaraya
Banjarmasin
Wokam II
• Location : offshore Papua
• Working Interest : 100%
• Operator : PGN Saka
Wokam II PSC
• Location : onshore Kutei basin
• Working Interest : 30%
• Operator & Partner : OPHIR (70%)
Bangkanai PSC
• Location : onshore Kutei basin
• Working Interest : 30%
• Operator & Partner : OPHIR (70%)
West Bangkanai PSC
Southeast Sumatra (SES) PSC**
Java Sea Hub
• Location : offshore Kutei basin
• Working Interest : 100%
• Operator : PGN Saka
South Sesulu PSC
• Location : offshore Kutei basin
• Working Interest : 11.7%
• Operator : ENI (55%)
• Partners : Engie (33.334%)
Muara Bakau PSC
Strategy: “Expanding Energy Infrastructure”
1) Java Sea Hub : Java – South Eastern Indonesia
2) Kutei Hub : Kalimantan – Eastern Indonesia
3) Western Indonesia Hub : Sumatra – Java
4) Papua Hub : Papua
3b
3a
1
2
4
Kutei Hub
Timika
Merauke
Tangguh LNG
Facility
• Location : offshore Kutei basin
• Working Interest : 37.8%
• Joint operators : PGN Saka,
ENI (37.8%)
• Partners : CPC (20%), Universe
Gas & Oil (4.4%)
Sanga Sanga PSC
Arun
LNG Facility
Bontang LNG Facility
Donggi-Senoro
LNG Facility
Tarakan
Tj. Selor
Samarinda
Production Exploration
Existing PGN pipeline Planned PGN pipeline
• Location : offshore Maluku
• Working Interest : 100%
• Operator : PGN Saka
West Yamdena
• Location : offshore Kutei basin
• Working Interest : 100%
• Operator : PGN Saka
PekawaiExpired
Expired
• Location : offshore Java sea
• Working Interest : 20%
• Operator & Partner : Petronas (80%)
Muriah PSC
• Location : offshore Java sea
• Working Interest : 100%
• Operator : PGN Saka
Pangkah PSC
• Location : Webb County, Texas,
United States
• Working Interest : 36%
• Operator & Partner : Silverbow (Previously
Swift Energy) (64%)
Fasken
International
• Location : offshore East Java
• Working Interest : 20%
• Operator & Partner : Petronas (80%)
Ketapang PSC
7
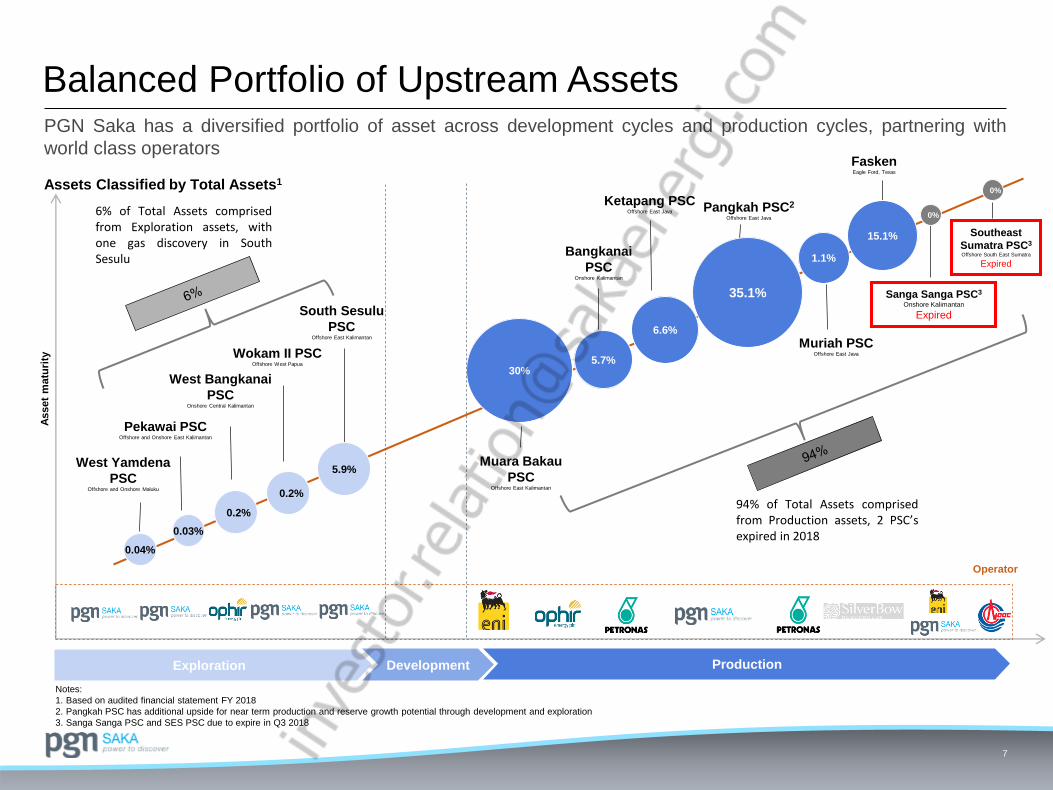
Balanced Portfolio of Upstream AssetsA
sset
matu
rity
FaskenEagle Ford, Texas
Southeast
Sumatra PSC3
Offshore South East Sumatra
Expired
Muara Bakau
PSCOffshore East Kalimantan
South Sesulu
PSCOffshore East Kalimantan
Operator
Sanga Sanga PSC3
Onshore Kalimantan
Expired
Exploration Development Production
Assets Classified by Total Assets1
Wokam II PSCOffshore West Papua
West Bangkanai
PSCOnshore Central Kalimantan
PGN Saka has a diversified portfolio of asset across development cycles and production cycles, partnering with
world class operators
Notes:
1. Based on audited financial statement FY 2018
2. Pangkah PSC has additional upside for near term production and reserve growth potential through development and exploration
3. Sanga Sanga PSC and SES PSC due to expire in Q3 2018
5.9%
Pangkah PSC2
Offshore East Java
Muriah PSCOffshore East Java
Ketapang PSCOffshore East Java
Bangkanai
PSCOnshore Kalimantan
30%5.7%
6.6%
35.1%
1.1%
15.1%
6% of Total Assets comprisedfrom Exploration assets, withone gas discovery in SouthSesulu
94% of Total Assets comprisedfrom Production assets, 2 PSC’sexpired in 20180.03%
0.04%
Pekawai PSCOffshore and Onshore East Kalimantan
West Yamdena
PSCOffshore and Onshore Maluku
0%
0.2%
0.2%
0%
Operational & Financial Highlights
Section 2
9
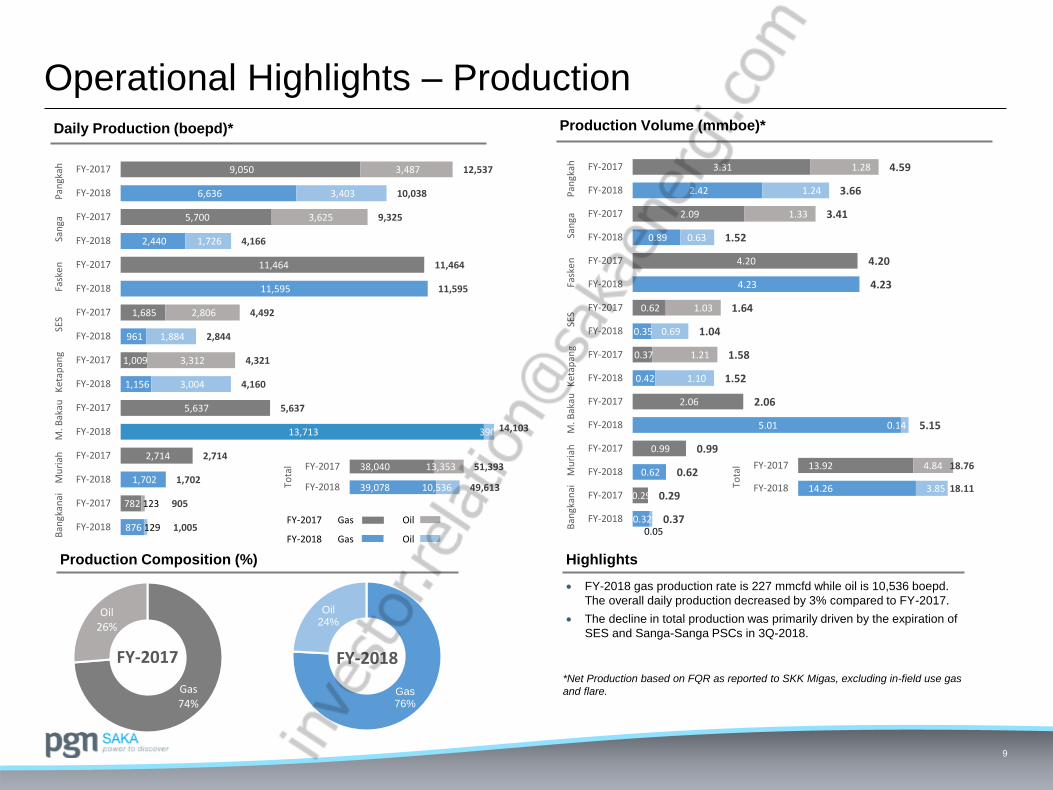
Operational Highlights – ProductionDaily Production (boepd)*
Production Composition (%)
Production Volume (mmboe)*
Highlights
FY-2018 gas production rate is 227 mmcfd while oil is 10,536 boepd.
The overall daily production decreased by 3% compared to FY-2017.
The decline in total production was primarily driven by the expiration of
SES and Sanga-Sanga PSCs in 3Q-2018.
*Net Production based on FQR as reported to SKK Migas, excluding in-field use gas
and flare.
FY-2017 Gas Oil
FY-2018 Gas Oil 876
782
1,702
2,714
13,713
5,637
1,156
1,009
961
1,685
11,595
11,464
2,440
5,700
6,636
9,050
129
123
390
3,004
3,312
1,884
2,806
1,726
3,625
3,403
3,487
1,005
905
1,702
2,714
14,103
5,637
4,160
4,321
2,844
4,492
11,595
11,464
4,166
9,325
10,038
12,537
FY-2018
FY-2017
FY-2018
FY-2017
FY-2018
FY-2017
FY-2018
FY-2017
FY-2018
FY-2017
FY-2018
FY-2017
FY-2018
FY-2017
FY-2018
FY-2017
Ban
gkan
aiM
uri
ahM
. Bak
auK
etap
ang
SES
Fask
enSa
nga
Pan
gkah
39,078
38,040
10,536
13,353
49,613
51,393
FY-2018
FY-2017
Tota
l
0.32
0.29
0.62
0.99
5.01
2.06
0.42
0.37
0.35
0.62
4.23
4.20
0.89
2.09
2.42
3.31
0.05
0.14
1.10
1.21
0.69
1.03
0.63
1.33
1.24
1.28
0.37
0.29
0.62
0.99
5.15
2.06
1.52
1.58
1.04
1.64
4.23
4.20
1.52
3.41
3.66
4.59
FY-2018
FY-2017
FY-2018
FY-2017
FY-2018
FY-2017
FY-2018
FY-2017
FY-2018
FY-2017
FY-2018
FY-2017
FY-2018
FY-2017
FY-2018
FY-2017
Ban
gkan
aiM
uri
ahM
. Bak
auK
etap
ang
SES
Fask
enSa
nga
Pan
gkah
Gas74%
Oil26%
FY-2017
Gas76%
Oil24%
FY-2018
14.26
13.92
3.85
4.84
18.11
18.76
FY-2018
FY-2017
Tota
l
10
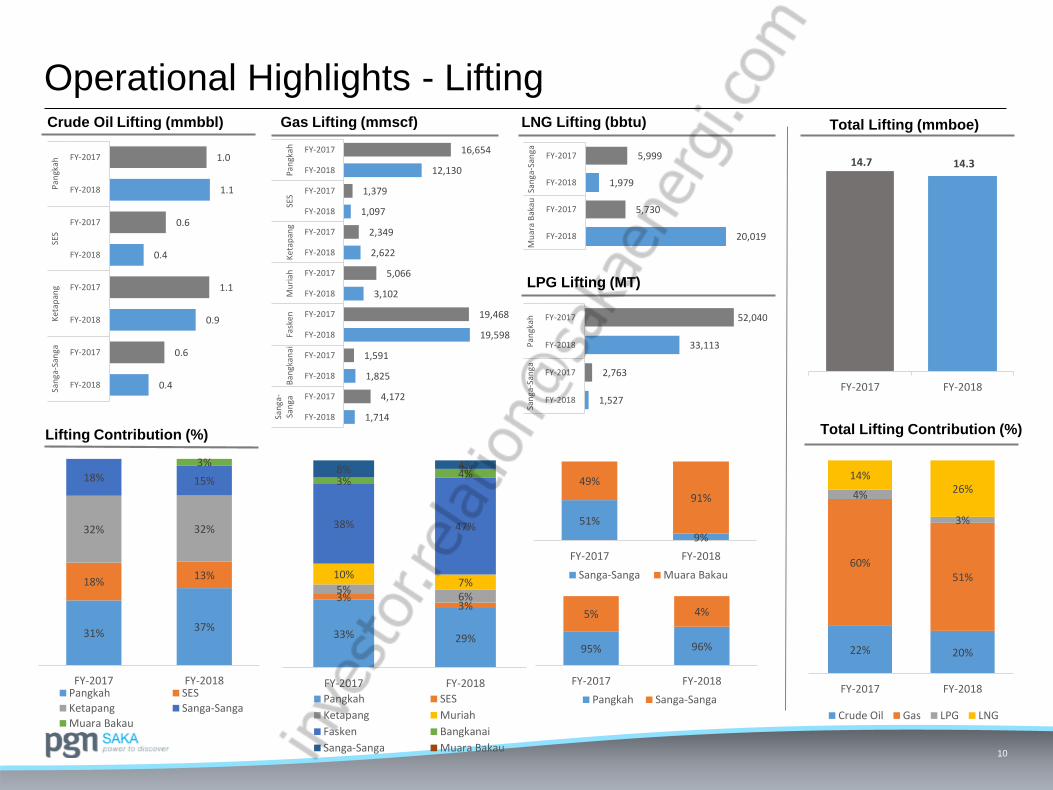
LPG Lifting (MT)
LNG Lifting (bbtu)Crude Oil Lifting (mmbbl)
Operational Highlights - LiftingGas Lifting (mmscf) Total Lifting (mmboe)
Lifting Contribution (%) Total Lifting Contribution (%)
0.4
0.6
0.9
1.1
0.4
0.6
1.1
1.0
FY-2018
FY-2017
FY-2018
FY-2017
FY-2018
FY-2017
FY-2018
FY-2017
San
ga-S
anga
Ket
apan
gSE
SP
angk
ah
1,714
4,172
1,825
1,591
19,598
19,468
3,102
5,066
2,622
2,349
1,097
1,379
12,130
16,654
FY-2018
FY-2017
FY-2018
FY-2017
FY-2018
FY-2017
FY-2018
FY-2017
FY-2018
FY-2017
FY-2018
FY-2017
FY-2018
FY-2017
San
ga-
San
gaB
angk
anai
Fask
enM
uri
ahK
etap
ang
SES
Pan
gkah
1,527
2,763
33,113
52,040
FY-2018
FY-2017
FY-2018
FY-2017
San
ga-S
anga
Pan
gkah
20,019
5,730
1,979
5,999
FY-2018
FY-2017
FY-2018
FY-2017
Mu
ara
Bak
auSa
nga
-San
ga
14.7 14.3
FY-2017 FY-2018
31%37%
18%13%
32% 32%
18% 15%
3%
FY-2017 FY-2018Pangkah SES
Ketapang Sanga-Sanga
Muara Bakau
33% 29%
3%3%
5%6%
10%7%
38% 47%
3%4%8% 4%
FY-2017 FY-2018
Pangkah SES
Ketapang Muriah
Fasken Bangkanai
Sanga-Sanga Muara Bakau
95% 96%
5% 4%
FY-2017 FY-2018
Pangkah Sanga-Sanga
51%
9%
49%
91%
FY-2017 FY-2018
Sanga-Sanga Muara Bakau
22% 20%
60%51%
4%
3%
14%26%
FY-2017 FY-2018
Crude Oil Gas LPG LNG
11
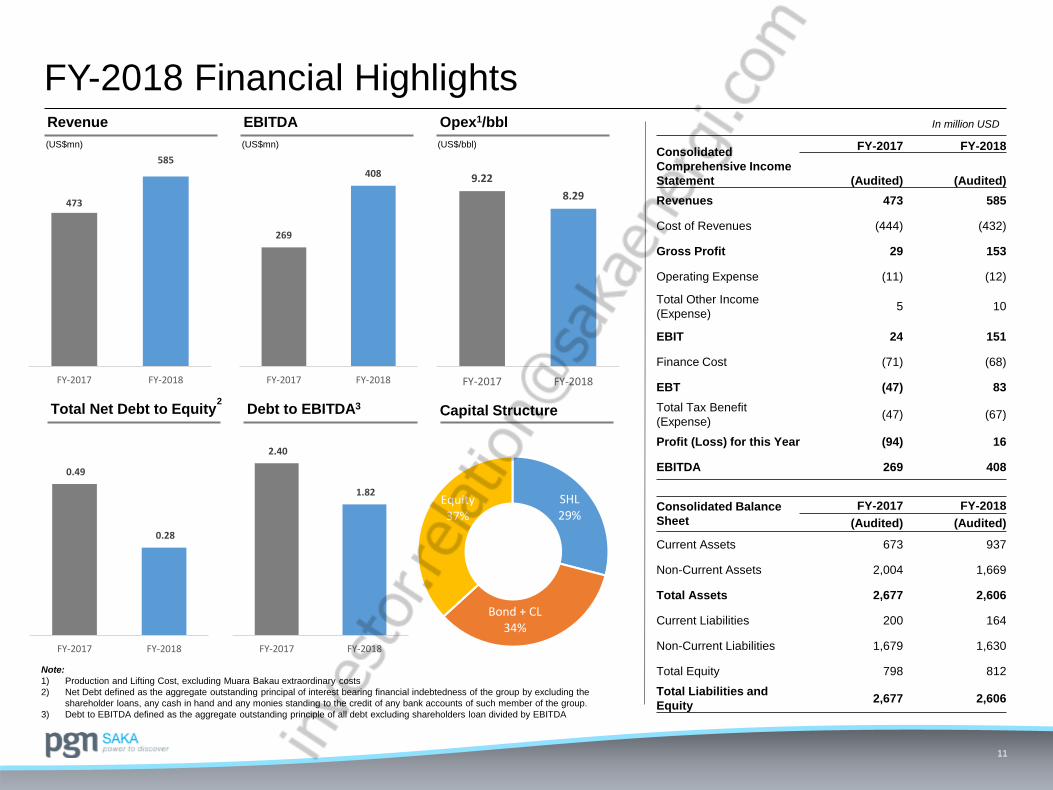
FY-2018 Financial HighlightsRevenue EBITDA Opex1/bbl
Capital StructureTotal Net Debt to Equity Debt to EBITDA3
Note:
1) Production and Lifting Cost, excluding Muara Bakau extraordinary costs
2) Net Debt defined as the aggregate outstanding principal of interest bearing financial indebtedness of the group by excluding the
shareholder loans, any cash in hand and any monies standing to the credit of any bank accounts of such member of the group.
3) Debt to EBITDA defined as the aggregate outstanding principle of all debt excluding shareholders loan divided by EBITDA
(US$mn) (US$mn) (US$/bbl)
2
In million USD
473
585
FY-2017 FY-2018
269
408
FY-2017 FY-2018
9.22
8.29
FY-2017 FY-2018
0.49
0.28
FY-2017 FY-2018
2.40
1.82
FY-2017 FY-2018
SHL29%
Bond + CL34%
Equity37%
Consolidated
Comprehensive Income
Statement
FY-2017 FY-2018
(Audited) (Audited)
Revenues 473 585
Cost of Revenues (444) (432)
Gross Profit 29 153
Operating Expense (11) (12)
Total Other Income
(Expense)5 10
EBIT 24 151
Finance Cost (71) (68)
EBT (47) 83
Total Tax Benefit
(Expense)(47) (67)
Profit (Loss) for this Year (94) 16
EBITDA 269 408
Consolidated Balance
Sheet
FY-2017 FY-2018
(Audited) (Audited)
Current Assets 673 937
Non-Current Assets 2,004 1,669
Total Assets 2,677 2,606
Current Liabilities 200 164
Non-Current Liabilities 1,679 1,630
Total Equity 798 812
Total Liabilities and
Equity2,677 2,606
12
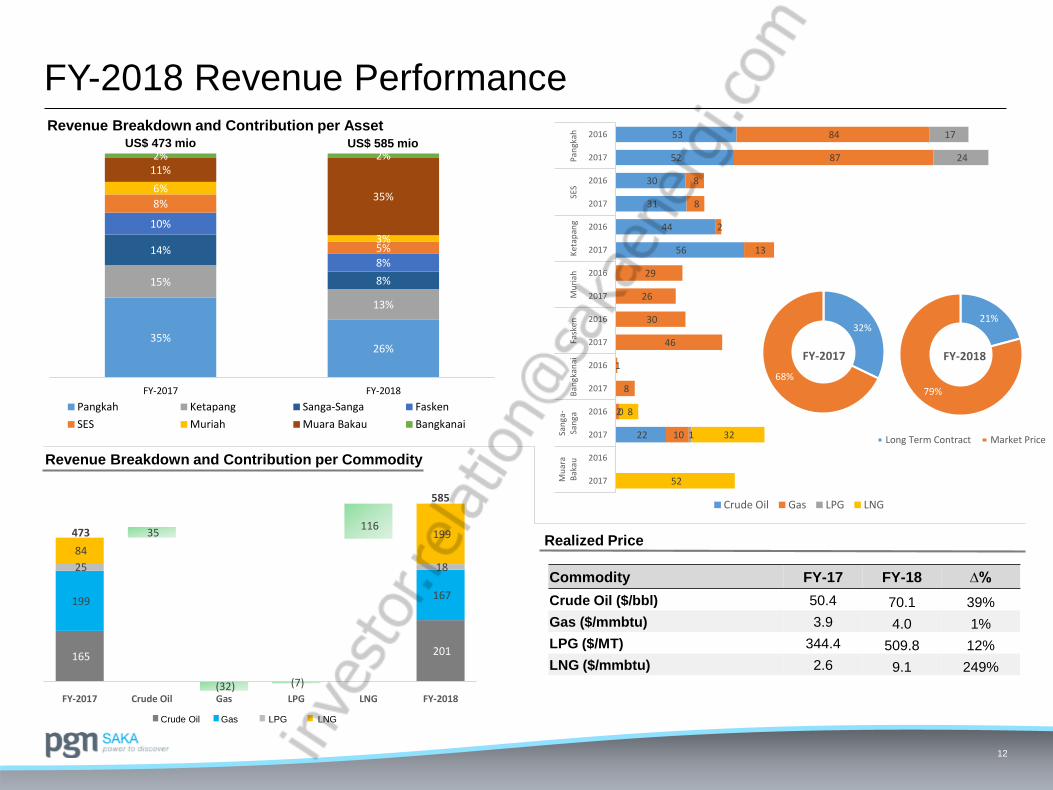
FY-2018 Revenue PerformanceRevenue Breakdown and Contribution per Asset
Revenue Breakdown and Contribution per Commodity
Realized Price
Crude Oil Gas LPG LNG
Commodity FY-17 FY-18 ∆%
Crude Oil ($/bbl) 50.4 70.1 39%
Gas ($/mmbtu) 3.9 4.0 1%
LPG ($/MT) 344.4 509.8 12%
LNG ($/mmbtu) 2.6 9.1 249%
35%26%
15%
13%
14%
8%
10%
8%
8%
5%
6%
3%
11%
35%
2% 2%
FY-2017 FY-2018
Axis TitlePangkah Ketapang Sanga-Sanga Fasken
SES Muriah Muara Bakau Bangkanai
US$ 473 mio US$ 585 mio
22
56
44
31
30
52
53
10
2
8
1
46
30
26
29
13
2
8
8
87
84
1
0
24
17
52
32
8
2017
2016
2017
2016
2017
2016
2017
2016
2017
2016
2017
2016
2017
2016
2017
2016
Mu
ara
Bak
auSa
nga
-Sa
nga
Ban
gkan
aiFa
sken
Mu
riah
Ket
apan
gSE
SP
angk
ah
Crude Oil Gas LPG LNG
32%
68%
FY-2017
21%
79%
FY-2018
Long Term Contract Market Price
165 201
199
35
(32) (7)
116
167
25 18
84
199 473
585
FY-2017 Crude Oil Gas LPG LNG FY-2018

EBITDA reconciliation
Appendix A
14
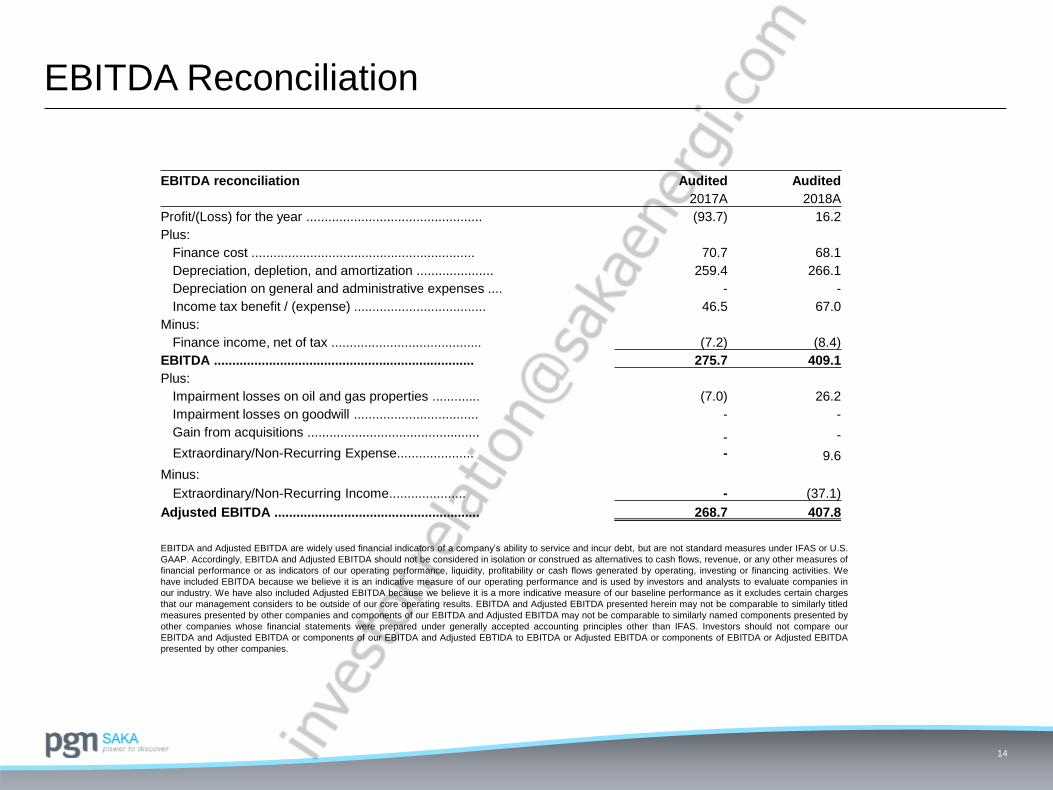
EBITDA Reconciliation
EBITDA and Adjusted EBITDA are widely used financial indicators of a company’s ability to service and incur debt, but are not standard measures under IFAS or U.S.
GAAP. Accordingly, EBITDA and Adjusted EBITDA should not be considered in isolation or construed as alternatives to cash flows, revenue, or any other measures of
financial performance or as indicators of our operating performance, liquidity, profitability or cash flows generated by operating, investing or financing activities. We
have included EBITDA because we believe it is an indicative measure of our operating performance and is used by investors and analysts to evaluate companies in
our industry. We have also included Adjusted EBITDA because we believe it is a more indicative measure of our baseline performance as it excludes certain charges
that our management considers to be outside of our core operating results. EBITDA and Adjusted EBITDA presented herein may not be comparable to similarly titled
measures presented by other companies and components of our EBITDA and Adjusted EBITDA may not be comparable to similarly named components presented by
other companies whose financial statements were prepared under generally accepted accounting principles other than IFAS. Investors should not compare our
EBITDA and Adjusted EBITDA or components of our EBITDA and Adjusted EBTIDA to EBITDA or Adjusted EBITDA or components of EBITDA or Adjusted EBITDA
presented by other companies.
EBITDA reconciliation Audited Audited
2017A 2018A
Profit/(Loss) for the year ................................................ (93.7) 16.2
Plus:
Finance cost ............................................................. 70.7 68.1
Depreciation, depletion, and amortization ..................... 259.4 266.1
Depreciation on general and administrative expenses .... - -
Income tax benefit / (expense) .................................... 46.5 67.0
Minus:
Finance income, net of tax ......................................... (7.2) (8.4)
EBITDA ....................................................................... 275.7 409.1
Plus:
Impairment losses on oil and gas properties ............. (7.0) 26.2
Impairment losses on goodwill .................................. - -
Gain from acquisitions ............................................... -
-
-
Extraordinary/Non-Recurring Expense..................... 9.6
Minus:
Extraordinary/Non-Recurring Income..................... - (37.1)
Adjusted EBITDA ........................................................ 268.7 407.8
Regulation and upstream fiscal regime
Appendix B
16
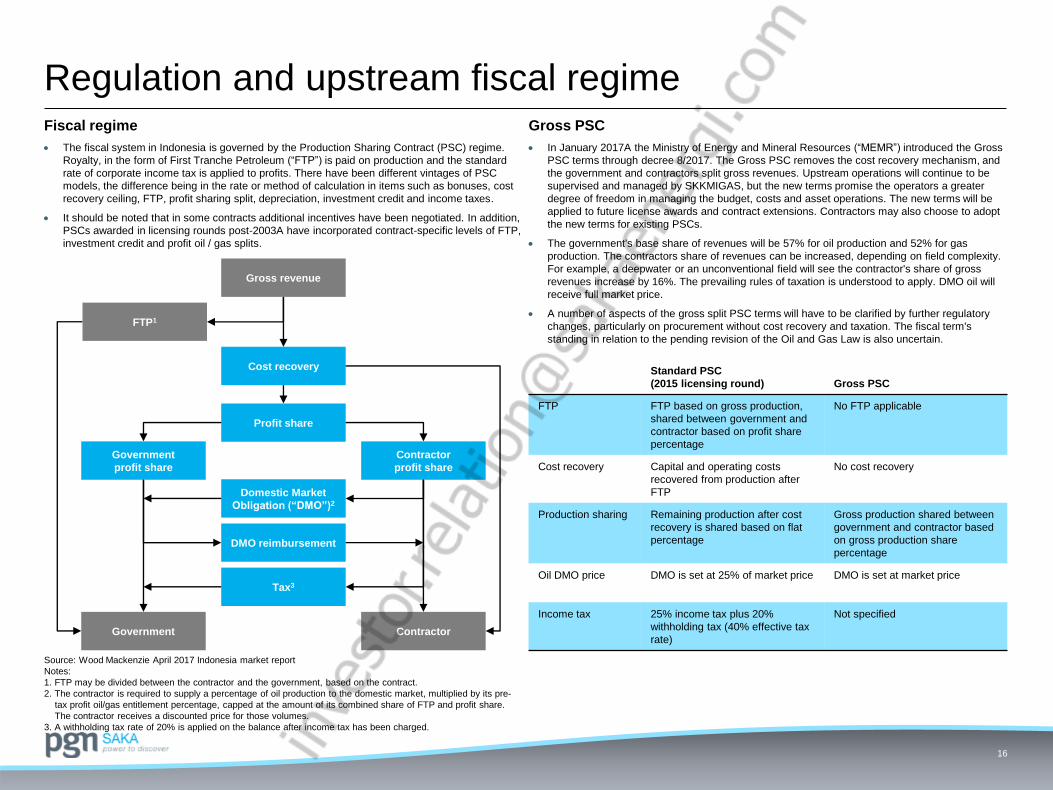
Regulation and upstream fiscal regime
The fiscal system in Indonesia is governed by the Production Sharing Contract (PSC) regime.
Royalty, in the form of First Tranche Petroleum (“FTP”) is paid on production and the standard
rate of corporate income tax is applied to profits. There have been different vintages of PSC
models, the difference being in the rate or method of calculation in items such as bonuses, cost
recovery ceiling, FTP, profit sharing split, depreciation, investment credit and income taxes.
It should be noted that in some contracts additional incentives have been negotiated. In addition,
PSCs awarded in licensing rounds post-2003A have incorporated contract-specific levels of FTP,
investment credit and profit oil / gas splits.
Fiscal regime
Cost recovery
Gross revenue
FTP1
Government
Profit share
Contractor
profit share
Government
profit share
Domestic Market
Obligation (“DMO”)2
Tax3
DMO reimbursement
Contractor
Source: Wood Mackenzie April 2017 Indonesia market report
Notes:
1. FTP may be divided between the contractor and the government, based on the contract.
2. The contractor is required to supply a percentage of oil production to the domestic market, multiplied by its pre-
tax profit oil/gas entitlement percentage, capped at the amount of its combined share of FTP and profit share.
The contractor receives a discounted price for those volumes.
3. A withholding tax rate of 20% is applied on the balance after income tax has been charged.
Gross PSC
In January 2017A the Ministry of Energy and Mineral Resources (“MEMR”) introduced the Gross
PSC terms through decree 8/2017. The Gross PSC removes the cost recovery mechanism, and
the government and contractors split gross revenues. Upstream operations will continue to be
supervised and managed by SKKMIGAS, but the new terms promise the operators a greater
degree of freedom in managing the budget, costs and asset operations. The new terms will be
applied to future license awards and contract extensions. Contractors may also choose to adopt
the new terms for existing PSCs.
The government's base share of revenues will be 57% for oil production and 52% for gas
production. The contractors share of revenues can be increased, depending on field complexity.
For example, a deepwater or an unconventional field will see the contractor's share of gross
revenues increase by 16%. The prevailing rules of taxation is understood to apply. DMO oil will
receive full market price.
A number of aspects of the gross split PSC terms will have to be clarified by further regulatory
changes, particularly on procurement without cost recovery and taxation. The fiscal term's
standing in relation to the pending revision of the Oil and Gas Law is also uncertain.
Standard PSC
(2015 licensing round) Gross PSC
FTP FTP based on gross production,
shared between government and
contractor based on profit share
percentage
No FTP applicable
Cost recovery Capital and operating costs
recovered from production after
FTP
No cost recovery
Production sharing Remaining production after cost
recovery is shared based on flat
percentage
Gross production shared between
government and contractor based
on gross production share
percentage
Oil DMO price DMO is set at 25% of market price DMO is set at market price
Income tax 25% income tax plus 20%
withholding tax (40% effective tax
rate)
Not specified

PT Saka Energi Indonesia
The Energy 11th – 12th Floor
Jl. Jenderal Sudirman Kav 52-53, SCBD
Jakarta 12190
Phone: +62(21) 29951000
Fax : +62(21) 29951001
Email: [email protected]
Recommended