Investor Presentation
Robert BuckChief Executive Officer
David GraceChief Financial Officer
Spring / Summer 2007
Financials for YTD Q2 ended March 2007

2
Forward looking statements
This presentation contains “forward-looking statements”. These statements relate to future events or our future financial performance and involve known and unknown risks, uncertainties and other factors that may cause our actual results, levels of activity, performance or achievements expressed or implied by these forward-looking statements. Although we believe that the expectations reflected in the forward-looking statements are reasonable, we cannot guarantee future results, levels of activity, performance or achievements. We caution you not to place undue reliance on forward-looking statements, which reflect our analysis only and speak only as of the date of this presentation, and you should refer to the “Risk Factors” section of our latest Form 10K. We undertake no obligation to update the forward-looking statements to reflect subsequent events or circumstances.
1
Company Overview
Robert BuckChief Executive Officer
3
4
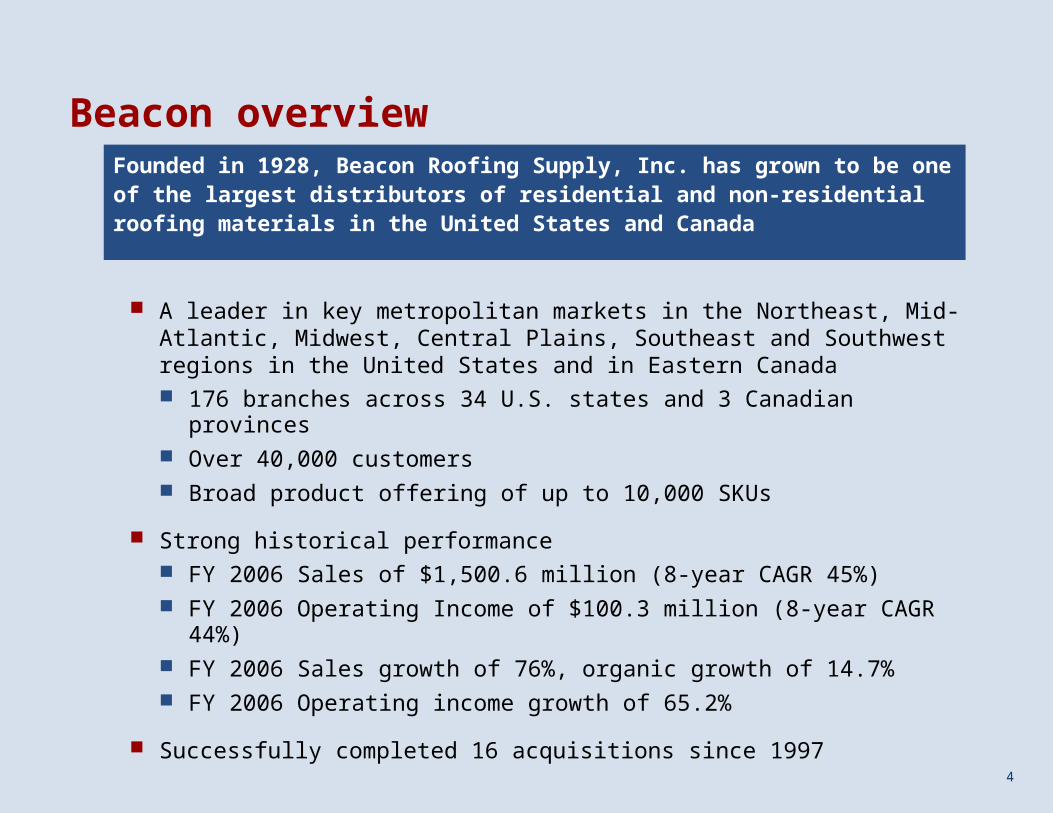
Beacon overview
A leader in key metropolitan markets in the Northeast, Mid-Atlantic, Midwest, Central Plains, Southeast and Southwest regions in the United States and in Eastern Canada 176 branches across 34 U.S. states and 3 Canadian provinces Over 40,000 customers Broad product offering of up to 10,000 SKUs
Strong historical performance FY 2006 Sales of $1,500.6 million (8-year CAGR 45%) FY 2006 Operating Income of $100.3 million (8-year CAGR 44%) FY 2006 Sales growth of 76%, organic growth of 14.7% FY 2006 Operating income growth of 65.2%
Successfully completed 16 acquisitions since 1997
Founded in 1928, Beacon Roofing Supply, Inc. has grown to be one of the largest distributors of residential and non-residential roofing materials in the United States and Canada
5
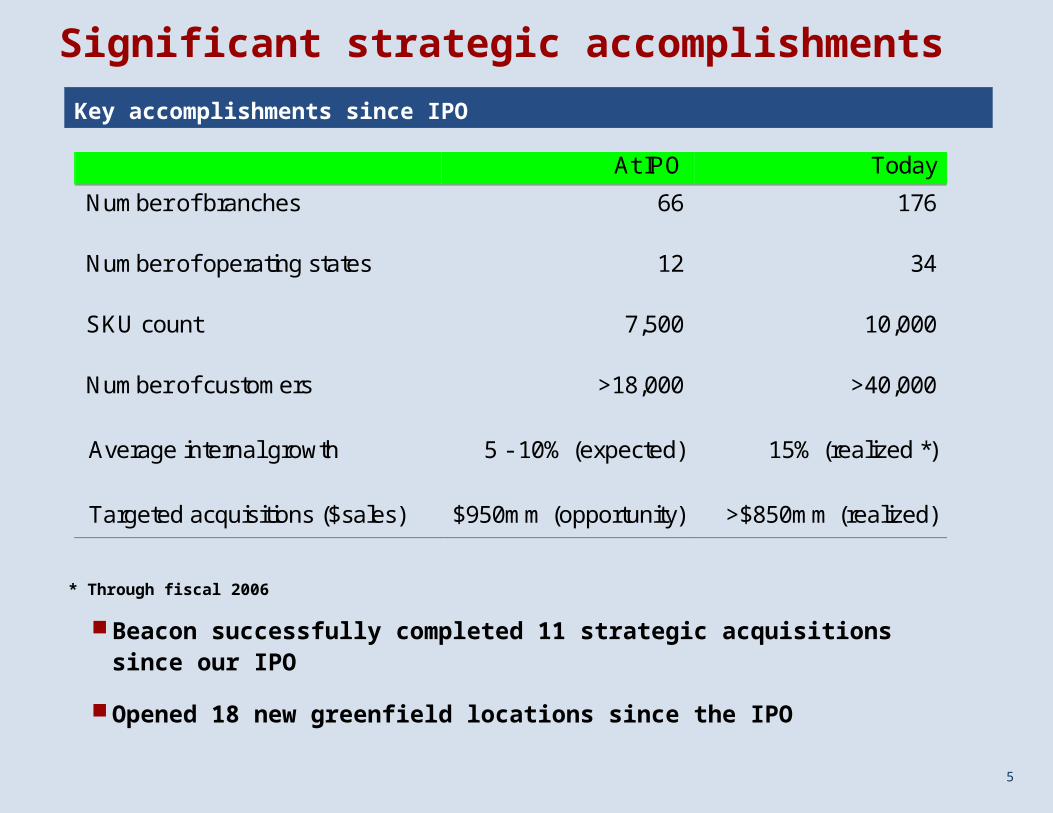
Significant strategic accomplishments
Key accomplishments since IPO
At IPO Today
Number of branches 66 176
Number of operating states 12 34
SKU count 7,500 10,000
Number of customers >18,000 >40,000
Average internal growth 5 - 10% (expected) 15% (realized *)
Targeted acquisitions ($sales) $950mm (opportunity) >$850mm (realized)
Beacon successfully completed 11 strategic acquisitions since our IPO
Opened 18 new greenfield locations since the IPO
* Through fiscal 2006
6
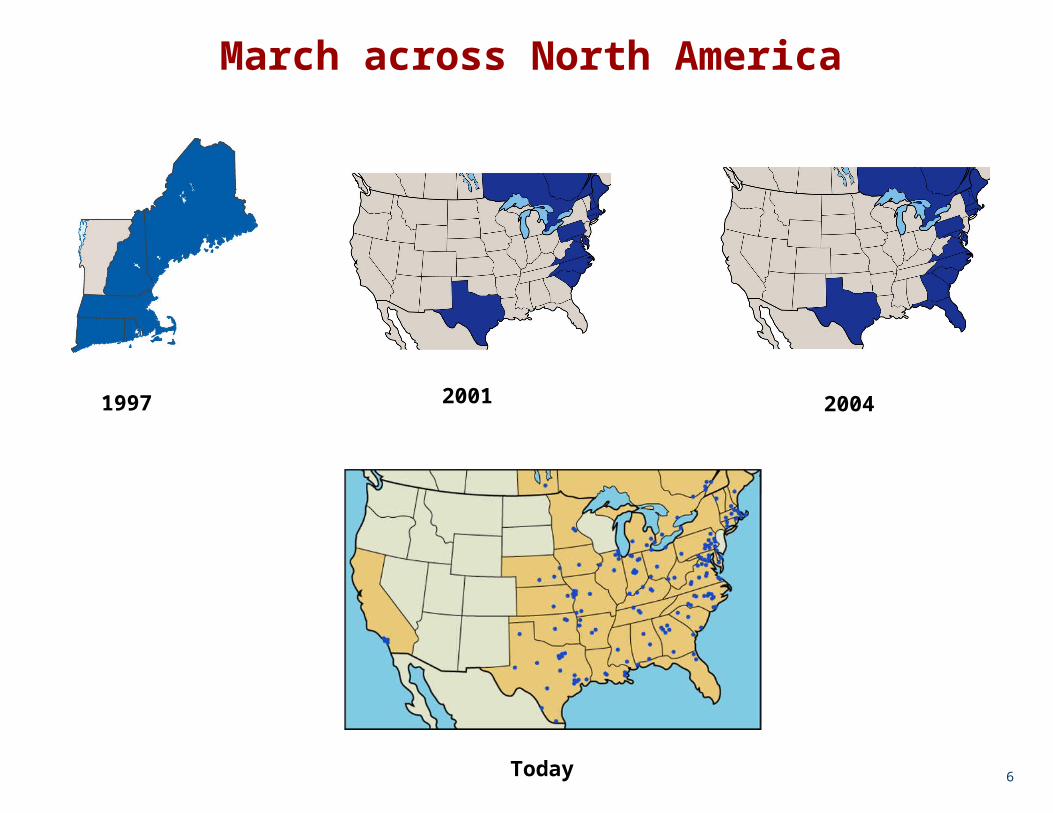
March across North America
1997 2001
Today
2004
7
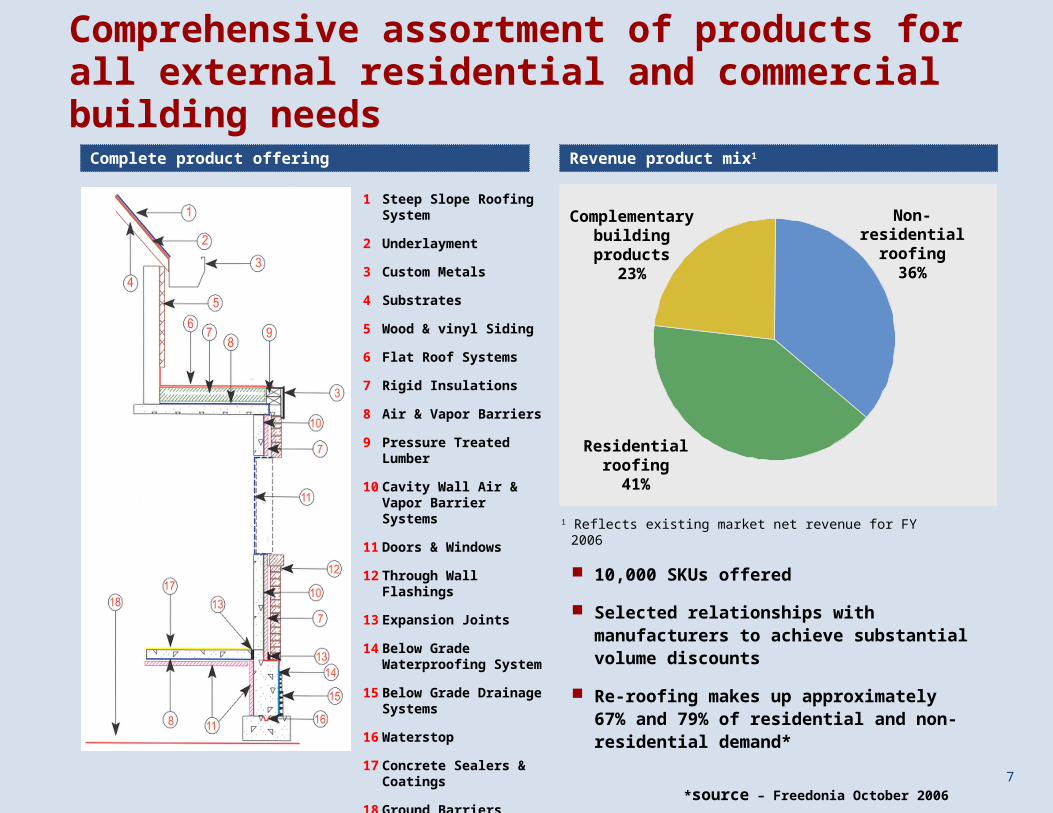
Comprehensive assortment of products for all external residential and commercial building needs
Complete product offering
1 Steep Slope Roofing System
2 Underlayment
3 Custom Metals
4 Substrates
5 Wood & vinyl Siding
6 Flat Roof Systems
7 Rigid Insulations
8 Air & Vapor Barriers
9 Pressure Treated Lumber
10 Cavity Wall Air & Vapor Barrier Systems
11 Doors & Windows
12 Through Wall Flashings
13 Expansion Joints
14 Below Grade Waterproofing System
15 Below Grade Drainage Systems
16 Waterstop
17 Concrete Sealers & Coatings
18 Ground Barriers
Revenue product mix1
Residential roofing
41%
Non-residential roofing
36%
Complementary building products
23%
1 Reflects existing market net revenue for FY 2006
10,000 SKUs offered
Selected relationships with manufacturers to achieve substantial volume discounts
Re-roofing makes up approximately 67% and 79% of residential and non-residential demand*
*source – Freedonia October 2006
8
Why invest in Beacon?
High value-added distributor performing a critical role in the roofing supply chain
Market leader in an attractive, growing and fragmented industry
Highly scalable platform and proven business model with minimal capital expenditures
Superior financial performance highlighted by attractive growth and margins Historical 8-year sales CAGR: 45% (1998-2006) FY2006 internal sales growth: 14.7% Industry leading operating income margins: 6.7% (FY2006)
Results-oriented management, corporate culture and controls
9
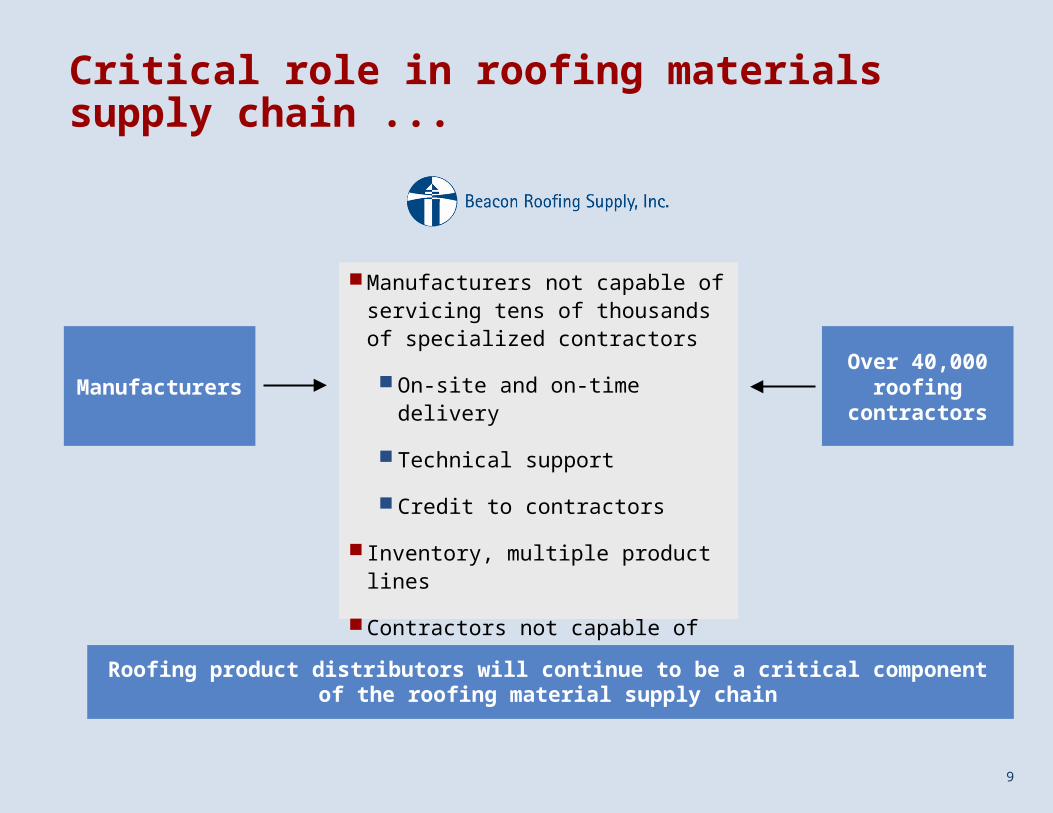
Critical role in roofing materials supply chain ...
Manufacturers not capable of servicing tens of thousands of specialized contractors
On-site and on-time delivery
Technical support
Credit to contractors
Inventory, multiple product lines
Contractors not capable of dealing directly with manufacturer
Over 40,000 roofing
contractors
Roofing product distributors will continue to be a critical component of the roofing material supply chain
Manufacturers
10
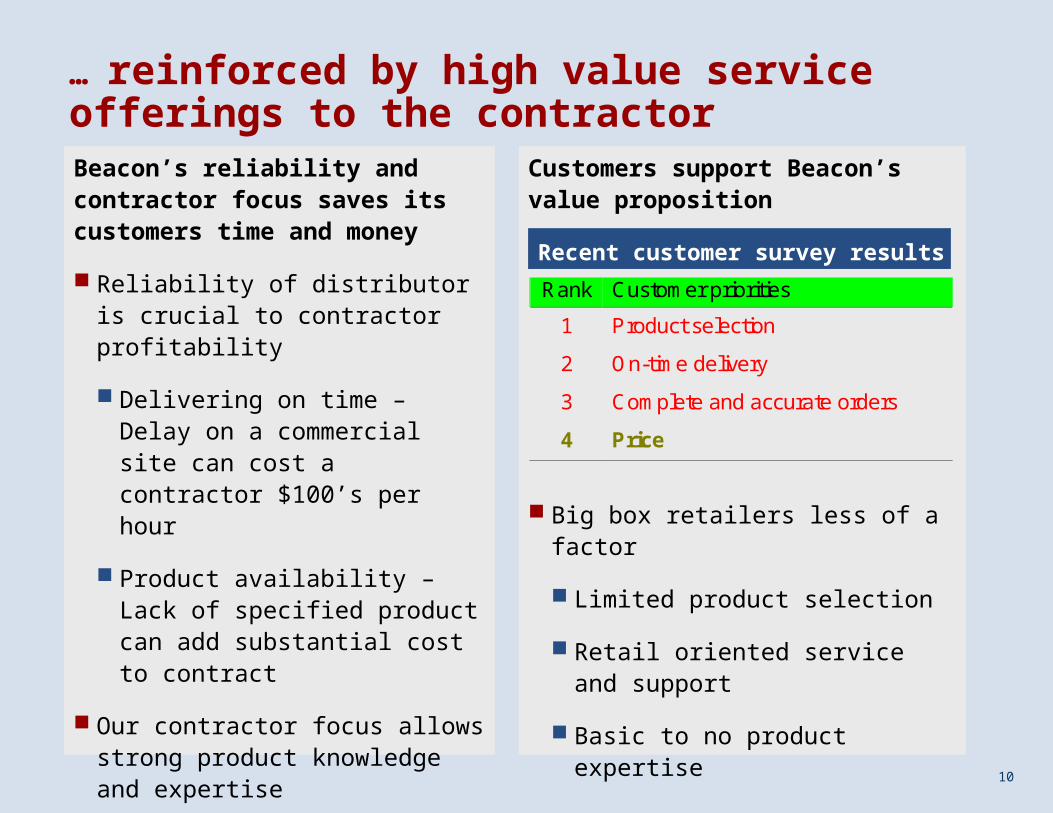
Beacon’s reliability and contractor focus saves its customers time and money
Reliability of distributor is crucial to contractor profitability
Delivering on time – Delay on a commercial site can cost a contractor $100’s per hour
Product availability – Lack of specified product can add substantial cost to contract
Our contractor focus allows strong product knowledge and expertise
Goal is to partner with the contractor rather than just supply
Customers support Beacon’s value proposition
Big box retailers less of a factor
Limited product selection
Retail oriented service and support
Basic to no product expertise
… reinforced by high value service offerings to the contractor
Recent customer survey results
Rank Customer priorities
1 Product selection
2 On-time delivery
3 Complete and accurate orders
4 Price
11
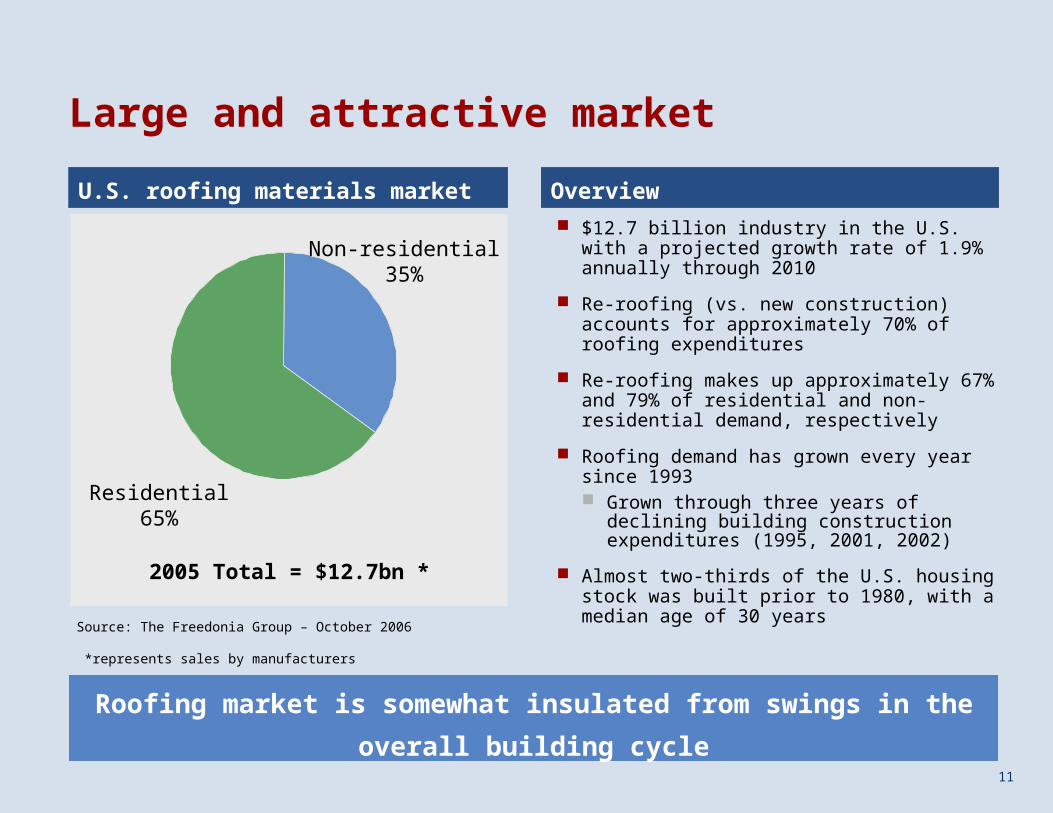
Large and attractive market
U.S. roofing materials market
2005 Total = $12.7bn *
Source: The Freedonia Group – October 2006
*represents sales by manufacturers
$12.7 billion industry in the U.S. with a projected growth rate of 1.9% annually through 2010
Re-roofing (vs. new construction) accounts for approximately 70% of roofing expenditures
Re-roofing makes up approximately 67% and 79% of residential and non-residential demand, respectively
Roofing demand has grown every year since 1993 Grown through three years of declining
building construction expenditures (1995, 2001, 2002)
Almost two-thirds of the U.S. housing stock was built prior to 1980, with a median age of 30 years
Overview
Non-residential35%
Residential65%
Roofing market is somewhat insulated from swings in the overall
building cycle
12
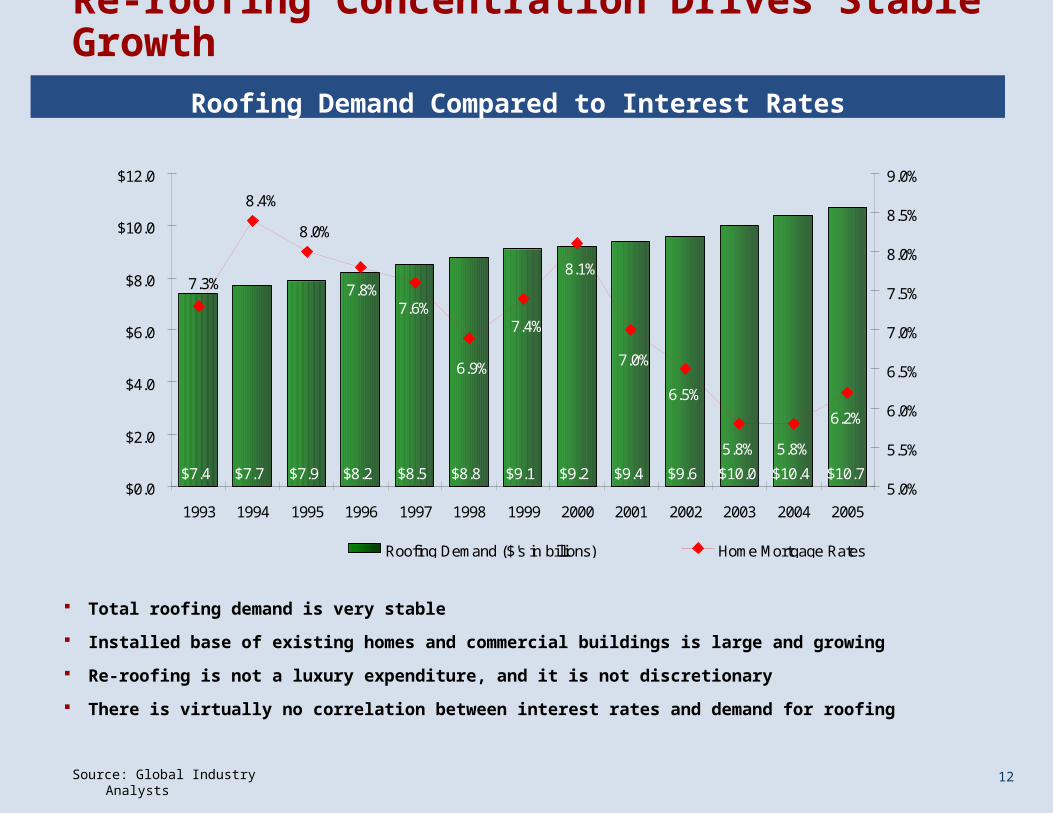
Re-roofing Concentration Drives Stable Growth
Roofing Demand Compared to Interest Rates
Total roofing demand is very stable
Installed base of existing homes and commercial buildings is large and growing
Re-roofing is not a luxury expenditure, and it is not discretionary
There is virtually no correlation between interest rates and demand for roofing
Source: Global Industry Analysts
$7.4 $7.7 $7.9 $8.5 $8.8 $9.4 $9.6 $10.0 $10.4 $10.7$8.2 $9.1 $9.2
6.2%
5.8%5.8%
7.8%7.6%
7.4%
8.1%
7.0%
6.5%
6.9%
8.0%
8.4%
7.3%
$0.0
$2.0
$4.0
$6.0
$8.0
$10.0
$12.0
1993 1994 1995 1996 1997 1998 1999 2000 2001 2002 2003 2004 2005
5.0%
5.5%
6.0%
6.5%
7.0%
7.5%
8.0%
8.5%
9.0%
Roofing Demand ($'s in billions) Home Mortgage Rates
13
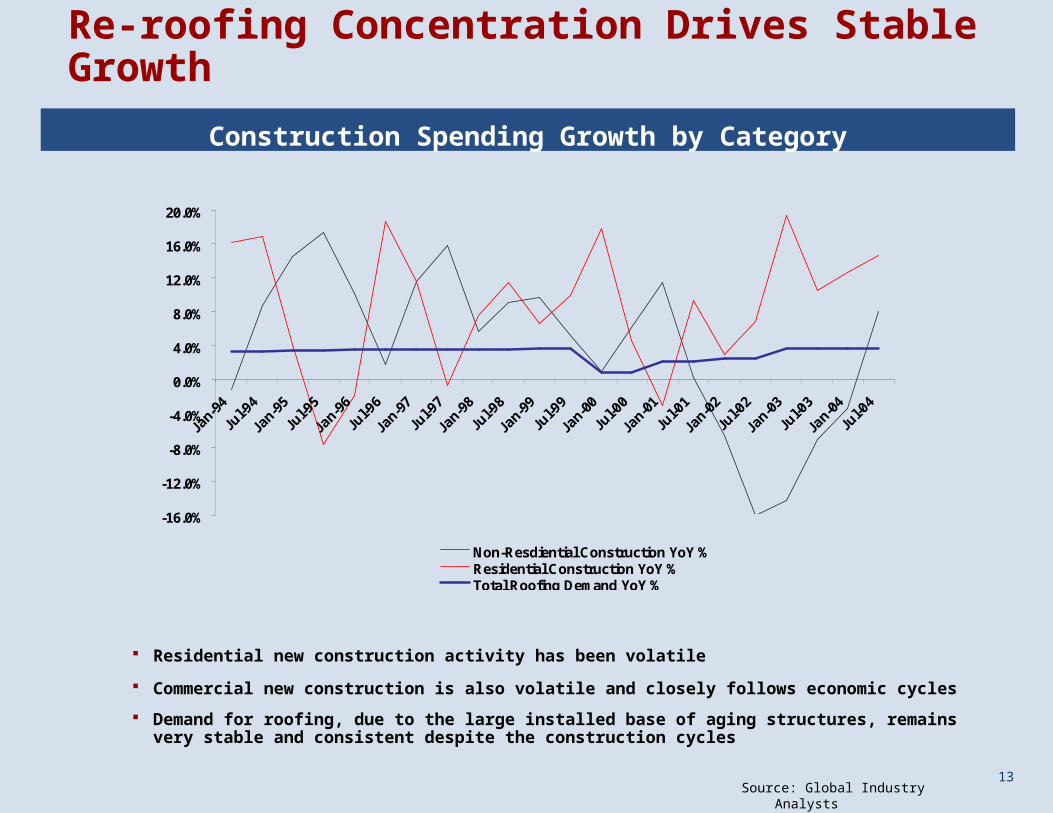
Re-roofing Concentration Drives Stable Growth
Construction Spending Growth by Category
Source: Global Industry Analysts
Residential new construction activity has been volatile
Commercial new construction is also volatile and closely follows economic cycles
Demand for roofing, due to the large installed base of aging structures, remains very stable and consistent despite the construction cycles
-16.0%
-12.0%
-8.0%
-4.0%
0.0%
4.0%
8.0%
12.0%
16.0%
20.0%
Jan-9
4
Jul-9
4
Jan-9
5
Jul-9
5
Jan-9
6
Jul-9
6
Jan-9
7
Jul-9
7
Jan-9
8
Jul-9
8
Jan-9
9
Jul-9
9
Jan-0
0
Jul-0
0
Jan-0
1
Jul-0
1
Jan-0
2
Jul-0
2
Jan-0
3
Jul-0
3
Jan-0
4
Jul-0
4
Non-Resdiential Construction YoY %Residential Construction YoY %Total Roofing Demand YoY %
14
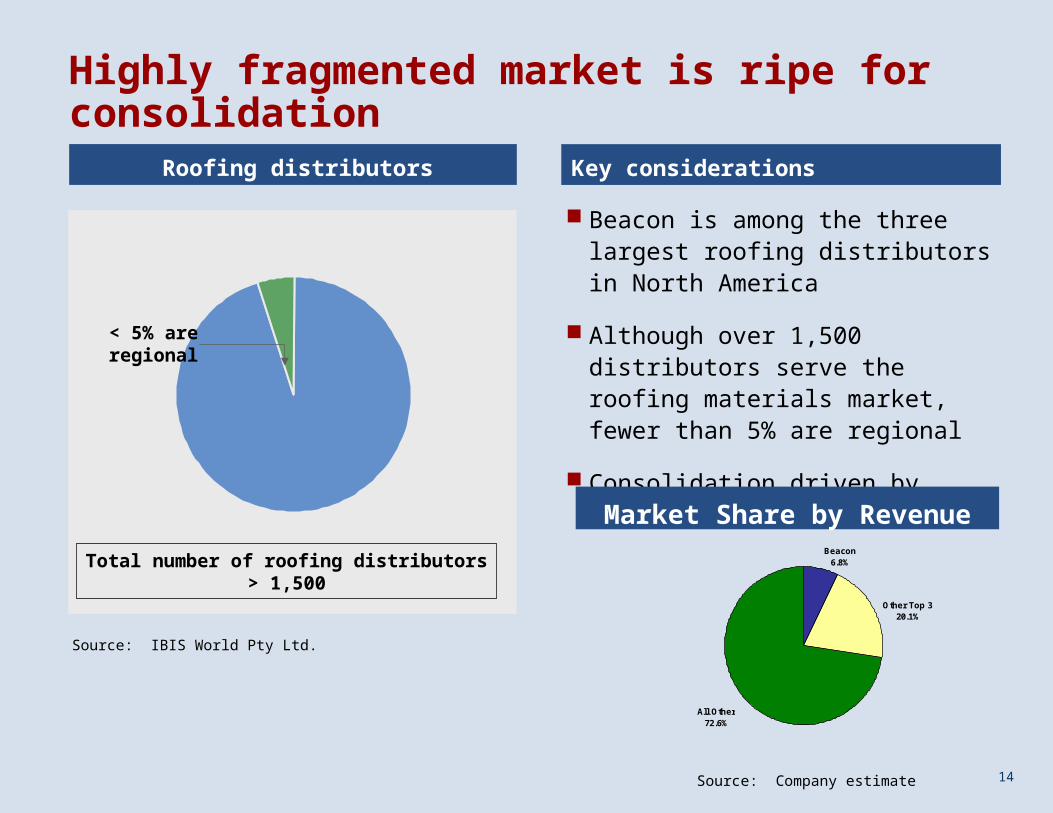
Highly fragmented market is ripe for consolidation
Source: IBIS World Pty Ltd.
< 5% are regional
Key considerations
Beacon is among the three largest roofing distributors in North America
Although over 1,500 distributors serve the roofing materials market, fewer than 5% are regional
Consolidation driven by customer demands and needs
Total number of roofing distributors > 1,500
Roofing distributors
Market Share by Revenue
Source: Company estimate
Other Top 320.1%
All Other72.6%
Beacon6.8%
15
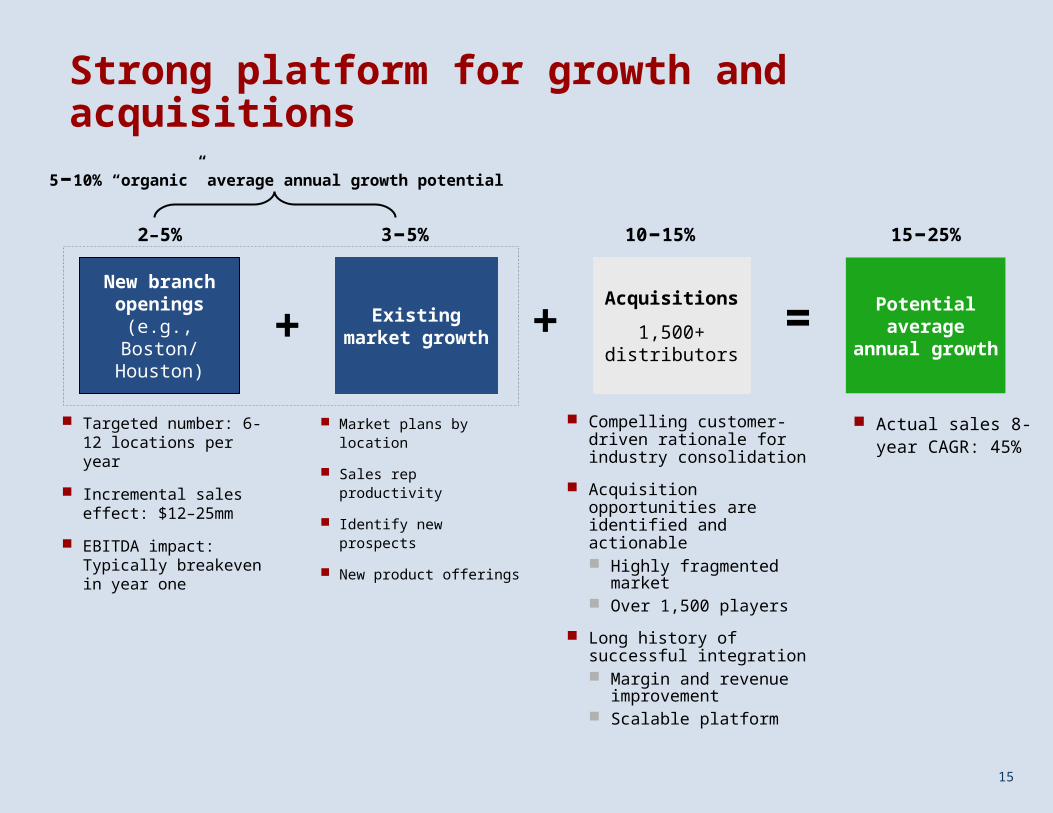
Strong platform for growth and acquisitions
New branch openings
(e.g., Boston/Houston)
Existing market growth
Acquisitions
1,500+ distributors
+ + = Potential average annual
growth
2–5% 3–5% 10–15% 15–25%
Targeted number: 6-12 locations per year
Incremental sales effect: $12–25mm
EBITDA impact: Typically breakeven in year one
Compelling customer-driven rationale for industry consolidation
Acquisition opportunities are identified and actionable Highly fragmented
market Over 1,500 players
Long history of successful integration Margin and revenue
improvement Scalable platform
Market plans by location
Sales rep productivity
Identify new prospects
New product offerings
5–10% “organic” average annual growth potential
Actual sales 8-year CAGR: 45%
16
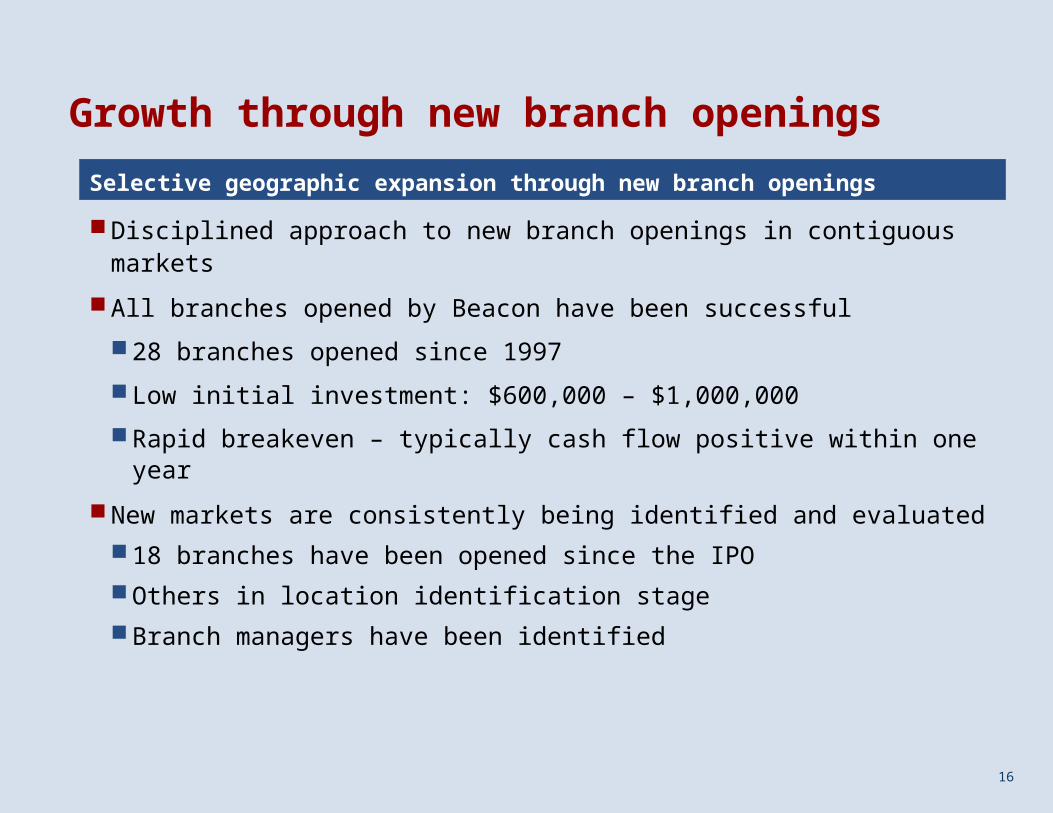
Growth through new branch openings
Disciplined approach to new branch openings in contiguous markets
All branches opened by Beacon have been successful
28 branches opened since 1997
Low initial investment: $600,000 – $1,000,000
Rapid breakeven – typically cash flow positive within one year
New markets are consistently being identified and evaluated
18 branches have been opened since the IPO
Others in location identification stage
Branch managers have been identified
Selective geographic expansion through new branch openings
17
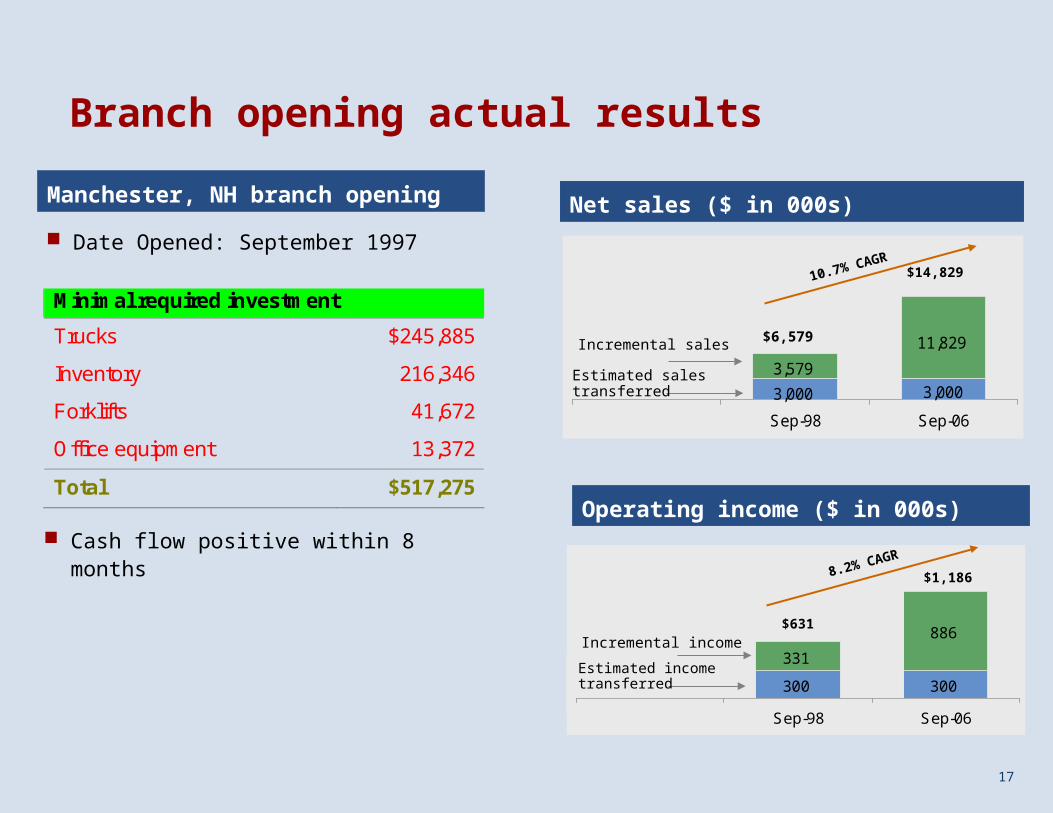
Branch opening actual results
Date Opened: September 1997
Net sales ($ in 000s)
3,0003,000
11,829
3,579
Sep-98 Sep-06
300 300
331
886
Sep-98 Sep-06
$6,579
$14,829
Estimated sales transferred
Incremental sales
$631
$1,186
Manchester, NH branch opening
Operating income ($ in 000s)
Estimated income transferred
Incremental income
10.7% CAGR
8.2% CAGR
Minimal required investment
Trucks $245,885
Inventory 216,346
Forklifts 41,672
Office equipment 13,372
Total $517,275
Cash flow positive within 8 months
18
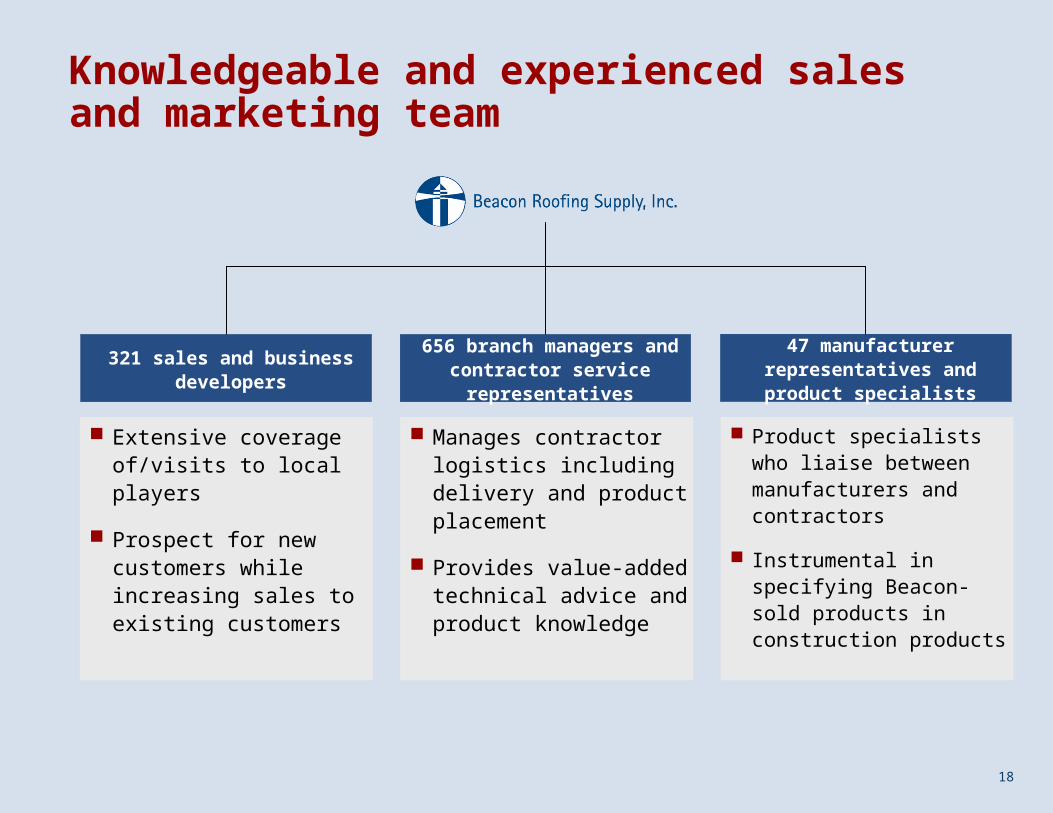
Knowledgeable and experienced sales and marketing team
321 sales and business developers
656 branch managers and contractor service
representatives
47 manufacturerrepresentatives and product
specialists
Extensive coverage of/visits to local players
Prospect for new customers while increasing sales to existing customers
Manages contractor logistics including delivery and product placement
Provides value-added technical advice and product knowledge
Product specialists who liaise between manufacturers and contractors
Instrumental in specifying Beacon-sold products in construction products
19
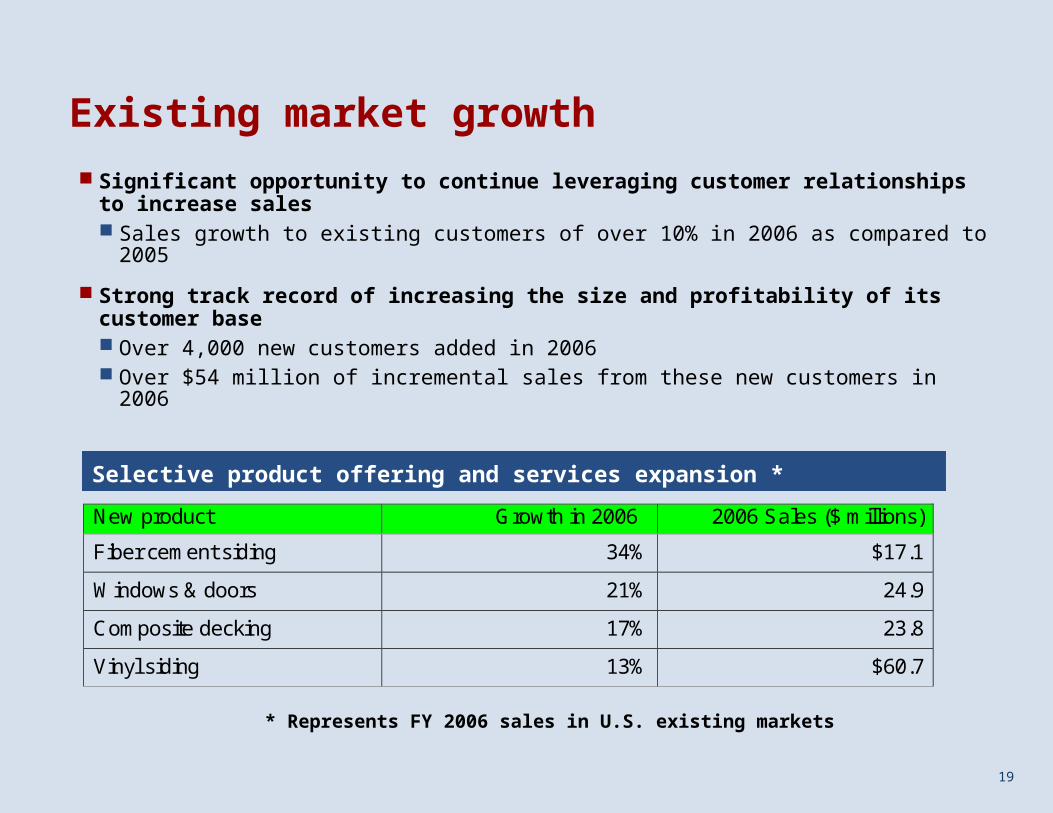
Existing market growth
Significant opportunity to continue leveraging customer relationships to increase sales Sales growth to existing customers of over 10% in 2006 as compared to 2005
Strong track record of increasing the size and profitability of its customer base Over 4,000 new customers added in 2006 Over $54 million of incremental sales from these new customers in 2006
New product Growth in 2006 2006 Sales ($ millions)
Fiber cement siding 34% $17.1
Windows & doors 21% 24.9
Composite decking 17% 23.8
Vinyl siding 13% $60.7
Selective product offering and services expansion *
* Represents FY 2006 sales in U.S. existing markets
20
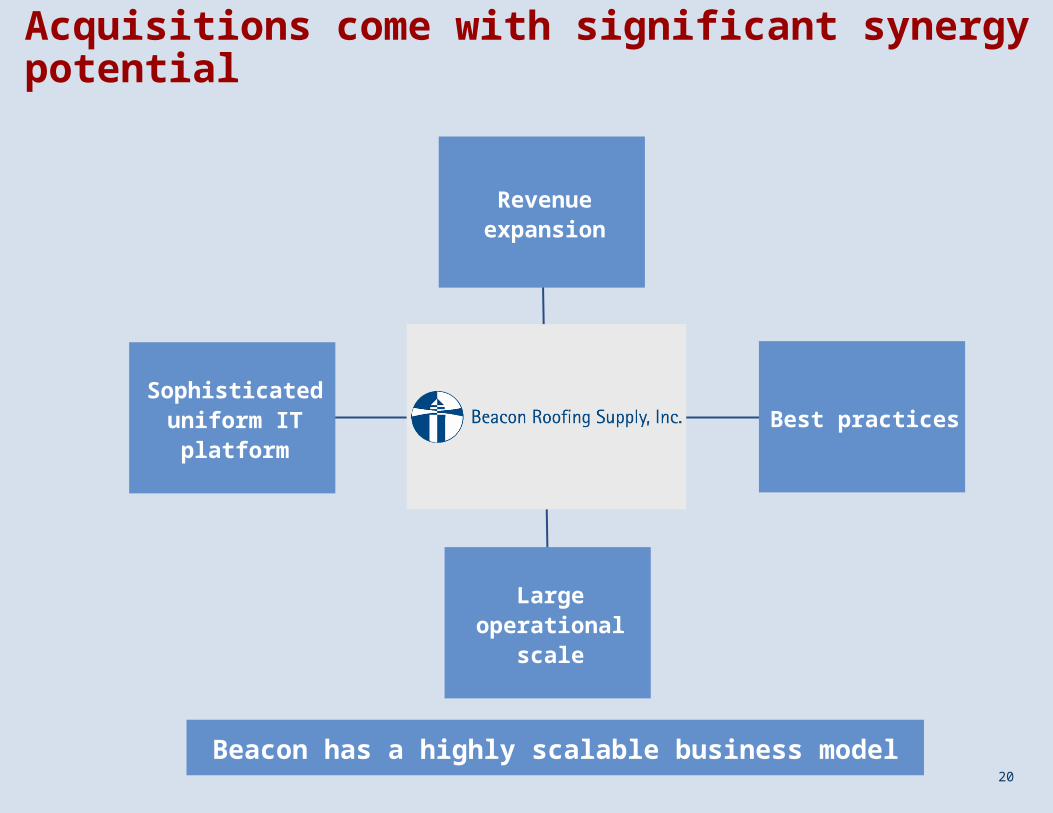
Acquisitions come with significant synergy potential
Sophisticated uniform IT platform
Beacon has a highly scalable business model
Revenue expansion
Best practices
Large operational scale
21
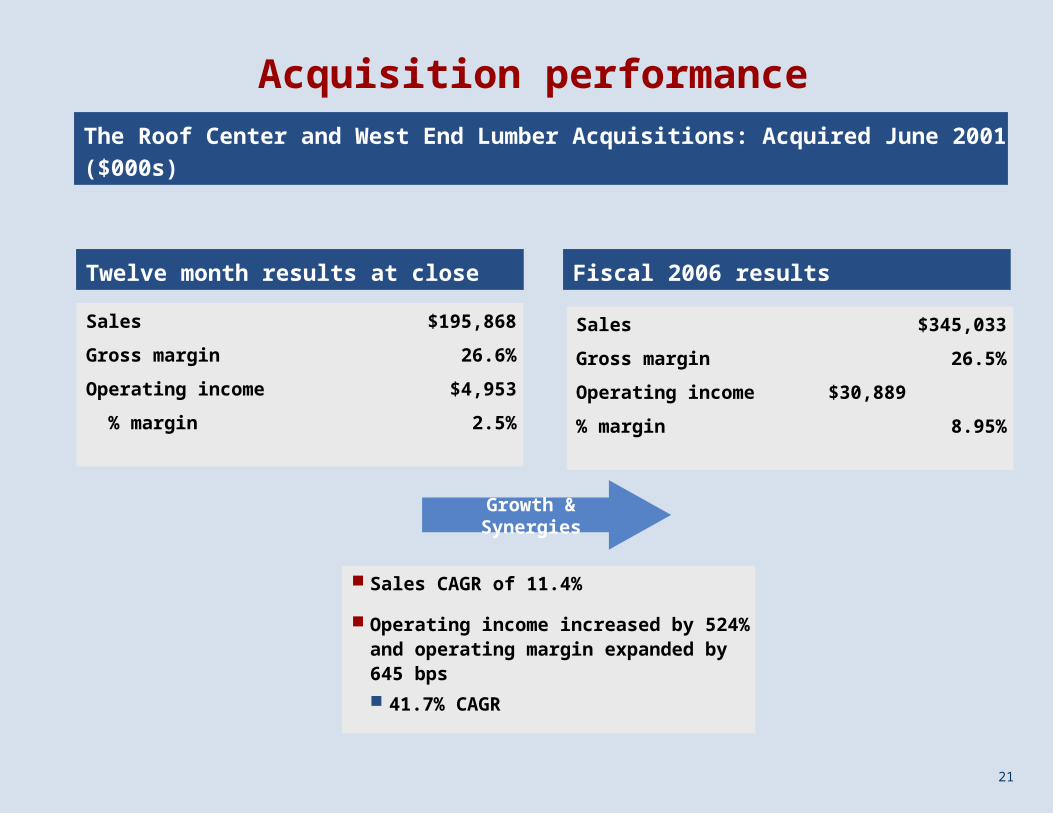
Acquisition performance
The Roof Center and West End Lumber Acquisitions: Acquired June 2001 ($000s)
Growth & Synergies
Sales $195,868
Gross margin 26.6%
Operating income $4,953
% margin 2.5%
Sales $345,033
Gross margin 26.5%
Operating income $30,889
% margin 8.95%
Twelve month results at close Fiscal 2006 results
Sales CAGR of 11.4%
Operating income increased by 524% and operating margin expanded by 645 bps
41.7% CAGR
Financial overview
David GraceChief Financial Officer
22
23
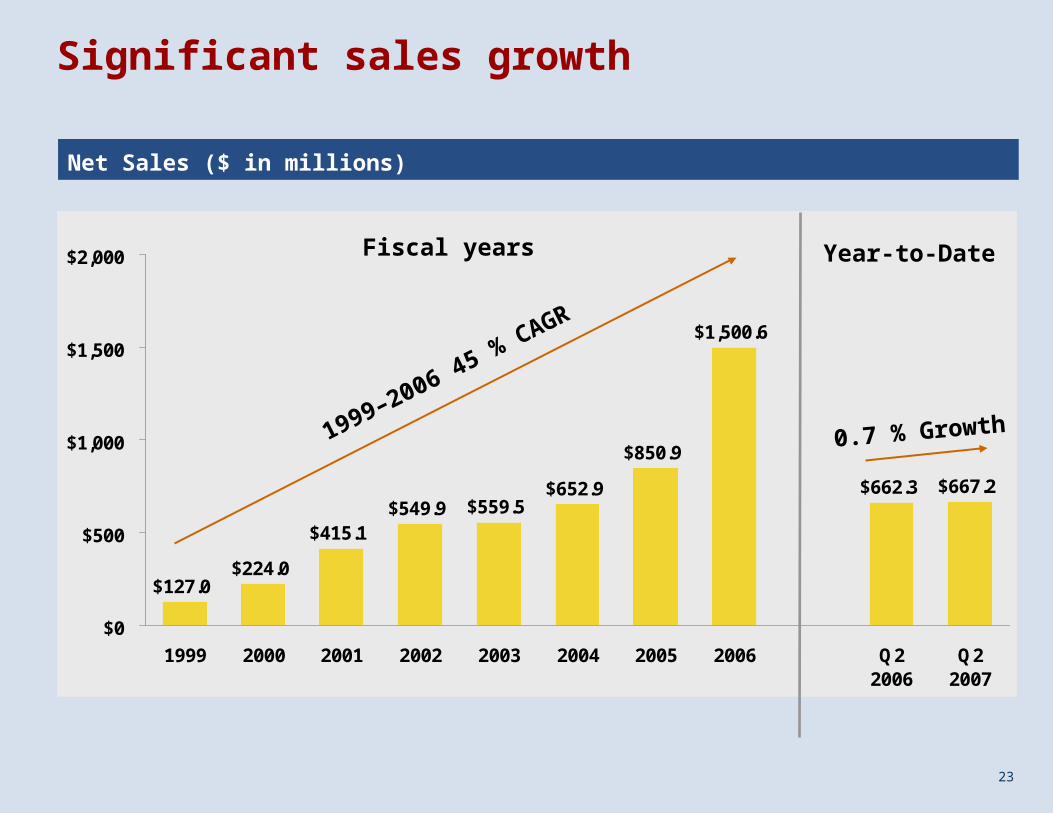
Significant sales growth
Net Sales ($ in millions)
$127.0$224.0
$415.1$549.9 $559.5
$652.9
$1,500.6
$662.3 $667.2
$850.9
$0
$500
$1,000
$1,500
$2,000
1999 2000 2001 2002 2003 2004 2005 2006 Q22006
Q22007
1999–2006 45 % CAGR
0.7 % Growth
Fiscal years Year-to-Date
24
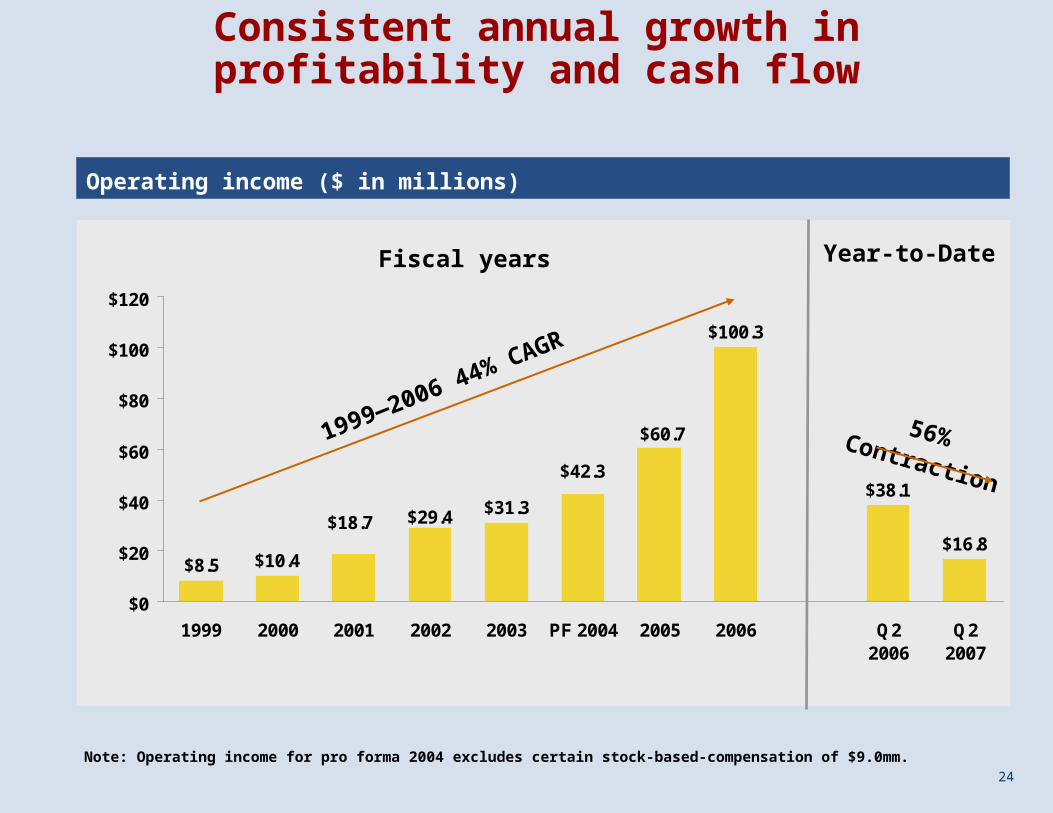
$8.5 $10.4
$31.3
$100.3
$38.1
$16.8
$29.4
$60.7
$42.3
$18.7
$0
$20
$40
$60
$80
$100
$120
1999 2000 2001 2002 2003 PF 2004 2005 2006 Q22006
Q22007
Consistent annual growth in profitability and cash flow
Operating income ($ in millions)
1999—2006 44% CAGR
Note: Operating income for pro forma 2004 excludes certain stock-based-compensation of $9.0mm.
Fiscal years
56% Contraction
Year-to-Date
25
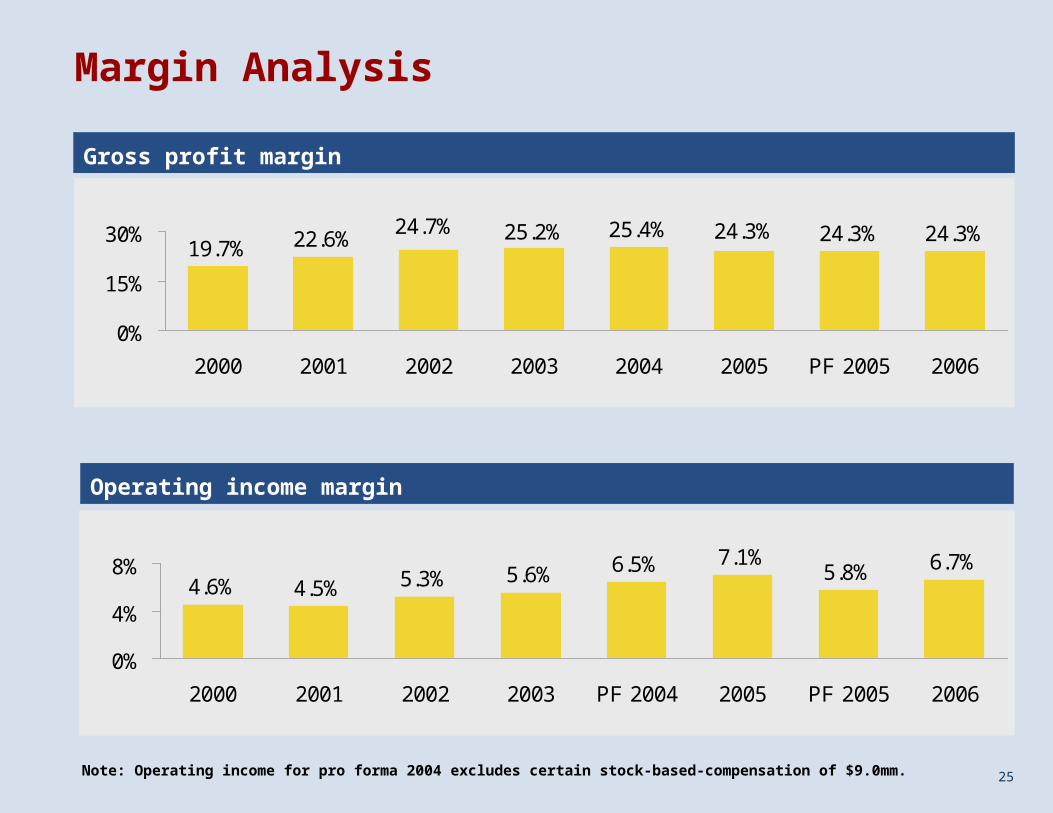
19.7% 22.6% 25.4% 24.3%25.2% 24.3%24.3%24.7%
0%
15%
30%
2000 2001 2002 2003 2004 2005 PF 2005 2006
Margin Analysis
Gross profit margin
4.6% 4.5% 5.3% 5.6% 6.5% 7.1%5.8% 6.7%
0%
4%
8%
2000 2001 2002 2003 PF 2004 2005 PF 2005 2006
Operating income margin
Note: Operating income for pro forma 2004 excludes certain stock-based-compensation of $9.0mm.
26
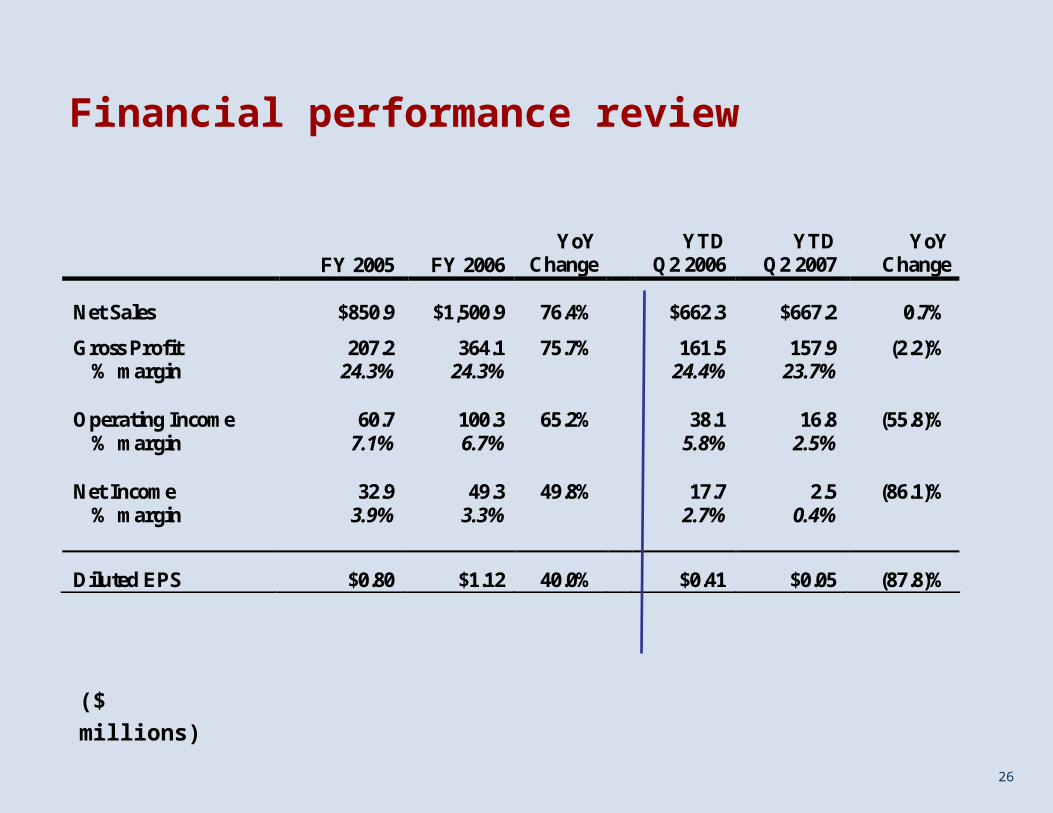
Financial performance review
($ millions)
FY 2005 FY 2006
YoY Change
YTD Q2 2006
YTD Q2 2007
YoY Change
Net Sales $850.9 $1,500.9 76.4% $662.3 $667.2 0.7%
Gross Profit 207.2 364.1 75.7% 161.5 157.9 (2.2)% % margin 24.3% 24.3% 24.4% 23.7%
Operating Income 60.7 100.3 65.2% 38.1 16.8 (55.8)% % margin 7.1% 6.7% 5.8% 2.5%
Net Income 32.9 49.3 49.8% 17.7 2.5 (86.1)% % margin 3.9% 3.3% 2.7% 0.4%
Diluted EPS $0.80 $1.12 40.0% $0.41 $0.05 (87.8)%
27
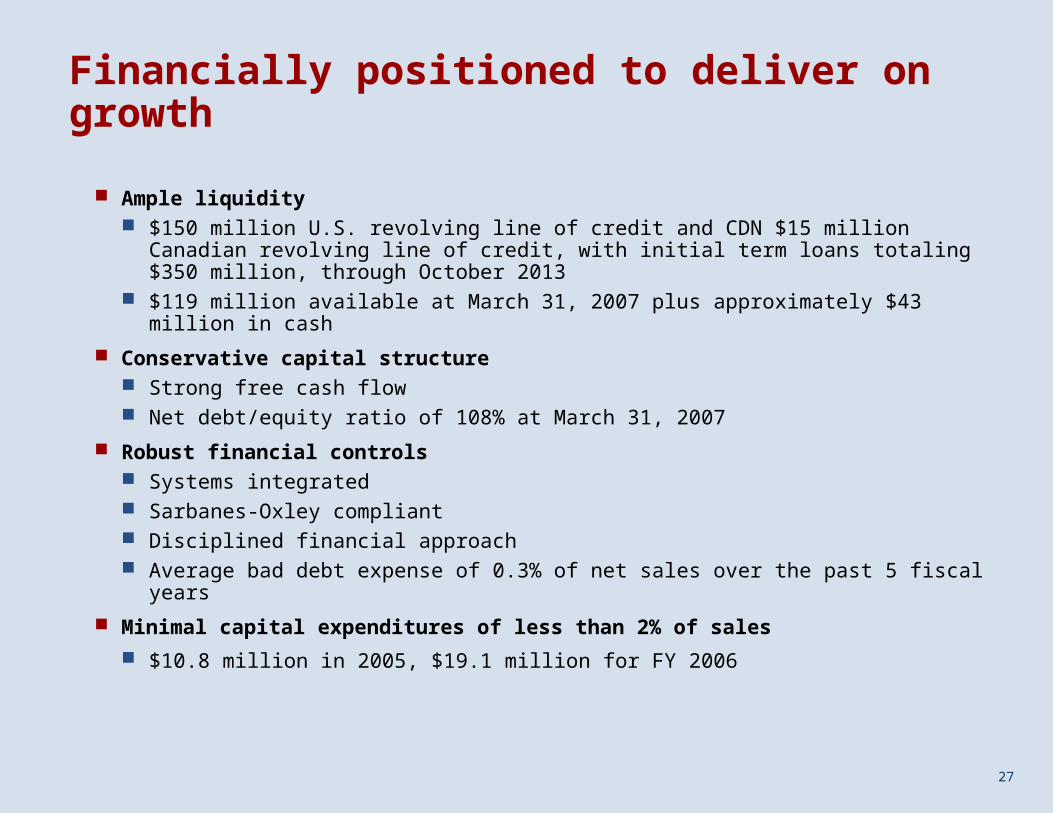
Financially positioned to deliver on growth
Ample liquidity $150 million U.S. revolving line of credit and CDN $15 million Canadian revolving line
of credit, with initial term loans totaling $350 million, through October 2013 $119 million available at March 31, 2007 plus approximately $43 million in cash
Conservative capital structure Strong free cash flow Net debt/equity ratio of 108% at March 31, 2007
Robust financial controls Systems integrated Sarbanes-Oxley compliant Disciplined financial approach Average bad debt expense of 0.3% of net sales over the past 5 fiscal years
Minimal capital expenditures of less than 2% of sales
$10.8 million in 2005, $19.1 million for FY 2006
28
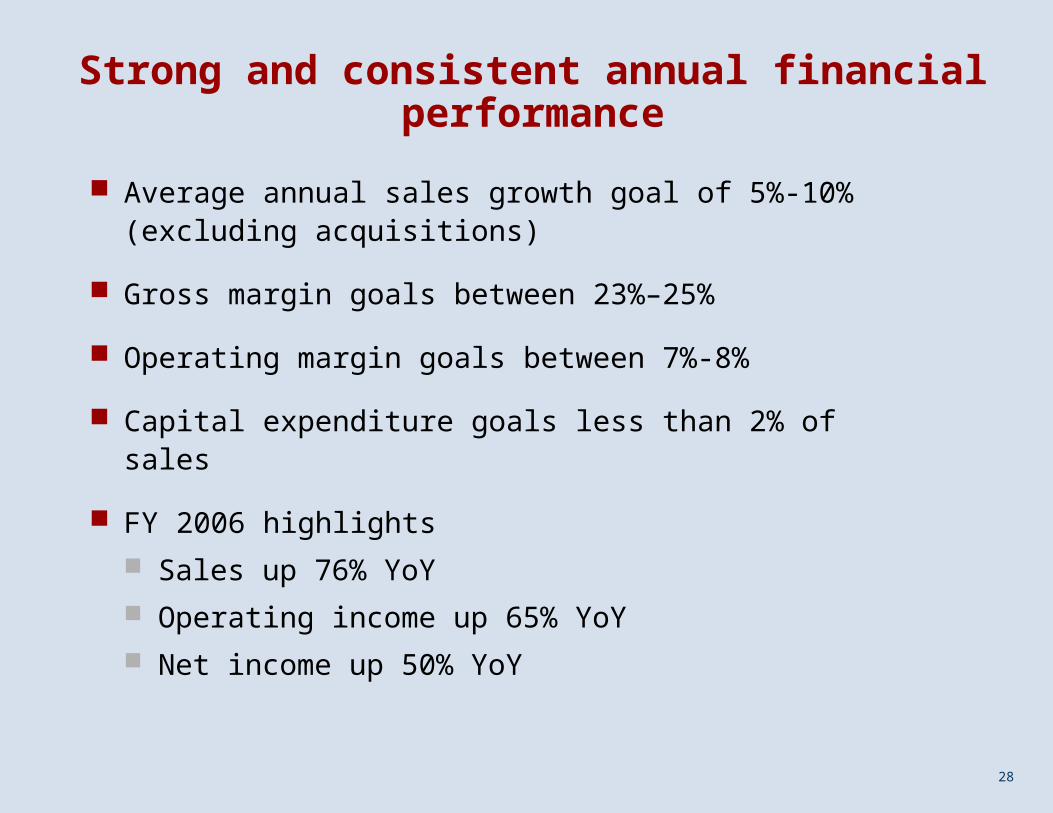
Strong and consistent annual financial performance
Average annual sales growth goal of 5%-10% (excluding acquisitions)
Gross margin goals between 23%–25%
Operating margin goals between 7%-8%
Capital expenditure goals less than 2% of sales
FY 2006 highlights
Sales up 76% YoY
Operating income up 65% YoY
Net income up 50% YoY
29
Company of substance
Culture
Forecasting &
Accountability
Excellent
Track Record
Routines
Benchmarking
Fundamentals
Recommended