
Investor PresentationQ4 2017
2
CAUTION CONCERNING FORWARD-LOOKING STATEMENTS
2
This presentation contains forward‐looking statements regarding, among other things, Desjardins Group’s business objectives and priorities, financial targets and maturity profile. Such statements are typically identified by words or phrases such as “believe”, “expect”, “anticipate”, “intend”, “estimate”, “plan” and “may”, words and expressions of similar import, and future and conditional verbs.
By their very nature, such statements involve assumptions, uncertainties and inherent risks, both general and specific. It is therefore possible that, due to many factors, these forward‐looking statements may not materialize or may prove to be inaccurate and that actual results differ materially. Desjardins Group cautions readers against placing undue reliance on these forward‐looking statements since actual results, conditions, actions and future events could differ significantly from those anticipated.
A number of factors, many of which are beyond Desjardins Group’s control and the effects of which can be difficult to predict, could influence the accuracy of the forward‐looking statements in this presentation. These factors include: credit, market, liquidity, operational, insurance, strategic, and reputation risks; regulatory and legal environment risk; environmental risk; risk related to pension plans; technological advancement and regulatory developments; cybersecurity; household indebtedness; real estate market trends; geopolitical risks; communication and information; general economic and business conditions in regions in which Desjardins Group operates; changes in the economic and financial environment in Quebec, Canada and globally; monetary policies; the accuracy and completeness of information concerning clients and counterparties; the critical accounting estimates and accounting standards applied by Desjardins Group; new products and services to maintain or increase Desjardins Group’s market share; the ability to recruit and retain key management personnel, including senior management; geographic concentration; acquisitions and joint arrangements; credit ratings; amendments to tax laws; unexpected changes in consumer spending and saving habits; the ability to implement Desjardins Group’s disaster recovery plan within a reasonable time; the potential impact of international conflicts or natural disasters; and Desjardins Group’s ability to anticipate and properly manage the risks associated with these factors.
It is important to note that the above list of factors that could influence future results is not exhaustive. Other factors could have an adverse effect on Desjardins Group’s results. Additional information about these and other factors is found in the “Risk management” sections of Desjardins Group’s most recently published annual and quarterly MD&As.
Any forward‐looking statements contained in this presentation represent the views of management only as at the date hereof, and are presented for the purpose of assisting readers in understanding and interpreting Desjardins Group’s balance sheet as at the dates indicated or its results for the periods then ended, as well as its business objectives and priorities. These statements may not be appropriate for other purposes. Desjardins Group does not undertake to update any oral or written forward‐looking statements that could be made from time to time by or on behalf of Desjardins Group, except as required under applicable securities legislation.
3
3
About Us 4
Financial Results 7
Balance Sheet Quality 11
Capital and FundingStrategies 15
Contact Information 26
4
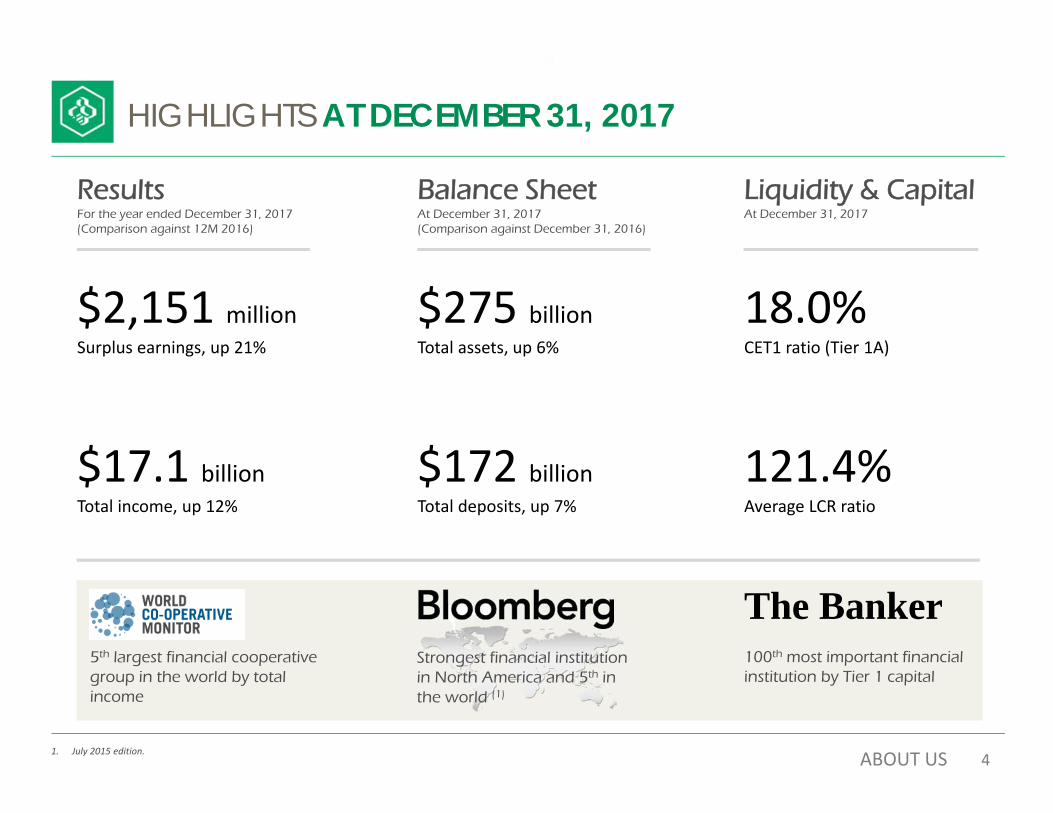
5th largest financial cooperative group in the world by total income
HIGHLIGHTS AT DECEMBER 31, 2017
41. July 2015 edition. ABOUT US
ResultsFor the year ended December 31, 2017(Comparison against 12M 2016)
Balance SheetAt December 31, 2017(Comparison against December 31, 2016)
Liquidity & CapitalAt December 31, 2017
The Banker 100th most important financial institution by Tier 1 capital
$275 billionTotal assets, up 6%
$172 billionTotal deposits, up 7%
18.0%CET1 ratio (Tier 1A)
121.4%Average LCR ratio
$2,151 millionSurplus earnings, up 21%
$17.1 billionTotal income, up 12%
Strongest financial institution in North America and 5th in the world (1)
5
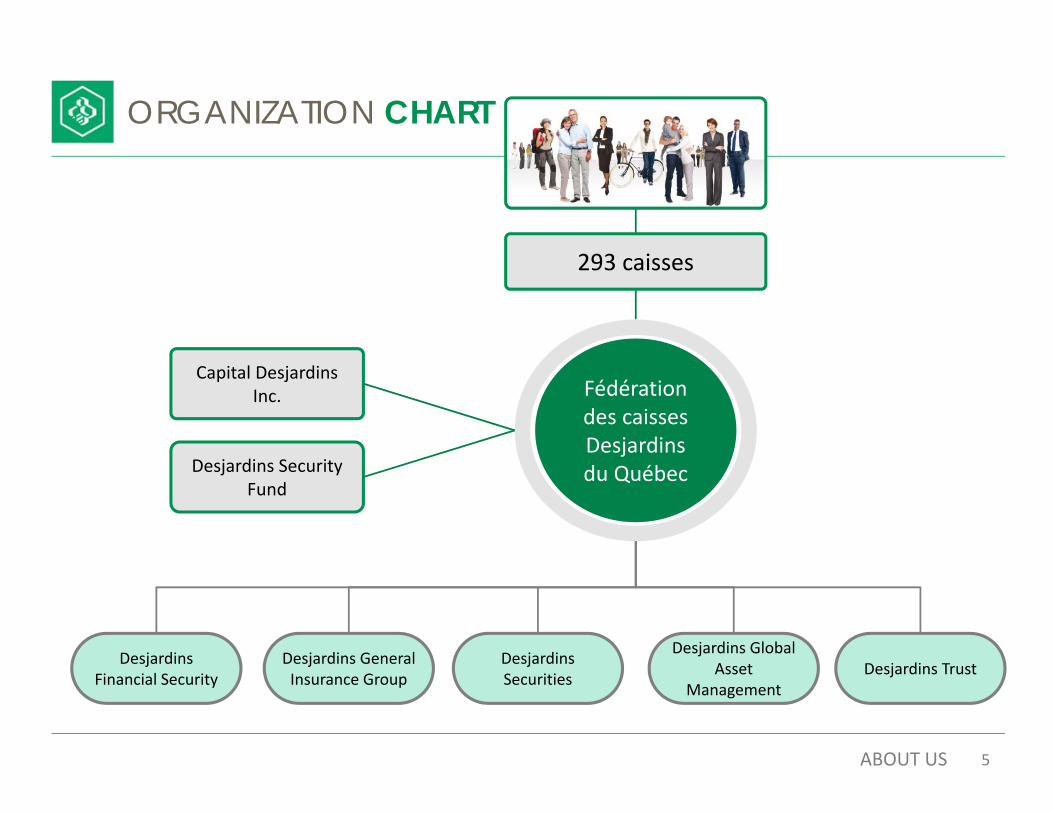
ORGANIZATION CHART
5
293 caisses
Fédération des caisses Desjardins du Québec
Capital Desjardins Inc.
Desjardins Security Fund
Desjardins Financial Security
Desjardins General Insurance Group
Desjardins Securities
Desjardins Global Asset
ManagementDesjardins Trust
ABOUT US

6
47 full‐service branches No. 7 fixed income group in Canada
#2 insurer in Quebec
#5 insurer in Canada Extensive range of products Offices across Canada
MARKET LEADERSHIP
Source: Data at December 31, 2017; Market shares in Quebec: Desjardins Economic Studies; Life & Health Insurance: Canadian Life Insurers’ Annual Reports and Autorité des marchés financiers’ 2016 Annual Report on Financial Institutions; General Insurance: 2016 MSA Market Share Report; Desjardins Securities, fixed‐income group: Market Trade Reporting System.
#1 in direct distribution in Quebec#2 insurer in Quebec#3 insurer in Canada
6
Commercial & industrial
loans
Consumer credit
Residential mortgages
Farm loans
Personal savings
19.7%
22.4%
36.1%
39.3%
41.6%
LEADING MARKET SHARES IN QUEBEC
LIFE & HEALTH
GENERAL
ABOUT US
7
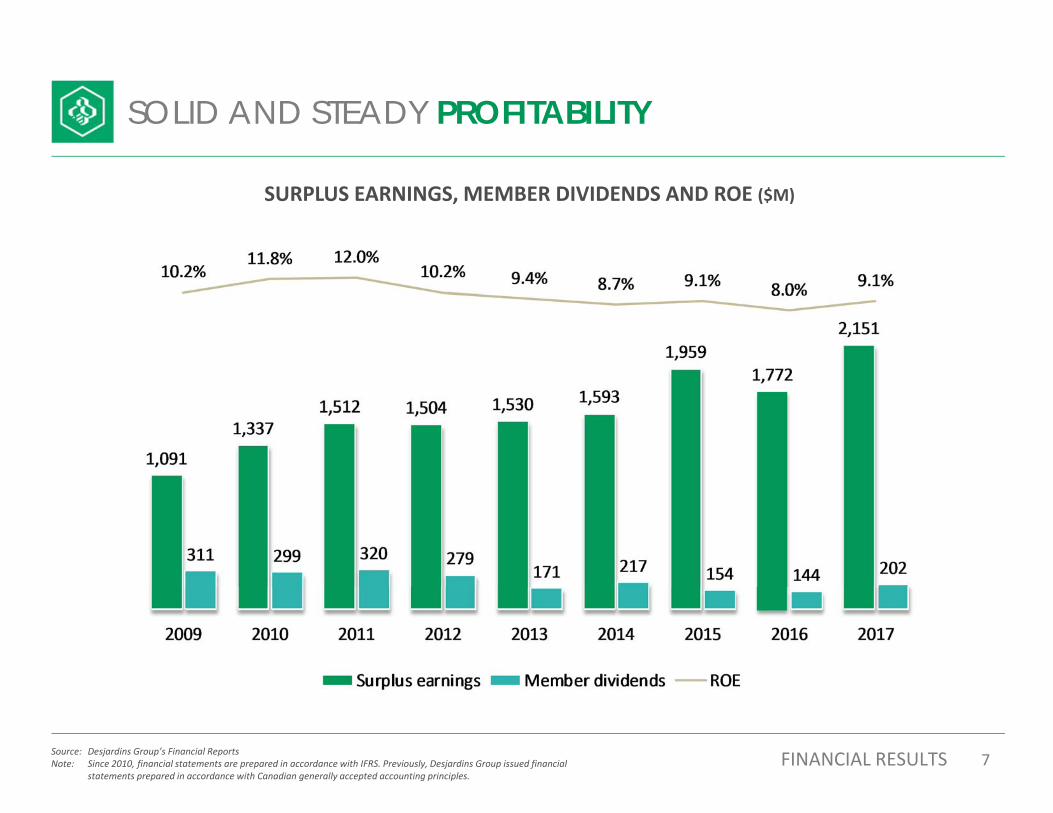
SOLID AND STEADY PROFITABILITY
7
SURPLUS EARNINGS, MEMBER DIVIDENDS AND ROE ($M)
Source: Desjardins Group’s Financial ReportsNote: Since 2010, financial statements are prepared in accordance with IFRS. Previously, Desjardins Group issued financial
statements prepared in accordance with Canadian generally accepted accounting principles.FINANCIAL RESULTS
8
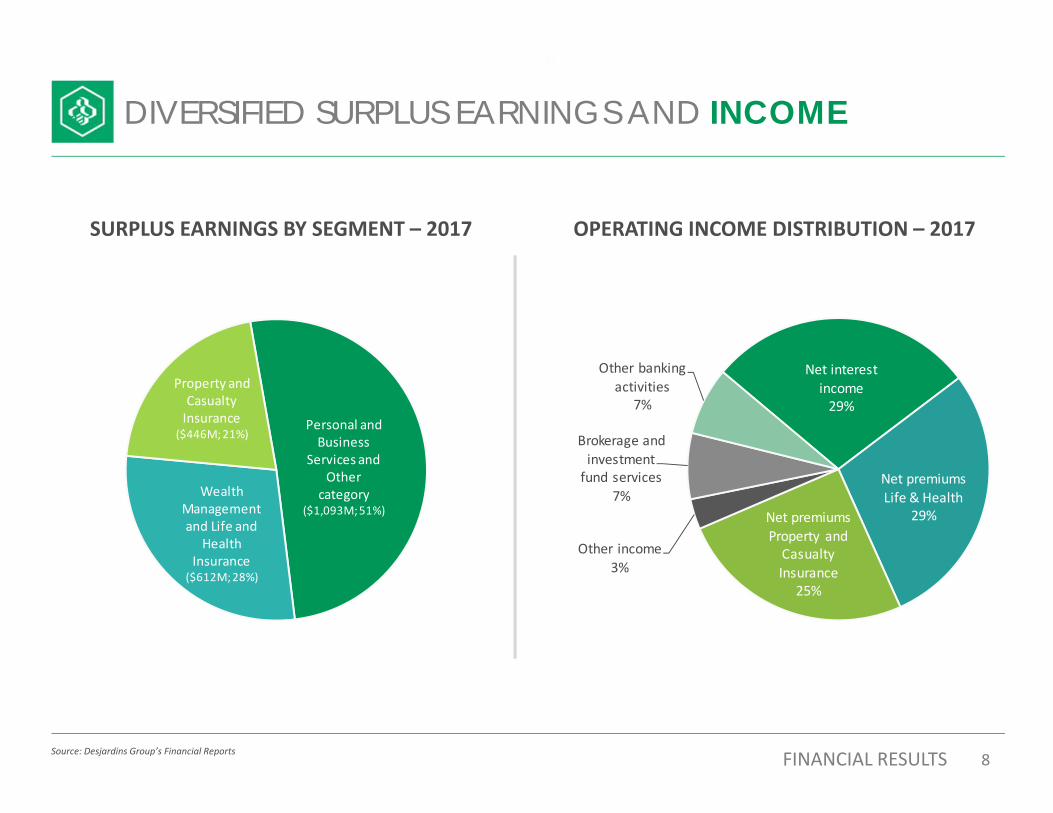
DIVERSIFIED SURPLUS EARNINGS AND INCOME
8Source: Desjardins Group’s Financial Reports FINANCIAL RESULTS
SURPLUS EARNINGS BY SEGMENT – 2017 OPERATING INCOME DISTRIBUTION – 2017
Net interest income29%
Net premiumsLife & Health
29%Net premiumsProperty and Casualty Insurance
25%
Other income3%
Brokerage and investment fund services
7%
Other banking activities
7%Personal and Business
Services and Other
category($1,093M; 51%)
Wealth Management and Life and
Health Insurance
($612M; 28%)
Property and Casualty Insurance
($446M; 21%)
9
9
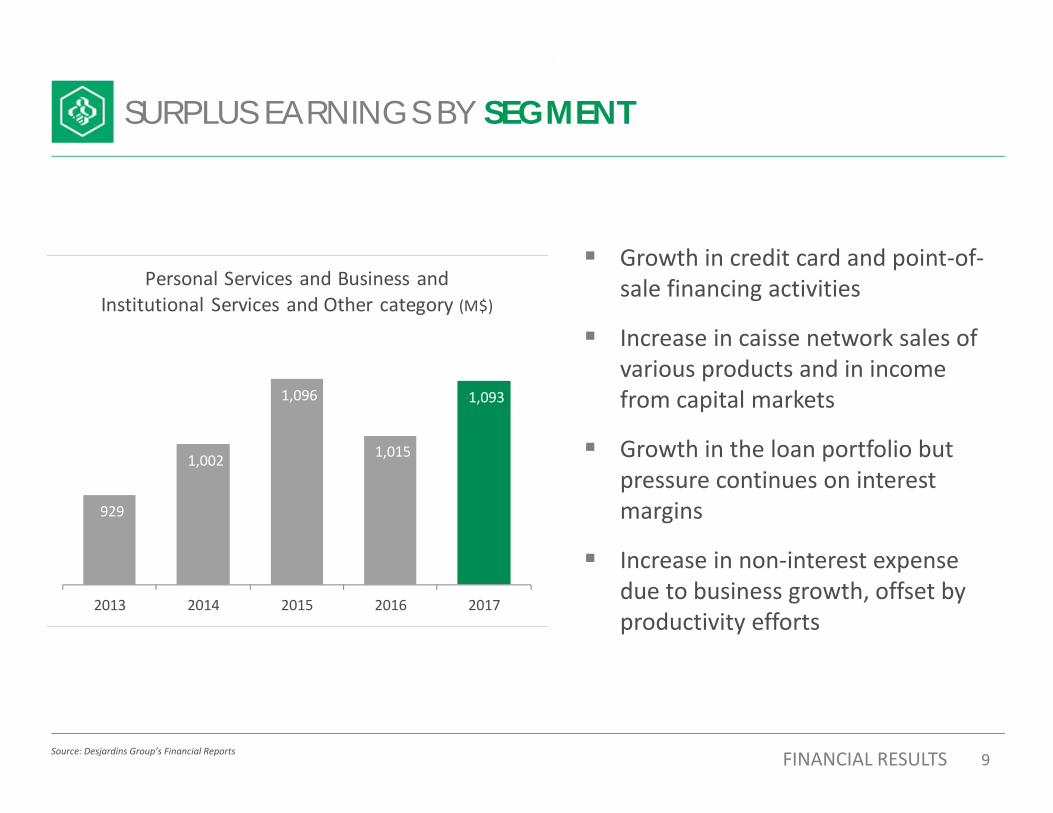
SURPLUS EARNINGS BY SEGMENT
Source: Desjardins Group’s Financial Reports
Growth in credit card and point‐of‐sale financing activities
Increase in caisse network sales of various products and in income from capital markets
Growth in the loan portfolio but pressure continues on interestmargins
Increase in non‐interest expense due to business growth, offset by productivity efforts
FINANCIAL RESULTS
929
1,002
1,096
1,015
1,093
2013 2014 2015 2016 2017
Personal Services and Business and Institutional Services and Other category (M$)
10
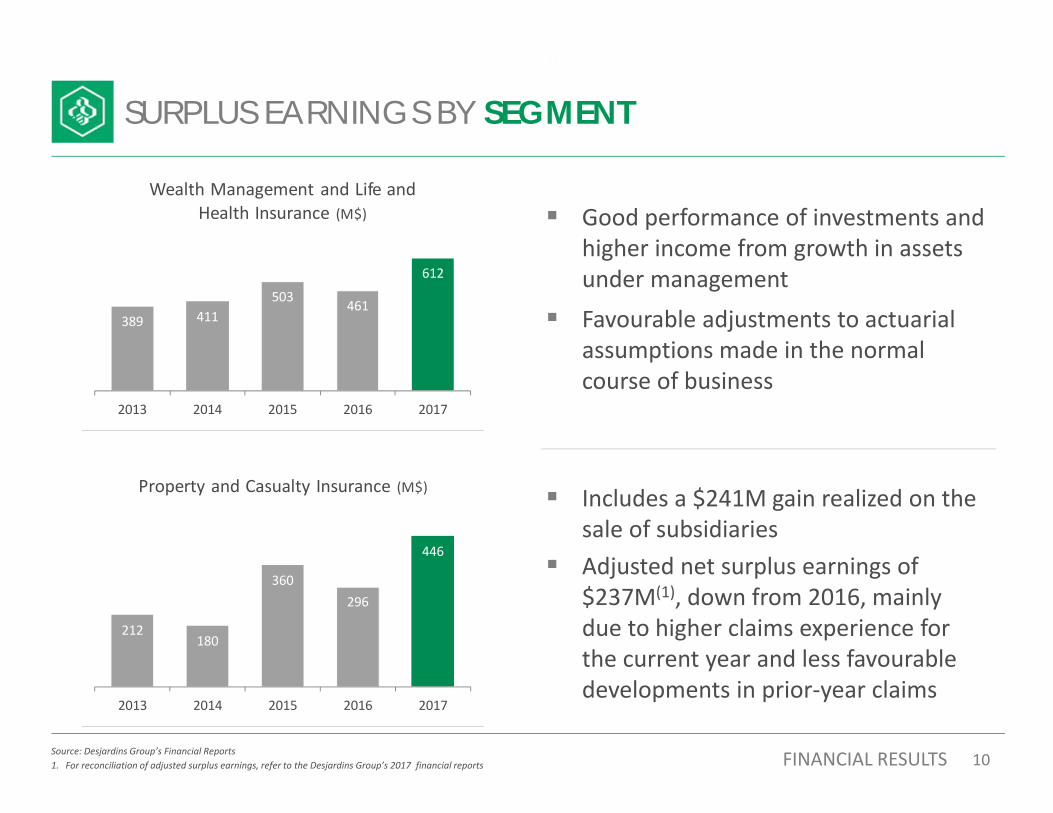
212180
360296
446
2013 2014 2015 2016 2017
Property and Casualty Insurance (M$)
10Source: Desjardins Group’s Financial Reports1. For reconciliation of adjusted surplus earnings, refer to the Desjardins Group’s 2017 financial reports
Good performance of investments and higher income from growth in assets under management
Favourable adjustments to actuarial assumptions made in the normal course of business
Includes a $241M gain realized on the sale of subsidiaries
Adjusted net surplus earnings of $237M(1), down from 2016, mainly due to higher claims experience for the current year and less favourabledevelopments in prior‐year claims
389 411503 461
612
2013 2014 2015 2016 2017
Wealth Management and Life and Health Insurance (M$)
FINANCIAL RESULTS
SURPLUS EARNINGS BY SEGMENT
11
11
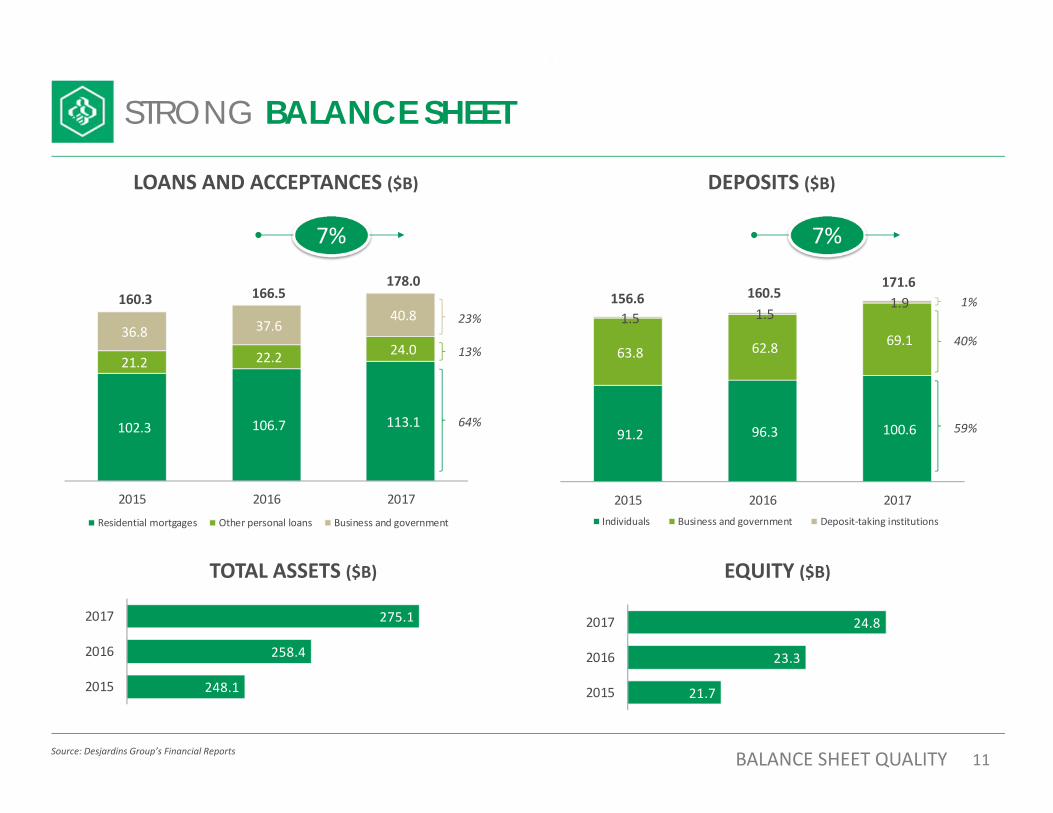
STRONG BALANCE SHEET
Source: Desjardins Group’s Financial Reports
102.3 106.7 113.1
21.2 22.2 24.0 36.8 37.6
40.8 160.3 166.5
178.0
2015 2016 2017
Residential mortgages Other personal loans Business and government
91.2 96.3 100.6
63.8 62.8 69.1 1.5 1.5
1.9 156.6 160.5 171.6
2015 2016 2017Individuals Business and government Deposit‐taking institutions
7%
LOANS AND ACCEPTANCES ($B) DEPOSITS ($B)
248.1
258.4
275.1
2015
2016
2017
21.7
23.3
24.8
2015
2016
2017
TOTAL ASSETS ($B) EQUITY ($B)
64%
13%
23%
7%
59%
40%
1%
BALANCE SHEET QUALITY
12
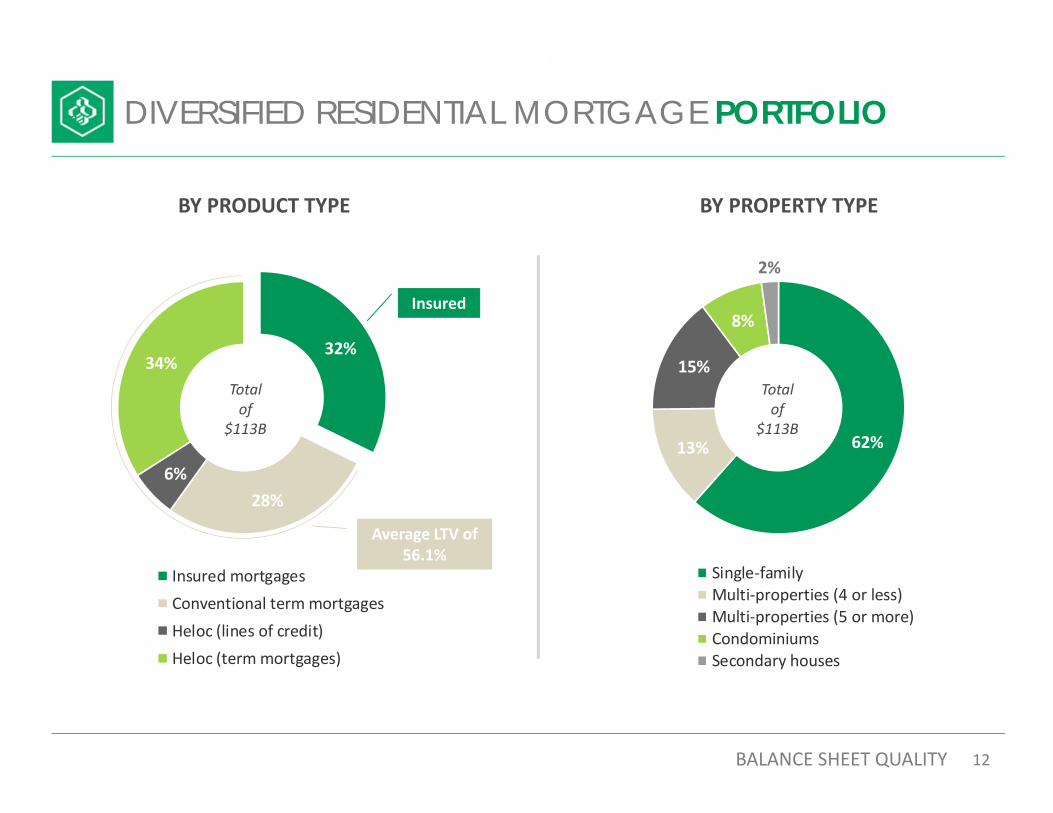
32%
28%6%
34%
Insured mortgagesConventional term mortgagesHeloc (lines of credit)Heloc (term mortgages)
DIVERSIFIED RESIDENTIAL MORTGAGE PORTFOLIO
12BALANCE SHEET QUALITY
Average LTV of 56.1%
Total of
$113B$105B
Insured
BY PRODUCT TYPE BY PROPERTY TYPE
62%13%
15%
8%
2%
Single‐familyMulti‐properties (4 or less)Multi‐properties (5 or more)CondominiumsSecondary houses
Total of
$113B
13
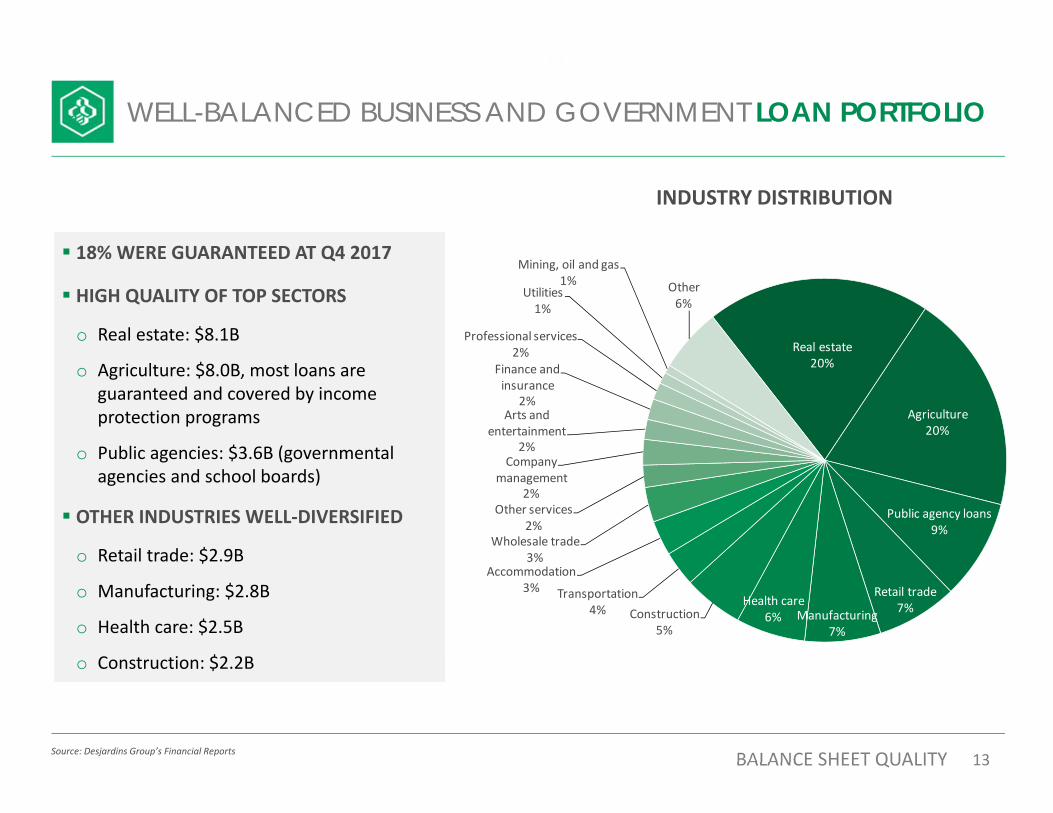
18% WERE GUARANTEED AT Q4 2017
HIGH QUALITY OF TOP SECTORS
o Real estate: $8.1B
o Agriculture: $8.0B, most loans are guaranteed and covered by income protection programs
o Public agencies: $3.6B (governmental agencies and school boards)
OTHER INDUSTRIES WELL‐DIVERSIFIED
o Retail trade: $2.9B
o Manufacturing: $2.8B
o Health care: $2.5B
o Construction: $2.2B
WELL-BALANCED BUSINESS AND GOVERNMENT LOAN PORTFOLIO
13
INDUSTRY DISTRIBUTION
Real estate20%
Agriculture20%
Public agency loans9%
Retail trade7%Manufacturing
7%
Health care6%Construction
5%
Transportation4%
Accommodation3%
Wholesale trade3%
Other services2%
Company management
2%
Arts and entertainment
2%
Finance and insurance
2%
Professional services2%
Utilities1%
Mining, oil and gas 1% Other
6%
BALANCE SHEET QUALITYSource: Desjardins Group’s Financial Reports
14
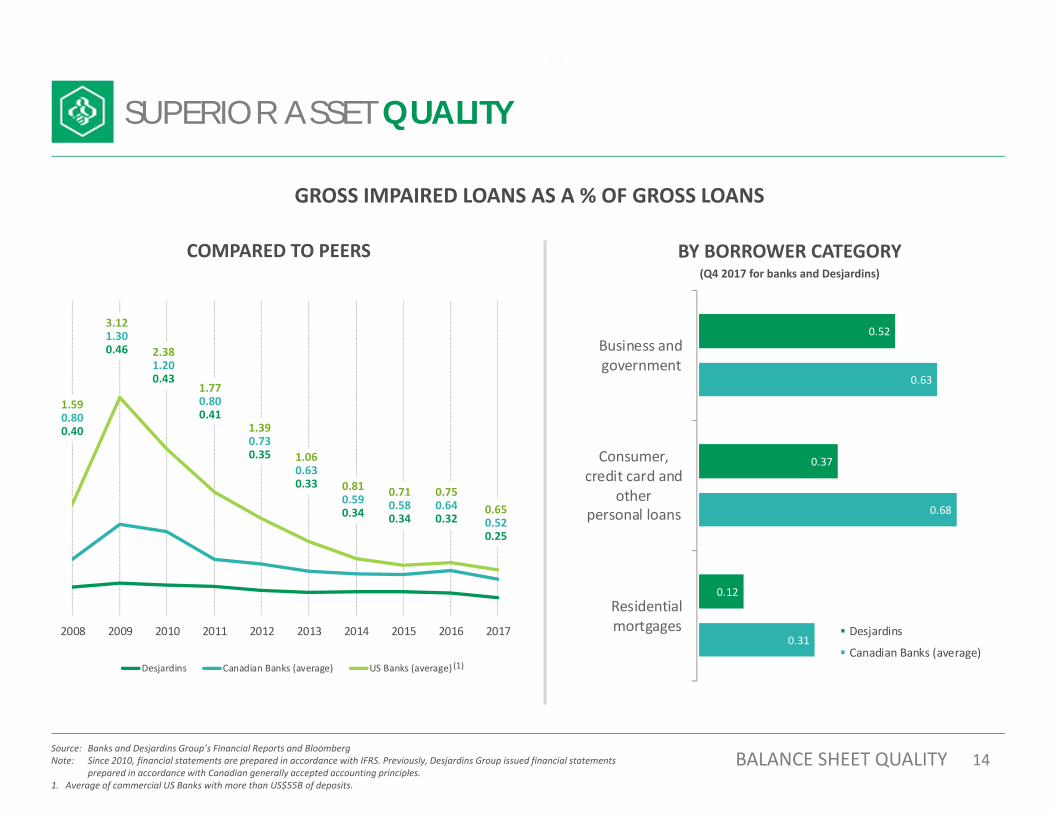
2008 2009 2010 2011 2012 2013 2014 2015 2016 2017
Desjardins Canadian Banks (average) US Banks (average)
14Source: Banks and Desjardins Group’s Financial Reports and BloombergNote: Since 2010, financial statements are prepared in accordance with IFRS. Previously, Desjardins Group issued financial statements
prepared in accordance with Canadian generally accepted accounting principles. 1. Average of commercial US Banks with more than US$55B of deposits.
GROSS IMPAIRED LOANS AS A % OF GROSS LOANS
SUPERIOR ASSET QUALITY
0.31
0.68
0.63
0.12
0.37
0.52
Residentialmortgages
Consumer,credit card and
otherpersonal loans
Business andgovernment
Desjardins
Canadian Banks (average)
BY BORROWER CATEGORY(Q4 2017 for banks and Desjardins)
(1)
COMPARED TO PEERS
1.590.800.40
3.121.300.46 2.38
1.200.43
1.770.800.41
1.390.730.35 1.06
0.630.33 0.81
0.590.34
0.710.580.34
0.750.640.32
0.650.520.25
BALANCE SHEET QUALITY
15
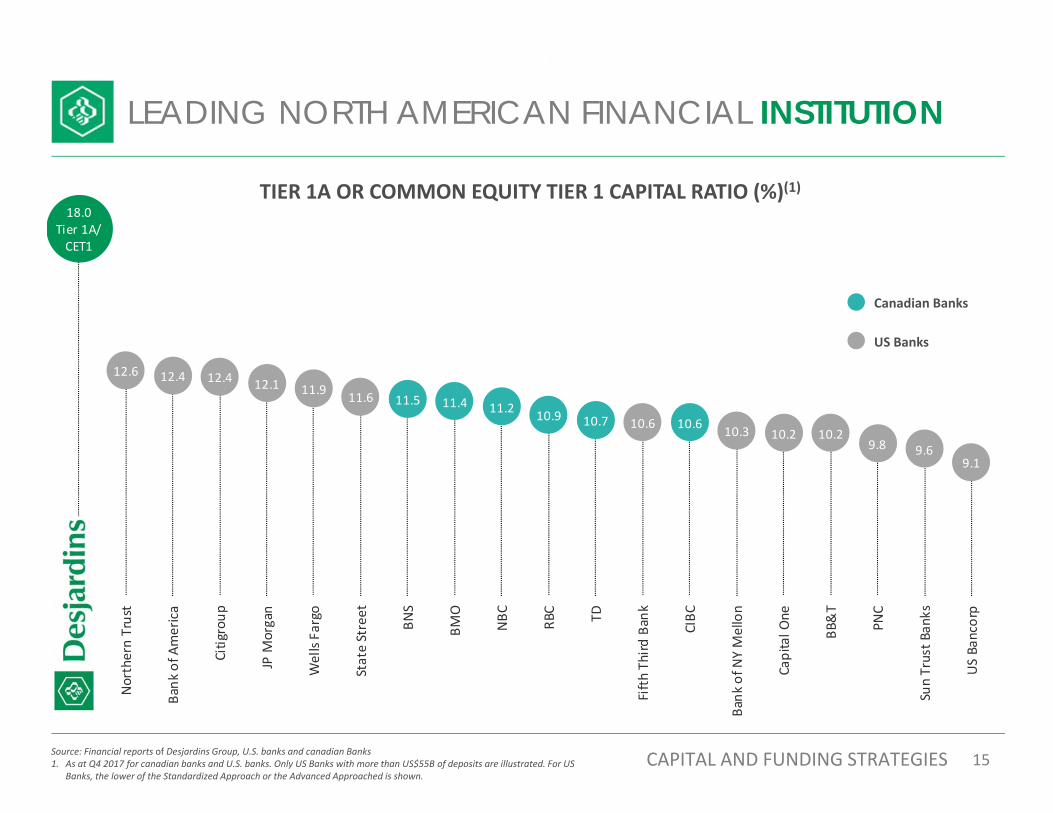
18.0Tier 1A/CET1
12.6 12.4 12.4 12.1 11.9 11.6 11.5 11.4 11.2 10.9 10.7 10.6 10.6 10.3 10.2 10.29.8 9.6
9.1
DESJARD
INS
Northern Trust
Bank
of A
merica
Citigroup
JP M
organ
Wells Fargo
State Street
BNS
BMO
NBC RBC TD
Fifth Third
Bank
CIBC
Bank
of N
Y Mellon
Capital O
ne
BB&T
PNC
Sun Trust B
anks
US Bancorp
LEADING NORTH AMERICAN FINANCIAL INSTITUTION
15
Canadian Banks
US Banks
TIER 1A OR COMMON EQUITY TIER 1 CAPITAL RATIO (%)(1)
Source: Financial reports of Desjardins Group, U.S. banks and canadian Banks1. As at Q4 2017 for canadian banks and U.S. banks. Only US Banks with more than US$55B of deposits are illustrated. For US
Banks, the lower of the Standardized Approach or the Advanced Approached is shown.CAPITAL AND FUNDING STRATEGIES
16
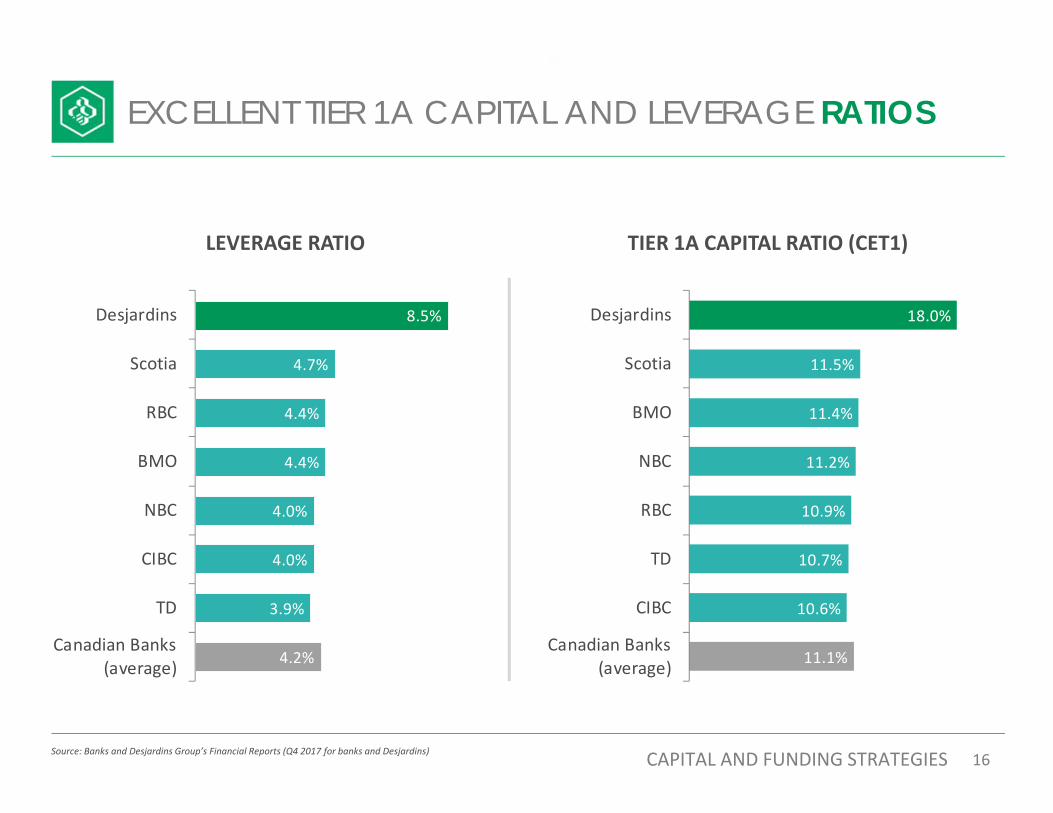
EXCELLENT TIER 1A CAPITAL AND LEVERAGE RATIOS
LEVERAGE RATIO TIER 1A CAPITAL RATIO (CET1)
16
4.2%
3.9%
4.0%
4.0%
4.4%
4.4%
4.7%
8.5%
Canadian Banks (average)
TD
CIBC
NBC
BMO
RBC
Scotia
Desjardins
11.1%
10.6%
10.7%
10.9%
11.2%
11.4%
11.5%
18.0%
Canadian Banks (average)
CIBC
TD
RBC
NBC
BMO
Scotia
Desjardins
Source: Banks and Desjardins Group’s Financial Reports (Q4 2017 for banks and Desjardins) CAPITAL AND FUNDING STRATEGIES
17
20,985 20,998 21,436
4,518
794
18,043
1,032 2,370 594
Federationcapitalshares
Capitalinstrumentssubject tophase out
Reserves andundistributed
surplusearnings
OtherTier 1A
TotalTier 1Acapital
TotalTier 1capital
Senior notessubject tophase outTier 2
OtherTier 2capital
Totalcapital
CAPITAL MANAGEMENT
17
TIER 1A (CET1) CAPITAL
Tier 1 ratio18.0%
Total ratio18.4%
REGULATORY CAPITAL COMPOSITION ($M)
Source: Desjardins Group’s Financial Reports CAPITAL AND FUNDING STRATEGIES
TIER 1 CAPITAL
TOTAL CAPITAL
Tier 1A ratio18.0%
18
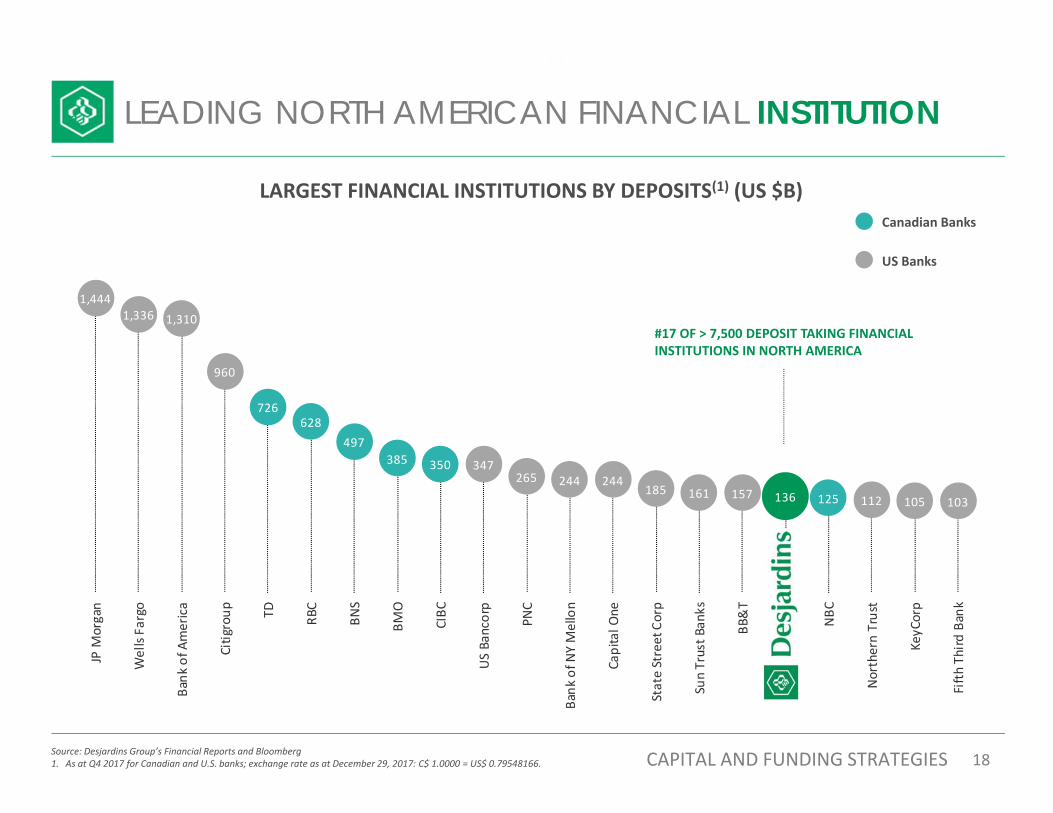
1,4441,336 1,310
960
726628
497385 350 347
265 244 244185 161 157 136 125 112 105 103
JP M
organ
Wells Fargo
Bank
of A
merica
Citigroup TD RBC
BNS
BMO
CIBC
US Bancorp
PNC
Bank
of N
Y Mellon
Capital O
ne
State Street Corp
Sun Trust B
anks
BB&T
DESJARD
INS
NBC
Northern Trust
KeyCorp
Fifth Third
Bank
LARGEST FINANCIAL INSTITUTIONS BY DEPOSITS(1) (US $B)
Source: Desjardins Group’s Financial Reports and Bloomberg1. As at Q4 2017 for Canadian and U.S. banks; exchange rate as at December 29, 2017: C$ 1.0000 = US$ 0.79548166.
#17 OF > 7,500 DEPOSIT TAKING FINANCIALINSTITUTIONS IN NORTH AMERICA
LEADING NORTH AMERICAN FINANCIAL INSTITUTION
18
Canadian Banks
US Banks
CAPITAL AND FUNDING STRATEGIES
19
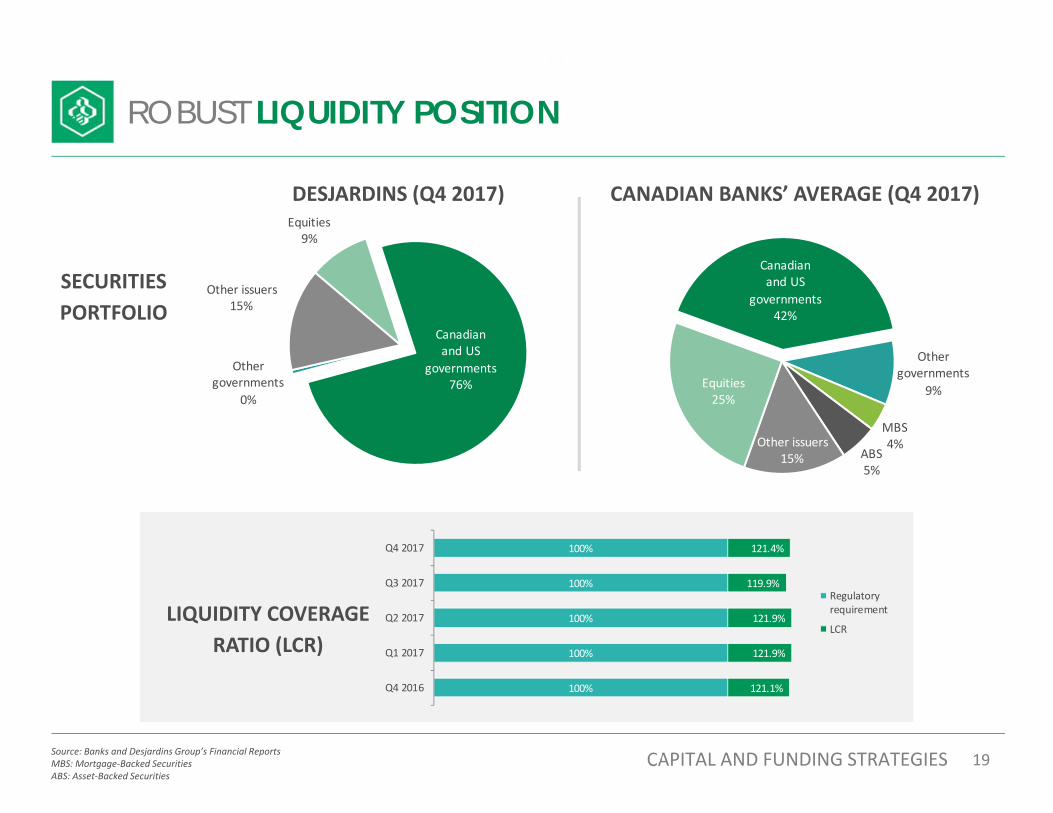
ROBUST LIQUIDITY POSITION
19
Canadian and US
governments42%
Other governments
9%
MBS4%
ABS5%
Other issuers15%
Equities25%
LIQUIDITY COVERAGE RATIO (LCR)
Canadian and US
governments76%
Other governments
0%
Other issuers15%
Equities9%
CANADIAN BANKS’ AVERAGE (Q4 2017)DESJARDINS (Q4 2017)
SECURITIES PORTFOLIO
CAPITAL AND FUNDING STRATEGIES
121.1%
121.9%
121.9%
119.9%
121.4%
100%
100%
100%
100%
100%
Q4 2016
Q1 2017
Q2 2017
Q3 2017
Q4 2017
Regulatoryrequirement
LCR
Source: Banks and Desjardins Group’s Financial Reports MBS: Mortgage‐Backed SecuritiesABS: Asset‐Backed Securities
20
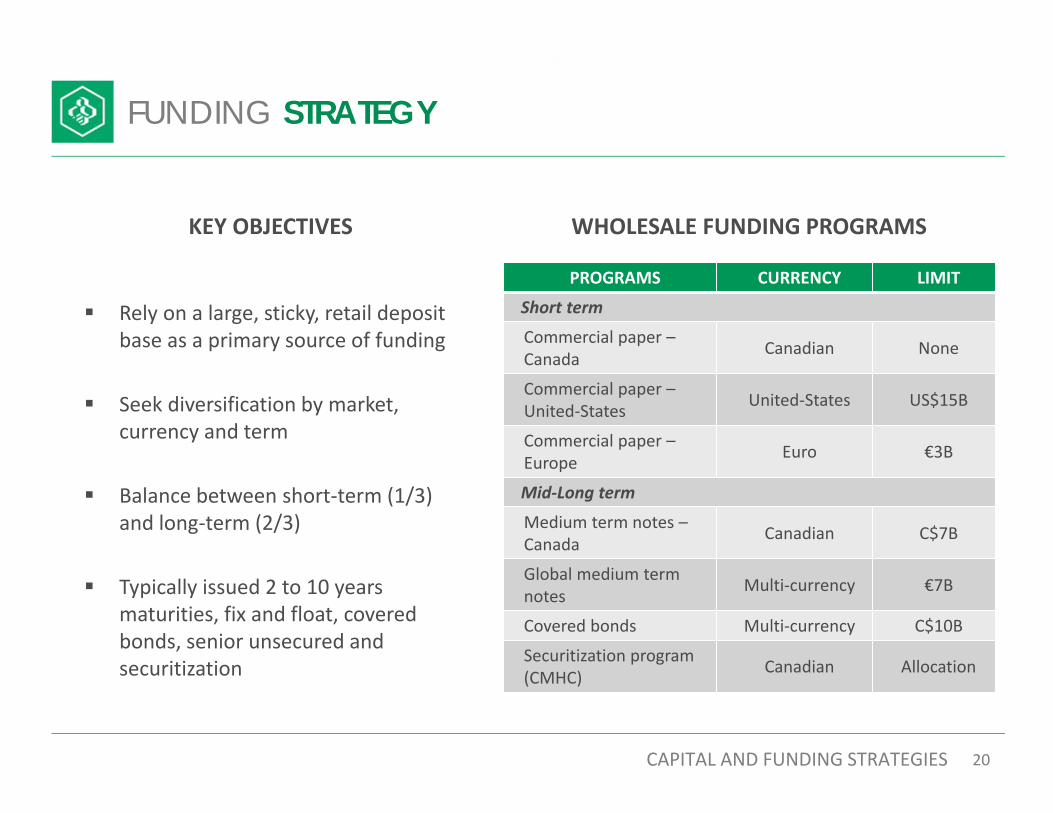
FUNDING STRATEGY
KEY OBJECTIVES
Rely on a large, sticky, retail deposit base as a primary source of funding
Seek diversification by market, currency and term
Balance between short‐term (1/3) and long‐term (2/3)
Typically issued 2 to 10 years maturities, fix and float, covered bonds, senior unsecured and securitization
WHOLESALE FUNDING PROGRAMS
20
PROGRAMS CURRENCY LIMIT
Short term
Commercial paper –Canada Canadian None
Commercial paper –United‐States United‐States US$15B
Commercial paper –Europe Euro €3B
Mid‐Long term
Medium term notes –Canada Canadian C$7B
Global medium term notes Multi‐currency €7B
Covered bonds Multi‐currency C$10B
Securitization program (CMHC) Canadian Allocation
CAPITAL AND FUNDING STRATEGIES
21
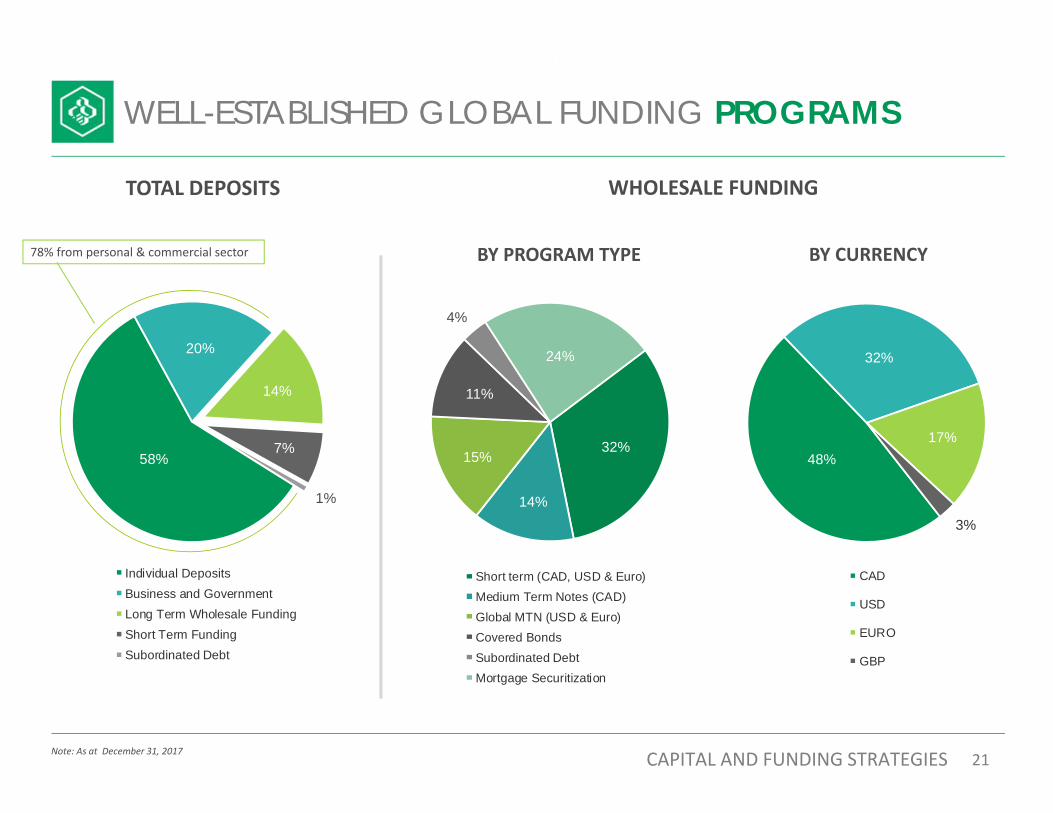
58%
20%
14%
7%
1%
Individual DepositsBusiness and GovernmentLong Term Wholesale FundingShort Term FundingSubordinated Debt
WELL-ESTABLISHED GLOBAL FUNDING PROGRAMS
78% from personal & commercial sector BY PROGRAM TYPE BY CURRENCY
21Note: As at December 31, 2017
WHOLESALE FUNDINGTOTAL DEPOSITS
CAPITAL AND FUNDING STRATEGIES
48%
32%
17%
3%
CAD
USD
EURO
GBP
32%
14%
15%
11%
4%
24%
Short term (CAD, USD & Euro)Medium Term Notes (CAD)Global MTN (USD & Euro)Covered BondsSubordinated DebtMortgage Securitization
22
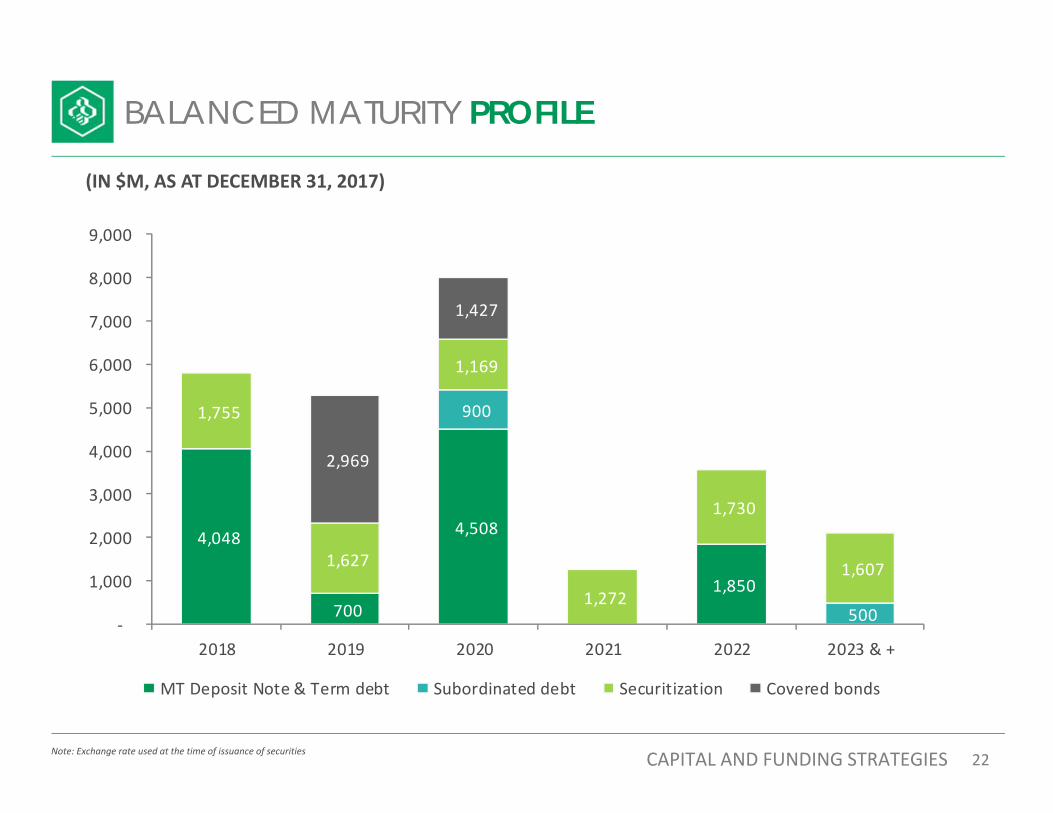
BALANCED MATURITY PROFILE
Note: Exchange rate used at the time of issuance of securities
(IN $M, AS AT DECEMBER 31, 2017)
22CAPITAL AND FUNDING STRATEGIES
4,048
700
4,508
‐
1,850
‐
900
‐ 500
1,755
1,627
1,169
1,272
1,730
1,607
2,969
1,427
‐
1,000
2,000
3,000
4,000
5,000
6,000
7,000
8,000
9,000
2018 2019 2020 2021 2022 2023 & +
MT Deposit Note & Term debt Subordinated debt Securitization Covered bonds
23
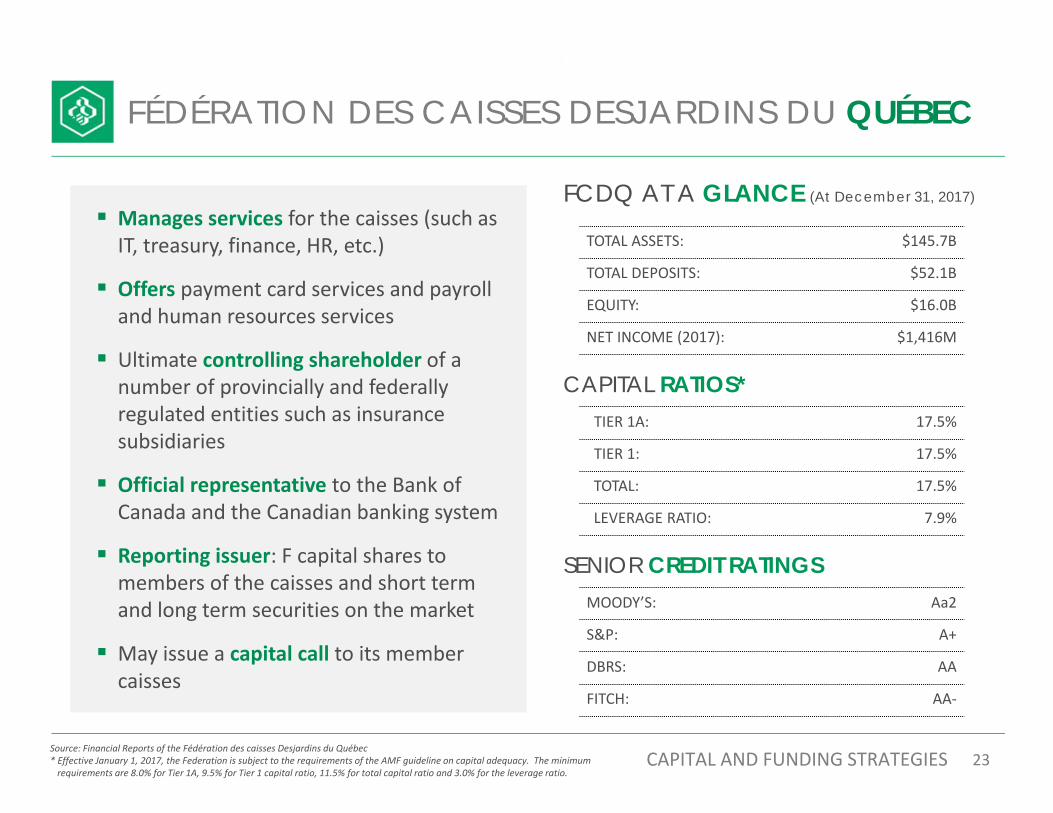
FÉDÉRATION DES CAISSES DESJARDINS DU QUÉBEC
Manages services for the caisses (such as IT, treasury, finance, HR, etc.)
Offers payment card services and payroll and human resources services
Ultimate controlling shareholder of a number of provincially and federally regulated entities such as insurance subsidiaries
Official representative to the Bank of Canada and the Canadian banking system
Reporting issuer: F capital shares to members of the caisses and short term and long term securities on the market
May issue a capital call to its member caisses
23
TOTAL ASSETS: $145.7B
TOTAL DEPOSITS: $52.1B
EQUITY: $16.0B
NET INCOME (2017): $1,416M
FCDQ AT A GLANCE (At December 31, 2017)
Source: Financial Reports of the Fédération des caisses Desjardins du Québec* Effective January 1, 2017, the Federation is subject to the requirements of the AMF guideline on capital adequacy. The minimum requirements are 8.0% for Tier 1A, 9.5% for Tier 1 capital ratio, 11.5% for total capital ratio and 3.0% for the leverage ratio.
TIER 1A: 17.5%
TIER 1: 17.5%
TOTAL: 17.5%
LEVERAGE RATIO: 7.9%
MOODY’S: Aa2
S&P: A+
DBRS: AA
FITCH: AA‐
CAPITAL RATIOS*
SENIOR CREDIT RATINGS
CAPITAL AND FUNDING STRATEGIES
24
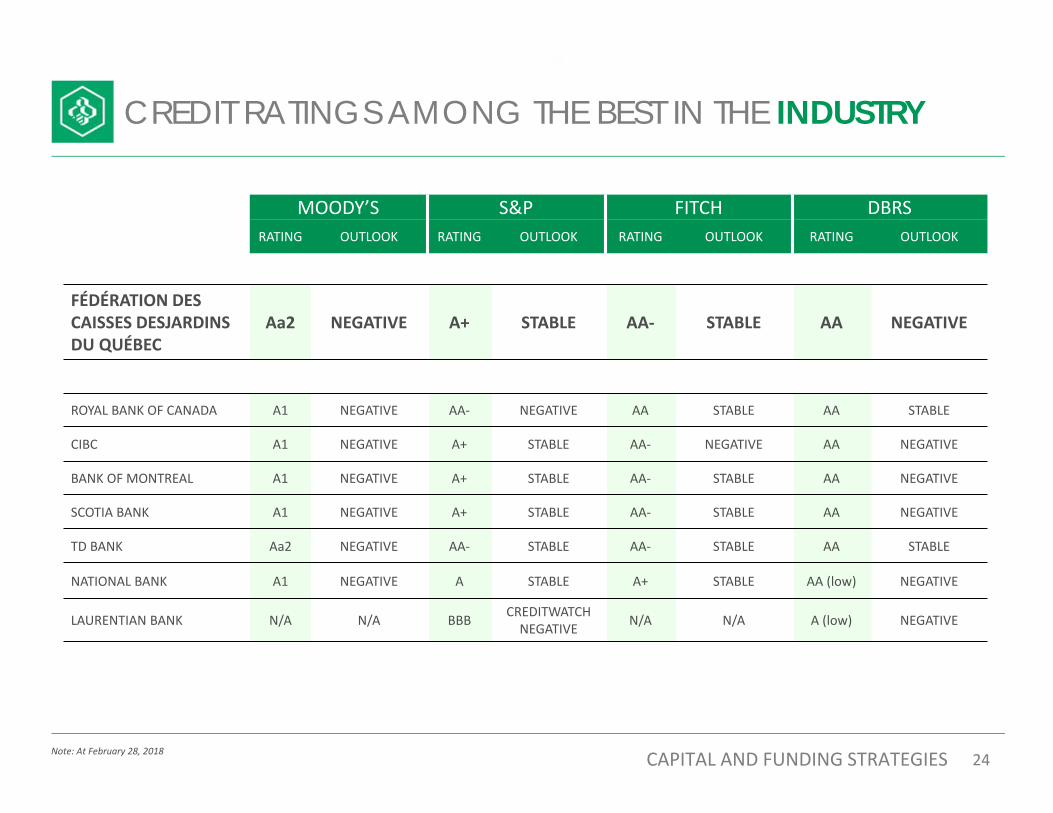
CREDIT RATINGS AMONG THE BEST IN THE INDUSTRY
MOODY’S S&P FITCH DBRSRATING OUTLOOK RATING OUTLOOK RATING OUTLOOK RATING OUTLOOK
FÉDÉRATION DES CAISSES DESJARDINS DU QUÉBEC
Aa2 NEGATIVE A+ STABLE AA‐ STABLE AA NEGATIVE
ROYAL BANK OF CANADA A1 NEGATIVE AA‐ NEGATIVE AA STABLE AA STABLE
CIBC A1 NEGATIVE A+ STABLE AA‐ NEGATIVE AA NEGATIVE
BANK OF MONTREAL A1 NEGATIVE A+ STABLE AA‐ STABLE AA NEGATIVE
SCOTIA BANK A1 NEGATIVE A+ STABLE AA‐ STABLE AA NEGATIVE
TD BANK Aa2 NEGATIVE AA‐ STABLE AA‐ STABLE AA STABLE
NATIONAL BANK A1 NEGATIVE A STABLE A+ STABLE AA (low) NEGATIVE
LAURENTIAN BANK N/A N/A BBB CREDITWATCH NEGATIVE N/A N/A A (low) NEGATIVE
24CAPITAL AND FUNDING STRATEGIESNote: At February 28, 2018
25
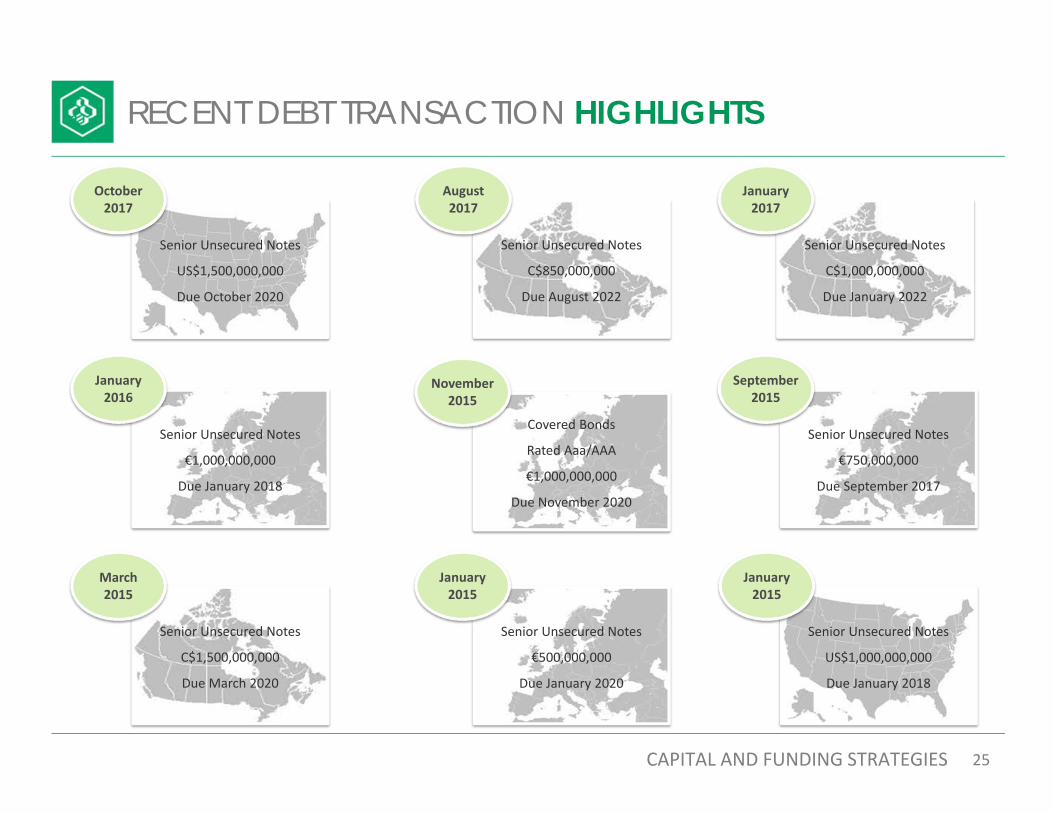
RECENT DEBT TRANSACTION HIGHLIGHTS
25
Senior Unsecured Notes
€1,000,000,000
Due January 2018
January 2016
Covered Bonds
Rated Aaa/AAA
€1,000,000,000
Due November 2020
November 2015
Senior Unsecured Notes
C$1,500,000,000
Due March 2020
March 2015
Senior Unsecured Notes
C$1,000,000,000
Due January 2022
January 2017
CAPITAL AND FUNDING STRATEGIES
Senior Unsecured Notes
€750,000,000
Due September 2017
September 2015
Senior Unsecured Notes
US$1,000,000,000
Due January 2018
January 2015
Senior Unsecured Notes
C$850,000,000
Due August 2022
August2017
Senior Unsecured Notes
US$1,500,000,000
Due October 2020
October2017
Senior Unsecured Notes
€500,000,000
Due January 2020
January 2015
26
CONTACT INFORMATION
INVESTOR RELATIONS www.desjardins.com/ca/about‐us/investor‐relations/[email protected]
26
PATRICK NADEAUHead of Investor Relations and Capital Instruments(514) 281‐8634, 1‐866‐866‐7000, ext. [email protected]
Recommended