Investor Presentation
Q2FY18
November 2017
Safe Harbor
This presentation and the accompanying slides (the “Presentation”), which have been prepared by Indo Count Industries Ltd(the “Company”), have been prepared solely for information purposes and do not constitute any offer, recommendation orinvitation to purchase or subscribe for any securities, and shall not form the basis or be relied on in connection with anycontract or binding commitment whatsoever. No offering of securities of the Company will be made except by means of astatutory offering document containing detailed information about the Company.
This Presentation has been prepared by the Company based on information and data which the Company considers reliable,but the Company makes no representation or warranty, express or implied, whatsoever, and no reliance shall be placed on,the truth, accuracy, completeness, fairness and reasonableness of the contents of this Presentation. This Presentation maynot be all inclusive and may not contain all of the information that you may consider material. Any liability in respect of thecontents of, or any omission from, this Presentation is expressly excluded.
This presentation contains certain forward looking statements concerning the Company’s future business prospects andbusiness profitability, which are subject to a number of risks and uncertainties and the actual results could materially differfrom those in such forward looking statements. The risks and uncertainties relating to these statements include, but are notlimited to, risks and uncertainties regarding fluctuations in earnings, our ability to manage growth, competition (bothdomestic and international), economic growth in India and abroad, ability to attract and retain highly skilled professionals,time and cost over runs on contracts, our ability to manage our international operations, government policies and actionsregulations, interest and other fiscal costs generally prevailing in the economy. The Company does not undertake to makeany announcement in case any of these forward looking statements become materially incorrect in future or update anyforward looking statements made from time to time by or on behalf of the Company.
2
Commenting on the results, Mr. Anil Kumar Jain, Executive Chairman, “We facedheadwinds in the last few quarters but now are witnessing improving trend. Our Q-o-Qperformance has reaffirmed the same.
Our twin strategy of being customer centric and able to introduce new products anddesigns along with improved product mix gives us the confidence to achieve highergrowth in times to come. This approach is aided by Strong relationships with customerswhich will strengthen our market position. Our domestic market continues to witnessincreased acceptance for our Brands and Designs.
Global Economy is improving and with our capabilities and capacities along with the rightproduct offerings gives us immense confidence to capitalize on the growing opportunitiesin the Home Textile Industry.
I am happy to share with you that Texprocil has awarded us the GOLD TROPHY the“Highest Exports of Bed Linen/Bed Sheets/Quilts” in Category III for the year 2016-2017”.This reaffirms our consistent growth story in Home Textiles segment in the last decade.”
Chairman’s Message
3
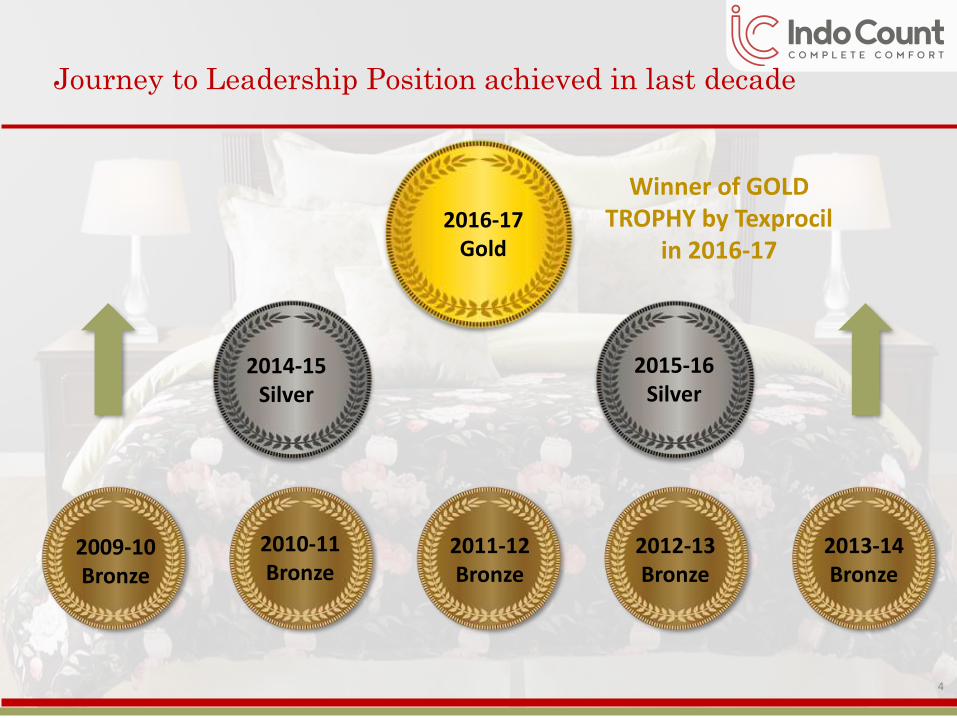
Journey to Leadership Position achieved in last decade
2015-16Silver
2016-17Gold
2014-15Silver
2013-14Bronze
2012-13Bronze
2011-12Bronze
2010-11Bronze
2009-10Bronze
Winner of GOLD TROPHY by Texprocil
in 2016-17
4
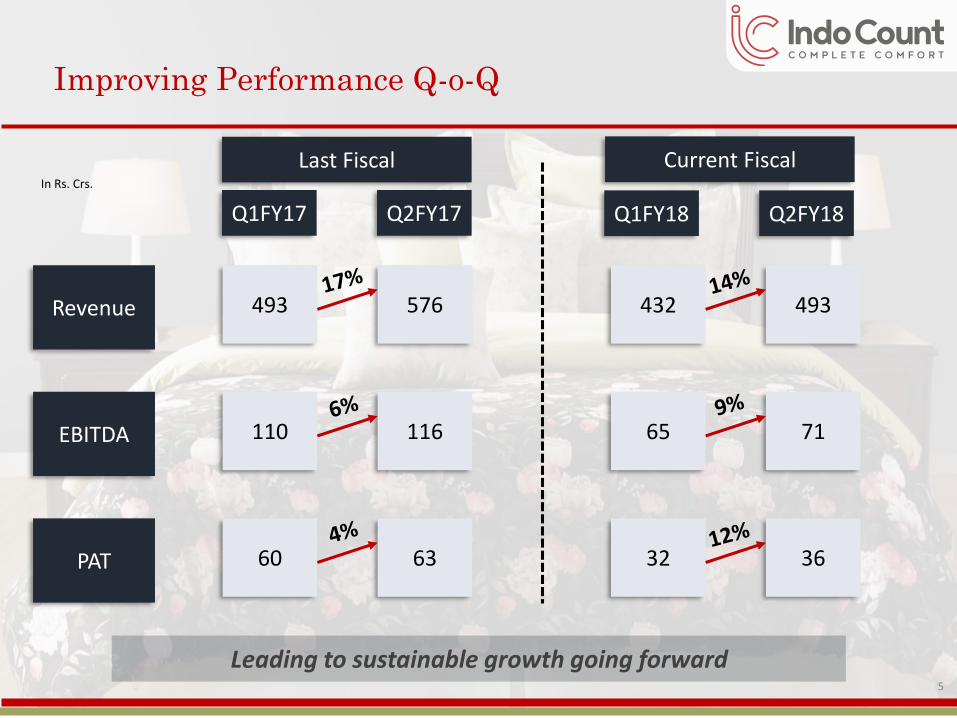
Improving Performance Q-o-Q
60 63
65 71
493 576 432 493
110 116
32 36
Revenue
EBITDA
PAT
Q1FY17 Q2FY17 Q1FY18 Q2FY18
In Rs. Crs.
Last Fiscal Current Fiscal
5
Leading to sustainable growth going forward
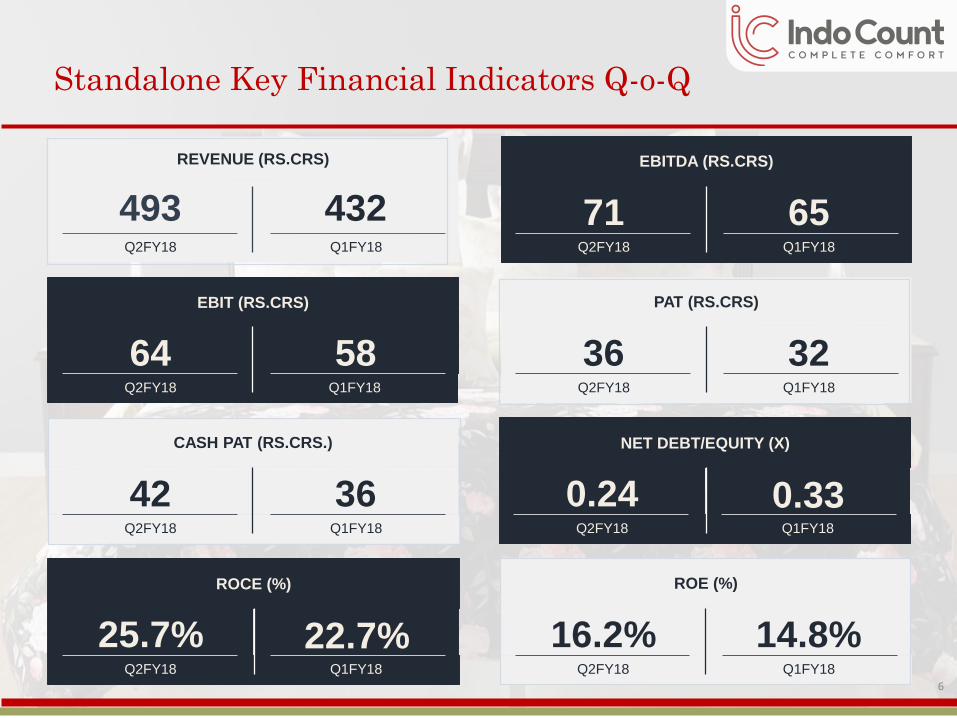
Standalone Key Financial Indicators Q-o-Q
EBITDA (RS.CRS)
Q2FY18
71Q1FY18
65
PAT (RS.CRS)
Q2FY18
36Q1FY18
32
NET DEBT/EQUITY (X)
Q2FY18
0.24Q1FY18
0.33
ROE (%)
Q2FY18
16.2%Q1FY18
14.8%
REVENUE (RS.CRS)
Q2FY18
493Q1FY18
432
EBIT (RS.CRS)
Q2FY18
64Q1FY18
58
CASH PAT (RS.CRS.)
Q2FY18
42Q1FY18
36
ROCE (%)
Q2FY18
25.7%Q1FY18
22.7%6
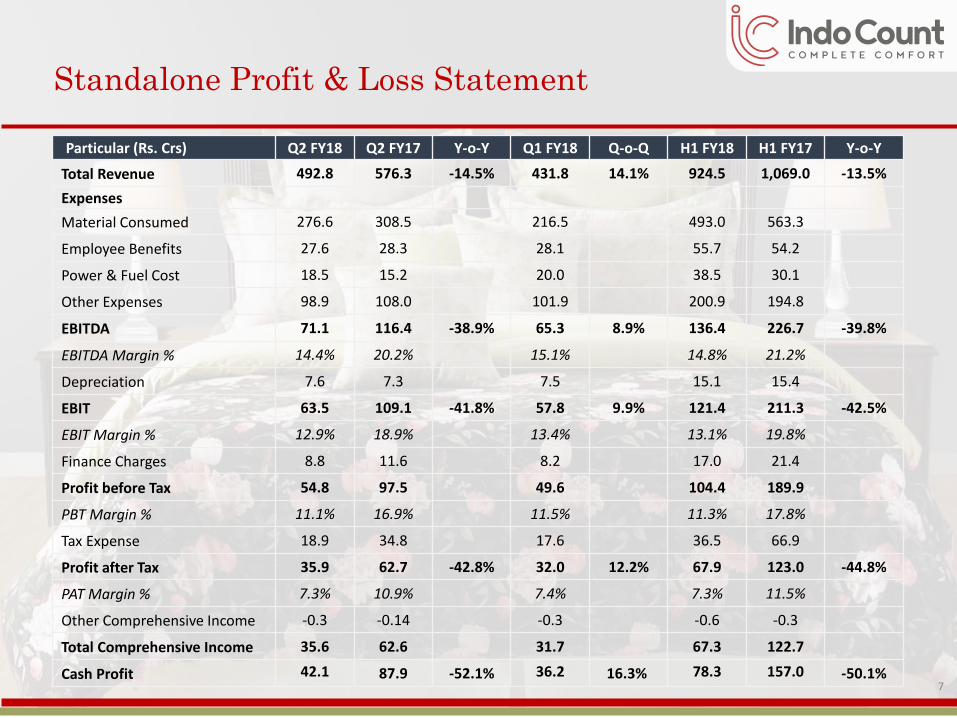
Particular (Rs. Crs) Q2 FY18 Q2 FY17 Y-o-Y Q1 FY18 Q-o-Q H1 FY18 H1 FY17 Y-o-Y
Total Revenue 492.8 576.3 -14.5% 431.8 14.1% 924.5 1,069.0 -13.5%
Expenses
Material Consumed 276.6 308.5 216.5 493.0 563.3
Employee Benefits 27.6 28.3 28.1 55.7 54.2
Power & Fuel Cost 18.5 15.2 20.0 38.5 30.1
Other Expenses 98.9 108.0 101.9 200.9 194.8
EBITDA 71.1 116.4 -38.9% 65.3 8.9% 136.4 226.7 -39.8%
EBITDA Margin % 14.4% 20.2% 15.1% 14.8% 21.2%
Depreciation 7.6 7.3 7.5 15.1 15.4
EBIT 63.5 109.1 -41.8% 57.8 9.9% 121.4 211.3 -42.5%
EBIT Margin % 12.9% 18.9% 13.4% 13.1% 19.8%
Finance Charges 8.8 11.6 8.2 17.0 21.4
Profit before Tax 54.8 97.5 49.6 104.4 189.9
PBT Margin % 11.1% 16.9% 11.5% 11.3% 17.8%
Tax Expense 18.9 34.8 17.6 36.5 66.9
Profit after Tax 35.9 62.7 -42.8% 32.0 12.2% 67.9 123.0 -44.8%
PAT Margin % 7.3% 10.9% 7.4% 7.3% 11.5%
Other Comprehensive Income -0.3 -0.14 -0.3 -0.6 -0.3
Total Comprehensive Income 35.6 62.6 31.7 67.3 122.7
Cash Profit 42.1 87.9 -52.1% 36.2 16.3% 78.3 157.0 -50.1%
Standalone Profit & Loss Statement
7
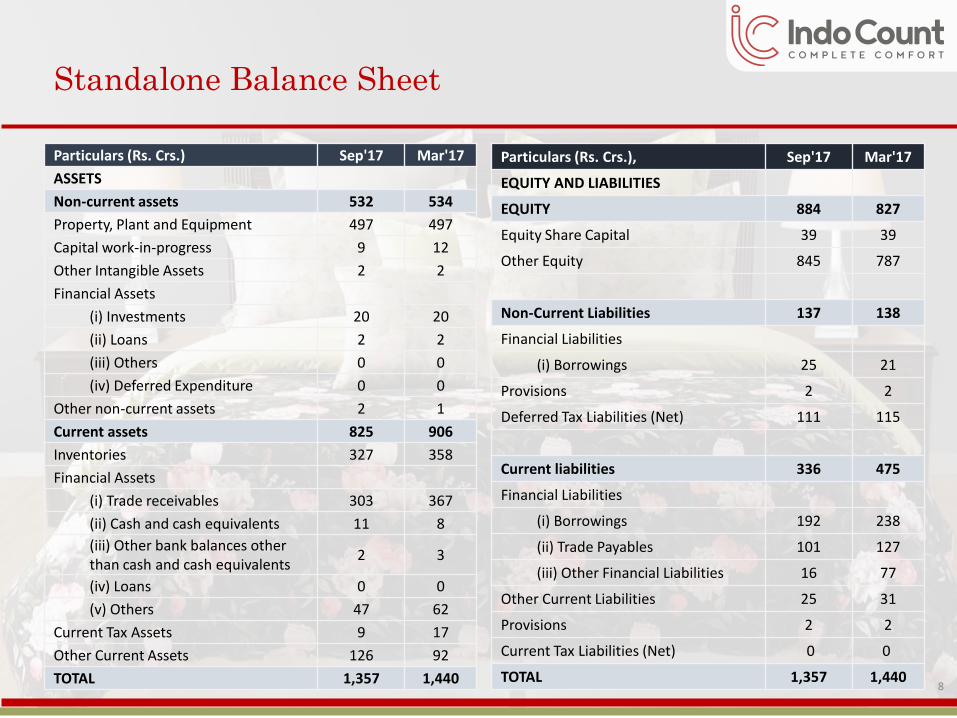
Standalone Balance Sheet
Particulars (Rs. Crs.) Sep'17 Mar'17
ASSETS
Non-current assets 532 534
Property, Plant and Equipment 497 497
Capital work-in-progress 9 12
Other Intangible Assets 2 2
Financial Assets
(i) Investments 20 20
(ii) Loans 2 2
(iii) Others 0 0
(iv) Deferred Expenditure 0 0
Other non-current assets 2 1
Current assets 825 906
Inventories 327 358
Financial Assets
(i) Trade receivables 303 367
(ii) Cash and cash equivalents 11 8
(iii) Other bank balances other than cash and cash equivalents
2 3
(iv) Loans 0 0
(v) Others 47 62
Current Tax Assets 9 17
Other Current Assets 126 92
TOTAL 1,357 1,440
Particulars (Rs. Crs.), Sep'17 Mar'17
EQUITY AND LIABILITIES
EQUITY 884 827
Equity Share Capital 39 39
Other Equity 845 787
Non-Current Liabilities 137 138
Financial Liabilities
(i) Borrowings 25 21
Provisions 2 2
Deferred Tax Liabilities (Net) 111 115
Current liabilities 336 475
Financial Liabilities
(i) Borrowings 192 238
(ii) Trade Payables 101 127
(iii) Other Financial Liabilities 16 77
Other Current Liabilities 25 31
Provisions 2 2
Current Tax Liabilities (Net) 0 0
TOTAL 1,357 1,4408
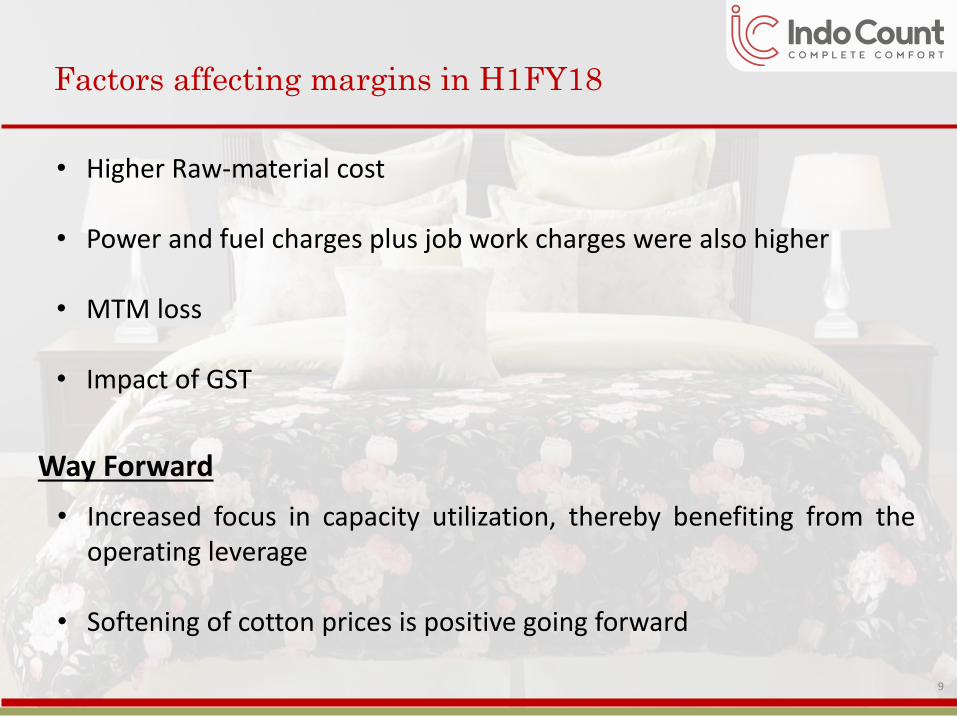
Factors affecting margins in H1FY18
9
• Higher Raw-material cost
• Power and fuel charges plus job work charges were also higher
• MTM loss
• Impact of GST
Way Forward
• Increased focus in capacity utilization, thereby benefiting from theoperating leverage
• Softening of cotton prices is positive going forward
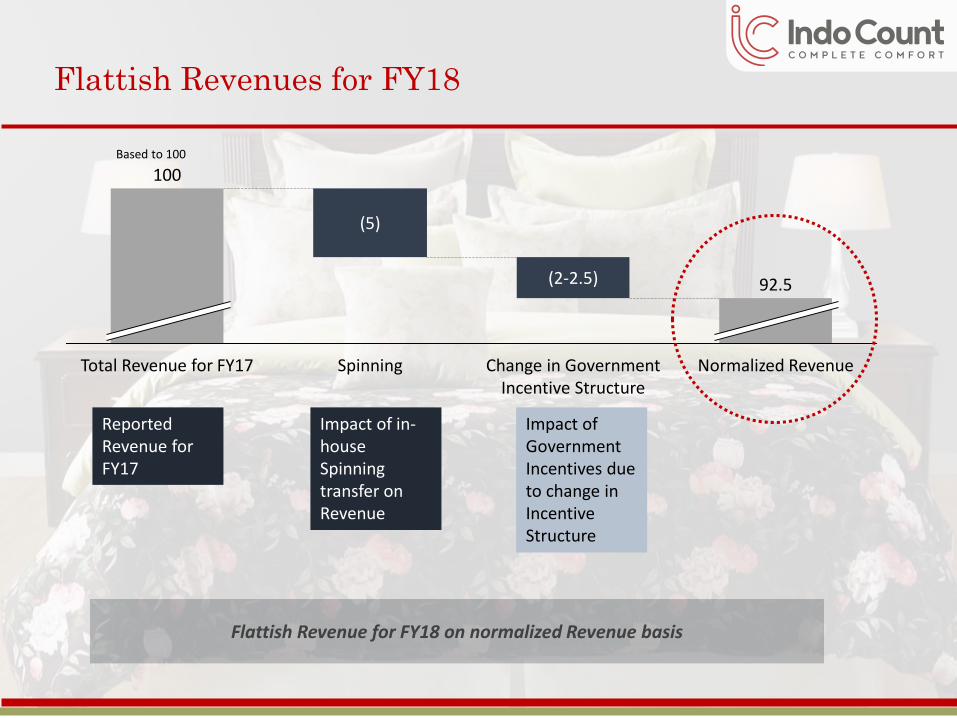
Flattish Revenues for FY18
Change in Government Incentive Structure
(5)
Total Revenue for FY17
(2-2.5)
Normalized RevenueSpinning
92.5
100
Flattish Revenue for FY18 on normalized Revenue basis
Reported Revenue for FY17
Impact of in-house Spinning transfer on Revenue
Impact of Government Incentives due to change in Incentive Structure
Based to 100
Strong Name in Global Home Textile Industry
11
12
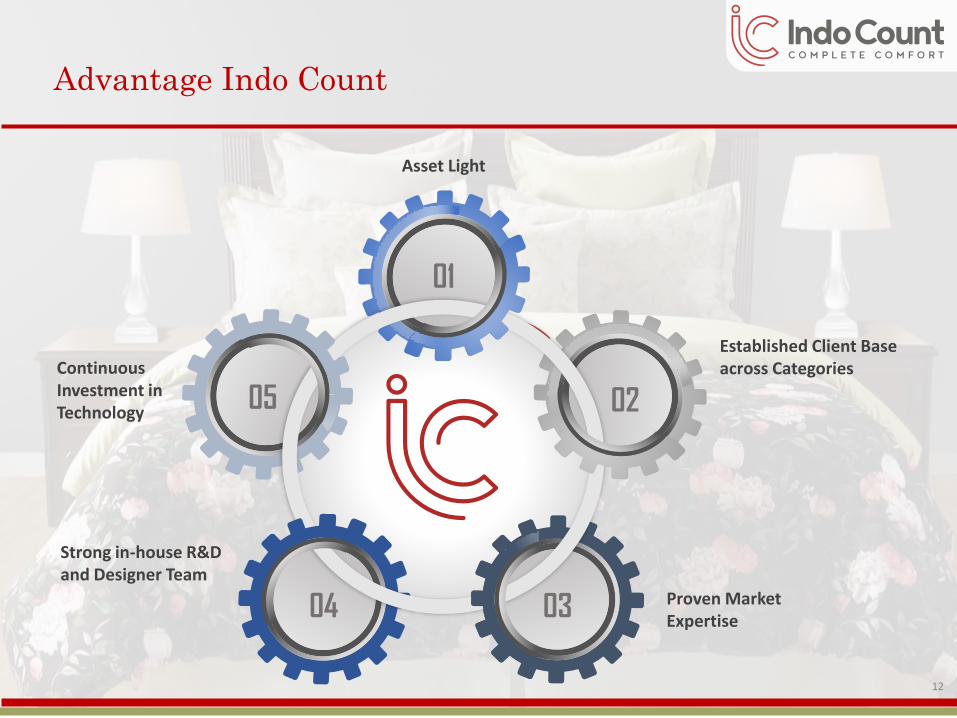
Advantage Indo Count
Established Client Base across CategoriesContinuous
Investment in Technology
01
05 02
0304 Proven Market Expertise
Strong in-house R&D and Designer Team
Asset Light

Own Lifestyle Brands
13
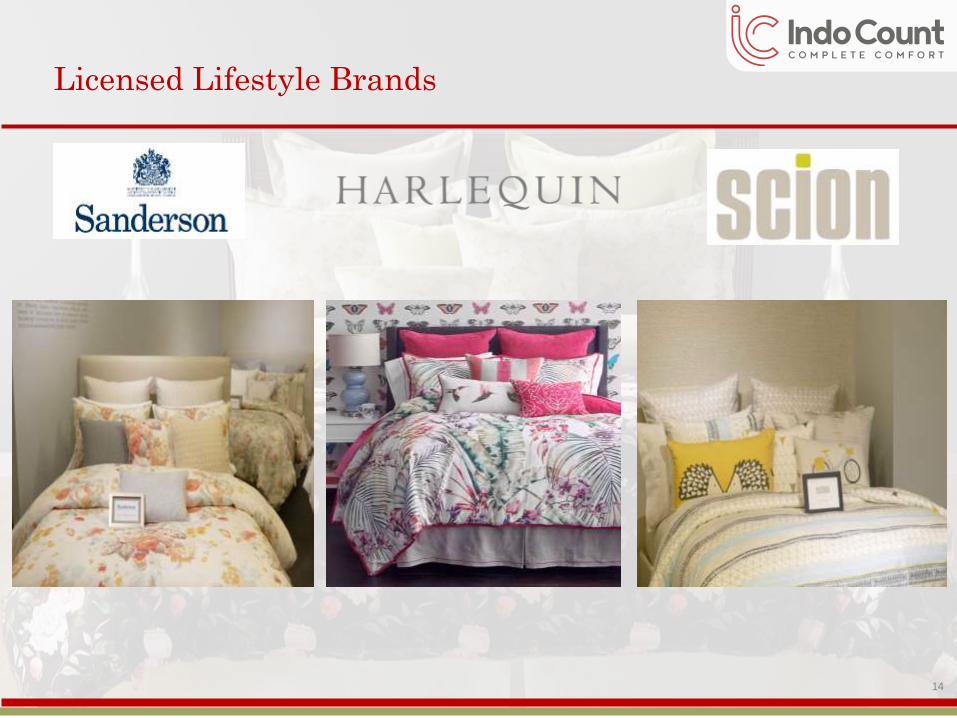
Licensed Lifestyle Brands
14
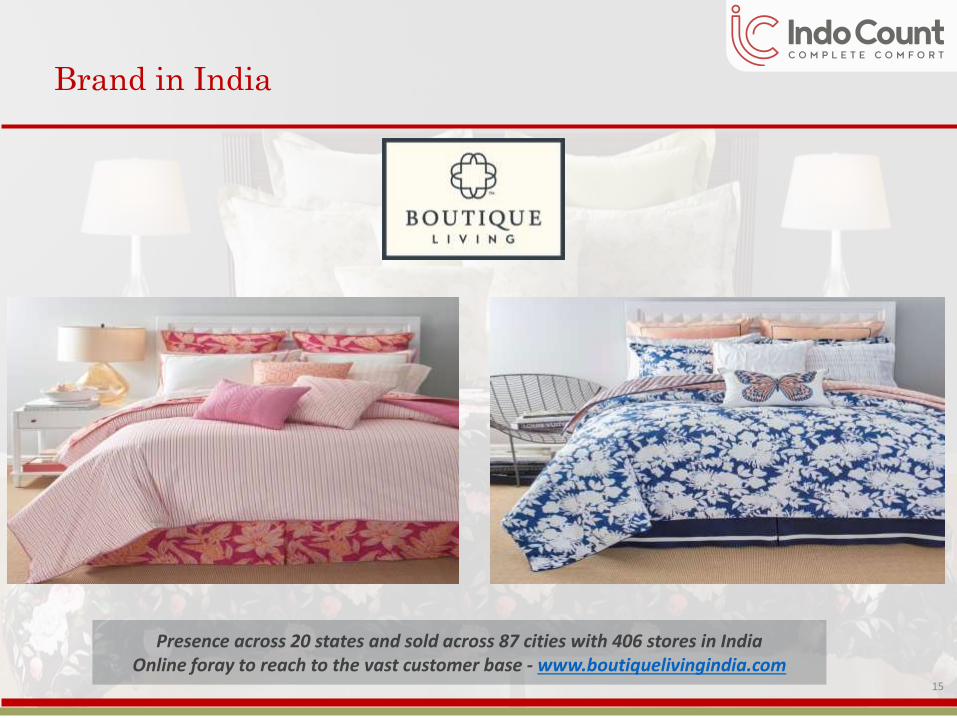
Brand in India
Presence across 20 states and sold across 87 cities with 406 stores in IndiaOnline foray to reach to the vast customer base - www.boutiquelivingindia.com
15
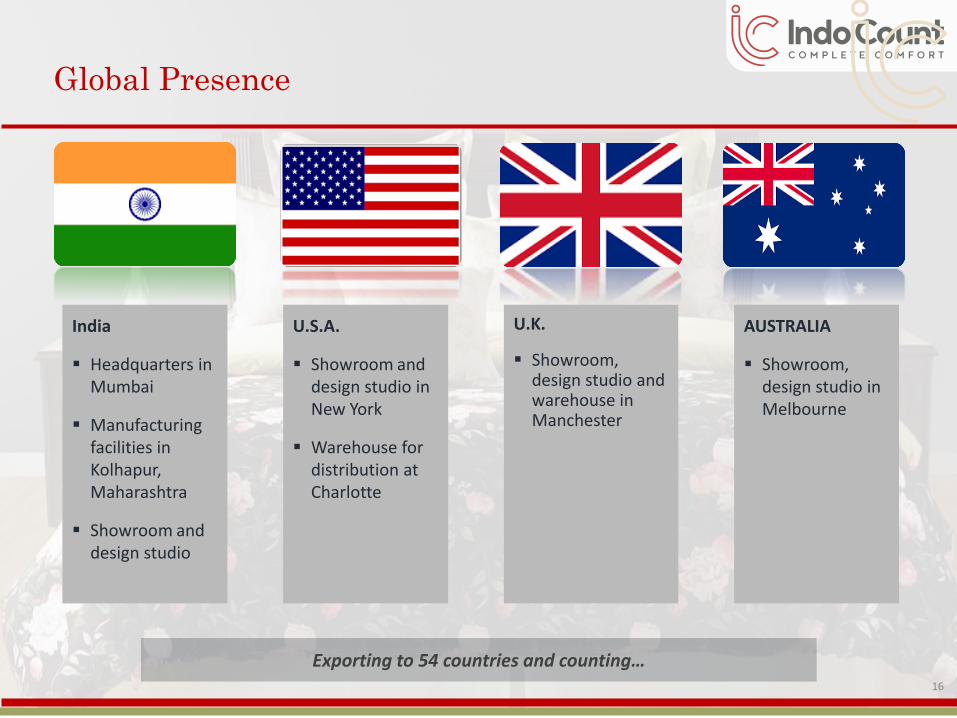
Global Presence
U.K.
▪ Showroom, design studio and warehouse in Manchester
U.S.A.
▪ Showroom and design studio in New York
▪ Warehouse for distribution at Charlotte
AUSTRALIA
▪ Showroom, design studio in Melbourne
India
▪ Headquarters in Mumbai
▪ Manufacturing facilities in Kolhapur, Maharashtra
▪ Showroom and design studio
Exporting to 54 countries and counting…16
Industry Perspective
17
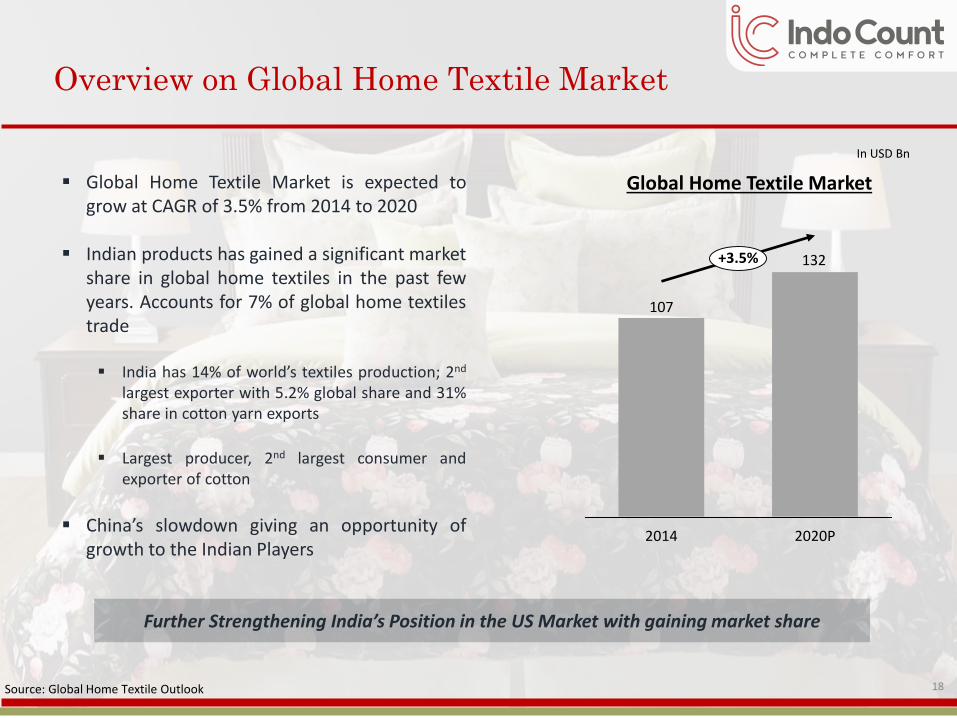
Overview on Global Home Textile Market
▪ Global Home Textile Market is expected togrow at CAGR of 3.5% from 2014 to 2020
▪ Indian products has gained a significant marketshare in global home textiles in the past fewyears. Accounts for 7% of global home textilestrade
▪ India has 14% of world’s textiles production; 2nd
largest exporter with 5.2% global share and 31%share in cotton yarn exports
▪ Largest producer, 2nd largest consumer andexporter of cotton
▪ China’s slowdown giving an opportunity ofgrowth to the Indian Players
Source: Global Home Textile Outlook
In USD Bn
Further Strengthening India’s Position in the US Market with gaining market share
132
107
2014 2020P
+3.5%
Global Home Textile Market
18
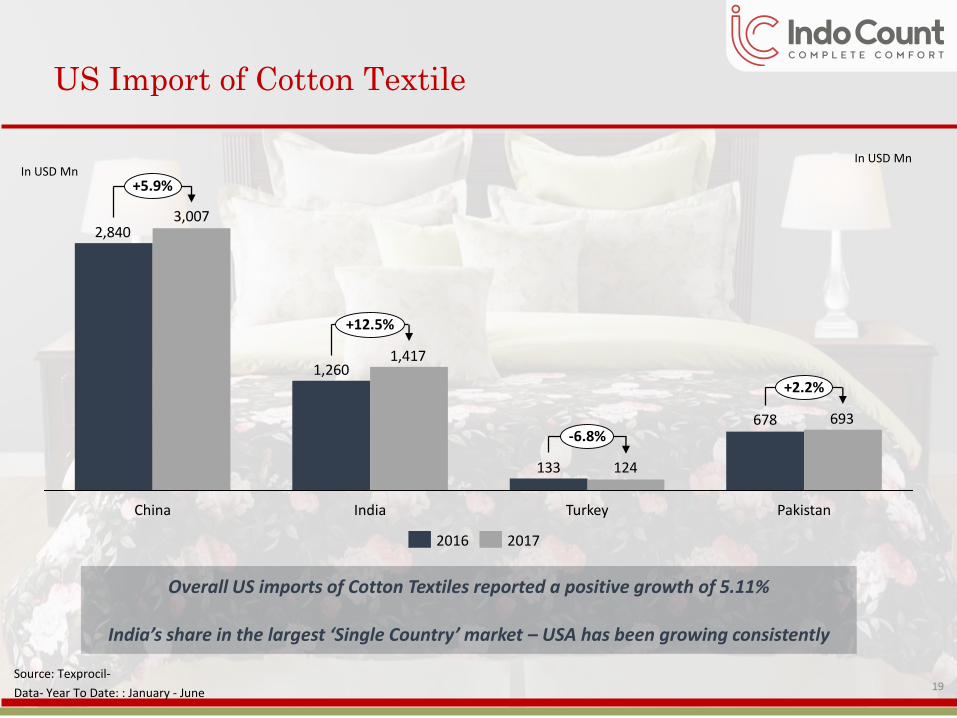
US Import of Cotton Textile
678
133
1,260
2,840
693
124
1,417
3,007
+12.5%
TurkeyChina India
+2.2%
Pakistan
+5.9%
-6.8%
20172016
In USD Mn
Source: Texprocil-
Data- Year To Date: : January - June
Overall US imports of Cotton Textiles reported a positive growth of 5.11%
India’s share in the largest ‘Single Country’ market – USA has been growing consistently
In USD Mn
19
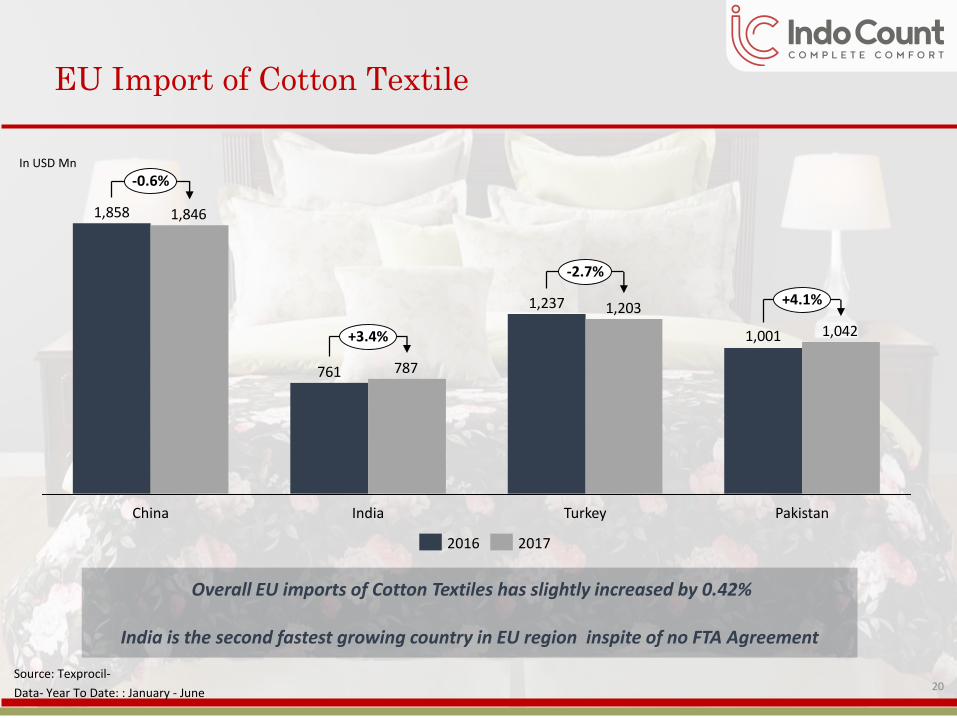
EU Import of Cotton Textile
1,001
1,237
761
1,858
1,042
1,203
787
1,846
TurkeyIndiaChina
-2.7%
+3.4%
-0.6%
Pakistan
+4.1%
2016 2017
In USD Mn
Overall EU imports of Cotton Textiles has slightly increased by 0.42%
India is the second fastest growing country in EU region inspite of no FTA Agreement
Source: Texprocil-
Data- Year To Date: : January - June20
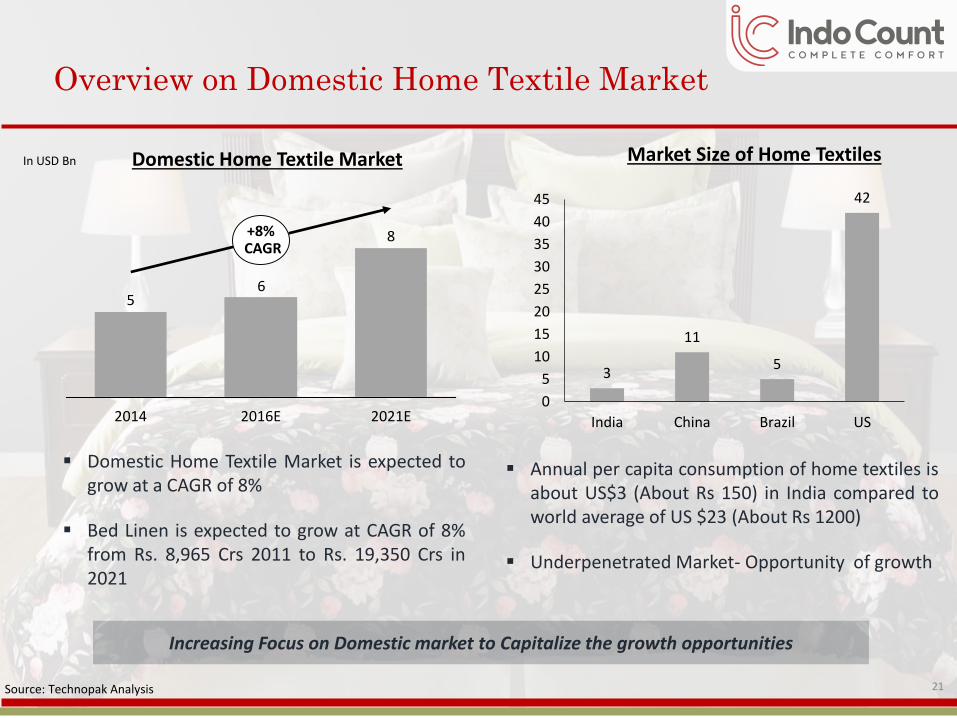
Overview on Domestic Home Textile Market
Domestic Home Textile Market
8
65
2021E2016E2014
+8%CAGR
In USD Bn
▪ Domestic Home Textile Market is expected togrow at a CAGR of 8%
▪ Bed Linen is expected to grow at CAGR of 8%from Rs. 8,965 Crs 2011 to Rs. 19,350 Crs in2021
Market Size of Home Textiles
▪ Annual per capita consumption of home textiles isabout US$3 (About Rs 150) in India compared toworld average of US $23 (About Rs 1200)
▪ Underpenetrated Market- Opportunity of growth
Source: Technopak Analysis
3
11
5
42
0
5
10
15
20
25
30
35
40
45
India China Brazil US
Increasing Focus on Domestic market to Capitalize the growth opportunities
21
Indo Count Industries Ltd (ICIL) (part of S&P BSE 500), is one of India’s largest Home Textile manufacturer.Under the leadership of Mr Anil Kumar Jain, Executive Chairman, who has been awarded as one of the India’sBest Top 100 CEO’s 2016, the Company has focused on some of the world’s finest fashion, institutional andutility bedding & sheets and has built significant presence across the globe. Over the years, the Company hassuccessfully carved out a niche for itself and has become a total bedding resource. The company’s capacitycurrently stands at 90 million meters.
The Company’s product comprises the following:-
Bed Sheets: Flat sheet, fitted sheet and pillow cases
Fashion Bedding: Comforters, bed in bag, quilts and coverlets, decorative pillows, etc.
Utility Bedding: mattress pads, protectors, comforters filled with poly fibre
Institutional Linen: Basic white bedding, duvet covers and shams; caters to hotels, hospitals and others
ICIL has also been honoured in past with numerous prestigious awards from TEXPROCIL including Gold Trophyfor highest exports of Cotton Made-ups in Category III for the year 2016-17.
CARE recently upgraded credit rating to CARE AA (Double AA) with Stable Outlook in August 2017. ICRA’s creditrating is ICRA AA- (Double AA minus) for Company’s Long-Term Bank Facilities and “CARE A1+/ ICRA A1+” forshort term bank facilities. ICRA has upgraded the outlook to positive from stable.
About Us
22
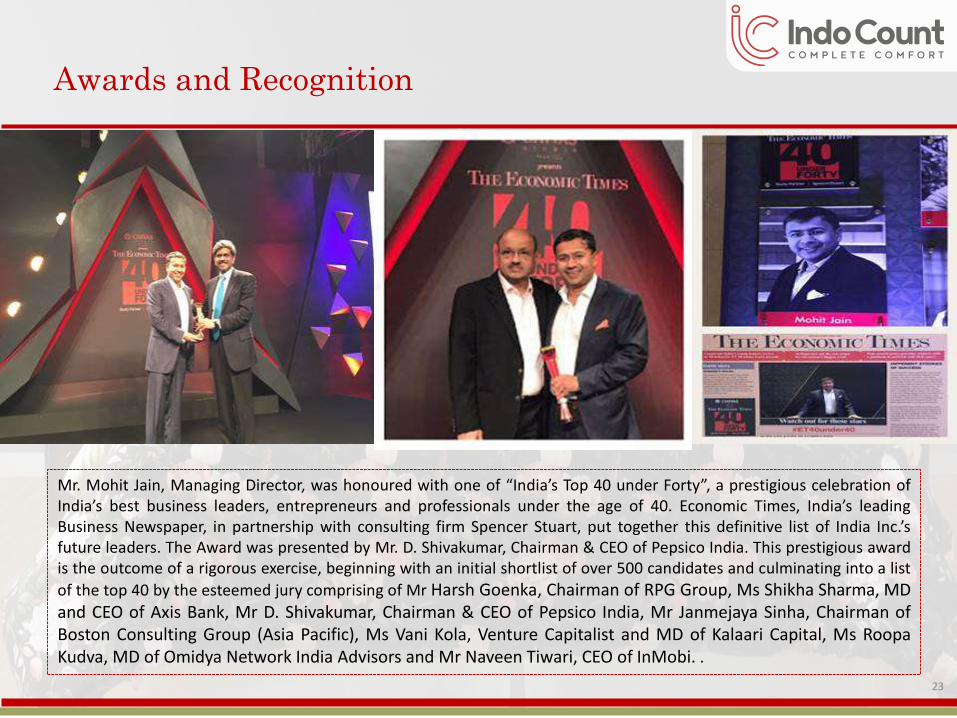
Awards and Recognition
Mr. Mohit Jain, Managing Director, was honoured with one of “India’s Top 40 under Forty”, a prestigious celebration ofIndia’s best business leaders, entrepreneurs and professionals under the age of 40. Economic Times, India’s leadingBusiness Newspaper, in partnership with consulting firm Spencer Stuart, put together this definitive list of India Inc.’sfuture leaders. The Award was presented by Mr. D. Shivakumar, Chairman & CEO of Pepsico India. This prestigious awardis the outcome of a rigorous exercise, beginning with an initial shortlist of over 500 candidates and culminating into a list
of the top 40 by the esteemed jury comprising of Mr Harsh Goenka, Chairman of RPG Group, Ms Shikha Sharma, MDand CEO of Axis Bank, Mr D. Shivakumar, Chairman & CEO of Pepsico India, Mr Janmejaya Sinha, Chairman ofBoston Consulting Group (Asia Pacific), Ms Vani Kola, Venture Capitalist and MD of Kalaari Capital, Ms RoopaKudva, MD of Omidya Network India Advisors and Mr Naveen Tiwari, CEO of InMobi. .
23
Investor Contact
24
For further information please contact:
Indo Count Industries Limited
CIN: L72200PN1988PLC068972
Mr. K.R. Lalpuria – Group President
Mr. Dilip Ghorawat – Chief Financial Officer
Ms. Ruchita Maheshwari – Sr. Manager Investor Relations
+91-22-43419500
www.indocount.com
Investor Relations Advisors:
Strategic Growth Advisors Pvt. Ltd.
CIN: U74140MH2010PTC204285
Mr. Shogun Jain / Ms. Neha Shroff
+91 77383 77756 / +91 77380 73466
[email protected] / [email protected]
www.sgapl.net
Recommended