Investment without Displacement:Increasing the Affordable Housing Supply
MIRIAM ZUK, PH.D.UC BERKELEY
ANNA CASH • PAIGE DOW • JUSTINE MARCUS

Sources: US Bureau of Economic Analysis, MTC Vital Signs, CA Dept. of Finance
Bay Area on the Rise
$40,000
$50,000
$60,000
$70,000
$80,000
$90,000
$100,000
2001 2002 2003 2004 2005 20062007 2008 2009 20102011 2012 2013 2014 2015
PerC
apita
GDP
(CurrentUS$)
BayAreaGrossDomesDcProduct(GDP)
BayArea
California
UnitedStates

Rising rents
Income inequality
Declining poverty
Low unemployment
Jobs and housing mismatch
Suburbanization of poverty
Growth in high wage jobs

Source: Zillow, ZHVI All Homes (SFR, Condo/Co-op) Time Series January 1997– November 2016
Homeownership Out of Reach
$-
$200,000
$400,000
$600,000
$800,000
$1,000,000
$1,200,000
Med
ianHo
meVa
lue(2016$)
MedianHomeValue,1997-2016
SanJoseMetroArea
SanFranciscoMetroArea
BayAreaAverage
California
UnitedStates
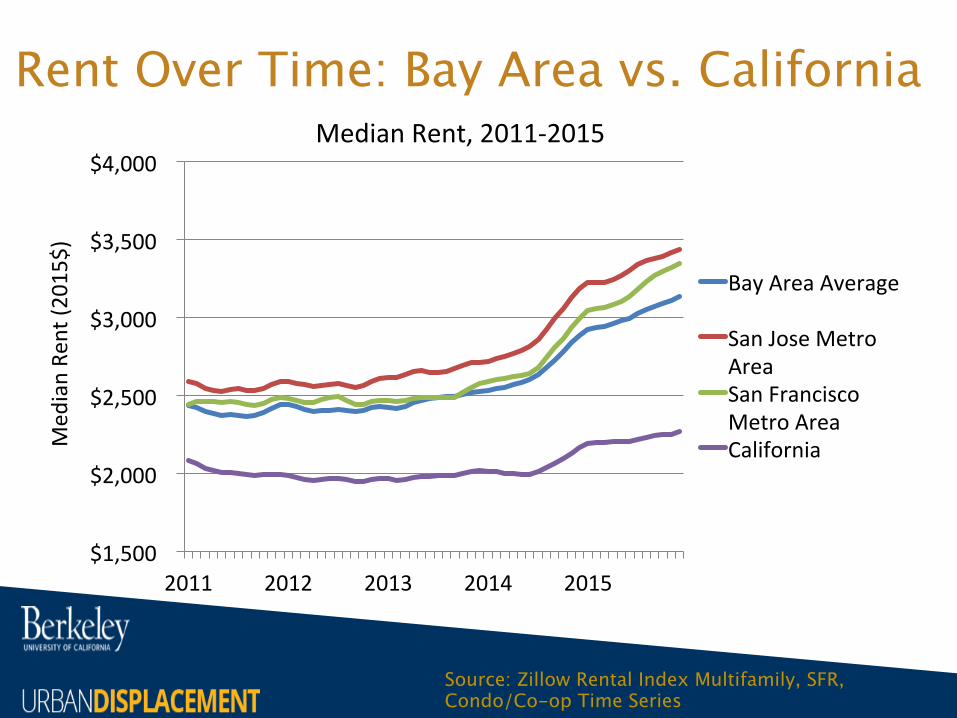
Rent Over Time: Bay Area vs. California
Source: Zillow Rental Index Multifamily, SFR, Condo/Co-op Time Series
$1,500
$2,000
$2,500
$3,000
$3,500
$4,000
2011 2012 2013 2014 2015
Med
ianRe
nt(2
015$)
MedianRent,2011-2015
BayAreaAverage
SanJoseMetroAreaSanFranciscoMetroAreaCalifornia

Economic Prosperity is Not for All
Source: American Community Survey, 1-yr estimates,, 2006-2015
$0
$20,000
$40,000
$60,000
$80,000
$100,000
$120,000
2006 2007 2008 2009 2010 2011 2012 2013 2014 2015
Computerrelated
Doctors
EducaDon,training,andlibraryConstrucDon
BuildingandgroundsmaintenanceFoodpreparaDonandserving

-10%
-5%
0%
5%
10%
15%
2007 2008 2009 2010 2011 2012 2013 2014 2015
Percen
tChangeSince2007
MedianRentandIncome
Income
Rent
Wages Have Not Kept Up With Rents
Source: American Community Survey 1 year estimatesNote: All values adjusted to 2015 dollars

Not Enough Supply to Meet the Demand
Source: US Census Bureau, American Community Survey
BayAreaRenterHouseholds2015
202,644
23,569
163,187
17,456
237,252
81,651
480,407
0
100,000
200,000
300,000
400,000
500,000
600,000
700,000
RenterHouseholds AffordableandAvailableRentalHomes
ShorXall
LI(LowIncome)
VLI(VeryLowIncome)
ELI(ExtremelyLowIncome)

Sources: US Census LEHD On the Map, Annual Housing Element Progress Reports (APRs)
Low-Wage Job Growth vs. Low-Cost Housing Production
-2,500
2,500
7,500
12,500
17,500
22,500
Alameda ContraCosta
Marin Napa SanFrancisco
SanMateo
SantaClara
Solano Sonoma
Low-WageJobsandHousingPermits,2007-2016
Low-WageJobGrowth(2010-2014)
NewLow-WageHousingPermits(2007-2016)

High-Wage Job Growth vs High-Cost Housing Production
0
10,000
20,000
30,000
40,000
50,000
60,000
70,000
80,000
Alameda ContraCosta
Marin Napa SanFrancisco
SanMateo
SantaClara
Solano Sonoma
HighWageJobsandPermits,2007-2016
High-WageJob-Growth(2010-2014)
NewHigh-WageHousingPermits(2007-2016)
Sources: US Census LEHD On the Map, Annual Housing Element Progress Reports (APRs)

Majority of Housing Permitted is for Higher Income Groups
0%
10%
20%
30%
40%
50%
60%
70%
80%
90%
100%
Percen
tofP
ermitsIssued
PermitsIssued2007-2015
AboveModerate
Moderate
Low
VeryLow
Source: Association of Bay Area Governments

Affordable housing production lags behindFrom 2007-2014, region has permitted < 1/3 of the units allocated for low and moderate-income >99% for above-moderate
0%
10%
20%
30%
40%
50%
60%
70%
80%
90%
100%
VeryLow Low Moderate AboveModerate
Total
Percen
tofR
HNARe
quire
men
ts
PercentageofRHNARequirementsMet(2007-2014)
Source: Association of Bay Area Governments
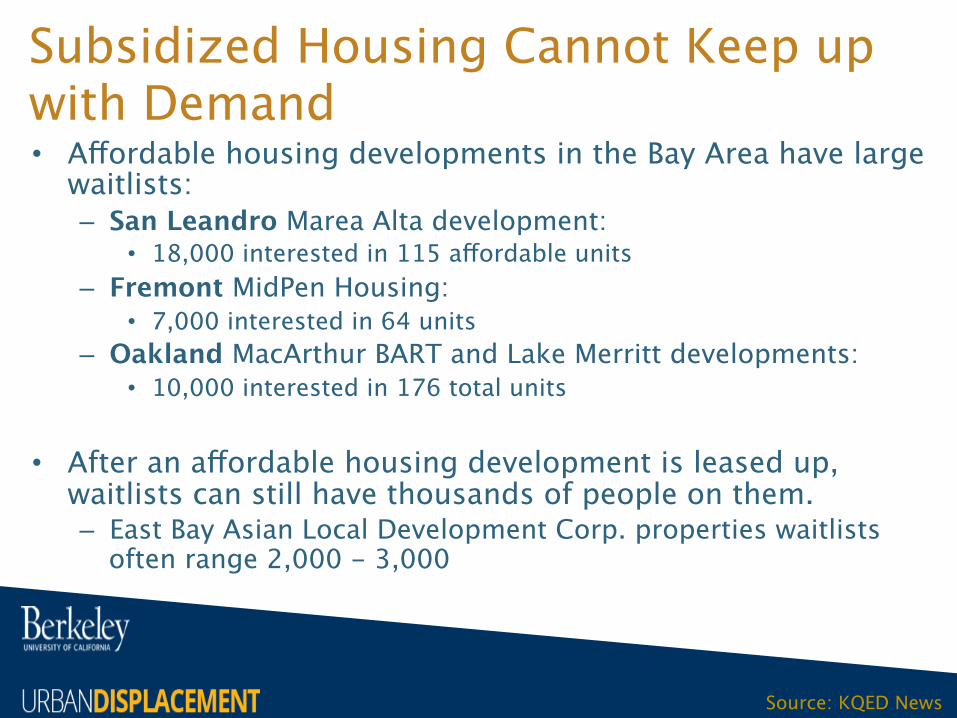
Subsidized Housing Cannot Keep up with Demand• Affordable housing developments in the Bay Area have large
waitlists:– San Leandro Marea Alta development:
• 18,000 interested in 115 affordable units– Fremont MidPen Housing:
• 7,000 interested in 64 units– Oakland MacArthur BART and Lake Merritt developments:
• 10,000 interested in 176 total units
• After an affordable housing development is leased up, waitlists can still have thousands of people on them. – East Bay Asian Local Development Corp. properties waitlists
often range 2,000 - 3,000
Source: KQED News

What are some of the barriers to creating new affordable
housing?

Barriers• High land and
construction costs– Construction labor in
CA metros = 20% higher than the rest of the U.S.
• Tax policy – fiscalization of land use
• NIMBYism• Entitlement
uncertainty, timing and costs $0
$50,000
$100,000
$150,000
$200,000
$250,000
$300,000
$350,000
$400,000
Land
Cost(Pe
rAcre)
LandCostsComparison
AverageU.S.MetroArea
CaliforniaCoastalMetroArea
SanFrancisco
Source: California Legislative Analyst’s Office

Loss of Funding
Source: California Housing Partnership Corporation

Why is it important to create new housing affordable to
low income households?

Why not just build more market-rate housing?
Some argue that we should focus on building market-rate housing and allow the process of
filtering to bring “naturally affordable” housing to the market.
But…

The limitations of filtering• It doesn’t work in gentrifying neighborhoods:
– Changes in housing preferences to architecturally significant property has disrupted the filtering process
– More likely to see “reverse filtering,” also known as “filtering up” in hot neighborhoods
• It can take decades. – Rent of a typical unit only declines 0.3% each year– 15 years before units filter down to 80% median
income– 50 years before units filter down to 50% median
income

Subsidized housing is more effective• Market rate housing
production in 90s resulted in lower median rent today, but also higher cost burden for low income renters
• Subsidized affordable housing produced in
‘90s had twice the impact as market rate housing in mitigating displacement

What are some of the tools to build affordable housing?

Creating New Affordable Housing
PublicInvestment
LeveragingtheMarket
GeneraDngUnits
GeneraDngFunds
Densitybonus
Permitstreamlining
TaxexempDons
Reducedparkingrequirements
AccessoryDwellingUnits(ADUs)CommunityLandTrusts
Landbanking
PubliclanddisposiDon
Publichousing
Landvaluecapture
BondsforaffordablehousingconstrucDon
Housingtrustfund
Housinglevy
Inclusionaryzoning
Commerciallinkagefees
Impactfees

Success Story: Commercial Linkage Fee in Redwood City
• City Council passed Affordable Housing Impact Fee Ordinance in 2015
• Includes both residential and commercial linkage fees
• Commercial rates:- $20/sq.ft. office- $5/sq.ft. hotel and retail
• Impact fees go to new City Affordable Housing Fund
• Utilized San Mateo 21 Elements Nexus Study

Success Story: Tax Incentive for Affordable Housing in Portland, OR• 10-year property tax exemption
on new housing projects with at least 20% below market rate units
• Targeting areas close to transit, pedestrian infrastructure, and in areas with limited affordable housing
• $3 million/year cap on tax breakExample:
Burnside Street Tower, 57 workforce housing
units (<60% AMI)
What are some success stories and challenges in the
Bay Area?

Today’s Panel
RickJacobusStreetLevelAdvisors
GloriaBruceEastBayHousingOrganiza8ons
LewisKnightFacebook
KristyWangSPUR
Recommended


![[Paper Model] [Helicopter] [Maly Modelarz 1975-12] PZL Swidnik BZ-4 Zuk Helo](https://img.pdfslide.us/doc/110x75/552ee4755503464a778b4b62/paper-model-helicopter-maly-modelarz-1975-12-pzl-swidnik-bz-4-zuk-helo.jpg)