Environmental Quality Authority
Introduction to climate science : global climate variability andIntroduction to climate science : global climate variability andchange, findings of IPCC AR5change, findings of IPCC AR5
Imad KhatibImad Khatib
Palestine National Training Seminar on Climate ChangePalestine National Training Seminar on Climate Change26 26 –– 28 January, 201528 January, 2015
OutlineOutline:
Basic Science of Climate Change
The IPCC and the AR5 findings
Climate change: East Mediterranean and Palestine, The GLOWA – Jordan River
Basic Science of Climate Change
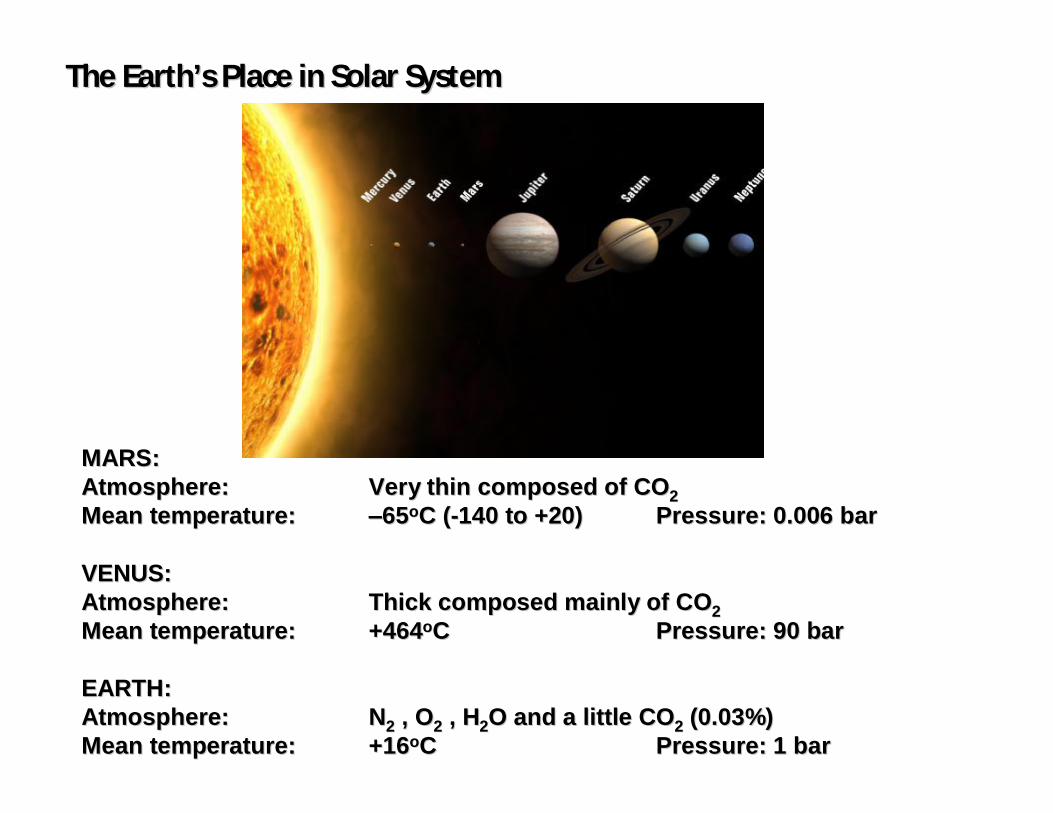
The EarthThe Earth’’s Place in Solar Systems Place in Solar System
MARS:MARS:Atmosphere: Atmosphere: Very thin composed of COVery thin composed of CO22Mean temperature: Mean temperature: ––6565ooC (C (--140 to +20)140 to +20) Pressure: 0.006 barPressure: 0.006 bar
VENUS:VENUS:Atmosphere: Atmosphere: Thick composed mainly of COThick composed mainly of CO22Mean temperature: Mean temperature: +464+464ooCC Pressure: 90 barPressure: 90 bar
EARTH:EARTH:Atmosphere: Atmosphere: NN22 , O, O22 , H, H22O and a little COO and a little CO22 (0.03%)(0.03%)Mean temperature: Mean temperature: +16+16ooCC Pressure: 1 barPressure: 1 bar
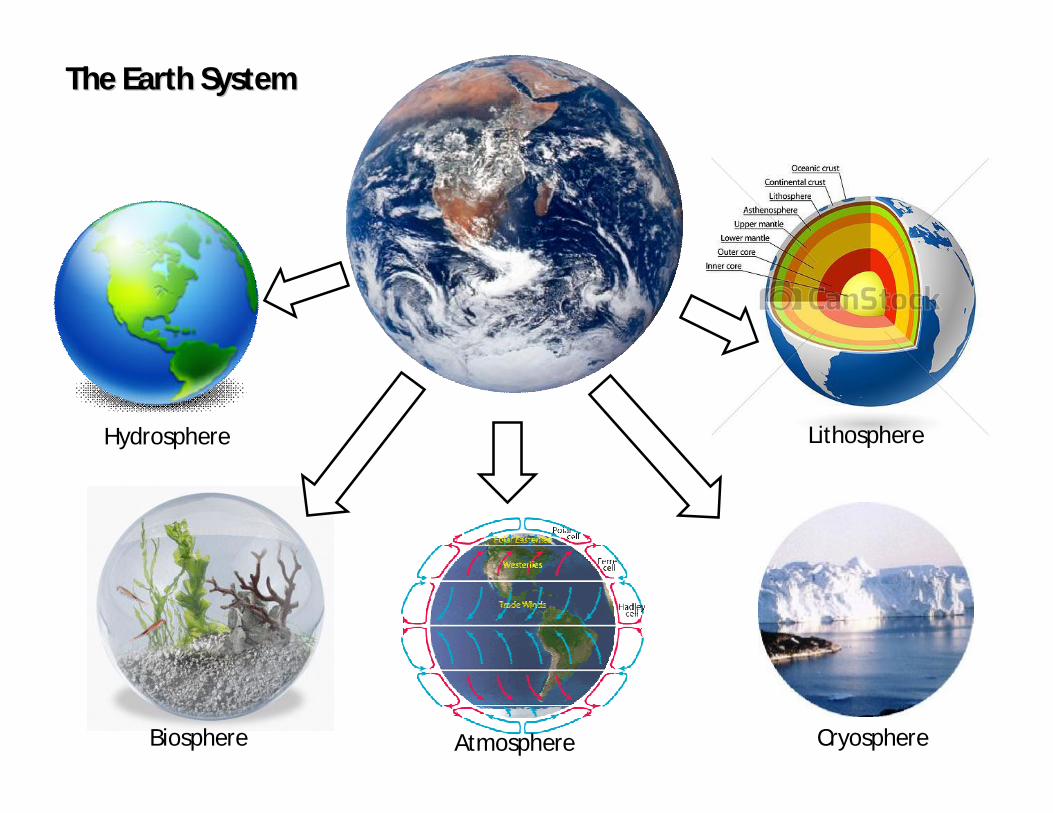
The Earth SystemThe Earth System
Lithosphere
CryosphereBiosphere Atmosphere
Hydrosphere
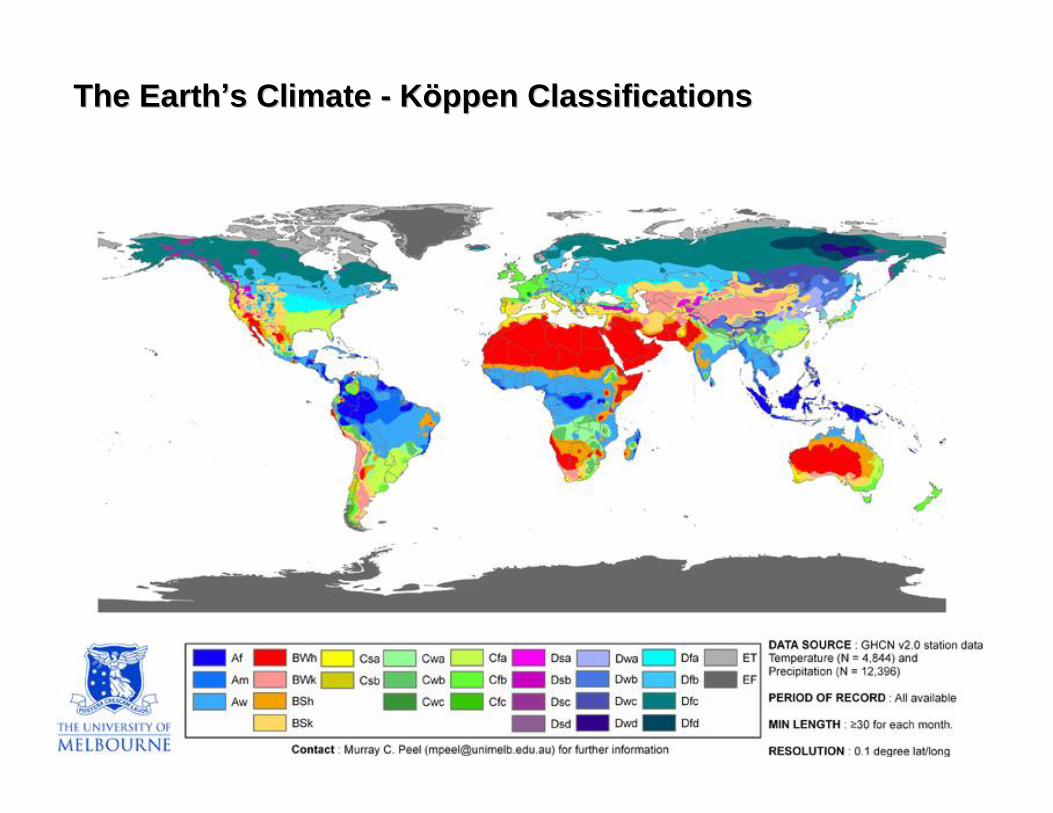
The EarthThe Earth’’s Climate s Climate -- KKööppen Classificationsppen Classifications
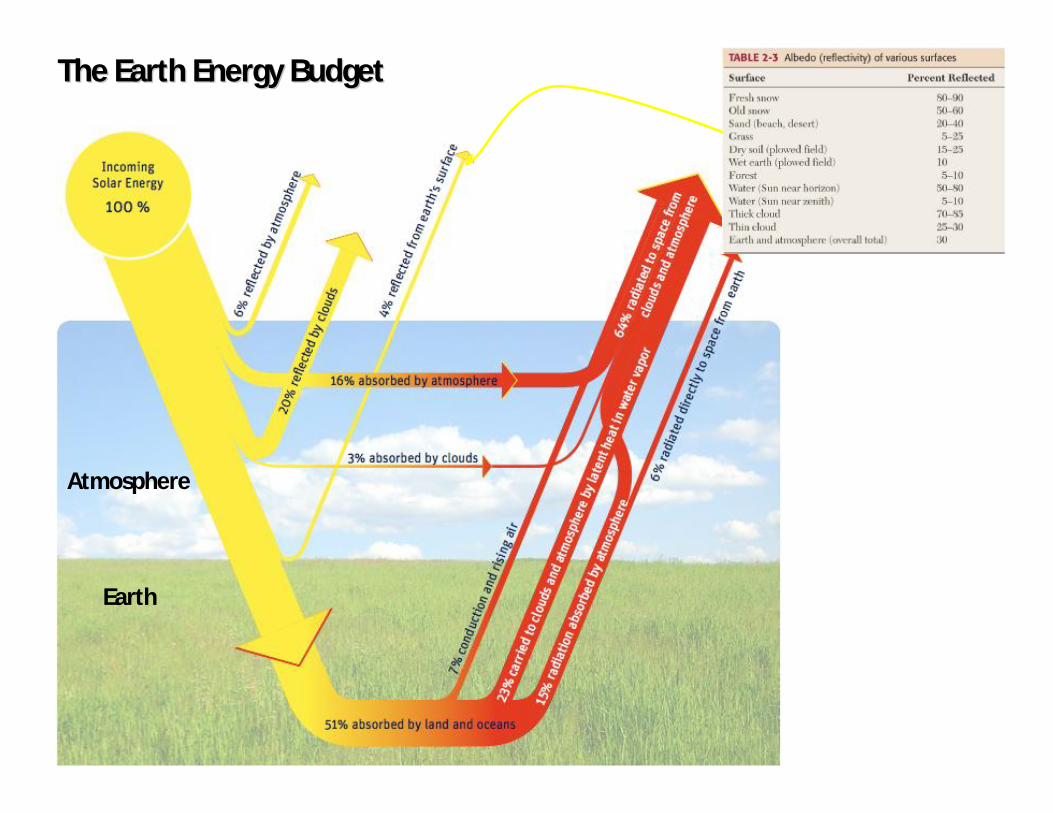
The Earth Energy BudgetThe Earth Energy Budget
Atmosphere
Earth
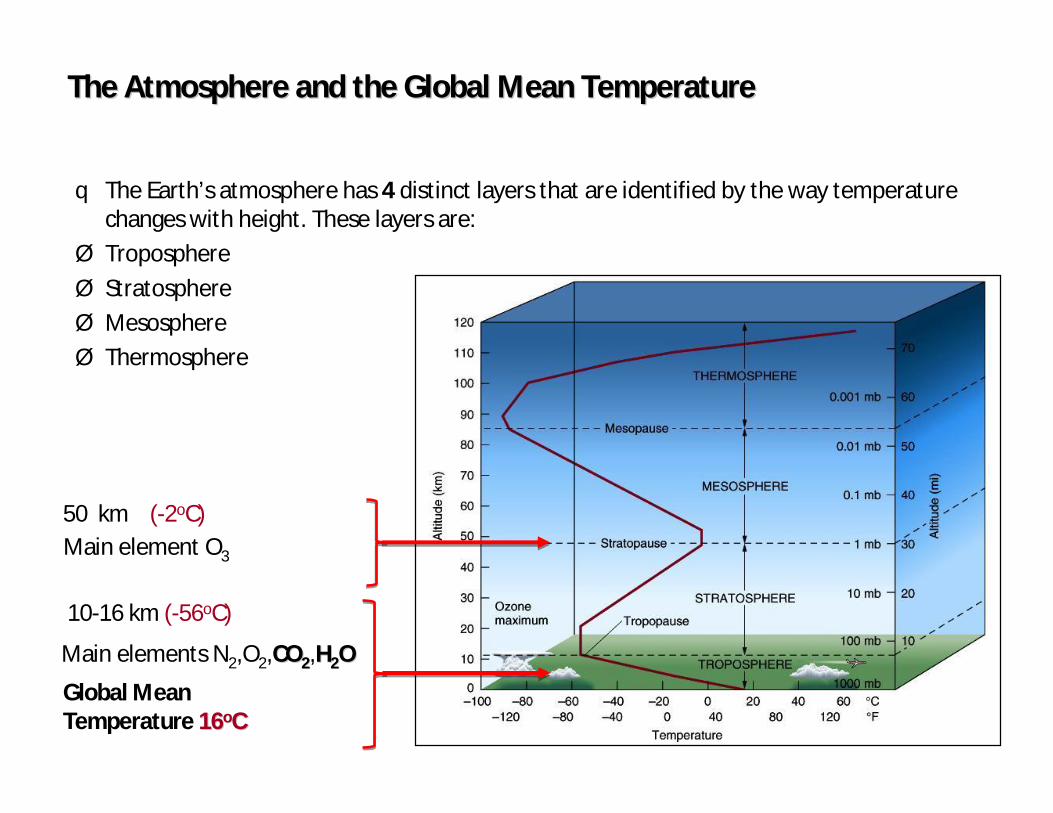
The Atmosphere and the Global Mean TemperatureThe Atmosphere and the Global Mean Temperature
q The Earth’s atmosphere has 4 distinct layers that are identified by the way temperature changes with height. These layers are:
Ø Troposphere
Ø Stratosphere
Ø Mesosphere
Ø Thermosphere
10-16 km (-56oC)
Global Mean Temperature 1616ooCC
Main elements N2,O2,COCO22,HH22OO
50 km (-2oC)Main element O3
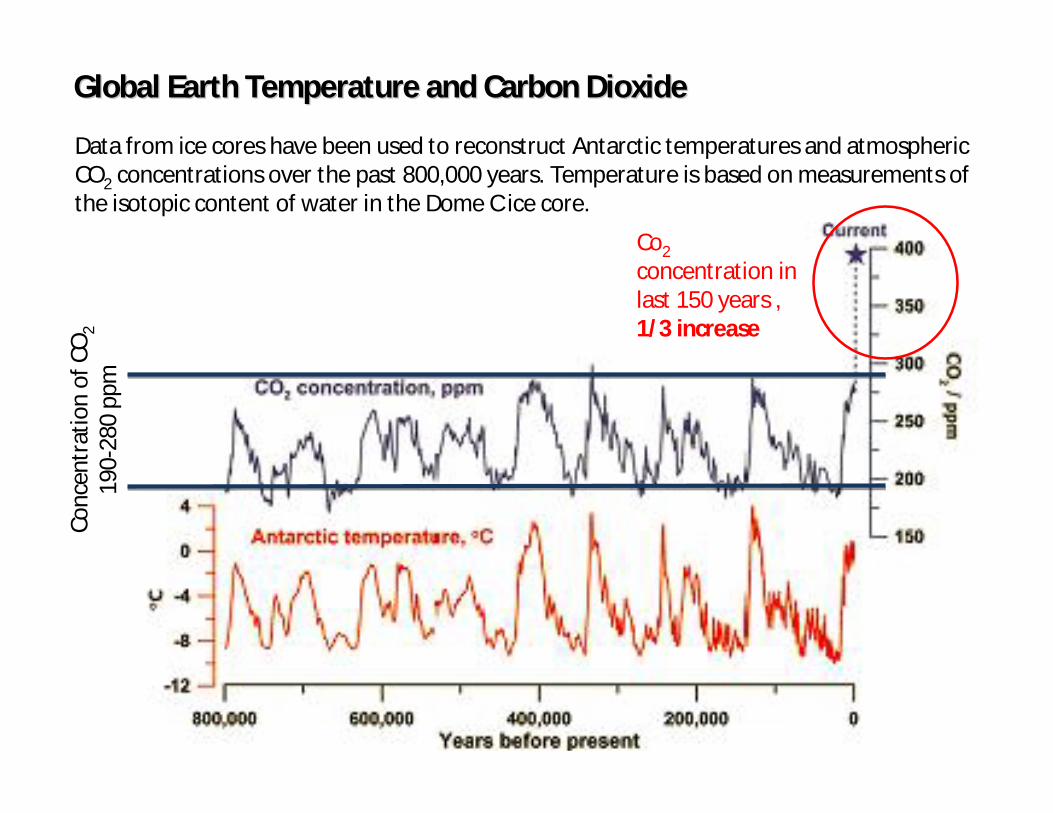
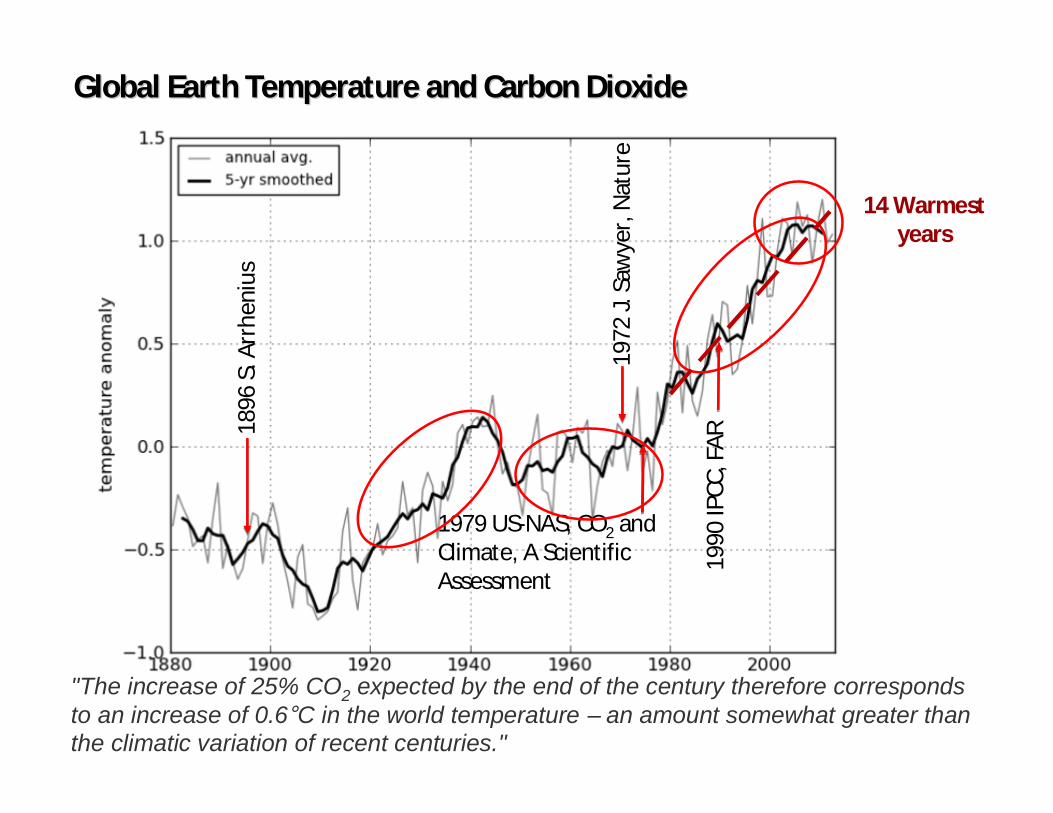
Global Earth Temperature and Carbon Dioxide Global Earth Temperature and Carbon Dioxide
Data from ice cores have been used to reconstruct Antarctic temperatures and atmospheric CO2 concentrations over the past 800,000 years. Temperature is based on measurements of the isotopic content of water in the Dome C ice core.
Conc
entr
atio
n of
CO
2 19
0-28
0 pp
m
Co2 concentration in last 150 years , 1/3 increase
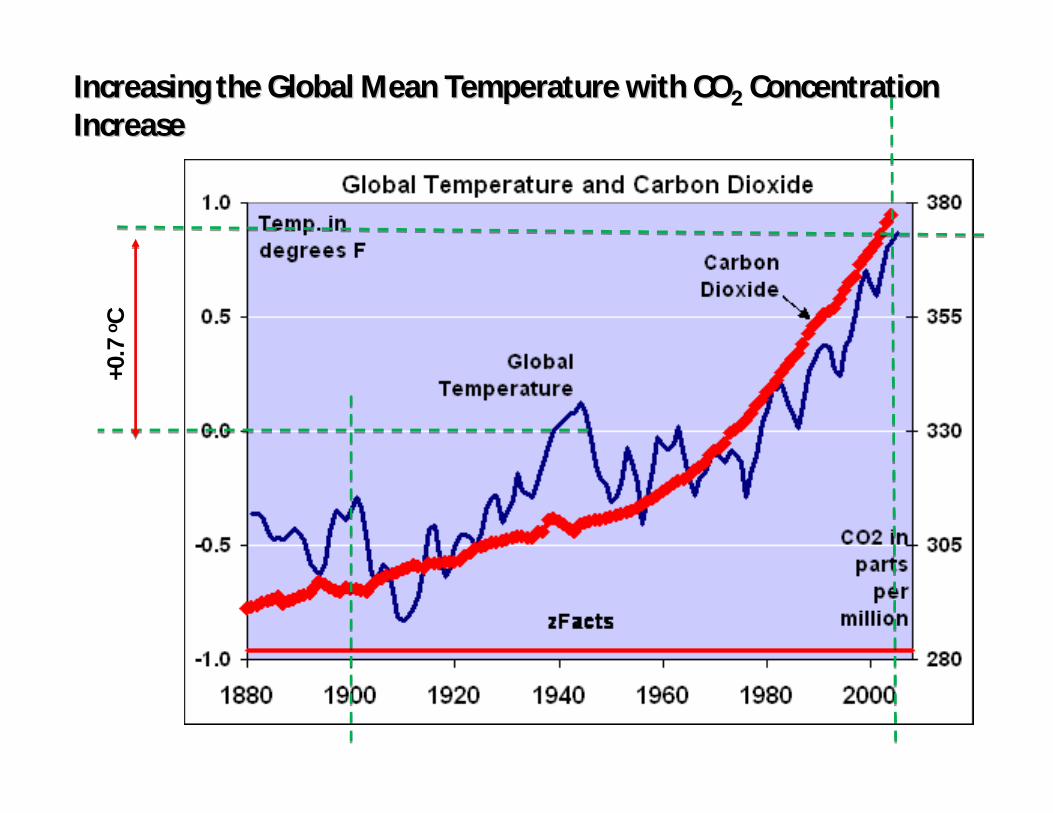
Increasing the Global Mean Temperature with COIncreasing the Global Mean Temperature with CO22 Concentration Concentration IncreaseIncrease
+0.7
o C
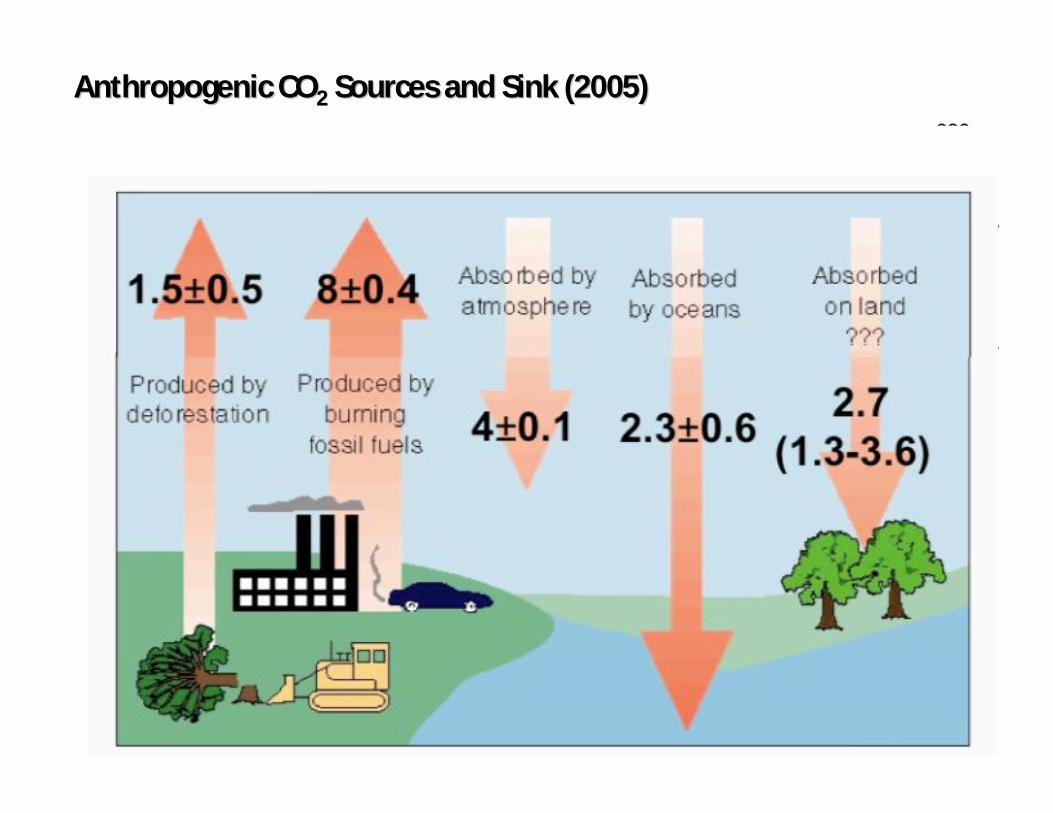
Anthropogenic COAnthropogenic CO22 Sources and Sink (2005)Sources and Sink (2005)
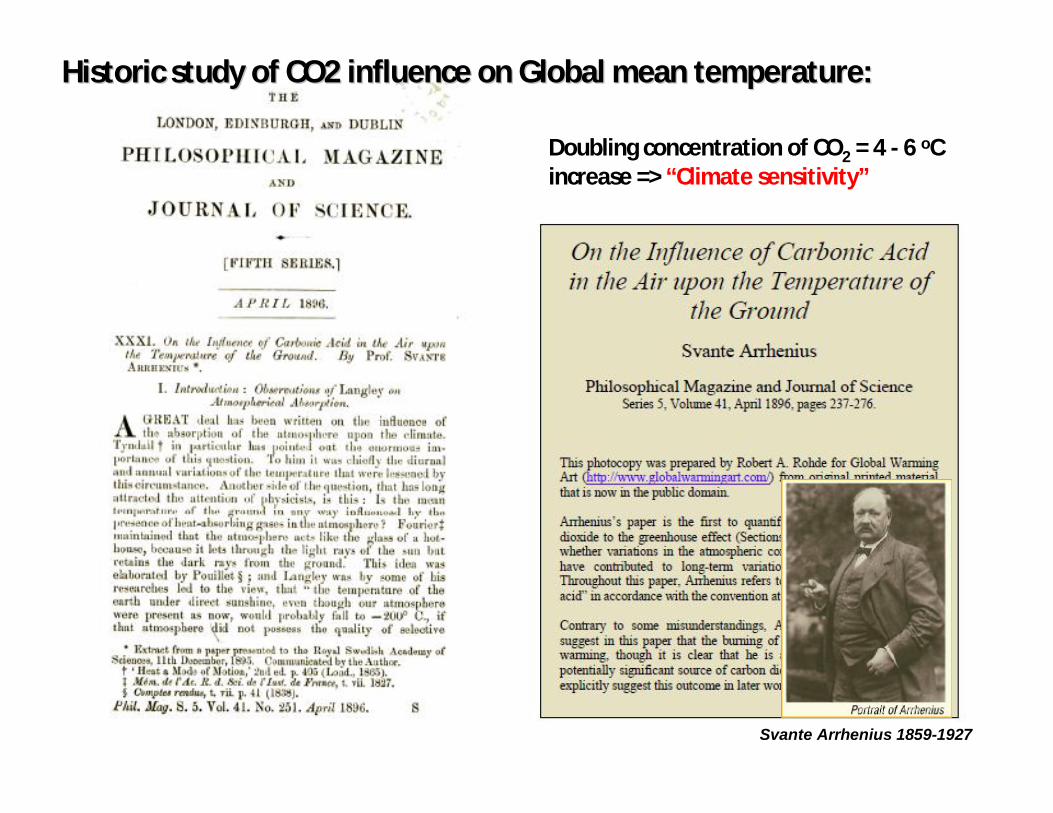
Svante Arrhenius 1859-1927
Historic study of CO2 influence on Global mean temperature: Historic study of CO2 influence on Global mean temperature:
Doubling concentration of CO2 = 4 - 6 oC increase => “Climate sensitivity”
1896
S. A
rrhe
nius
1972
J. S
awye
r, N
atur
e
"The increase of 25% CO2 expected by the end of the century therefore corresponds to an increase of 0.6°C in the world temperature – an amount somewhat greater than the climatic variation of recent centuries."
1979 US-NAS, CO2 and Climate, A Scientific Assessment
1990
IPCC
, FA
R
Global Earth Temperature and Carbon Dioxide Global Earth Temperature and Carbon Dioxide
14 Warmest years
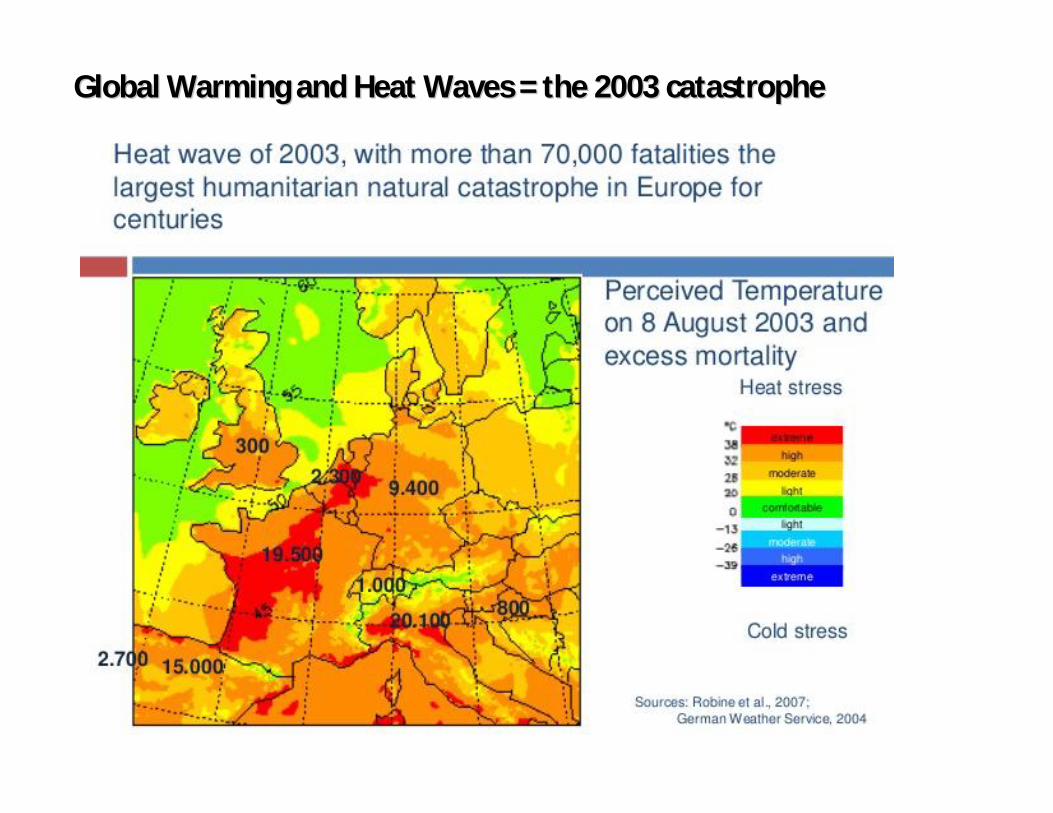
Global Warming and Heat Waves = the 2003 catastropheGlobal Warming and Heat Waves = the 2003 catastrophe

Figure SPM.1bObserved change in surface temperature 1901-2012
All Figures © IPCC 2013
0.5 – 0.8 increase
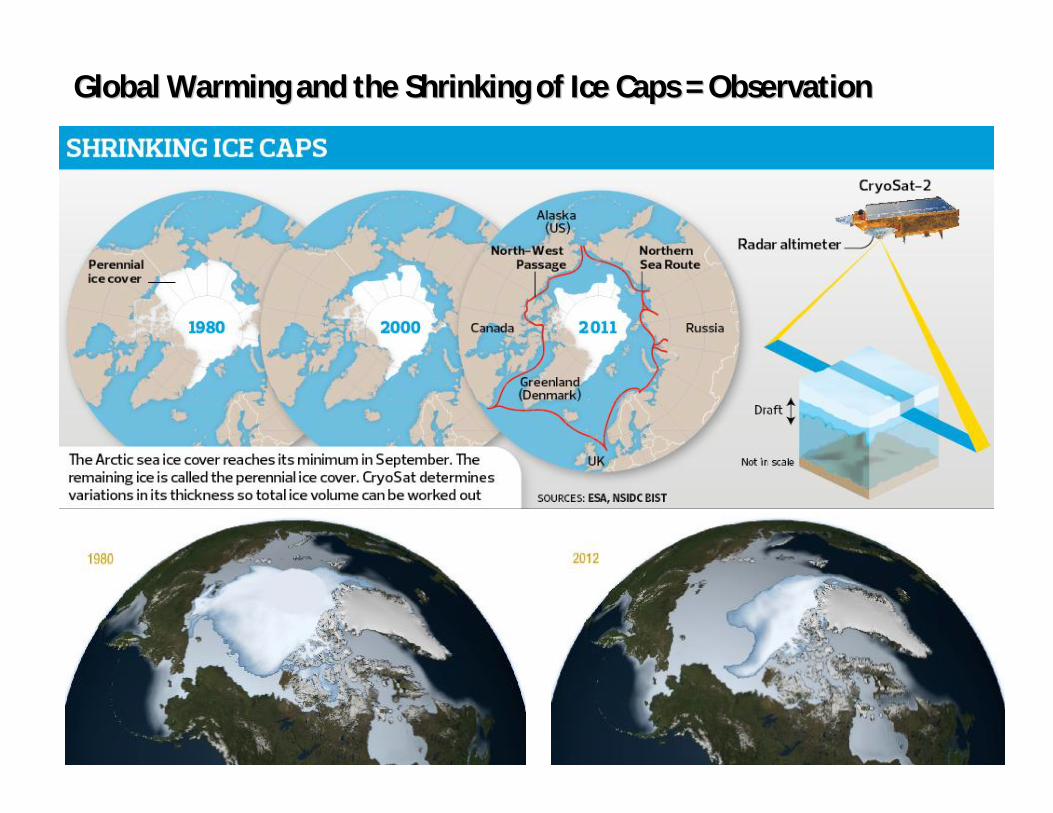
Global Warming and the Shrinking of Ice Caps = ObservationGlobal Warming and the Shrinking of Ice Caps = Observation
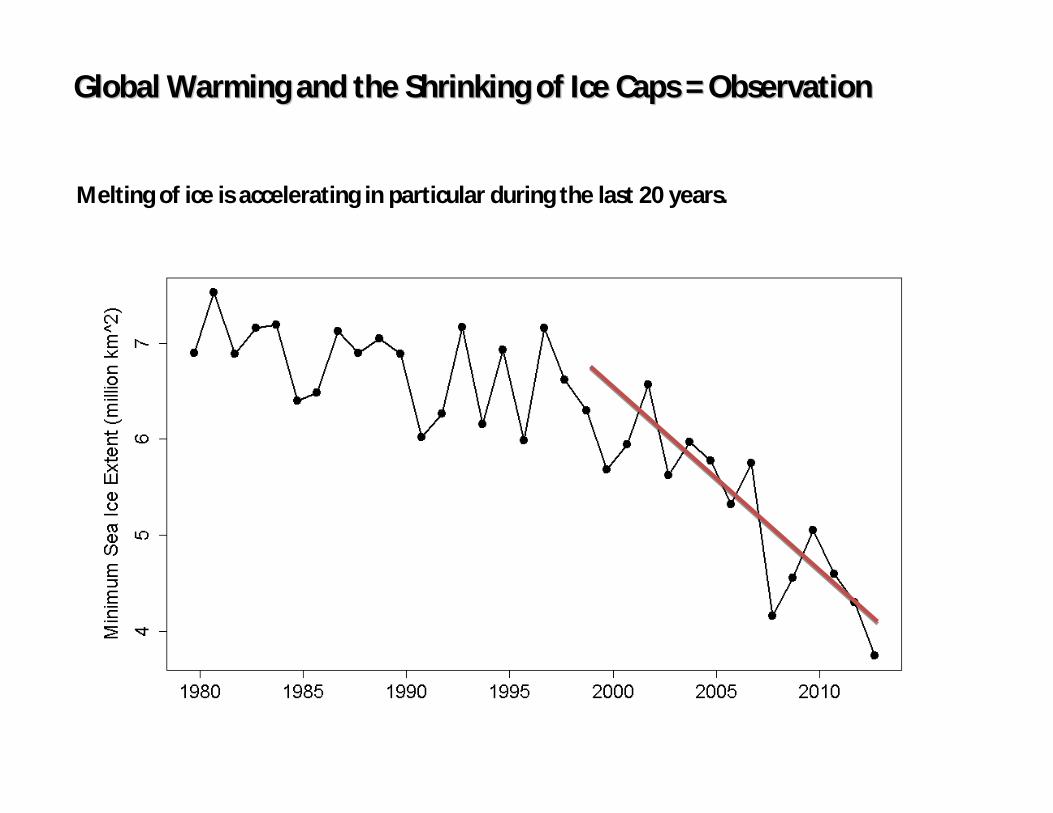
Global Warming and the Shrinking of Ice Caps = ObservationGlobal Warming and the Shrinking of Ice Caps = Observation
Melting of ice is accelerating in particular during the last 20 years.
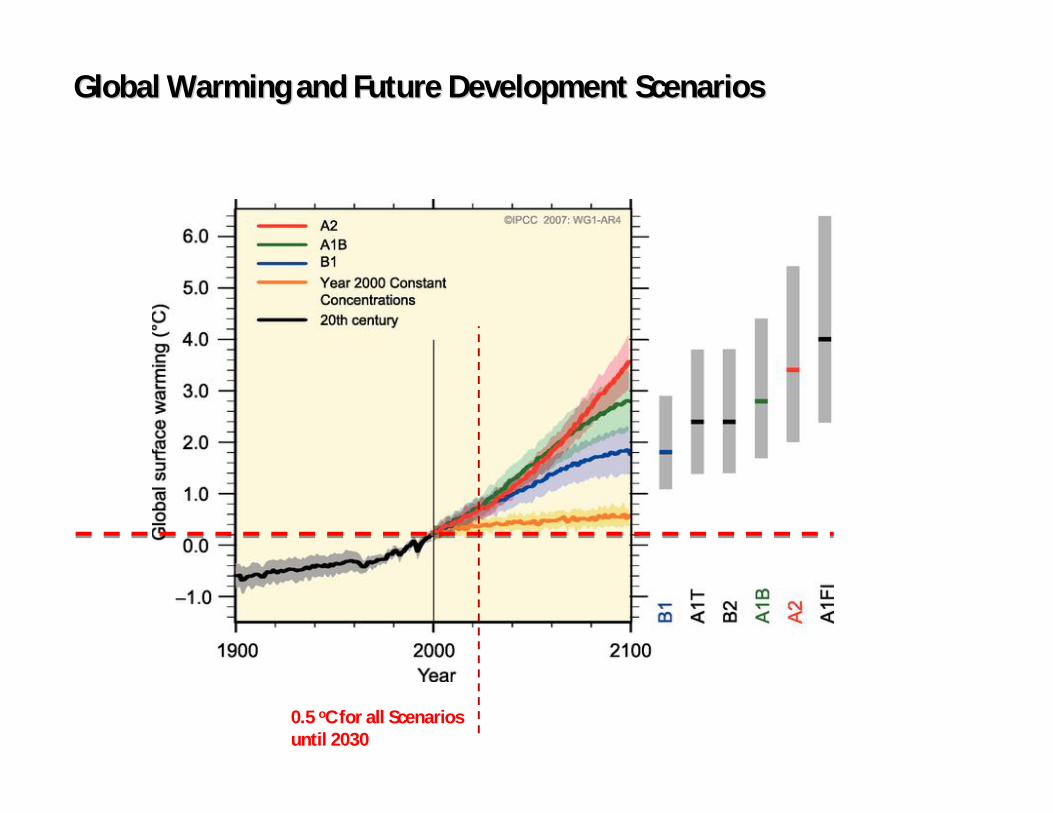
Global Warming and Future Development Scenarios Global Warming and Future Development Scenarios
0.5 oC for all Scenarios until 2030
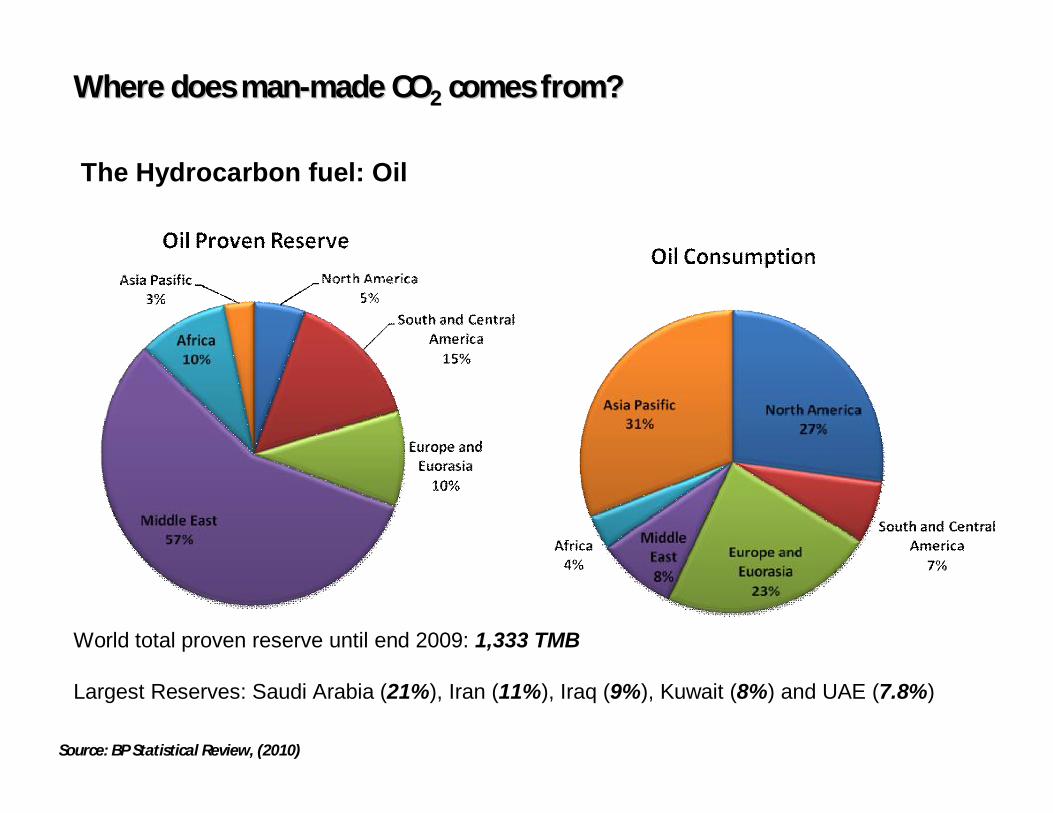
Where does manWhere does man--made COmade CO22 comes from?comes from?
World total proven reserve until end 2009: 1,333 TMB
Largest Reserves: Saudi Arabia (21%), Iran (11%), Iraq (9%), Kuwait (8%) and UAE (7.8%)
The Hydrocarbon fuel: Oil
Source: BP Statistical Review, (2010)
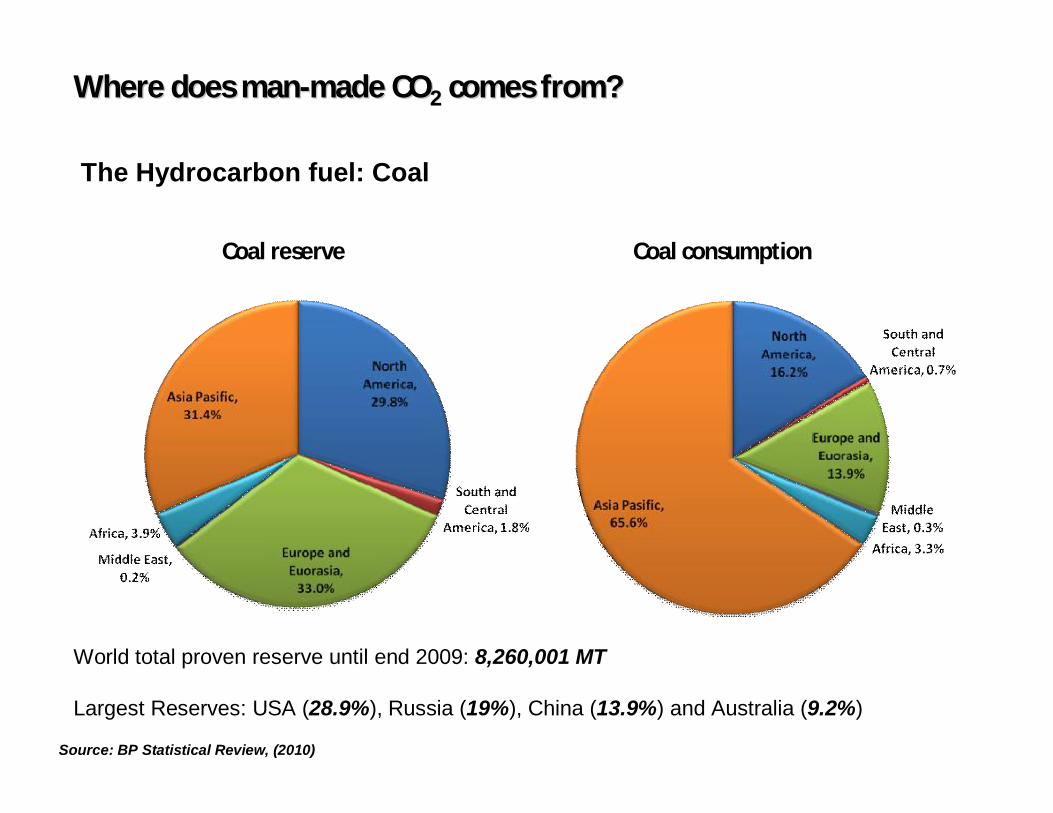
World total proven reserve until end 2009: 8,260,001 MT
Largest Reserves: USA (28.9%), Russia (19%), China (13.9%) and Australia (9.2%)
Source: BP Statistical Review, (2010)
Where does manWhere does man--made COmade CO22 comes from?comes from?
The Hydrocarbon fuel: Coal
Coal reserve Coal consumption
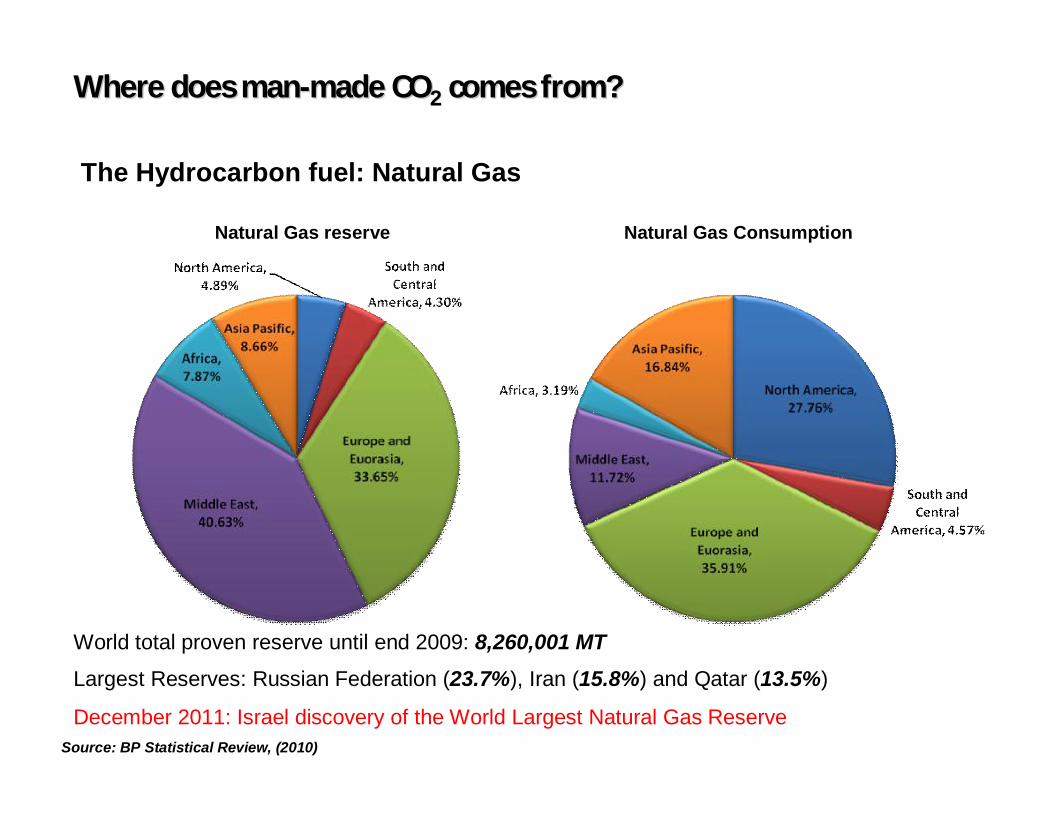
World total proven reserve until end 2009: 8,260,001 MTLargest Reserves: Russian Federation (23.7%), Iran (15.8%) and Qatar (13.5%)
December 2011: Israel discovery of the World Largest Natural Gas ReserveSource: BP Statistical Review, (2010)
Natural Gas Consumption Natural Gas reserve
Where does manWhere does man--made COmade CO22 comes from?comes from?
The Hydrocarbon fuel: Natural Gas
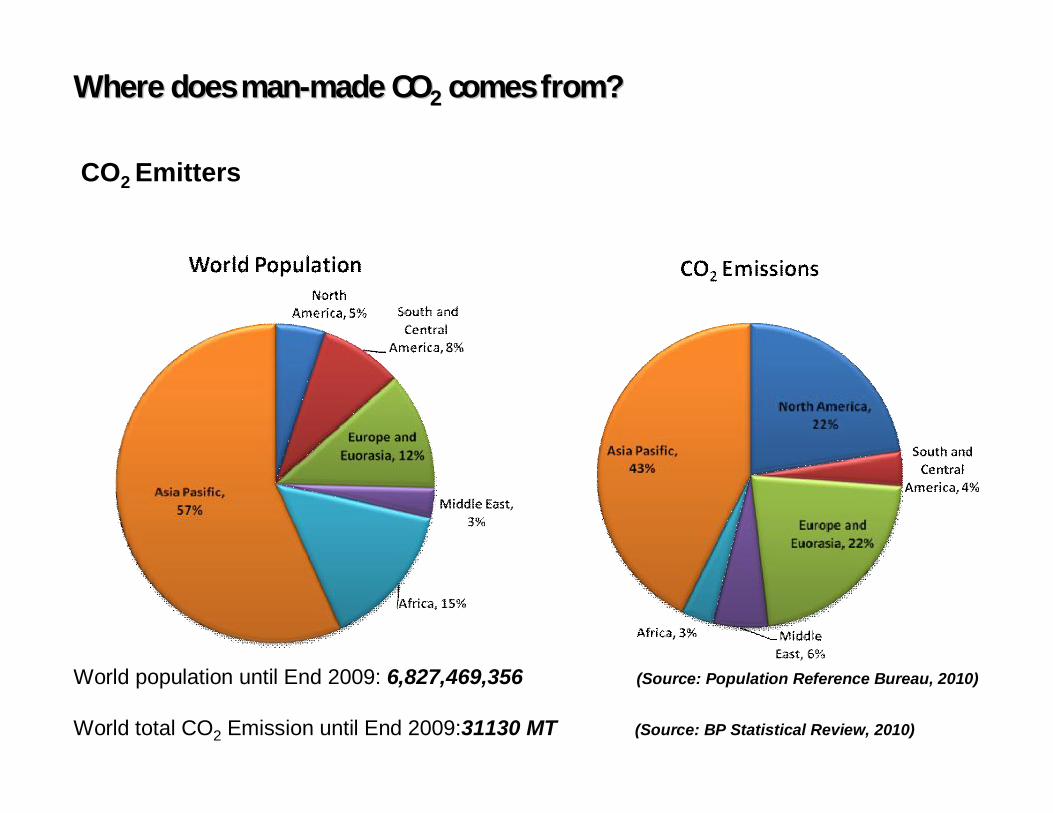
World population until End 2009: 6,827,469,356 (Source: Population Reference Bureau, 2010)
World total CO2 Emission until End 2009:31130 MT (Source: BP Statistical Review, 2010)
Where does manWhere does man--made COmade CO22 comes from?comes from?
CO2 Emitters
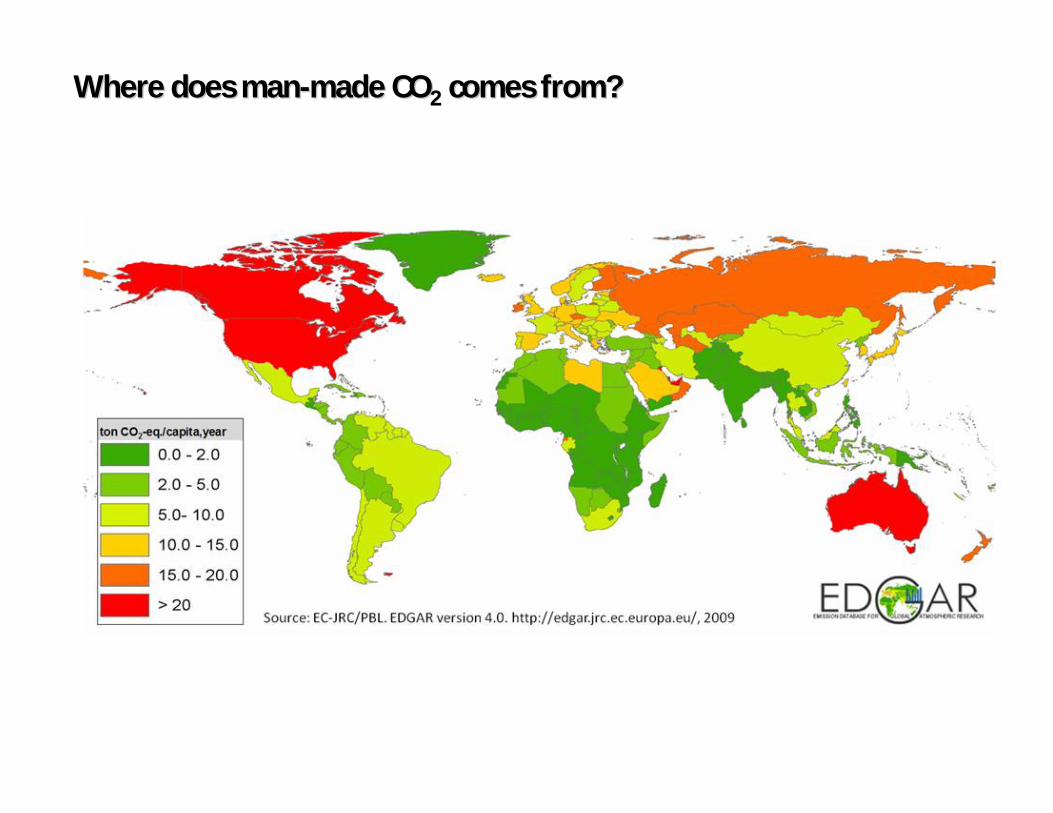
Where does manWhere does man--made COmade CO22 comes from?comes from?
The IPCC and the AR5 Findings
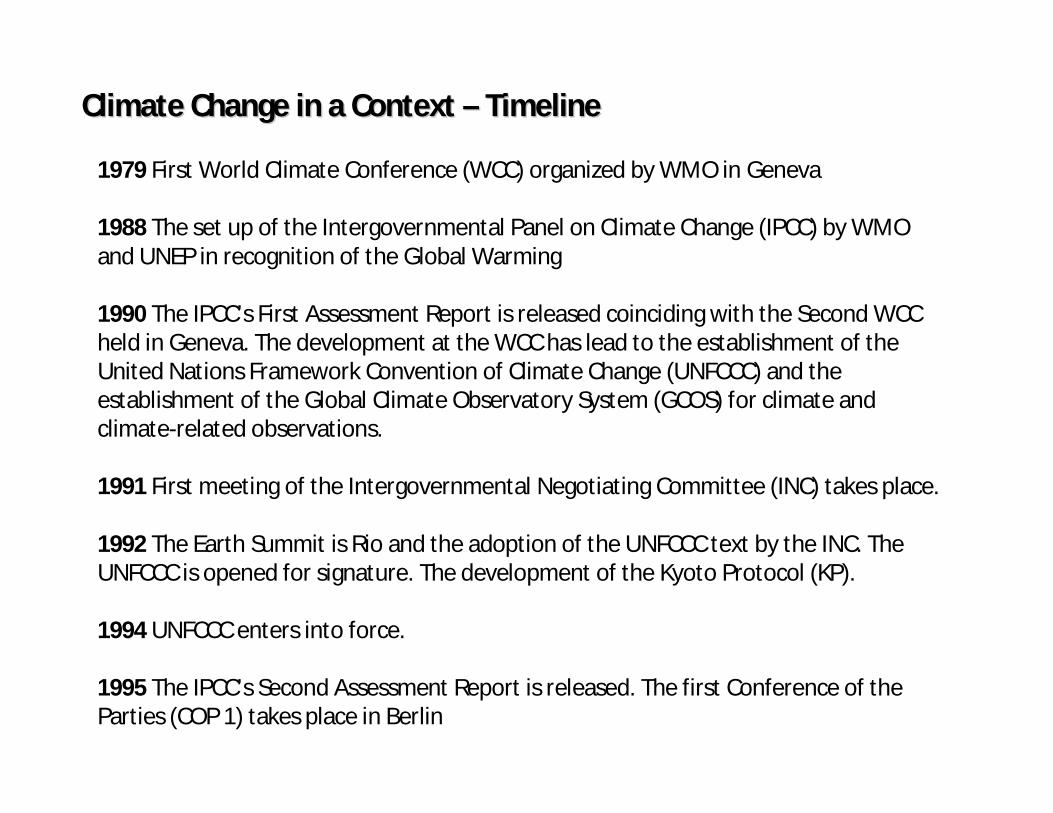
Climate Change in a Context Climate Change in a Context –– TimelineTimeline
1979 First World Climate Conference (WCC) organized by WMO in Geneva
1988 The set up of the Intergovernmental Panel on Climate Change (IPCC) by WMO and UNEP in recognition of the Global Warming
1990 The IPCC’s First Assessment Report is released coinciding with the Second WCC held in Geneva. The development at the WCC has lead to the establishment of the United Nations Framework Convention of Climate Change (UNFCCC) and the establishment of the Global Climate Observatory System (GCOS) for climate and climate-related observations.
1991 First meeting of the Intergovernmental Negotiating Committee (INC) takes place.
1992 The Earth Summit is Rio and the adoption of the UNFCCC text by the INC. The UNFCCC is opened for signature. The development of the Kyoto Protocol (KP).
1994 UNFCCC enters into force.
1995 The IPCC’s Second Assessment Report is released. The first Conference of the Parties (COP 1) takes place in Berlin
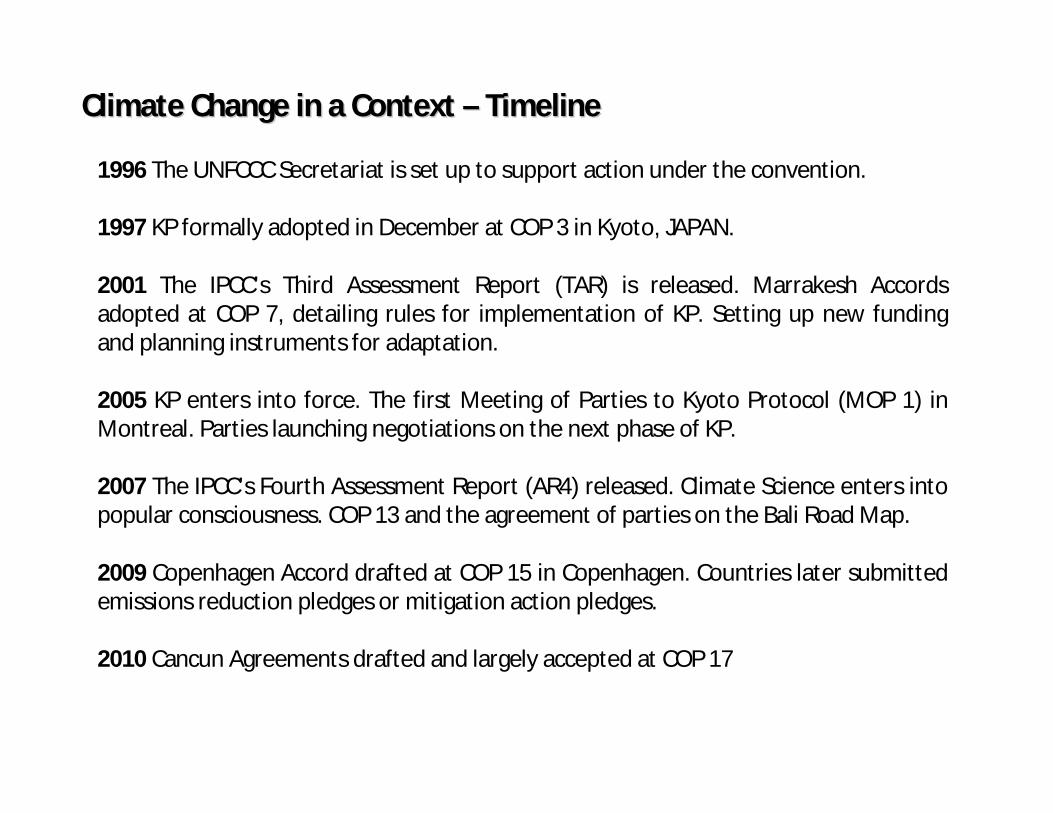
Climate Change in a Context Climate Change in a Context –– TimelineTimeline
1996 The UNFCCC Secretariat is set up to support action under the convention.
1997 KP formally adopted in December at COP 3 in Kyoto, JAPAN.
2001 The IPCC’s Third Assessment Report (TAR) is released. Marrakesh Accords adopted at COP 7, detailing rules for implementation of KP. Setting up new funding and planning instruments for adaptation.
2005 KP enters into force. The first Meeting of Parties to Kyoto Protocol (MOP 1) in Montreal. Parties launching negotiations on the next phase of KP.
2007 The IPCC’s Fourth Assessment Report (AR4) released. Climate Science enters into popular consciousness. COP 13 and the agreement of parties on the Bali Road Map.
2009 Copenhagen Accord drafted at COP 15 in Copenhagen. Countries later submitted emissions reduction pledges or mitigation action pledges.
2010 Cancun Agreements drafted and largely accepted at COP 17
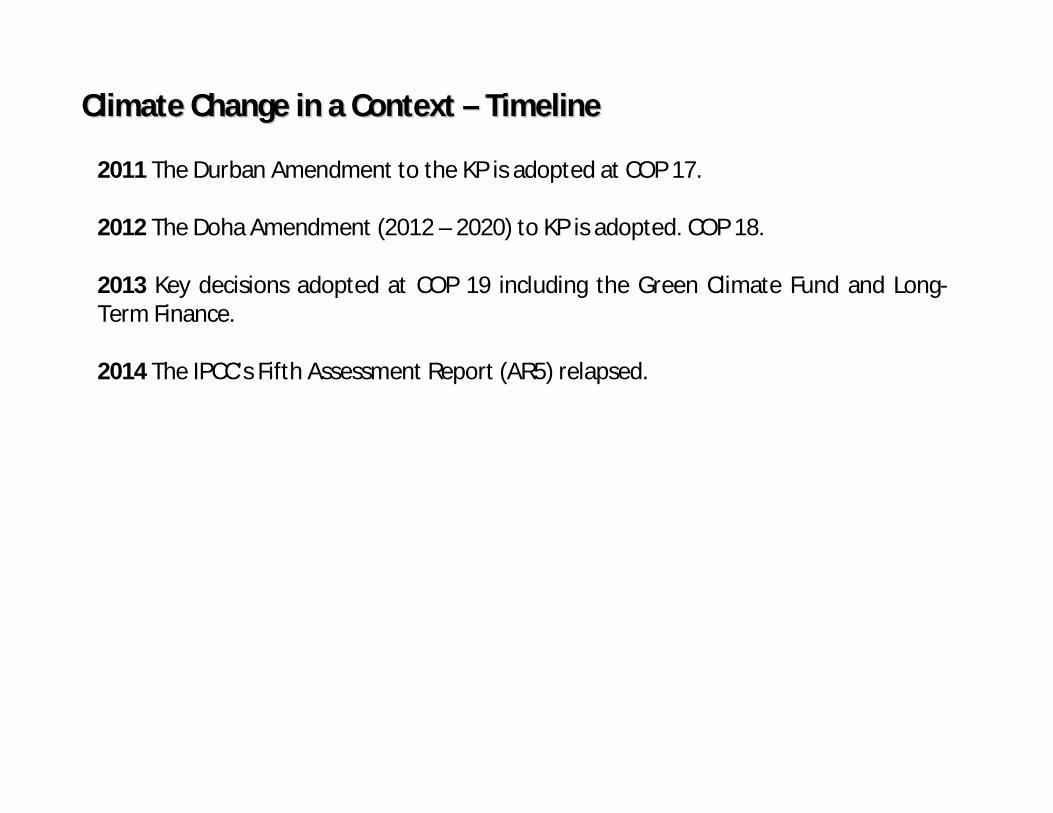
Climate Change in a Context Climate Change in a Context –– TimelineTimeline
2011 The Durban Amendment to the KP is adopted at COP 17.
2012 The Doha Amendment (2012 – 2020) to KP is adopted. COP 18.
2013 Key decisions adopted at COP 19 including the Green Climate Fund and Long-Term Finance.
2014 The IPCC’s Fifth Assessment Report (AR5) relapsed.
The IPCCThe IPCC
Established in 1988 by
qWorld Meteorological Organization (WMO)
q United Nations Environment Program (UNEP)
Supports the UN Framework Convention on Climate Change (UNFCCC)
q Adopted in 1992 and entered into force in 1994.
q Overall policy framework for climate change issue
Its role:"assess on a comprehensive, objective, open and transparent basis the scientific, technical and socio-economic information relevant to understanding the scientific basis of risk of human-induced climate change, its potential impacts and options for adaptation and mitigation“
"The IPCC does not carry out research nor does it monitor climate related data or other relevant parameters. It bases its assessment mainly on peer reviewed and published scientific/technical literature."
Working Group I (WGI) - "The Physical Science Basis"
Working Group II (WGII) - "Impacts, Adaptation and Vulnerability"
Working Group III (WGIII) - "Mitigation of Climate Change"
Task Force on National Greenhouse Gas Inventories
The IPCCThe IPCC
Working Groups and Task Forces
The IPCCThe IPCC
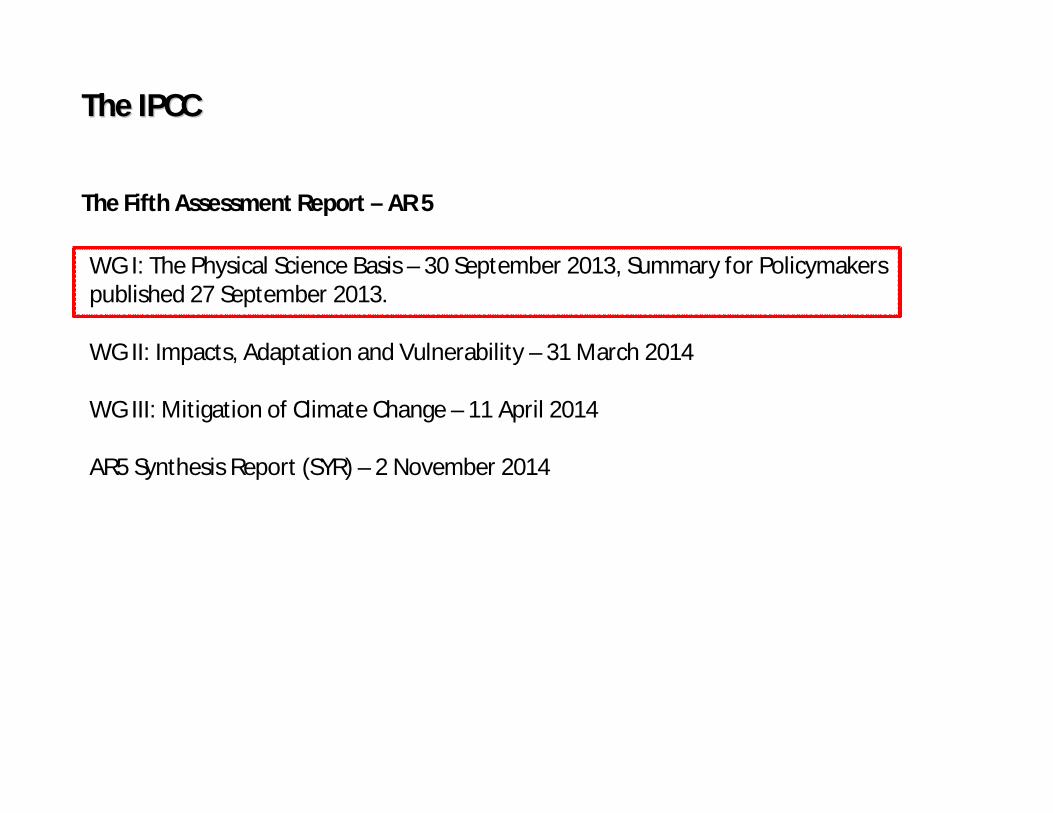
The Fifth Assessment Report – AR 5
WG I: The Physical Science Basis – 30 September 2013, Summary for Policymakers published 27 September 2013.
WG II: Impacts, Adaptation and Vulnerability – 31 March 2014
WG III: Mitigation of Climate Change – 11 April 2014
AR5 Synthesis Report (SYR) – 2 November 2014
© Yann Arthus-Bertrand / Altitude
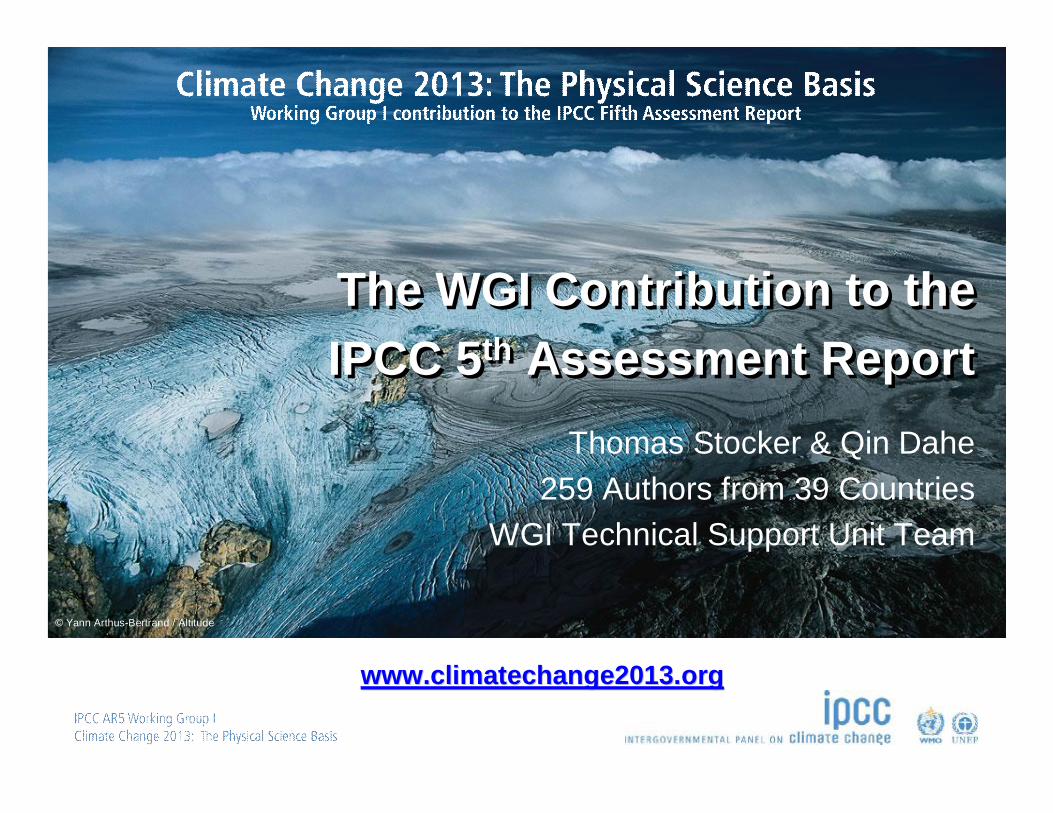
The WGI Contribution to theIPCC 5th Assessment ReportThe WGI Contribution to theIPCC 5th Assessment Report
Thomas Stocker & Qin Dahe259 Authors from 39 Countries
WGI Technical Support Unit Team
www.climatechange2013.orgwww.climatechange2013.org
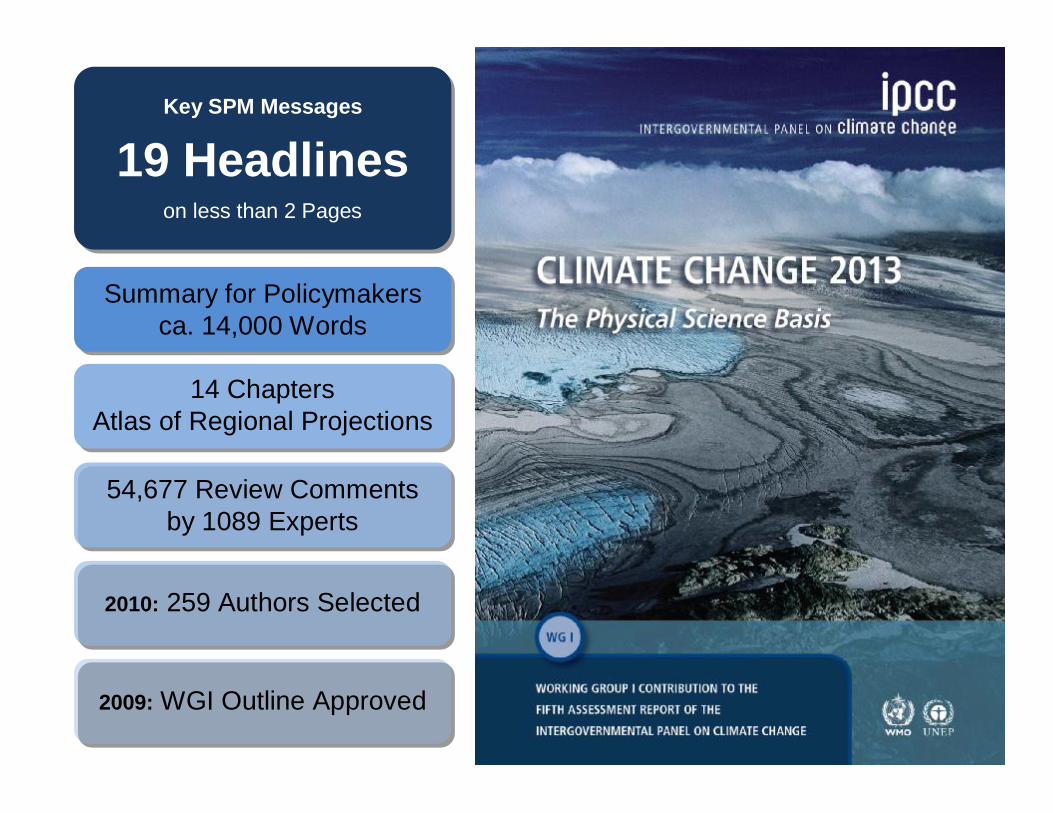
Key SPM Messages
19 Headlineson less than 2 Pages
2009: WGI Outline Approved
14 ChaptersAtlas of Regional Projections
54,677 Review Commentsby 1089 Experts
2010: 259 Authors Selected
Summary for Policymakersca. 14,000 Words
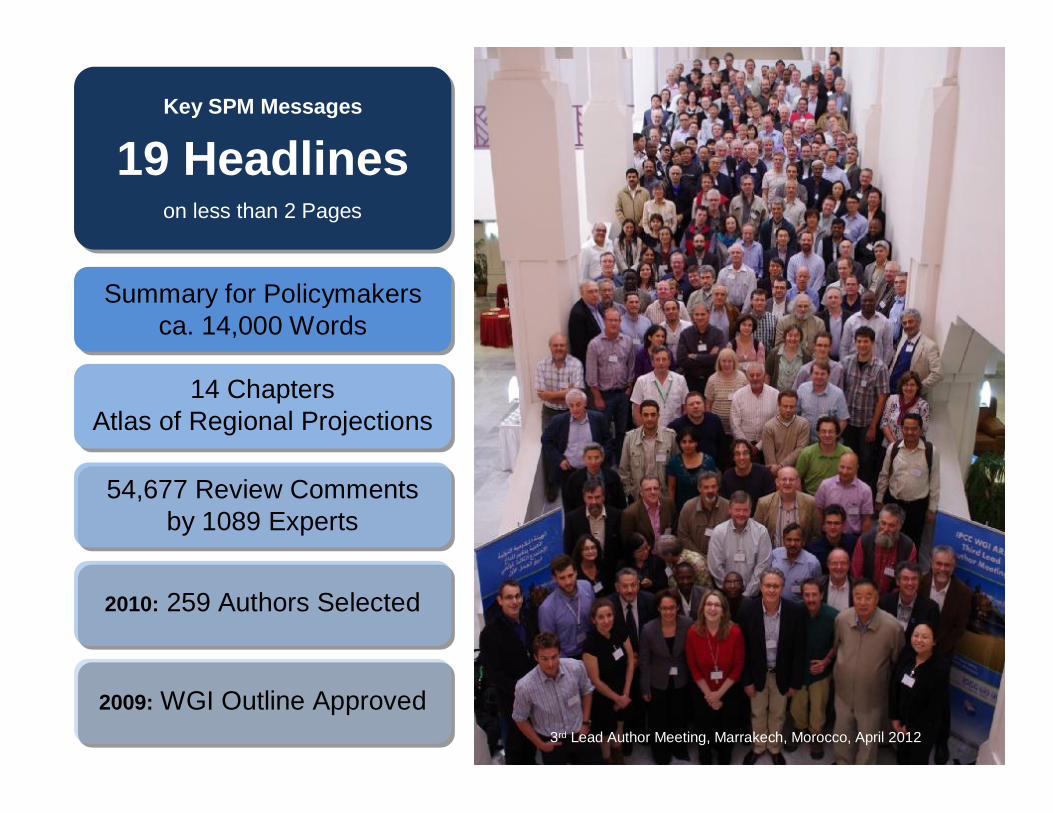
Key SPM Messages
19 Headlineson less than 2 Pages
2009: WGI Outline Approved
14 ChaptersAtlas of Regional Projections
54,677 Review Commentsby 1089 Experts
2010: 259 Authors Selected
Summary for Policymakersca. 14,000 Words
3rd Lead Author Meeting, Marrakech, Morocco, April 2012
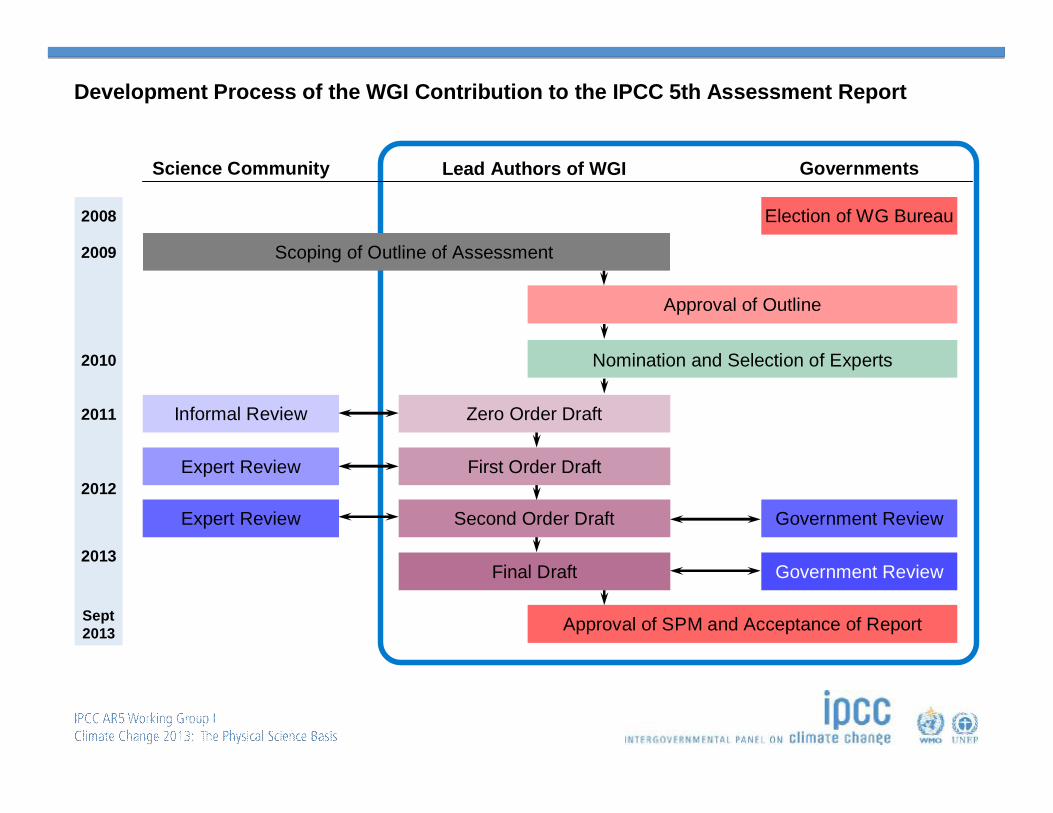
Development Process of the WGI Contribution to the IPCC 5th Assessment Report
Science Community
Scoping of Outline of Assessment
Informal Review
Expert Review
Expert Review
2011
2010
2012
2013
Governments
Approval of Outline
Nomination and Selection of Experts
Zero Order Draft
First Order Draft
Government ReviewSecond Order Draft
Final Draft Government Review
Approval of SPM and Acceptance of Report
Lead Authors of WGI
Election of WG Bureau
2009
2008
Sept2013
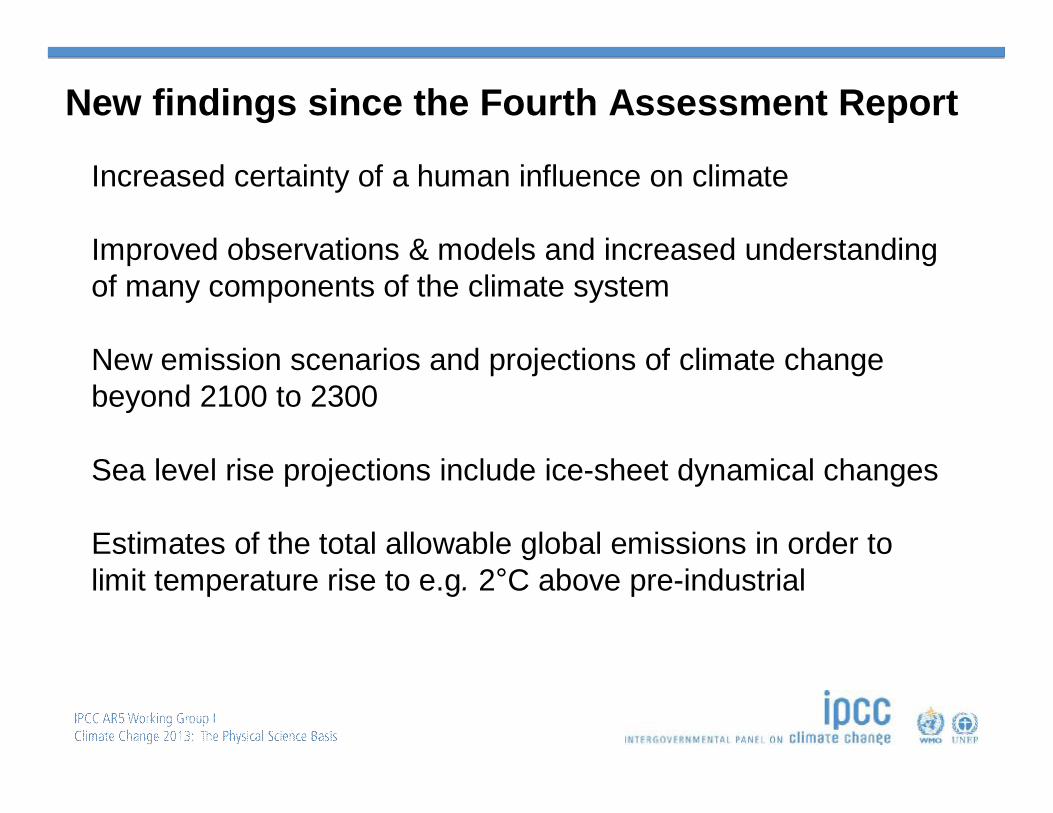
New findings since the Fourth Assessment Report
Increased certainty of a human influence on climate
Improved observations & models and increased understanding of many components of the climate system
New emission scenarios and projections of climate change beyond 2100 to 2300
Sea level rise projections include ice-sheet dynamical changes
Estimates of the total allowable global emissions in order to limit temperature rise to e.g. 2°C above pre-industrial
WGI Summary for Policymakers
Figures
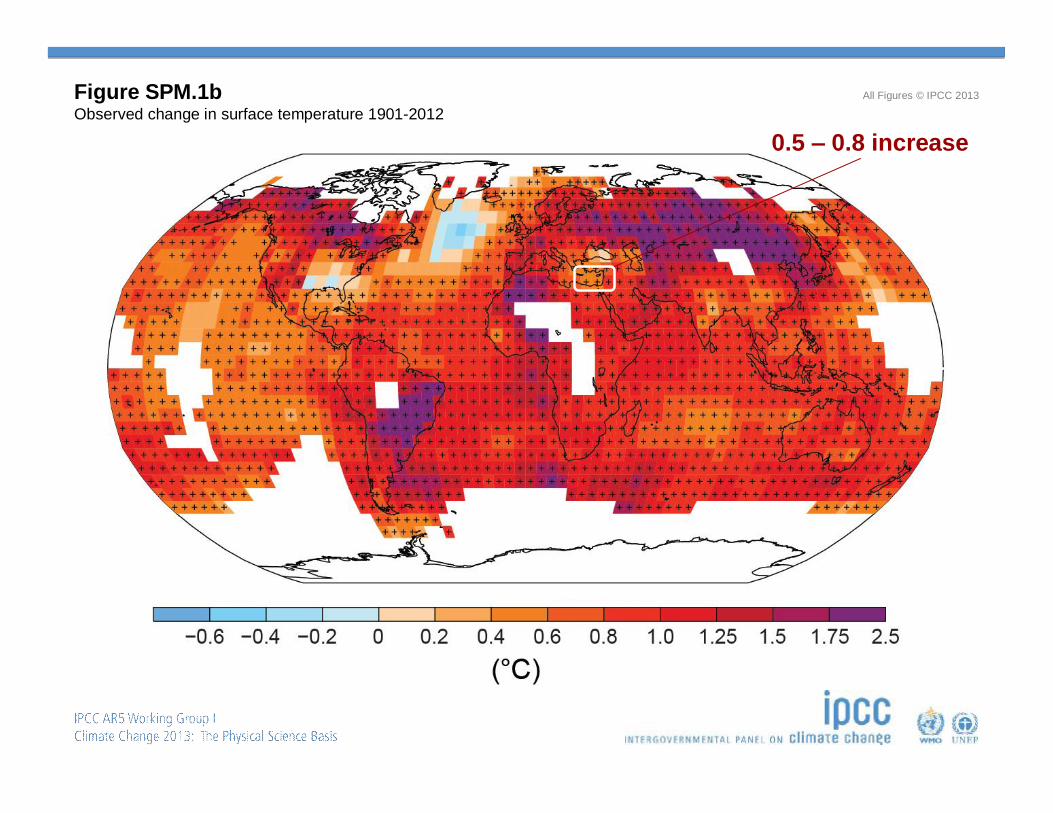
Figure SPM.1bObserved change in surface temperature 1901-2012
All Figures © IPCC 2013
0.5 – 0.8 increase
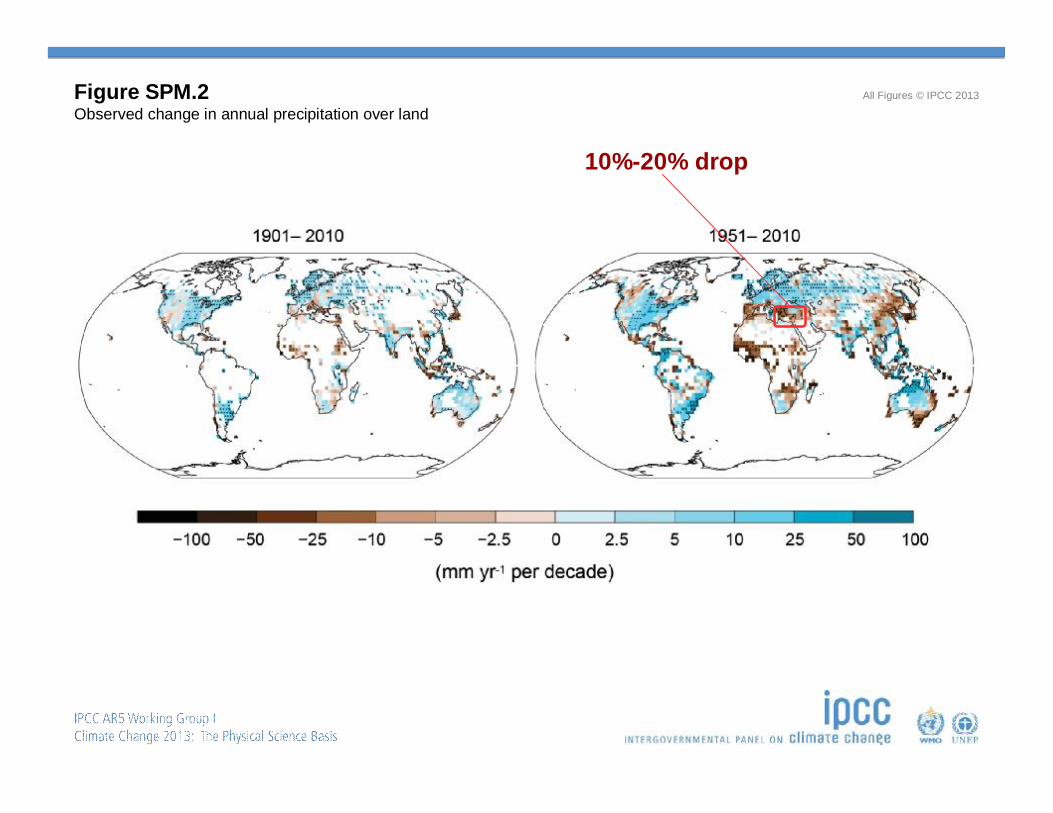
Figure SPM.2Observed change in annual precipitation over land
All Figures © IPCC 2013
10%-20% drop
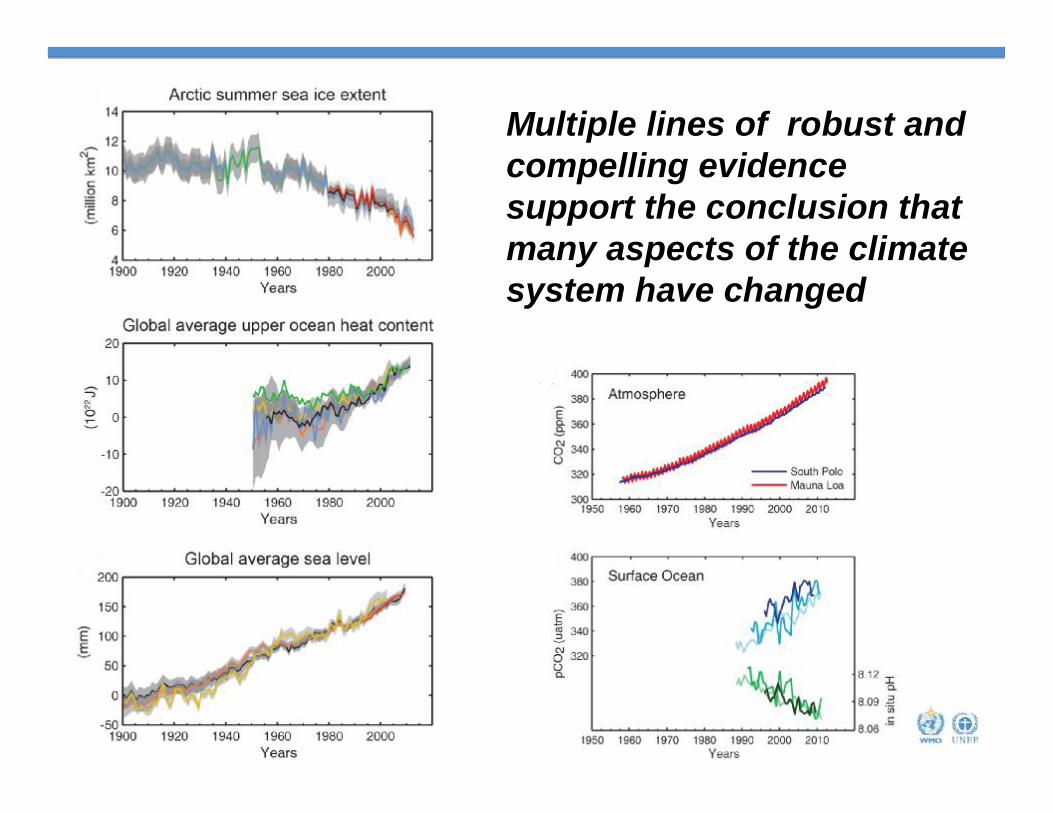
Multiple lines of robust and compelling evidence support the conclusion that many aspects of the climate system have changed
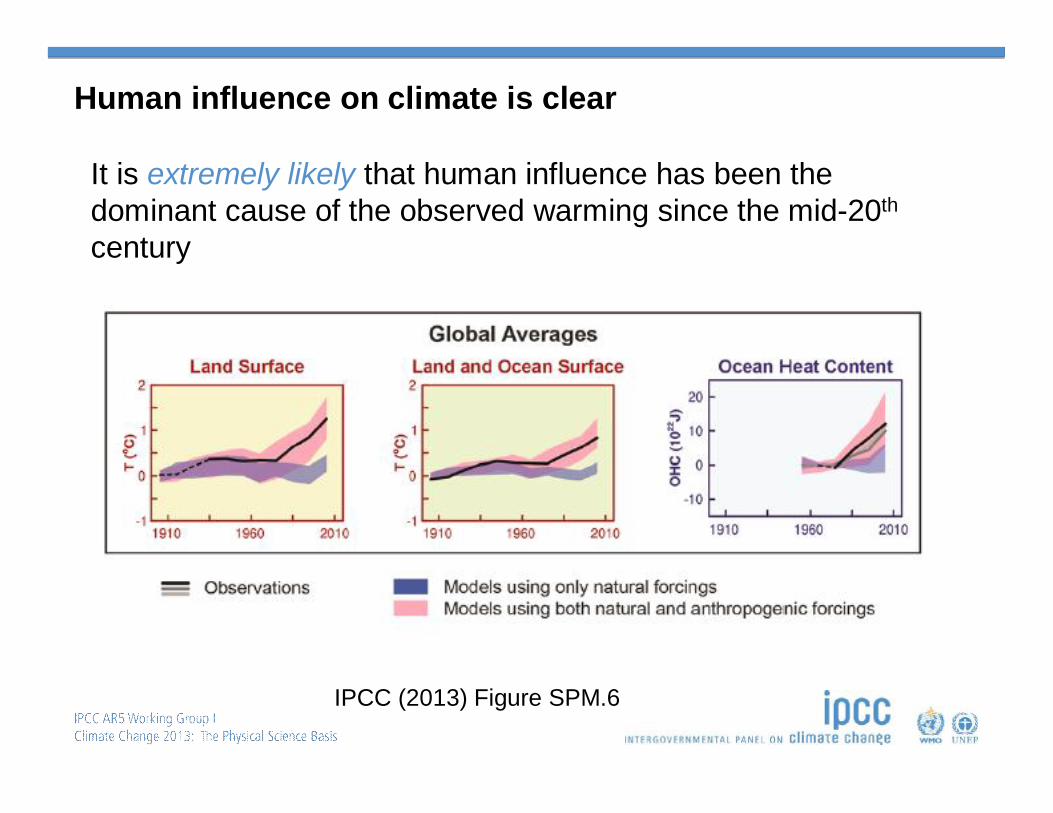
It is extremely likely that human influence has been the dominant cause of the observed warming since the mid-20th
century
Increased certainty since the Fourth Assessment Report from a combination of improved observations, models and scientific understanding
Human influence on climate is clear
IPCC (2013) Figure SPM.6
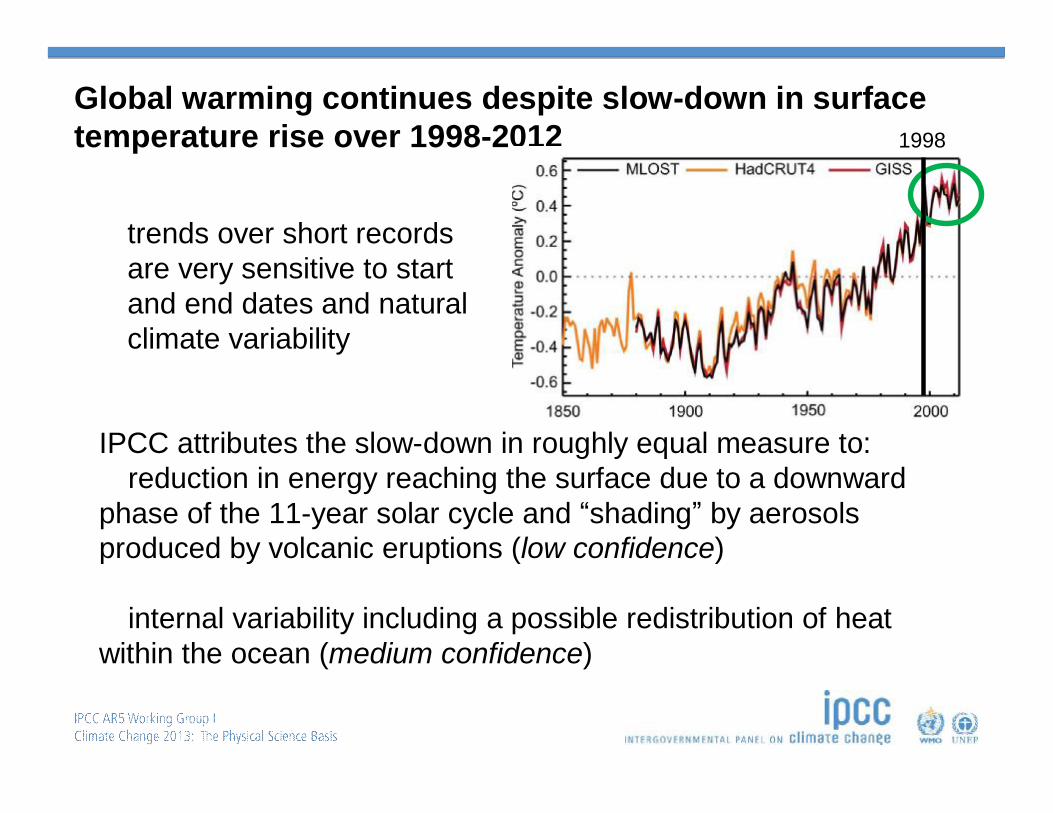
Global warming continues despite slow-down in surface temperature rise over 1998-2012 1998
⇒ trends over short records are very sensitive to start and end dates and natural climate variability
IPCC attributes the slow-down in roughly equal measure to:⇒reduction in energy reaching the surface due to a downward phase of the 11-year solar cycle and “shading” by aerosols produced by volcanic eruptions (low confidence)
⇒internal variability including a possible redistribution of heatwithin the ocean (medium confidence)
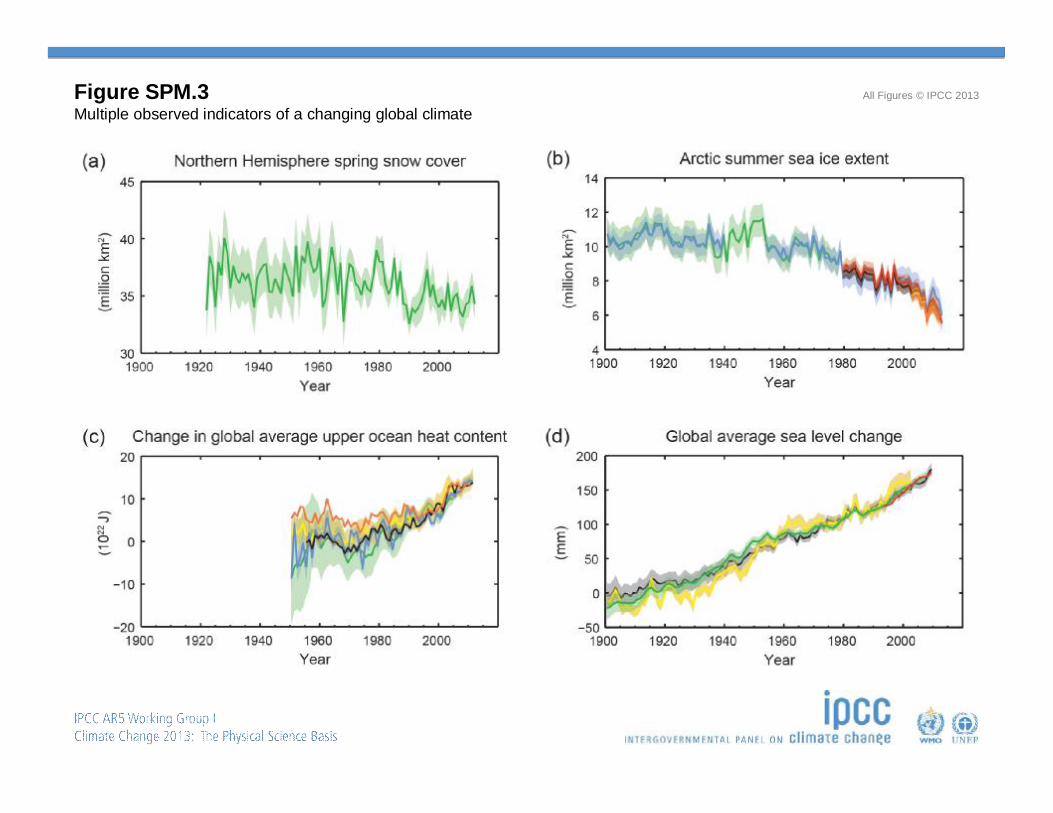
Figure SPM.3Multiple observed indicators of a changing global climate
All Figures © IPCC 2013
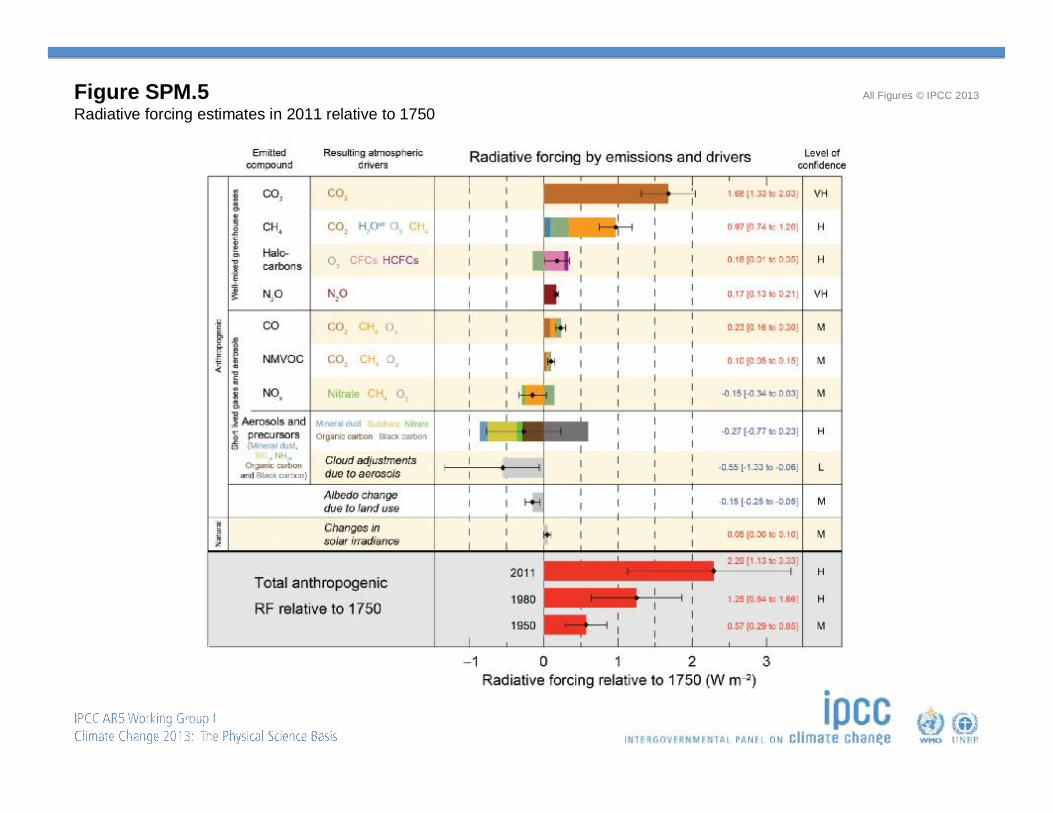
Figure SPM.5Radiative forcing estimates in 2011 relative to 1750
All Figures © IPCC 2013
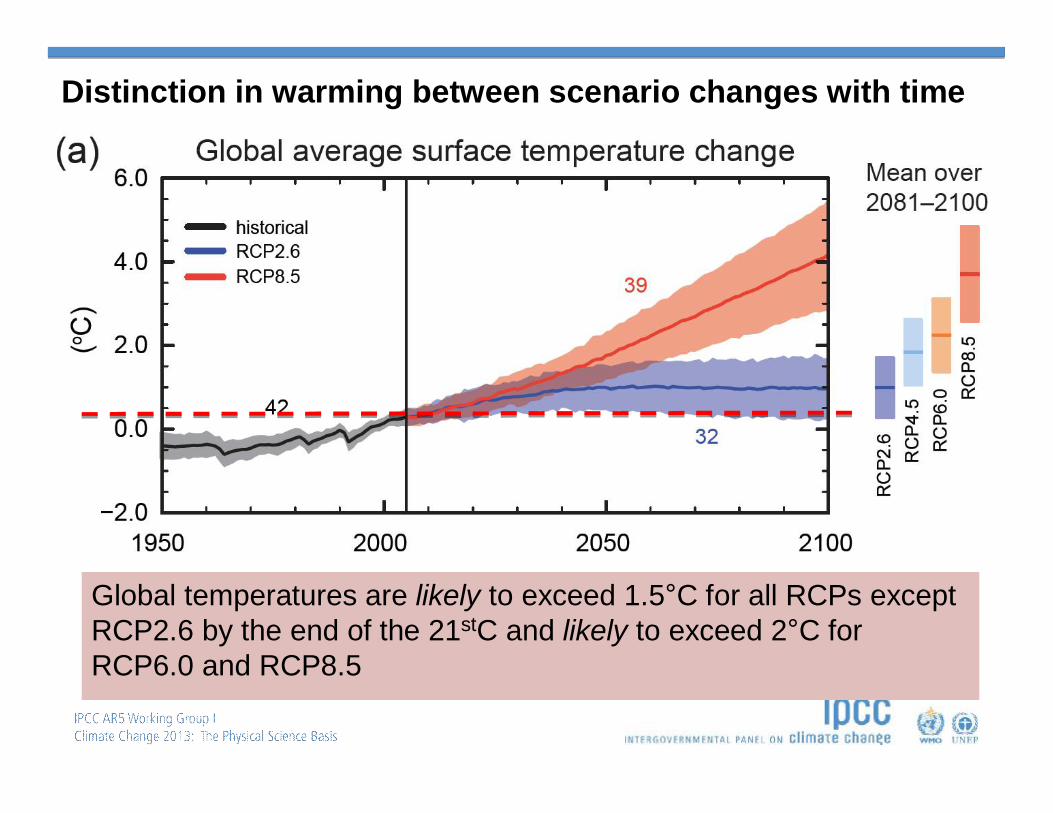
IPCC (2013) Figure SPM.7Global temperatures are likely to exceed 1.5°C for all RCPs except RCP2.6 by the end of the 21stC and likely to exceed 2°C for RCP6.0 and RCP8.5
Distinction in warming between scenario changes with time
Headlines of the IPCC WGI 5th Assessment Report
=> Warming is unequivocal. Many observed changes are unprecedented on timescales of decades or millennia
=> Human influence on climate is clear
=> Climate will continue to change in future
=> Limiting future climate change will require substantial and sustained reductions in emissions
WGI Summary for Policymakers
Headline Statements
Observed Changes in the Climate System (1/2)
Warming of the climate system is unequivocal, and since the 1950s, many of the observed changes are unprecedented over decades to millennia. The atmosphere and ocean have warmed, the amounts of snow and ice have diminished, sea level has risen, and the concentrations of greenhouse gases have increased.
Warming of the climate system is unequivocal, and since the 1950s, many of the observed changes are unprecedented over decades to millennia. The atmosphere and ocean have warmed, the amounts of snow and ice have diminished, sea level has risen, and the concentrations of greenhouse gases have increased.
Each of the last three decades has been successively warmer at the Earth’s surface than any preceding decade since 1850. In the Northern Hemisphere, 1983–2012 was likely the warmest 30-year period of the last 1400 years (medium confidence).
Ocean warming dominates the increase in energy stored in the climate system, accounting for more than 90% of the energy accumulated between 1971 and 2010 (high confidence). It is virtually certain that the upper ocean (0–700 m) warmed from 1971 to 2010, and it likelywarmed between the 1870s and 1971.
Over the last two decades, the Greenland and Antarctic ice sheets have been losing mass, glaciers have continued to shrink almost worldwide, and Arctic sea ice and Northern Hemisphere spring snow cover have continued to decrease in extent (high confidence).
Observed Changes in the Climate System (2/2)
The rate of sea level rise since the mid-19th century has been larger than the mean rate during the previous two millennia (high confidence). Over the period 1901 to 2010, global mean sea level rose by 0.19 [0.17 to 0.21] m.
The atmospheric concentrations of carbon dioxide, methane, and nitrous oxide have increased to levels unprecedented in at least the last 800,000 years. Carbon dioxide concentrations have increased by 40% since pre-industrial times, primarily from fossil fuel emissions and secondarily from net land use change emissions. The ocean has absorbed about 30% of the emitted anthropogenic carbon dioxide, causing ocean acidification.
Drivers of Climate Change (1/1)
Total radiative forcing is positive, and has led to an uptake of energy by the climate system. The largest contribution to total radiative forcing is caused by the increase in the atmospheric concentration of CO2 since 1750.
Total radiative forcing is positive, and has led to an uptake of energy by the climate system. The largest contribution to total radiative forcing is caused by the increase in the atmospheric concentration of CO2 since 1750.
Understanding the Climate System and its Recent Changes (1/1)
Human influence on the climate system is clear. This is evident from the increasing greenhouse gas concentrations in the atmosphere, positive radiative forcing, observed warming, and understanding of the climate system.
Human influence on the climate system is clear. This is evident from the increasing greenhouse gas concentrations in the atmosphere, positive radiative forcing, observed warming, and understanding of the climate system.
Climate models have improved since the AR4. Models reproduce observed continental-scale surface temperature patterns and trends over many decades, including the more rapid warming since the mid-20th century and the cooling immediately following large volcanic eruptions (very high confidence).
Observational and model studies of temperature change, climate feedbacks and changes in the Earth’s energy budget together provide confidence in the magnitude of global warming in response to past and future forcing.
Human influence has been detected in warming of the atmosphere and the ocean, in changes in the global water cycle, in reductions in snow and ice, in global mean sea level rise, and in changes in some climate extremes. This evidence for human influence has grown since AR4. It is extremely likely that human influence has been the dominant cause of the observedwarming since the mid-20th century.
Future Global and Regional Climate Change (1/2)
Continued emissions of greenhouse gases will cause further warming and changes in all components of the climate system. Limiting climate change will require substantial and sustained reductions of greenhouse gas emissions.
Continued emissions of greenhouse gases will cause further warming and changes in all components of the climate system. Limiting climate change will require substantial and sustained reductions of greenhouse gas emissions.
Global surface temperature change for the end of the 21st century is likely to exceed 1.5°C relative to 1850 to 1900 for all RCP scenarios except RCP2.6. It is likely to exceed 2°C for RCP6.0 and RCP8.5, and more likely than not to exceed 2°C for RCP4.5. Warming will continue beyond 2100 under all RCP scenarios except RCP2.6. Warming will continue to exhibit interannual-to-decadal variability and will not be regionally uniform.
Changes in the global water cycle in response to the warming over the 21st century will not be uniform. The contrast in precipitation between wet and dry regions and between wet and dry seasons will increase, although there may be regional exceptions.
The global ocean will continue to warm during the 21st century. Heat will penetrate from the surface to the deep ocean and affect ocean circulation.
Future Global and Regional Climate Change (2/2)
It is very likely that the Arctic sea ice cover will continue to shrink and thin and that Northern Hemisphere spring snow cover will decrease during the 21st century as global mean surface temperature rises. Global glacier volume will further decrease.
Global mean sea level will continue to rise during the 21st century. Under all RCP scenarios, the rate of sea level rise will very likely exceed that observed during 1971 to 2010 due to increased ocean warming and increased loss of mass from glaciers and ice sheets.
Climate change will affect carbon cycle processes in a way that will exacerbate the increase of CO2 in the atmosphere (high confidence). Further uptake of carbon by the ocean will increase ocean acidification.
Cumulative emissions of CO2 largely determine global mean surface warming by the late 21st century and beyond. Most aspects of climate change will persist for many centuries even if emissions of CO2 are stopped. This represents a substantial multi-century climate change commitment created by past, present and future emissions of CO2.

Prediction
Climate Change:
East Mediterranean and Palestine
GLOWA – Jordan River
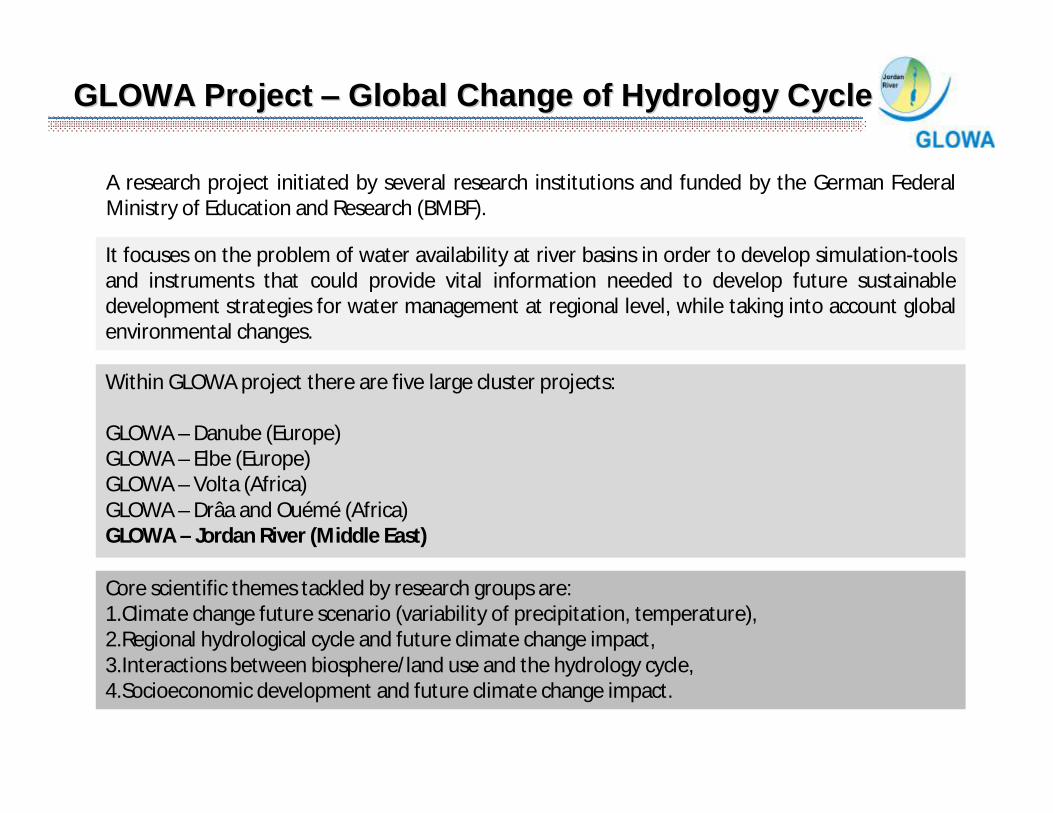
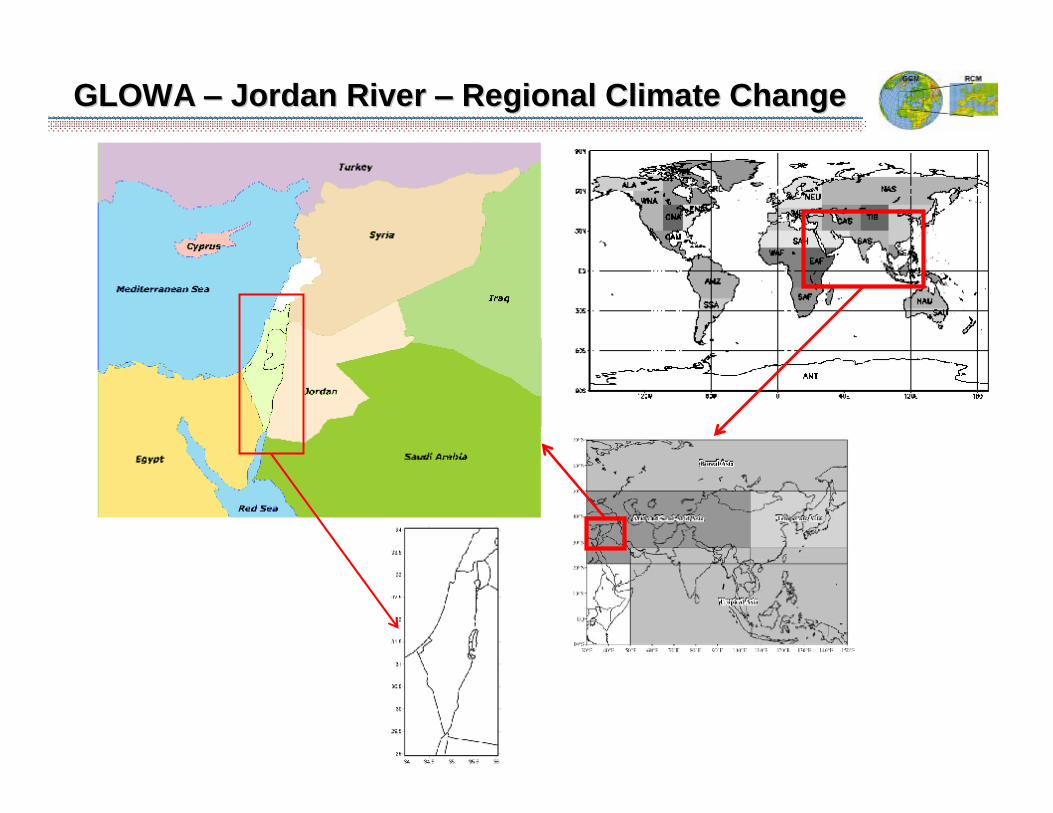
A research project initiated by several research institutions and funded by the German Federal Ministry of Education and Research (BMBF).
It focuses on the problem of water availability at river basins in order to develop simulation-tools and instruments that could provide vital information needed to develop future sustainable development strategies for water management at regional level, while taking into account global environmental changes.
Within GLOWA project there are five large cluster projects:
GLOWA – Danube (Europe)GLOWA – Elbe (Europe)GLOWA – Volta (Africa)GLOWA – Drâa and Ouémé (Africa)GLOWA – Jordan River (Middle East)
Core scientific themes tackled by research groups are:1.Climate change future scenario (variability of precipitation, temperature), 2.Regional hydrological cycle and future climate change impact,3.Interactions between biosphere/land use and the hydrology cycle,4.Socioeconomic development and future climate change impact.
GLOWA Project GLOWA Project –– Global Change of Hydrology CycleGlobal Change of Hydrology Cycle
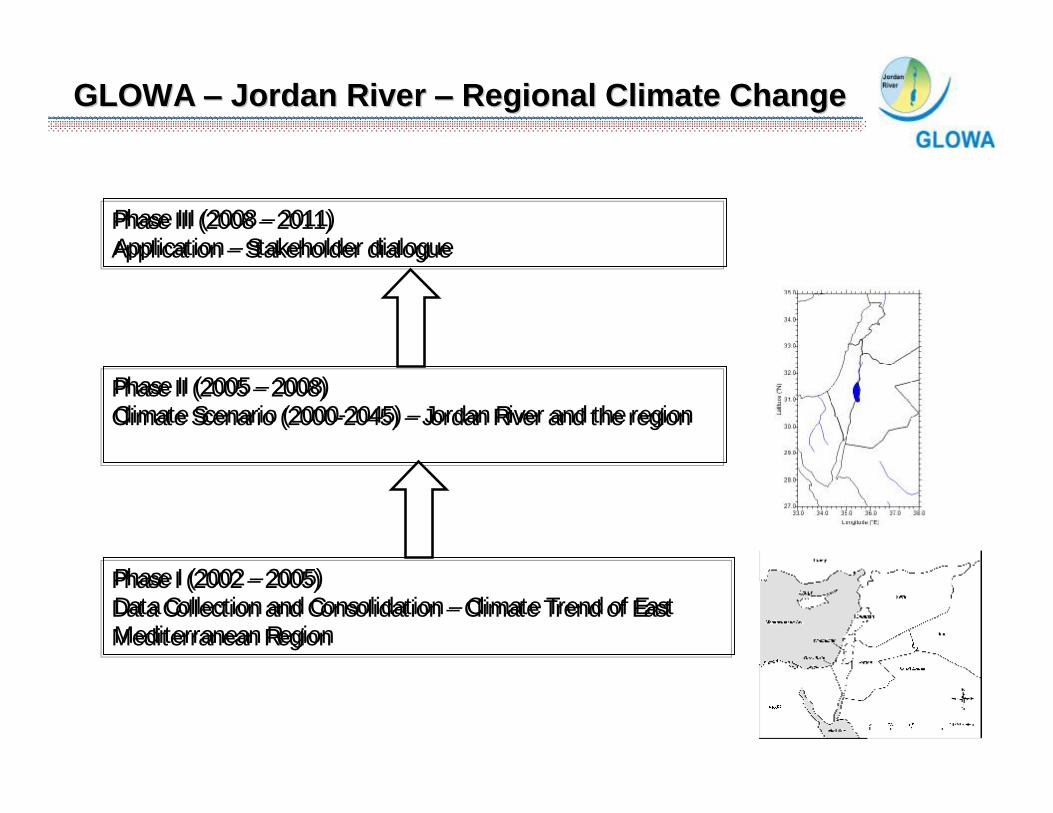
Phase I (2002 – 2005)Data Collection and Consolidation – Climate Trend of East Mediterranean Region
Phase I (2002 – 2005)Data Collection and Consolidation – Climate Trend of East Mediterranean Region
Phase II (2005 – 2008)Climate Scenario (2000-2045) – Jordan River and the region Phase II (2005 – 2008)Climate Scenario (2000-2045) – Jordan River and the region
Phase III (2008 – 2011)Application – Stakeholder dialogue Phase III (2008 – 2011)Application – Stakeholder dialogue
GLOWA GLOWA –– Jordan River Jordan River –– Regional Climate ChangeRegional Climate Change
GLOWA GLOWA –– Jordan River Jordan River –– Regional Climate ChangeRegional Climate Change
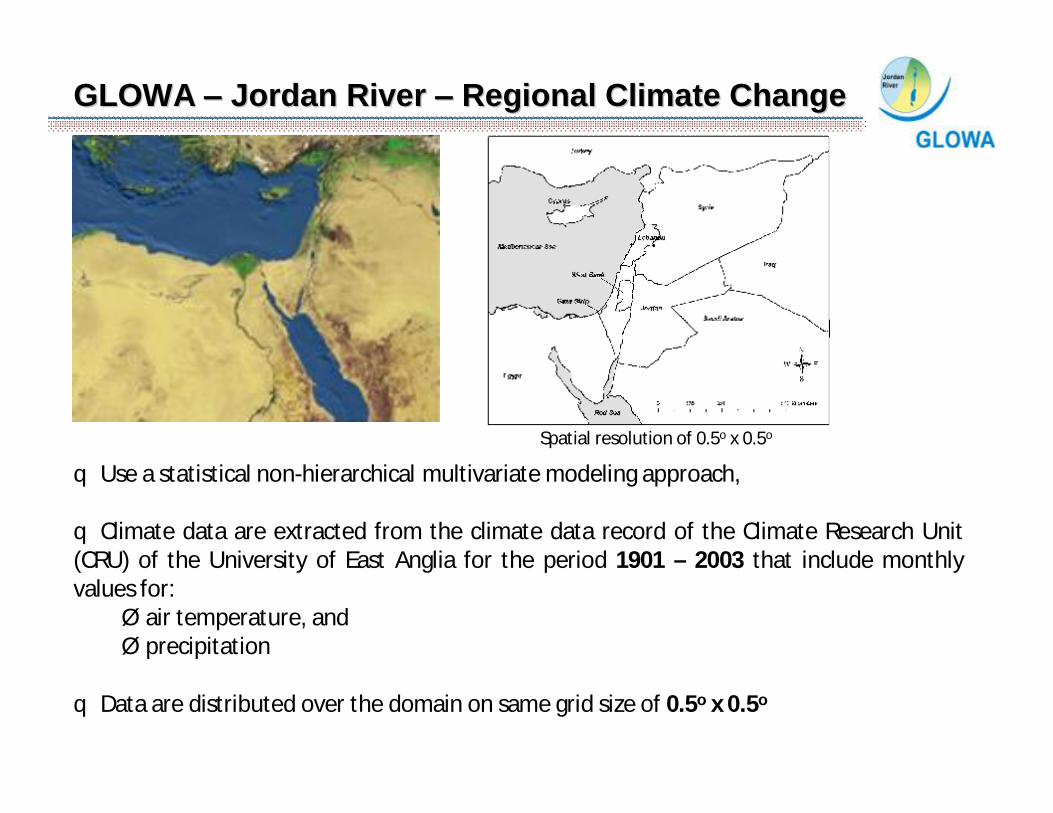
q Use a statistical non-hierarchical multivariate modeling approach,
q Climate data are extracted from the climate data record of the Climate Research Unit (CRU) of the University of East Anglia for the period 1901 – 2003 that include monthly values for:Ø air temperature, and Ø precipitation
q Data are distributed over the domain on same grid size of 0.5o x 0.5o
Spatial resolution of 0.5o x 0.5o
GLOWA GLOWA –– Jordan River Jordan River –– Regional Climate ChangeRegional Climate Change
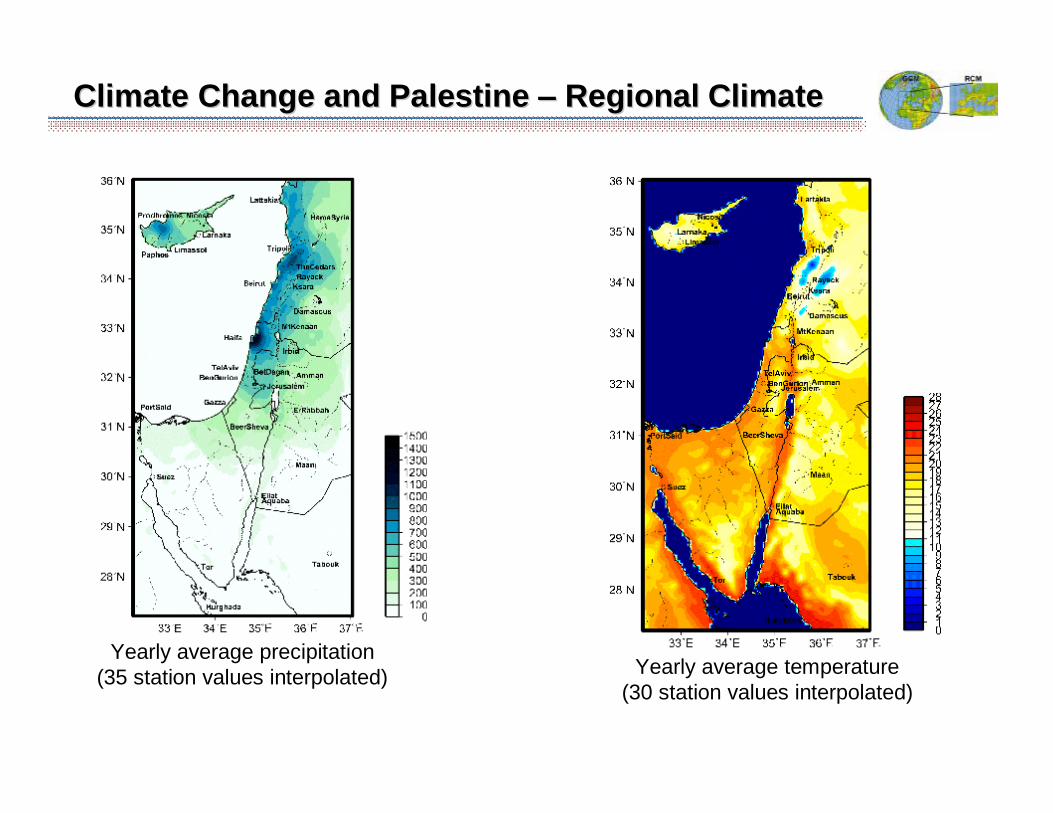
Yearly average precipitation (35 station values interpolated) Yearly average temperature
(30 station values interpolated)
Climate Change and Palestine Climate Change and Palestine –– Regional ClimateRegional Climate
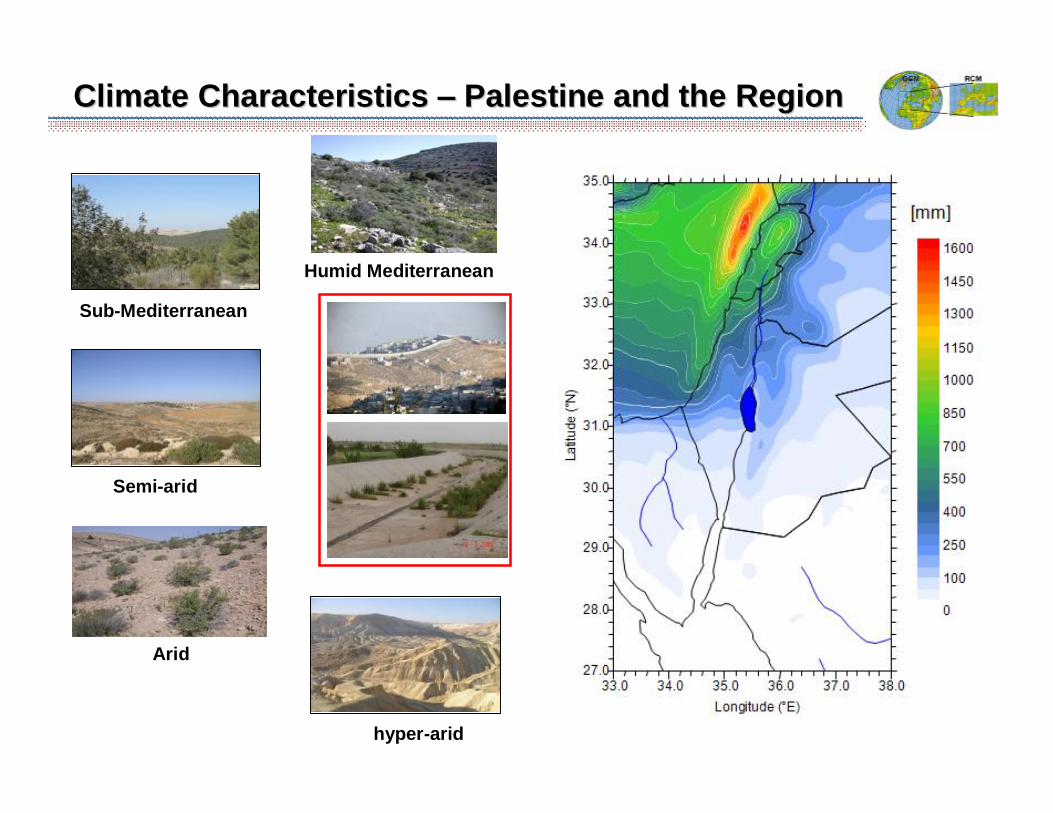
Climate Characteristics Climate Characteristics –– Palestine and the RegionPalestine and the Region
hyper-arid
Semi-arid
Sub-Mediterranean
Humid Mediterranean
Arid
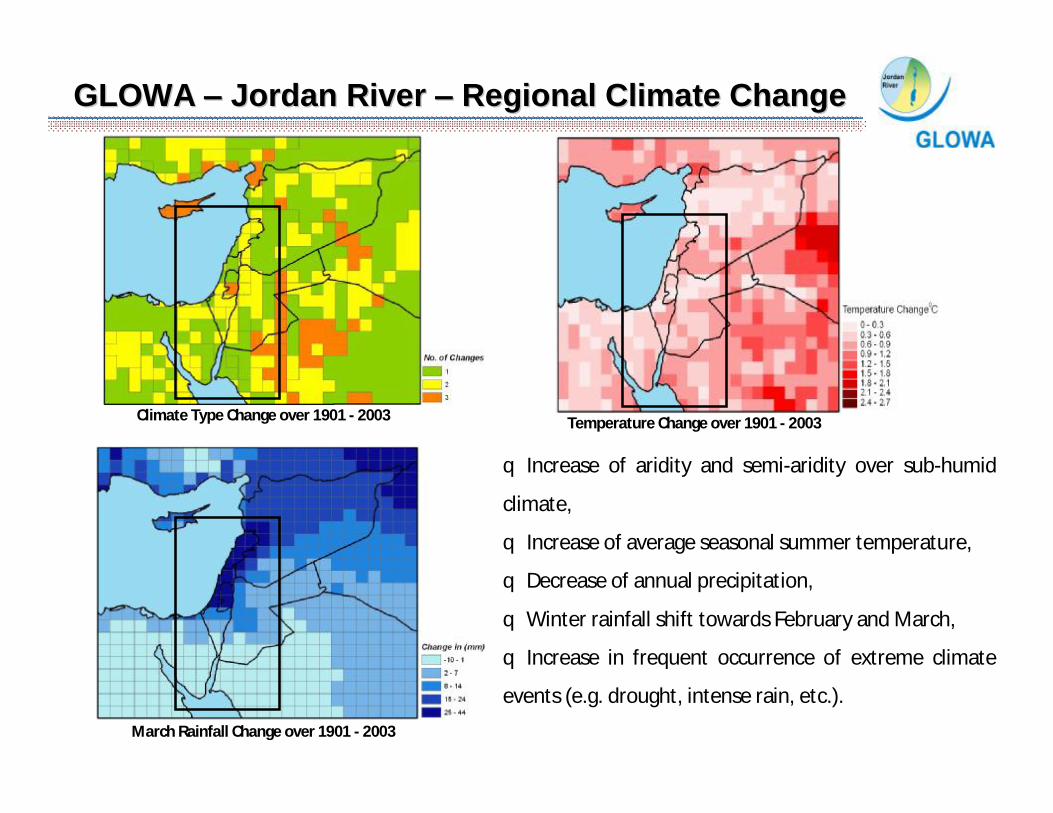
Climate Type Change over 1901 - 2003 Temperature Change over 1901 - 2003
March Rainfall Change over 1901 - 2003
q Increase of aridity and semi-aridity over sub-humid
climate,
q Increase of average seasonal summer temperature,
q Decrease of annual precipitation,
qWinter rainfall shift towards February and March,
q Increase in frequent occurrence of extreme climate
events (e.g. drought, intense rain, etc.).
GLOWA GLOWA –– Jordan River Jordan River –– Regional Climate ChangeRegional Climate Change
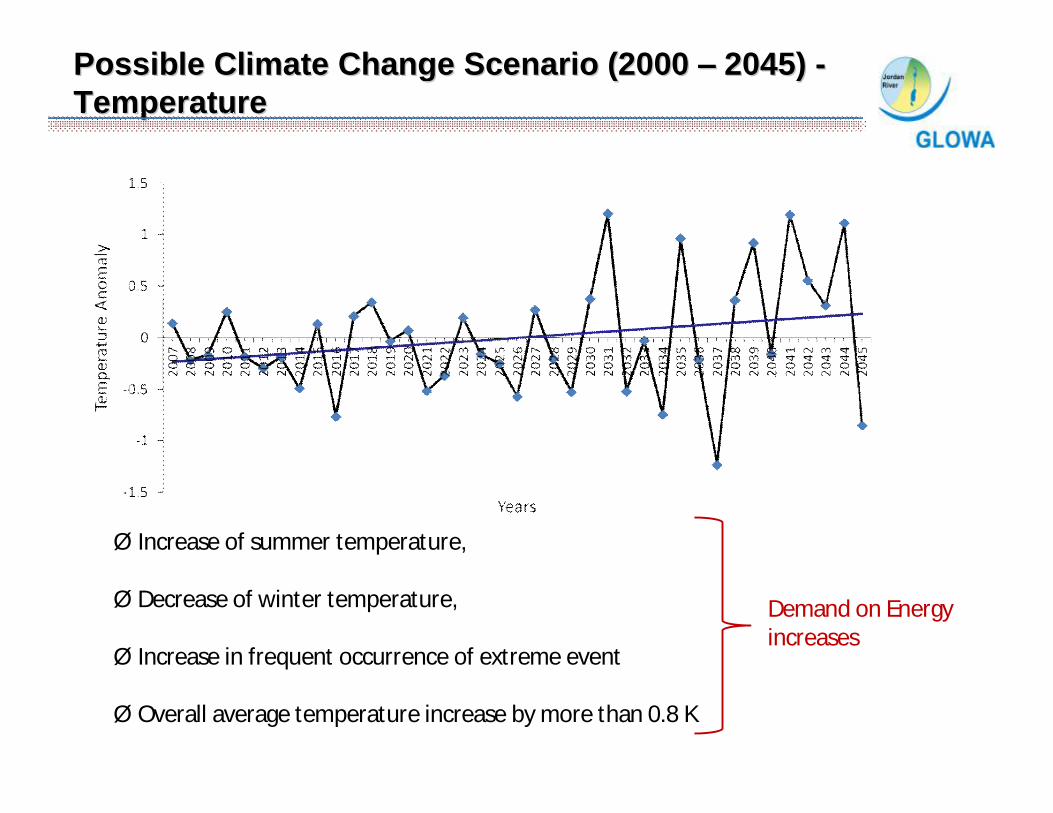
Ø Increase of summer temperature,
Ø Decrease of winter temperature,
Ø Increase in frequent occurrence of extreme event
Ø Overall average temperature increase by more than 0.8 K
Demand on Energy increases
Possible Climate Change Scenario (2000 Possible Climate Change Scenario (2000 –– 2045) 2045) --Temperature Temperature
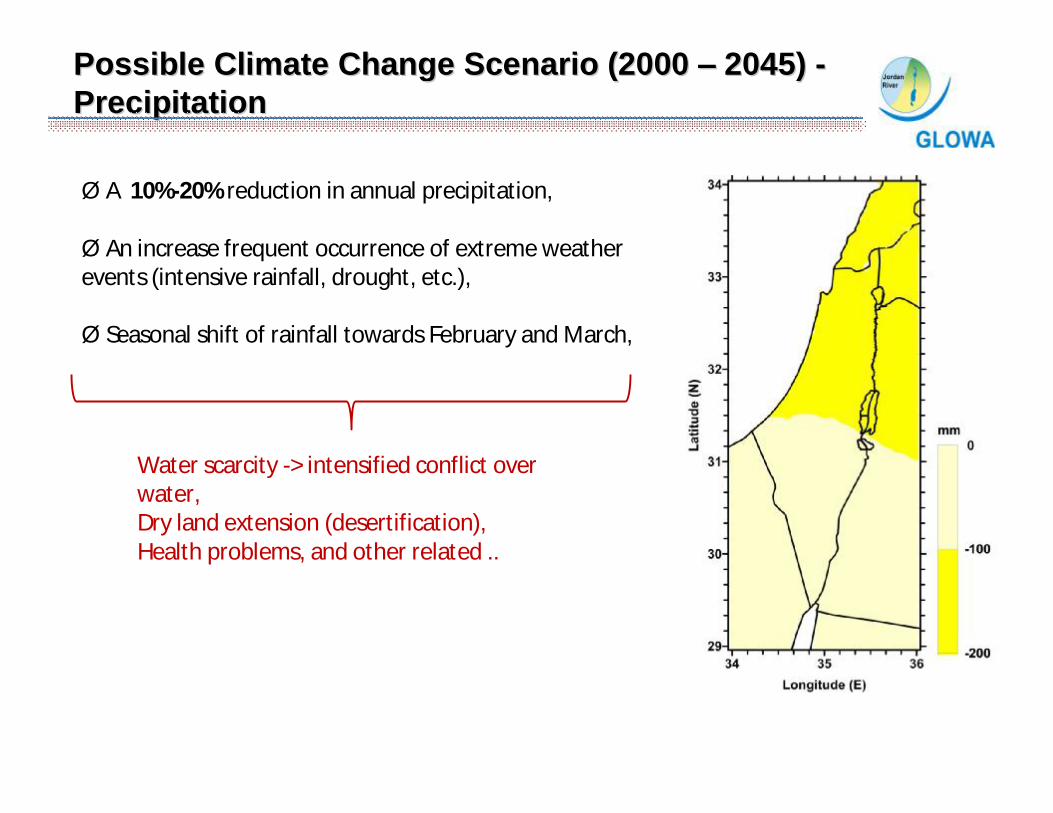
Ø A 10%-20% reduction in annual precipitation,
Ø An increase frequent occurrence of extreme weather events (intensive rainfall, drought, etc.),
Ø Seasonal shift of rainfall towards February and March,
Water scarcity -> intensified conflict over water,Dry land extension (desertification),Health problems, and other related ..
Possible Climate Change Scenario (2000 Possible Climate Change Scenario (2000 –– 2045) 2045) --Precipitation Precipitation

Thanks for your patience
Recommended